functional properties and health benefits of orange … juice • natural source of vitamins and...
TRANSCRIPT

Functional properties and health benefits of orange juice
Thais Cesar, PhD
Pharmaceutical School,
Sao Paulo State University – UNESP
Araraquara SP, Brazil

Orange juice
Functional Properties: 1. Essential nutrients for a healthy diet 2. Protection against cardiovascular disease 3. No association with gain of weight or obesity 4. Decrease of insulin resistance 5. Improvement of antioxidant capacity 6. Decrease of inflammation markers 7. Improves satiety

Orange juice
• Natural source of vitamins and minerals:
Vitamin C, Folic Acid, Potassium
• Easily incorporated into a healthy diet plan
100% fruit juices, as Orange Juice, are associated with a lower BMI and a healthier diet in children and adults
O’Neil et al Nutr Res 2011, Nutr J 2012

0
20
40
60
80
100
kcal Carb Ca K Vit C Folate
Nutritional contribuition
6% 12% 18% 9.6% 100% 12.5%
USDA Nutrient Database (2005 e 2007) release 2.1b
4
% R
DA
- 2
00
0 k
cal d
iet
8 oz of orange juice

Orange juice
• Citrus flavonoids Hesperidin & Naringin 15.6 mg/240mL 1.9 mg/240mL
• Cholesterol-lowering potential in animal
and human
(Kurowska et al, 2000; Roza et al, 2007)

Orange juice and Coronary Heart Disease
6
total Cholesterol and LDL-C
• Naringenin and Hesperitin in vivo
1) activity ACAT1, ACAT2, MTP
2) lipoproteins assembly (VLDL)
3) LDL receptor ( Plasma Clearance of LDL)
(Roza 2007, Wilcox 2001; Borradaile 2002; Aptekman and Cesar, 2010)

Orange juice and Coronary Heart Disease
7
• Clinical study
• Orange Juice: transfer of Cholesterol to HDL in
normolipidemic and hypercholesterolemic individuals (Cesar et al, Nut Res 2010, 30: 689)

Long-term orange juice consumption is associated with low LDL-cholesterol and apolipoprotein B in
normal and moderately hypercholesterolemic subjects
Hypothesis: OJ consumption (≥ 12 months) is associate with low risk factors for CVD in subjects with normal and moderately high cholesterol blood levels.
Aptekmann and Cesar; Lipids in Health and Disease 2013, 12:119 http://www.lipidworld.com/content/12/1/119

Long-term orange juice consumption is associated with low LDL-cholesterol and apolipoprotein B …
Subjects: • employees OJ factory with free daily access to OJ
• 103 men (18–66 y) • 26 women (18–65 y)
OJ Consumption: • 41% = 2 cups (480 mL) OJ/d • 59% = non-consumers

Long-term orange juice consumption is associated with low LDL-cholesterol and apolipoprotein B …
Anthropometric Normolipidemic Hypercholesterolemic
Orange juice Non-consum. Consumers Non-consum. Consumers
Weight (kg) 75.9 11.4 70.8 10.0 78.5 13.8 83.0 10.5
BMI ( kg/m2) 25.1 3.63 23.8 2.89 26.6 2.8 27.0 3.4
Body fat (%) 27.8 5.03 25.1 7.52 28.0 5.7 27.0 4.1
Waist circ.(cm) 90.4 9.96 87.5 9.33 96.3 8.2 97.5 9.3
No differences between OJ consumers and non-consumers

Long-term orange juice consumption is associated with low LDL-cholesterol and apolipoprotein B …
Dietary Normolipidemic Hypercholesterolemic
Orange juice Non-consum. Consumers Non-consum. Consumers
Energy (MJ/d) 11.5 5.04 11.6 2.51 12.0 2.88 11.8 2.0
Carbohydrate (g/d) 327 111 346 113 382 123 367 72
Total fat (g/d) 95 32 99 28 90 38 91 27
Vitamin C (mg/d) 138 115 227 121* 174 120 273 158*
Folate (µg/d) 393 138 500 148* 423 146 538 166*
Increase of Vitamin C (+60%) and Folate (+27%) in OJ consumers

Long-term orange juice consumption is associated with low LDL-cholesterol and apolipoprotein B …
Biochemical Normolipidemic Hypercholesterolemic
Orange juice Non-consumers Consumers Non-consumers Consumers
Triglicerides (mmol/L) 1.15 0.37 1.11 0.55 1.86 0.63 2.16 1.12
Total Cholesterol (mmol/L) 5.08 0.70 4.54 0.78* 6.77 0.41 6.40 0.58*
HDL-C (mmol/L) 1.20 0.29 1.16 0.31 1.14 0.27 1.16 0.23
LDL-C (mmol/L) 3.35 0.61 2.74 0.80* 4.78 0.48 4.20 0.86*
Apo B (g/L) 0.90 0.19 0.79 0.21* 1.27 0.17 1.12 0.17*
Homocysteine (µmol/L) 9.95 2.81 9.17 2.31 11.1 2.53 10.0 2.31
-8% Cholesterol, -15% LDL-C , -14% LDL/HDL , -12% Apo B in OJ consumers

Long-term orange juice consumption is associated with low LDL-cholesterol and apolipoprotein B …
Conclusions OJ consumption was not associated with: • weight, BMI, waist or body fat • blood serum Triglyceride or Homocysteine But, OJ consumption was associated with reduction of: • total cholesterol • LDL-cholesterol • LDL/HDL ratio • apo B

High carbohydrate intake associated with
Insulin Resistance (sub-normal response of Insulin) (NCEP Report, 2004; IDF 2005)
Controversia: Sugar OJ increases the Insulin Resistance? • 1 cup (8 oz) = 22g sugar (sucrose : glucose : fructose/ 2:1:1)
OJ flavonoids • prevent oxidative and inflammatory stress, • safe energy source (Ghanim et al, 2007)
Orange juice
14

Insulin resistance
• IR is commonly associated with obesity and large waist circumference
• Development of IR:
• Pre-condition to Metabolic Syndrome
hyperlipidemia
diabetes mellitus type 2
hypertension
cardiovascular disease

Adipose Tissue:
Release pro-inflammatory mediators: PAI1, TNF-α, IL-6, C-Reactive Protein (CRP)
Free Fat Acids
Oxidative Stress & Adipokines
16
Diabetes
Pro-thrombotic Pro-inflammatory
Metabolic syndrome
(Grundy et al, 2005)
Atherosclerosis

Insulin resistance
Biochemical and
Clinical Charac.
Normal Weight Overweight/Obese
N = 37 N = 28
Orange Juice (750mL/d) 1o day 60o day 1o day 60o day
Glucose mg/dL 79 6.8 79 5.0 80 8.5 81 6.9
Insulin IU/mL 6.8 3.1 5.0 2.3* 8.5 4.3 6.9 3.4*
Insulin Resistance Index 1.3 0.6 1.0 0.5* 1.7 1.0 1.4 0.7*
HOMA index % 26 % 18%
Overall: IR 22 %
Preliminary data, Cesar et al
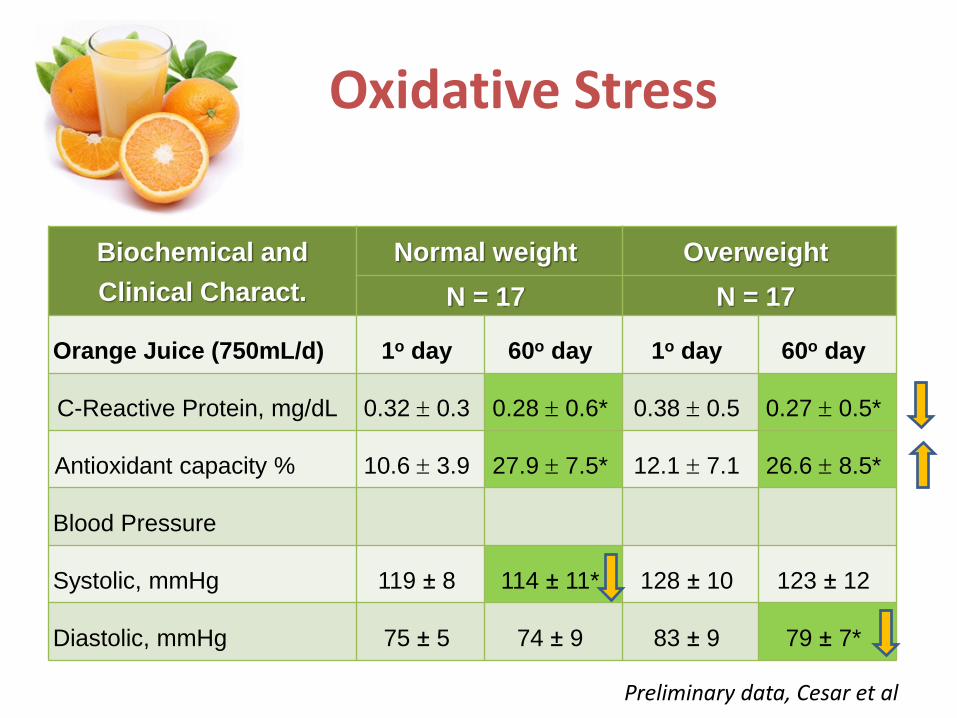
Oxidative Stress
Biochemical and
Clinical Charact.
Normal weight Overweight
N = 17 N = 17
Orange Juice (750mL/d) 1o day 60o day 1o day 60o day
C-Reactive Protein, mg/dL 0.32 0.3 0.28 0.6* 0.38 0.5 0.27 0.5*
Antioxidant capacity % 10.6 3.9 27.9 7.5* 12.1 7.1 26.6 8.5*
Blood Pressure
Systolic, mmHg 119 ± 8 114 ± 11* 128 ± 10 123 ± 12
Diastolic, mmHg 75 ± 5 74 ± 9 83 ± 9 79 ± 7*
Preliminary data, Cesar et al
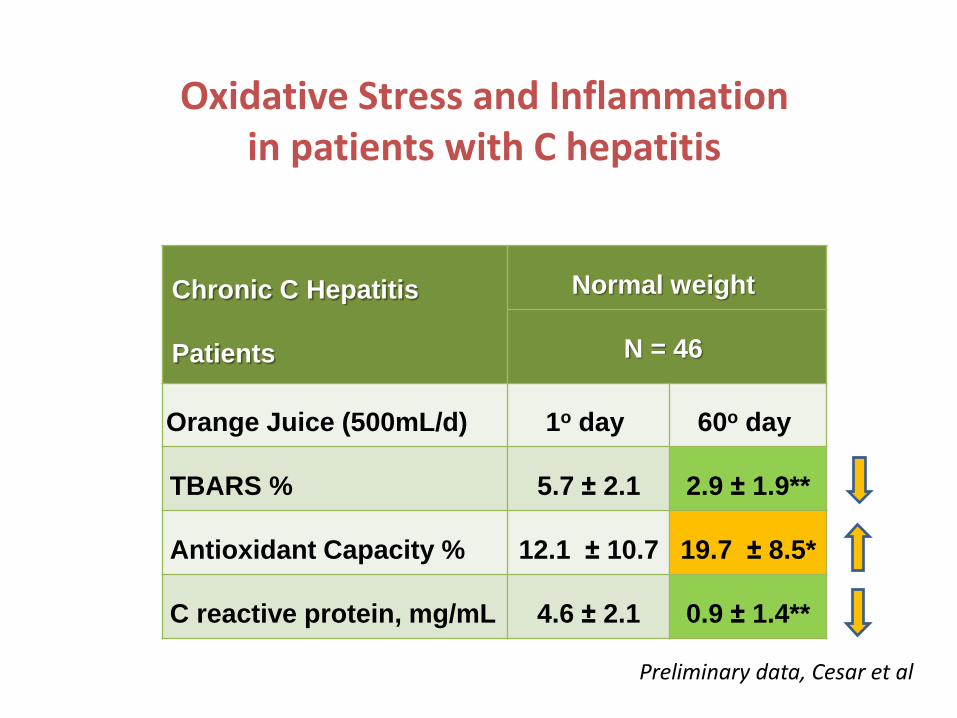
Oxidative Stress and Inflammation in patients with C hepatitis
Chronic C Hepatitis
Patients
Normal weight
N = 46
Orange Juice (500mL/d) 1o day 60o day
TBARS % 5.7 ± 2.1 2.9 ± 1.9**
Antioxidant Capacity % 12.1 ± 10.7 19.7 ± 8.5*
C reactive protein, mg/mL 4.6 ± 2.1 0.9 ± 1.4**
Preliminary data, Cesar et al
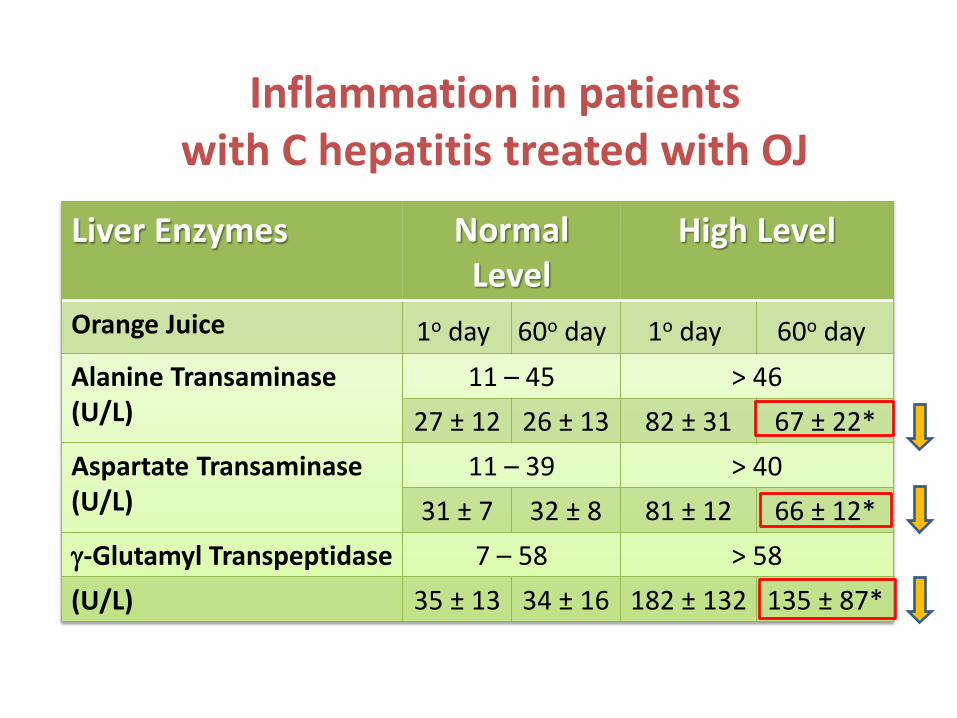
Liver Enzymes Normal Level
High Level
Orange Juice 1o day 60o day 1o day 60o day
Alanine Transaminase (U/L)
11 – 45 > 46
27 ± 12 26 ± 13 82 ± 31 67 ± 22*
Aspartate Transaminase (U/L)
11 – 39 > 40
31 ± 7 32 ± 8 81 ± 12 66 ± 12*
-Glutamyl Transpeptidase 7 – 58 > 58
(U/L) 35 ± 13 34 ± 16 182 ± 132 135 ± 87*
Inflammation in patients with C hepatitis treated with OJ

Fresh or Pasteurized OJ ?
Which one is better?
OJ processing can influence the concentration of citric bioactive
compounds and therefore may affect their bioavailability in human body.
Fresh OJ is perceived as a superior flavor beverage, but pasteurization
process is needed for the consumers safety.

OJ commercially processing
• 8oz fresh OJ: 125mg Vit C and 76µg Folate
• 8oz processed OJ: 86mg Vit C and 46µg Folate
• OJ bioactive compounds and flavonoids:
Can processing methods influence the satiety (appetite) and energy intake?
(Bai, et al, 2010)

Biochemical markers and appetite after acute intake of OJ
• Effect of acute intake of fresh and pasteurized OJ on markers of satiety in individuals with normal weight and overweight.
• Test drink: sugars + H2O
Insulin Glucose
Adiponectin Leptin

Normal Weight Obese
70
80
90
100
110
120
130
140
0 50 100 150 200 250 300
mg/
dL
min
Glucose (BMI < 25kg/m2)
Test
Fresh OJ
Past OJ
70
80
90
100
110
120
130
140
0 50 100 150 200 250 300
mg/
dL
min
Glucose (BMI 25kg/m2) Test
Fresh OJ
Past OJ
0
20
40
60
80
100
120
140
0 50 100 150 200 250 300
µm
ol/
L
min
Insulin (BMI < 25kg/m2) Test
Fresh OJ
Past OJ
0
20
40
60
80
100
120
140
0 50 100 150 200 250 300
µm
ol/
L
min
Insulin (BMI 25kg/m2) Test
Fresh OJ
Past OJ

0
5000
10000
15000
20000
25000
30000
35000
Test Fresh OJ Past OJ Test Fresh OJ Past OJ
0
5000
10000
15000
20000
25000
30000
35000
40000
Test Fresh OJ Past OJ Test Fresh OJ Past OJ
b b
a
B B
B
Glucose (AUC after 300 min)
Insulin (AUC after 300 min)
Normal weight Obese
Normal weight Obese
b
a a,b
A A A

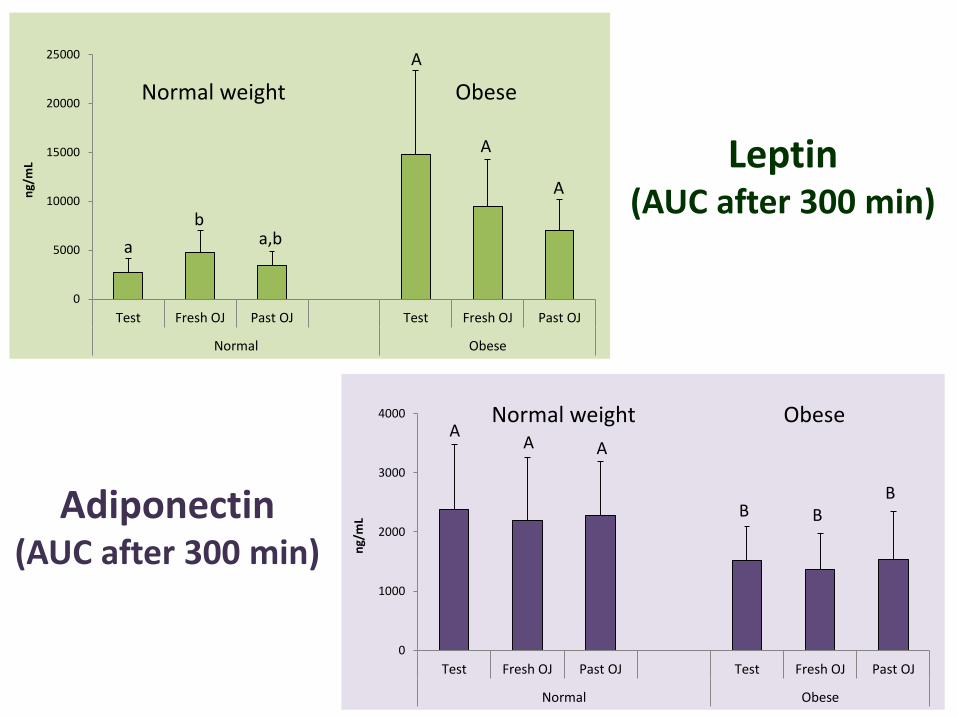
Leptin • appetite stimulators • appetite inhibitors • in the hypothalamic ARC and postsynaptic sites
Adiponectin • Insulin-sensitizing property • Inverse association with IR
and Diabetes (obesity) Leptin
Adipocytes
Energy Expenditure
Appetite
CNTF (cytokine)
Biochemical markers and appetite after acute intake of OJ
satiety
0
5000
10000
15000
20000
25000
Test Fresh OJ Past OJ Test Fresh OJ Past OJ
Normal Obese
ng/
mL
a
b a,b
0
1000
2000
3000
4000
Test Fresh OJ Past OJ Test Fresh OJ Past OJ
Normal Obese
ng/
mL
A
A
B B B
A A A
Normal weight Obese
Normal weight Obese
Leptin (AUC after 300 min)
Adiponectin (AUC after 300 min)
A
Conclusions
Consumption of Orange Juice (long and short-term): • No effect on the Nutritional Status of regular consumers • Reduced markers related to insulin resistance and
cardiovascular disease • Increased the antioxidant capacity • Decrease inflammation markers in blood and liver • Improve the satiety
• Is good for your health!