functional group identification in scanning tunneling microscopy of molecular adsorbates
TRANSCRIPT
Functional Group Identification in Scanning Tunneling Microscopy of MolecularAdsorbates
Donna M. Cyr,† Bhawani Venkataraman, and George W. Flynn*Department of Chemistry and Columbia Radiation Laboratory, Columbia UniVersity,New York, New York 10027
Andrew Black and George M. WhitesidesDepartment of Chemistry, HarVard UniVersity, Cambridge, Massachusetts 02138
ReceiVed: February 29, 1996X
Monolayer films of several primary substituted hydrocarbons CH3(CH2)nCH2X (X ) CH3, OH, NH2, SH, Cl,Br, I; n) 16-30) have been imaged on graphite at the solution-substrate interface using a scanning tunnelingmicroscope (STM). The straight chain hydrocarbons form well-ordered 2-D films on graphite and physisorbwith their molecular axes parallel to the surface. The NH2, SH, Br, and I end groups are observed as brightspots in the STM image corresponding to an enhancement in the tunnel current in the vicinity of the functionalgroup, relative to the remainder of the carbon chain. On the other hand, the OH and Cl substituents were notdistinguishable from the alkyl chain in the STM images. Comparison of the relative “brightness” of thefunctional groups with respect to the carbon chain reveals an empirical relationship between increasing relativebrightness and increasing molecular polarizability. A model is proposed to describe the STM imagingmechanism for these insulating, physisorbed films in which the role of the adsorbate’s polarizability, electronicstructure, and orientation with respect to the surface are considered.
Introduction
The scanning tunneling microscope (STM) is capable ofdirectly imaging with atomic resolution molecules at solution-solid interfaces and has recently been used to identify, possiblywith chemical specificity, molecular adsorbates at interfaces.1-3
Organic molecules, which are generally insulators, are typicallystudied by STM as thin films or as isolated molecules that permitelectrons to flow between the STM tip and an underlyingconductive substrate.2,4-36 Aromatic1,3,5-9 and sulfur1,2 groupsin physisorbed organic thin films display a much larger tunnelcurrent than the remainder of the hydrocarbon molecule andappear as bright spots in the STM image. These “highlighted”functional groups are useful chemical markers that enable themolecular conformation or structure within a film to beinterpreted even when atomic resolution is not achieved.6-8,24,34
In the case of chemisorbed aromatics (e.g., anthracene andnaphthalene) on Pt, the distinct internal structure of theadsorbates observed in the STM images35 allows these structur-ally similar molecules to be identified and distinguished withina mixture. In this case, and others, the shapes of the adsorbatesin the STM images are similar to the shapes of the HOMO(highest occupied molecular orbital) and LUMO (lowest unoc-cupied molecular orbital) of the molecules, suggesting that thefrontier orbitals of these species participate in the tunnelingprocess.1,5,24,25,34,37,38The STM tunneling probability is sensitiveto the local density of states (LDOS) of the sample with energiesclose to the Fermi level and in close spatial proximity to thetip. It is not completely clear how the electronic states ofinsulating molecular adsorbates participate in the tunnelingprocess since the HOMO and LUMO of these molecules lieseveral electronvolts away from the Fermi level of the tip andsurface.39,40 Despite the fact that the tunneling process for
molecular adsorbates is not well understood, STM revealsdetailed information on the molecular structure and dynamicswithin thin films.Strong STM contrast has been observed for the atomic
adsorbate Xe physisorbed on Ni(110). Lang and co-workers41
proposed that the adsorbate image contrast is determined bythe degree to which the adsorbate contributes to the LDOS atthe Fermi level. This interpretation is of interest here becausethe large energy separation between Xe 5p and 6s (the highestoccupied atomic orbital and the lowest unoccupied atomicorbital) places the isolated Xe orbitals several electronvolts awayfrom the Ni Fermi level, an energy separation comparable tothe typical HOMO-LUMO gap of an insulating organicmolecule. Lang’s model of the STM contrast for Xe on Niprovides a framework in which to interpret the STM imagecontrast of physisorbed molecular adsorbates. Other groupshave proposed that molecular states may participate directly inthe tunneling process and can be accessed as intermediates inthe tunneling process.18,25,32 From a different perspective, Spongand co-workers4 propose that the corrugation or contrast ofinsulating molecules in STM images is due to modulation ofthe substrate’s local work function (a modification of the barrierto tunneling) by the presence of the adsorbate. In this picturethe STM simply maps out variations in the transmitted currentthrough the perturbed barrier, thereby making the adsorbate“visible”. Polarizability is one important factor in determiningthe adsorbate’s effect on the surface work function and hencethe adsorbate contrast.42-44 Both benzene and cyclohexane, forexample, have similar polarizabilities and exhibit similar strong(“bright”) contrast in the STM even though their electronicstructures are quite different.4
“Highlighted” functional groups in STM images of physi-sorbed hydrocarbon films, such as aromatic and sulfur groups,are unlikely to be unique. In this paper we survey the relative“brightness” of several functional groups (-CH3, -OH, -Cl,-NH2, -SH, -Br, -I) attached to long chain hydrocarbons
† Marie Curie Postdoctoral Fellow sponsored by the American Associa-tion of University Women.
X Abstract published inAdVance ACS Abstracts,June 1, 1996.
13747J. Phys. Chem.1996,100,13747-13759
S0022-3654(96)00646-6 CCC: $12.00 © 1996 American Chemical Society
physisorbed on graphite in order to identify other brightfunctional groups. Additionally, we attempt to correlate varia-tions in the functional group brightness with physical propertiesof the adsorbates. The empirical trends in the image contrastare discussed in the context of the proposed imaging mecha-nisms involving the role of the sample’s LDOS and polariz-ability, respectively. Additionally, the discovery of “high-lighted” functional groups in STM images may identifypotentially useful markers for interpreting structure in STMimages of more complex molecular systems.
Experimental Section
A Digital Instruments Nanoscope III scanning tunnelingmicroscope was employed to investigate functionalized hydro-carbon films physisorbed on graphite at the solution/solidinterface. 1-Chlorooctadecane (CH3(CH2)17Cl), 1-bromo-docosane (CH3(CH2)21Br), 1-iodooctadecane (CH3(CH2)17I),1-triacontanol (CH3(CH2)29OH), triacontane (CH3(CH2)28CH3),and 1-octadecylamine (CH3(CH2)17NH2) were obtained fromAldrich and used without further purification. The 1-docosane-thiol (CH3(CH2)21SH) was synthesized as described elsewhere.45
Nearly saturated solutions of these compounds were made in aphenyloctane solvent with the exception of chlorooctadecane(a liquid at room temperature), which was applied directly tothe graphite surface. The phenyloctane was purged with N2 toremove any residual oxygen dissolved in the solvent prior topreparing the solutions. A drop (∼10 µL) of solution wasdeposited on a freshly cleaved piece of highly ordered pyrolyticgraphite (HOPG, from Advanced Ceramics Corp.). All theimages were collected under ambient conditions at temperaturesbetween 19 and 23°C. The STM tips were mechanicallyclipped from a 0.01 in. Pt/Rh (87/13) wire (Omega) usingdiagonal cutters. Once the sample was mounted, the STM tipwas immersed into the liquid droplet and the images wereobtained under the solution. The typical range of tunnelingconditions used for this group of samples was 1200-1600 mV(sample negative) and 80-400 pA with the STM operating ineither the constant current or constant height modes. Under
these conditions the tip-surface separation is much larger thanwhen imaging the bare graphite surface (∼50 mV and 1 nA).In some cases the images were subjected to a single low passfilter. Each of the images presented here is representative ofseveral images taken at different times to ensure reproducibility.Space-filling molecular models (shown in the figures with
85% van der Waals radii) were constructed using Macromodel,46
a molecular mechanics software package. Models of thehydrocarbon films were created with the molecules in anorientation consistent with the STM images. The molecularfilm was then docked onto a graphite “slab”, simulating theHOPG surface, and subsequently subjected to energy minimiza-tion using an AMBER force field.47 The resulting adsorbate/substrate model structures have many degrees of freedom andmay not correspond to the lowest energy configurations;however, they provide a representation of the adsorbate filmsconsistent with the STM images.
Results
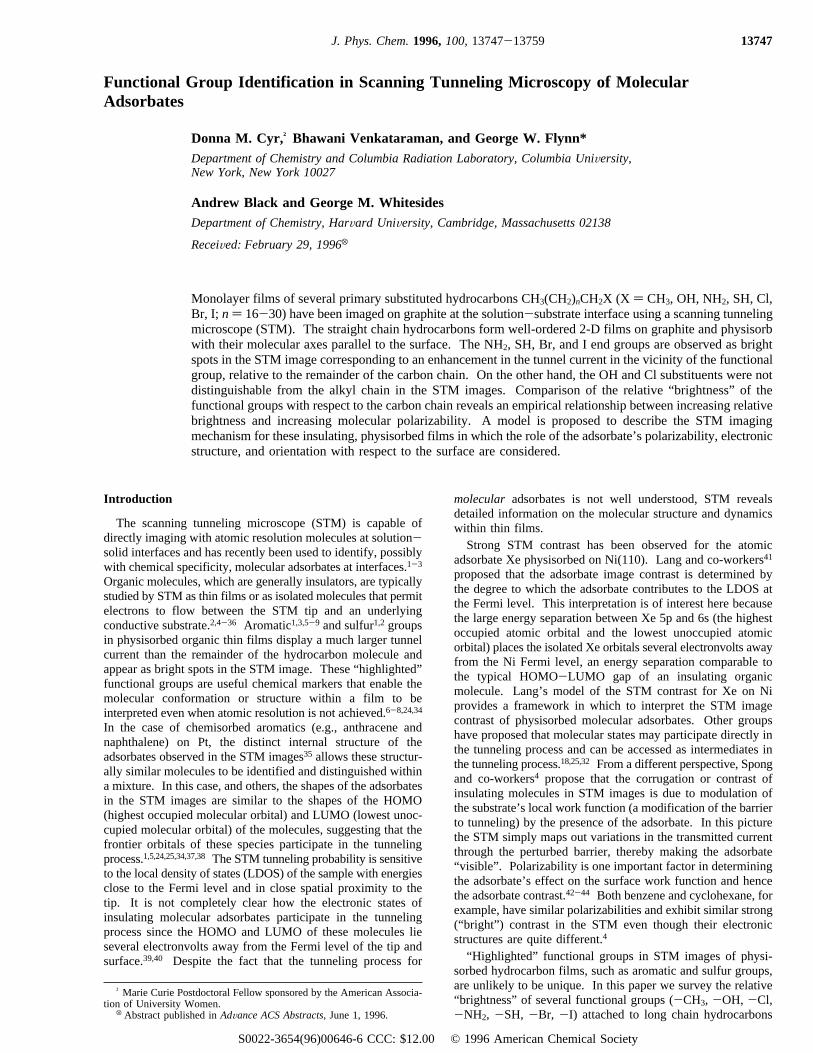
Alkanes and Alcohols. Long chain alkanes and alcoholswere some of the first hydrocarbons to be imaged at the solution/solid interface since they form well-ordered films on graphitenear room temperature.10-12,23,30 The images of these moleculesare presented again here for comparison to the STM images offilms with other functional end groups. An STM image of atriacontane (C30H62) film physisorbed on graphite is shown inFigure 1a. One molecular length is indicated by a black bar inthe image. The molecules appear to be fully extended,indicating an all-trans conformation along the hydrocarbonbackbone. Straight chain alkanes on graphite are generallycharacterized by a 90° angle between the molecular axis andthe direction of the rows or lamellae, as shown in the model inFigure 1b. This packing orientation maximizes the interactionsbetween the hydrocarbon chains, thereby stabilizing the film.Additionally, the graphite substrate acts as a template forformation of the hydrocarbon film in which the hydrogens ofthe alkyl chains are believed to reside in the hollow sites of thegraphite lattice. The good lattice match between the alkyl
Figure 1. (a) STM image of triacontane (C30H62) in phenyloctane physisorbed on graphite. One molecular length is represented by a black bar.The molecules are oriented with a 90° angle between the molecular axis and the direction of the lamellae. The 20 nm2 image was obtained witha 1235 mV bias (sample negative) and a 166 pA set point in constant height mode. (b) Computer-generated model of an all-trans alkane film ona graphite substrate.
13748 J. Phys. Chem., Vol. 100, No. 32, 1996 Cyr et al.
backbone and the graphite lattice favors commensurate packingof the hydrocarbon film with the underlying substrate.10,48-50
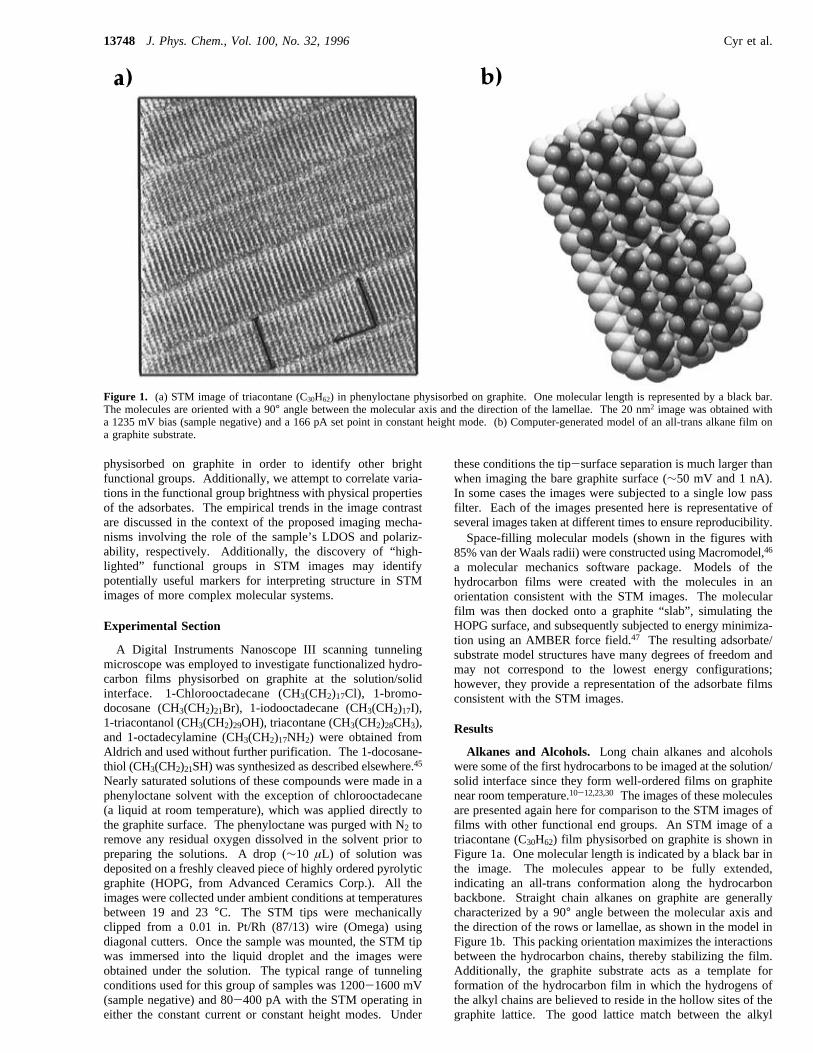
Two domains are observed in the image of triacontanol(C30H61OH) on graphite which appear to follow the latticedirections of the underyling graphite surface. The C30H61OHfilm on graphite is characterized by a 60° angle between themolecular axis and the direction of the lamellae (Figure 2a).The relative orientation of the alcohol molecules is defined bythe hydrogen-bonding network in the film, in contrast to the90° angle observed for the alkanes in which no hydrogenbonding can occur. Hydrogen bonding requires that the OHgroups of molecules in adjacent rows lie “head to head” in thefilm, as shown in Figure 2b. Similar STM contrast is observedover the entire molecule in most of our images of alcohol films,although in some instances one or both ends of the moleculesappear brighter than the central portion of the alkyl chain. Fromour images it is not apparent that the STM is “sensitive enough”to distinguish the OH end group from the remainder of thehydrocarbon backbone in the images of these molecules.Similar contrast features have been reported by Elbel et al. forthe alcohols on graphite.51 In mixtures, the alcohols and thealkanes tend to segregate into separate domains on the surfaceand have been differentiated in mixtures by their respective,functionally specific packing orientations. These individualsystems have been described in more detail elsewhere.10
Sulfur. Functional group specificity has recently beenobserved for several sulfur-containing hydrocarbons: 1-doco-sanethiol (CH3(CH2)21SH),2 docosane disulfide (CH3(CH2)21-SS(CH2)21CH3),2,52 octadecyl sulfide CH3(CH2)17S(CH2)17-CH3),52 and dihexadecyl disulfide (CH3(CH2)15SS(CH2)15CH3).1
In the STM images of these molecules an enhancement in thetunnel current is observed in the vicinity of the sulfur group.An STM image of 1-docosanethiol (CH3(CH2)21SH) on graphiteis shown in Figure 3a. The bright spots in the image of thethiol correspond to an increase in the tunnel current in thevicinity of the SH end group, while the C22 alkyl chain isobserved as a thin band of darker contrast. In this image the
molecules appear to be lying flat with their molecular axisparallel to the graphite surface. The thiol molecules liepreferentially “head to head” (the SH groups facing each other),while a few lie “head to tail” (SH group to CH3 terminatedend), as shown in the computer model of a thiol film on graphitein Figure 3b. The thiols appear to pack with a 90° anglebetween the molecular axis and the direction of the row, similarto the alkane films (see Figure 1a), indicating that the SH‚‚‚Sinteraction in the thiol film is much weaker than the OH‚‚‚Ohydrogen bond in the alcohol film. The enhanced tunnelingassociated with the thiols has also been reported for aromaticgroups in thin molecular films, although sulfur is one of thefirst “atomic” functionalities observed with this property in aphysisorbed organic film. Elemental specificity has beenobserved recently for STM images of clean semiconductor alloysurfaces (InGaAs and GaAsP).53
Amines. In an attempt to search for other functional groupswhich may be distinguishable with the STM, we examined filmsof octadecylamine (CH3(CH2)17NH2) on graphite, as shown inFigure 4a. Like many other hydrocarbons on graphite, the aminemolecules orient parallel to each other in well-ordered rows,creating a 2-D crystalline film. The length of one molecule(indicated by a black bar) agrees well with the expected lengthfor a fully extended, all-trans conformation and indicates thatthe molecules lie flat with their molecular axis parallel to thegraphite surface. The angle between the molecular axis of theamines and the direction of the lamellae is about 60°. This isreminiscent of the molecular orientation observed for the alcoholfilms presented in Figure 2a. The amines in nonpolar solventssuch as phenyloctane, like the alcohols, form a hydrogen-bonding network which defines the molecular orientation withinthe monolayer.Unlike the alcohols, one end of the CH3(CH2)17NH2molecule
is observed to have a “brighter” contrast than the rest of theC18 alkyl chain. Presumably, the bright ends of the moleculesmark the location of the NH2 groups. NH2 groups appear tobe paired in a “head to head” orientation, thereby creating a
Figure 2. (a) STM image of triacontanol (CH3(CH2)29OH) in phenyloctane on graphite. One molecular length is indicated by a black bar. Themolecules are oriented with a 60° angle between the molecular axis and the direction of the lamellae, as indicated on the image. The 20 nm2 imagewas obtained with a 1400 mV bias (sample negative) and an 80.0 pA set point in constant current mode. (b) Top view of a computer-generatedmodel of an alcohol film on graphite. The hydrogen bonding of the alcohols within the film requires the OH groups of the molecules in adjacentrows to lie “head to head”. (c) Side view of the model shown in b showing that the OH groups lie in the plane of the film.
STM of Molecular Adsorbates J. Phys. Chem., Vol. 100, No. 32, 199613749

bright “center line” joining the molecules in the paired rows(marked byf in Figure 4a). The other end of the moleculehas the same contrast as the rest of the alkyl chain and isseparated from the adjacent row by a deep trough (marked byw). A “head to head” orientation is also necessary for hydrogenbonding between molecules within the film, and a modelconsistent with these observations is presented in Figure 4b.The image of the amines (Figure 4a) also displays an intensity
variation in the “background” contrast from dark to bright, or
a moirepattern, which appears with a repeat over about four tofive molecules. This type of contrast variation has beenobserved in other films such as carboxylic acids on graphite12
and has been attributed to a molecular film which is incom-mensurate with the underlying graphite lattice. Incommensuratepacking of the film may occur if the intermolecular interactions(van der Waals and electrostatic forces) between functionalizedhydrocarbons within the film are stronger than the molecule-surface interactions which lead to commensurate packing. The
Figure 3. (a) STM image of 1-docosanethiol (CH3(CH2)21SH) in phenyloctane on graphite. One molecular length is indicated by a black bar. Theimage is dominated by bright spots which indicate the positions of the SH groups. The 20 nm2 image was obtained with a 1550 mV bias (samplenegative) and a 150.0 pA set point in constant current mode. (b) Top view of a computer-generated model of a thiol film on a graphite substrate.The SH groups are preferentially oriented “head to head” but occasionally orient “head to tail”.
Figure 4. (a) An STM image of 1-octadecylamine (CH3(CH2)17NH2) in phenyloctane on graphite. One molecular length is indicated by a blackbar. The angle between the molecular axis and the direction of the lamellae is 60°. The rows of molecules appear to be paired with the positionof the NH2 groups observed as a bright line (indicated byf). The rows of molecules are separated by deep troughs (indicated byw). The 20 nm2
image was obtained with a 1500 mV bias (sample negative) and a 150.0 pA set point in constant current mode. (b) Top view of computer-generated model of an amine film on a graphite substrate. Hydrogen bonding between the amine groups in the film defines the molecular orientation.(c) Side view of the model in b, showing that the lone pair of the amine N atom points out of the film in this structure. This is in contrast to theorientation of OH groups, which lie in the plane of the alcohol film shown in Figure 2c.
13750 J. Phys. Chem., Vol. 100, No. 32, 1996 Cyr et al.
contrast variation appears to be most pronounced when there isa mismatch between the substrate surface and the films alongboth unit vectors of the substrate lattice and indicates that theSTM is sensitive to contributions from both the substrate andthe molecular overlayer. In fact the moire´ pattern has recentlybeen used to determine the relative orientation of the adsorbatemolecules with respect to the surface with high resolution.54
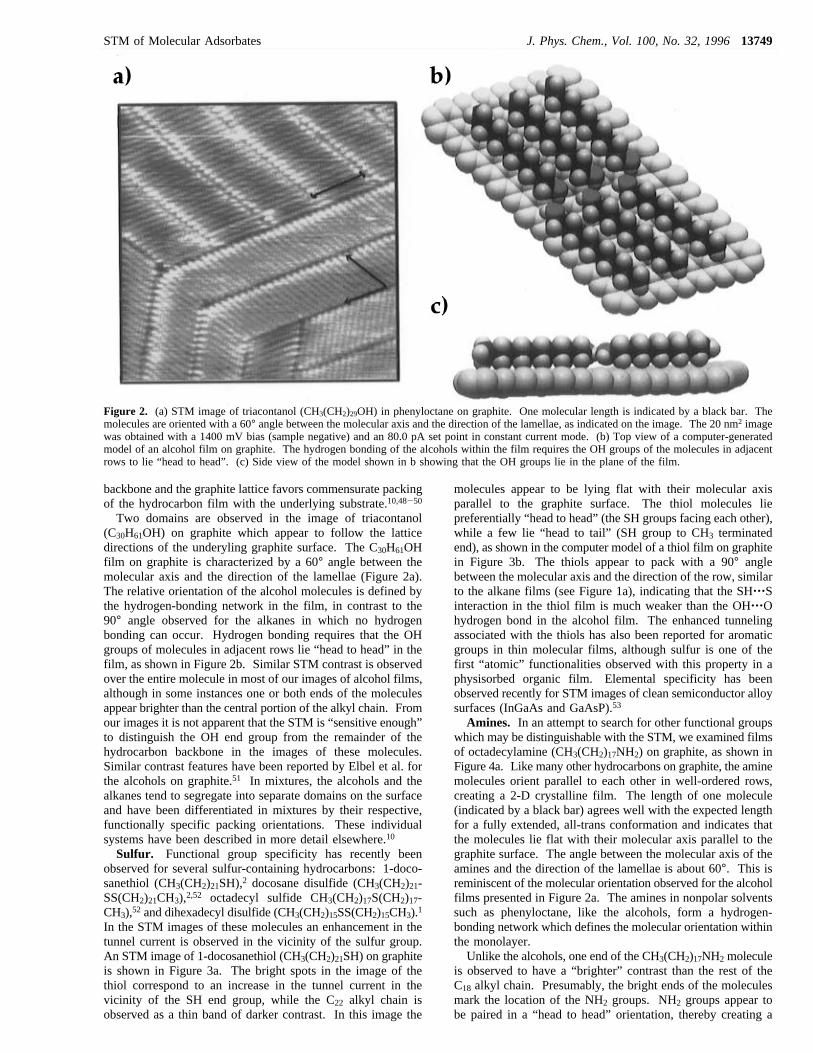
Halogens. Halogen-containing hydrocarbons are a conve-nient set of molecules in which to survey trends in the imagecontrast since the trends in physical properties of these moleculesare well-defined. We have previously investigated octadecylchloride (CH3(CH2)17Cl) on graphite,2 as shown in Figure 5.The molecular axis of the chlorides appears to form a 90° anglewith the direction of the rows or lamellae, and these moleculeshave an image similar in appearance to that of the alkanes(Figure 1a). In this case the location of the chlorine atom couldnot be discerned from the STM images since similar contrastis observed on both ends of the molecule.An STM image of 1-bromodocosane CH3(CH2)21Br film on
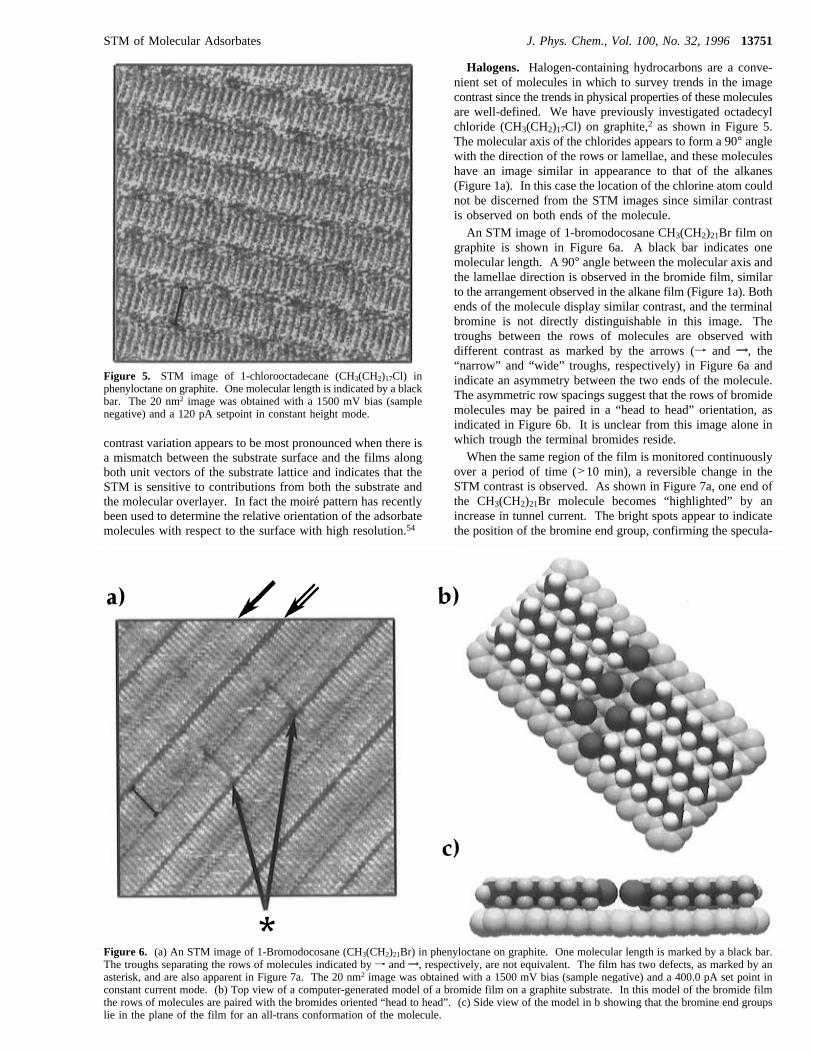
graphite is shown in Figure 6a. A black bar indicates onemolecular length. A 90° angle between the molecular axis andthe lamellae direction is observed in the bromide film, similarto the arrangement observed in the alkane film (Figure 1a). Bothends of the molecule display similar contrast, and the terminalbromine is not directly distinguishable in this image. Thetroughs between the rows of molecules are observed withdifferent contrast as marked by the arrows (f and w, the“narrow” and “wide” troughs, respectively) in Figure 6a andindicate an asymmetry between the two ends of the molecule.The asymmetric row spacings suggest that the rows of bromidemolecules may be paired in a “head to head” orientation, asindicated in Figure 6b. It is unclear from this image alone inwhich trough the terminal bromides reside.When the same region of the film is monitored continuously
over a period of time (>10 min), a reversible change in theSTM contrast is observed. As shown in Figure 7a, one end ofthe CH3(CH2)21Br molecule becomes “highlighted” by anincrease in tunnel current. The bright spots appear to indicatethe position of the bromine end group, confirming the specula-
Figure 5. STM image of 1-chlorooctadecane (CH3(CH2)17Cl) inphenyloctane on graphite. One molecular length is indicated by a blackbar. The 20 nm2 image was obtained with a 1500 mV bias (samplenegative) and a 120 pA setpoint in constant height mode.
Figure 6. (a) An STM image of 1-Bromodocosane (CH3(CH2)21Br) in phenyloctane on graphite. One molecular length is marked by a black bar.The troughs separating the rows of molecules indicated byf andw, respectively, are not equivalent. The film has two defects, as marked by anasterisk, and are also apparent in Figure 7a. The 20 nm2 image was obtained with a 1500 mV bias (sample negative) and a 400.0 pA set point inconstant current mode. (b) Top view of a computer-generated model of a bromide film on a graphite substrate. In this model of the bromide filmthe rows of molecules are paired with the bromides oriented “head to head”. (c) Side view of the model in b showing that the bromine end groupslie in the plane of the film for an all-trans conformation of the molecule.
STM of Molecular Adsorbates J. Phys. Chem., Vol. 100, No. 32, 199613751
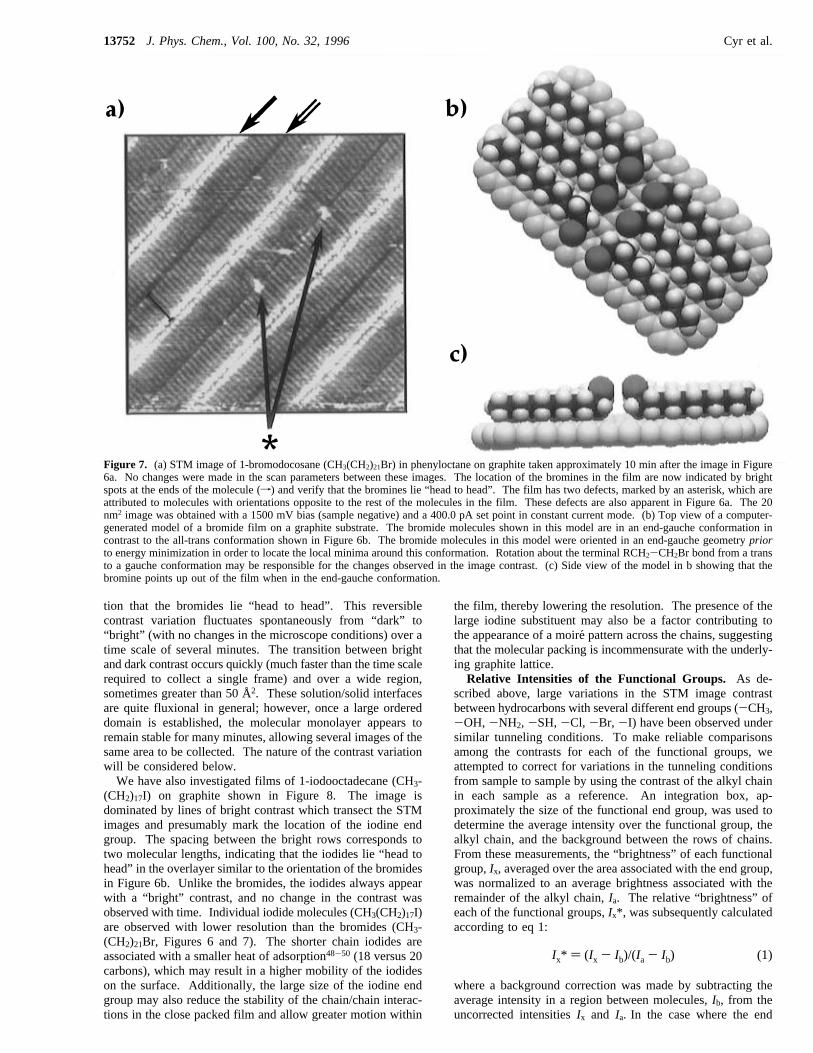
tion that the bromides lie “head to head”. This reversiblecontrast variation fluctuates spontaneously from “dark” to“bright” (with no changes in the microscope conditions) over atime scale of several minutes. The transition between brightand dark contrast occurs quickly (much faster than the time scalerequired to collect a single frame) and over a wide region,sometimes greater than 50 Å2. These solution/solid interfacesare quite fluxional in general; however, once a large ordereddomain is established, the molecular monolayer appears toremain stable for many minutes, allowing several images of thesame area to be collected. The nature of the contrast variationwill be considered below.We have also investigated films of 1-iodooctadecane (CH3-
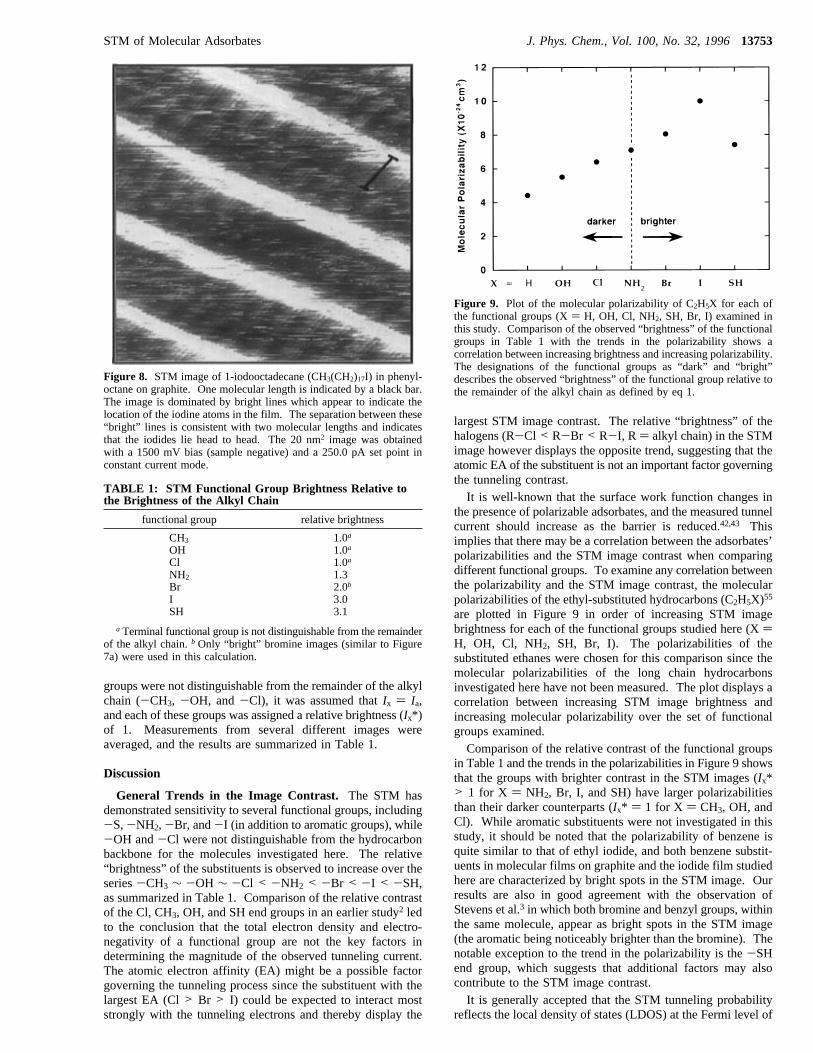
(CH2)17I) on graphite shown in Figure 8. The image isdominated by lines of bright contrast which transect the STMimages and presumably mark the location of the iodine endgroup. The spacing between the bright rows corresponds totwo molecular lengths, indicating that the iodides lie “head tohead” in the overlayer similar to the orientation of the bromidesin Figure 6b. Unlike the bromides, the iodides always appearwith a “bright” contrast, and no change in the contrast wasobserved with time. Individual iodide molecules (CH3(CH2)17I)are observed with lower resolution than the bromides (CH3-(CH2)21Br, Figures 6 and 7). The shorter chain iodides areassociated with a smaller heat of adsorption48-50 (18 versus 20carbons), which may result in a higher mobility of the iodideson the surface. Additionally, the large size of the iodine endgroup may also reduce the stability of the chain/chain interac-tions in the close packed film and allow greater motion within
the film, thereby lowering the resolution. The presence of thelarge iodine substituent may also be a factor contributing tothe appearance of a moire´ pattern across the chains, suggestingthat the molecular packing is incommensurate with the underly-ing graphite lattice.Relative Intensities of the Functional Groups. As de-
scribed above, large variations in the STM image contrastbetween hydrocarbons with several different end groups (-CH3,-OH,-NH2, -SH,-Cl, -Br, -I) have been observed undersimilar tunneling conditions. To make reliable comparisonsamong the contrasts for each of the functional groups, weattempted to correct for variations in the tunneling conditionsfrom sample to sample by using the contrast of the alkyl chainin each sample as a reference. An integration box, ap-proximately the size of the functional end group, was used todetermine the average intensity over the functional group, thealkyl chain, and the background between the rows of chains.From these measurements, the “brightness” of each functionalgroup,Ix, averaged over the area associated with the end group,was normalized to an average brightness associated with theremainder of the alkyl chain,Ia. The relative “brightness” ofeach of the functional groups,Ix*, was subsequently calculatedaccording to eq 1:
where a background correction was made by subtracting theaverage intensity in a region between molecules,Ib, from theuncorrected intensitiesIx and Ia. In the case where the end
Figure 7. (a) STM image of 1-bromodocosane (CH3(CH2)21Br) in phenyloctane on graphite taken approximately 10 min after the image in Figure6a. No changes were made in the scan parameters between these images. The location of the bromines in the film are now indicated by brightspots at the ends of the molecule (f) and verify that the bromines lie “head to head”. The film has two defects, marked by an asterisk, which areattributed to molecules with orientations opposite to the rest of the molecules in the film. These defects are also apparent in Figure 6a. The 20nm2 image was obtained with a 1500 mV bias (sample negative) and a 400.0 pA set point in constant current mode. (b) Top view of a computer-generated model of a bromide film on a graphite substrate. The bromide molecules shown in this model are in an end-gauche conformation incontrast to the all-trans conformation shown in Figure 6b. The bromide molecules in this model were oriented in an end-gauche geometrypriorto energy minimization in order to locate the local minima around this conformation. Rotation about the terminal RCH2-CH2Br bond from a transto a gauche conformation may be responsible for the changes observed in the image contrast. (c) Side view of the model in b showing that thebromine points up out of the film when in the end-gauche conformation.
Ix* ) (Ix - Ib)/(Ia - Ib) (1)
13752 J. Phys. Chem., Vol. 100, No. 32, 1996 Cyr et al.
groups were not distinguishable from the remainder of the alkylchain (-CH3, -OH, and-Cl), it was assumed thatIx ) Ia,and each of these groups was assigned a relative brightness (Ix*)of 1. Measurements from several different images wereaveraged, and the results are summarized in Table 1.
Discussion
General Trends in the Image Contrast. The STM hasdemonstrated sensitivity to several functional groups, including-S,-NH2,-Br, and-I (in addition to aromatic groups), while-OH and-Cl were not distinguishable from the hydrocarbonbackbone for the molecules investigated here. The relative“brightness” of the substituents is observed to increase over theseries-CH3 ∼ -OH ∼ -Cl < -NH2 < -Br < -I < -SH,as summarized in Table 1. Comparison of the relative contrastof the Cl, CH3, OH, and SH end groups in an earlier study2 ledto the conclusion that the total electron density and electro-negativity of a functional group are not the key factors indetermining the magnitude of the observed tunneling current.The atomic electron affinity (EA) might be a possible factorgoverning the tunneling process since the substituent with thelargest EA (Cl> Br > I) could be expected to interact moststrongly with the tunneling electrons and thereby display the
largest STM image contrast. The relative “brightness” of thehalogens (R-Cl < R-Br < R-I, R ) alkyl chain) in the STMimage however displays the opposite trend, suggesting that theatomic EA of the substituent is not an important factor governingthe tunneling contrast.It is well-known that the surface work function changes in
the presence of polarizable adsorbates, and the measured tunnelcurrent should increase as the barrier is reduced.42,43 Thisimplies that there may be a correlation between the adsorbates’polarizabilities and the STM image contrast when comparingdifferent functional groups. To examine any correlation betweenthe polarizability and the STM image contrast, the molecularpolarizabilities of the ethyl-substituted hydrocarbons (C2H5X)55
are plotted in Figure 9 in order of increasing STM imagebrightness for each of the functional groups studied here (X)H, OH, Cl, NH2, SH, Br, I). The polarizabilities of thesubstituted ethanes were chosen for this comparison since themolecular polarizabilities of the long chain hydrocarbonsinvestigated here have not been measured. The plot displays acorrelation between increasing STM image brightness andincreasing molecular polarizability over the set of functionalgroups examined.Comparison of the relative contrast of the functional groups
in Table 1 and the trends in the polarizabilities in Figure 9 showsthat the groups with brighter contrast in the STM images (Ix*> 1 for X ) NH2, Br, I, and SH) have larger polarizabilitiesthan their darker counterparts (Ix* ) 1 for X ) CH3, OH, andCl). While aromatic substituents were not investigated in thisstudy, it should be noted that the polarizability of benzene isquite similar to that of ethyl iodide, and both benzene substit-uents in molecular films on graphite and the iodide film studiedhere are characterized by bright spots in the STM image. Ourresults are also in good agreement with the observation ofStevens et al.3 in which both bromine and benzyl groups, withinthe same molecule, appear as bright spots in the STM image(the aromatic being noticeably brighter than the bromine). Thenotable exception to the trend in the polarizability is the-SHend group, which suggests that additional factors may alsocontribute to the STM image contrast.It is generally accepted that the STM tunneling probability
reflects the local density of states (LDOS) at the Fermi level of
Figure 8. STM image of 1-iodooctadecane (CH3(CH2)17I) in phenyl-octane on graphite. One molecular length is indicated by a black bar.The image is dominated by bright lines which appear to indicate thelocation of the iodine atoms in the film. The separation between these“bright” lines is consistent with two molecular lengths and indicatesthat the iodides lie head to head. The 20 nm2 image was obtainedwith a 1500 mV bias (sample negative) and a 250.0 pA set point inconstant current mode.
TABLE 1: STM Functional Group Brightness Relative tothe Brightness of the Alkyl Chain
functional group relative brightness
CH3 1.0a
OH 1.0a
Cl 1.0a
NH2 1.3Br 2.0b
I 3.0SH 3.1
a Terminal functional group is not distinguishable from the remainderof the alkyl chain.bOnly “bright” bromine images (similar to Figure7a) were used in this calculation.
Figure 9. Plot of the molecular polarizability of C2H5X for each ofthe functional groups (X) H, OH, Cl, NH2, SH, Br, I) examined inthis study. Comparison of the observed “brightness” of the functionalgroups in Table 1 with the trends in the polarizability shows acorrelation between increasing brightness and increasing polarizability.The designations of the functional groups as “dark” and “bright”describes the observed “brightness” of the functional group relative tothe remainder of the alkyl chain as defined by eq 1.
STM of Molecular Adsorbates J. Phys. Chem., Vol. 100, No. 32, 199613753
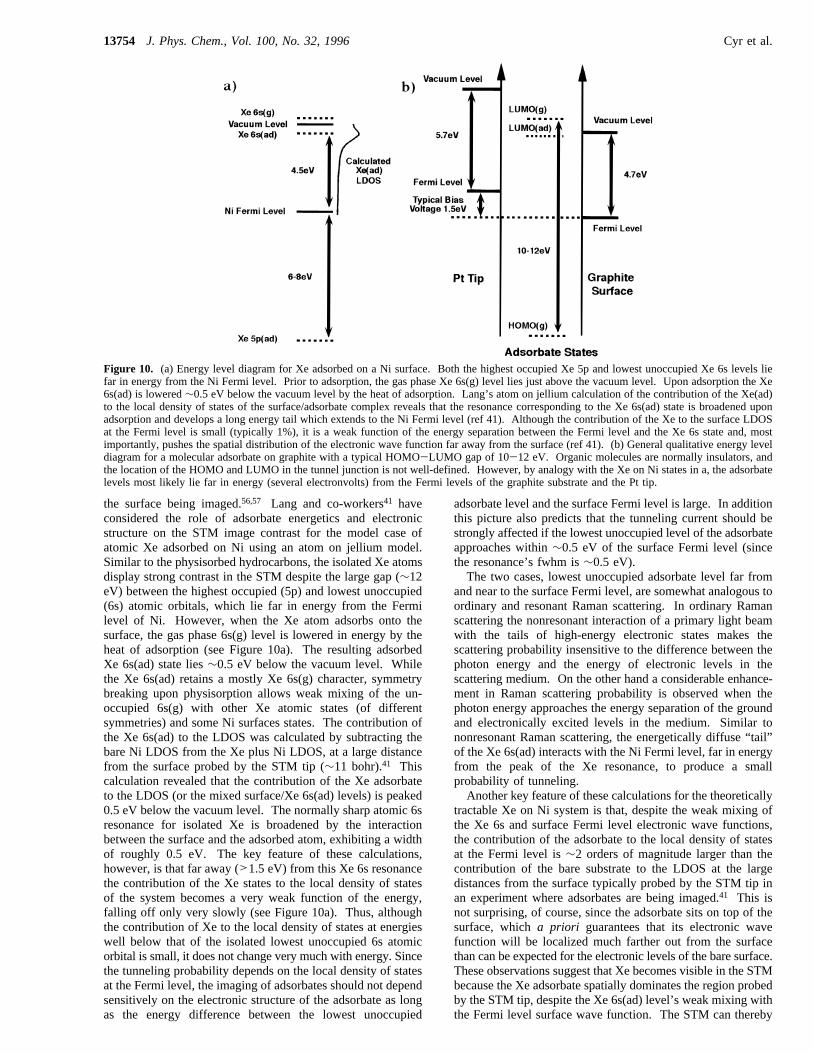
the surface being imaged.56,57 Lang and co-workers41 haveconsidered the role of adsorbate energetics and electronicstructure on the STM image contrast for the model case ofatomic Xe adsorbed on Ni using an atom on jellium model.Similar to the physisorbed hydrocarbons, the isolated Xe atomsdisplay strong contrast in the STM despite the large gap (∼12eV) between the highest occupied (5p) and lowest unoccupied(6s) atomic orbitals, which lie far in energy from the Fermilevel of Ni. However, when the Xe atom adsorbs onto thesurface, the gas phase 6s(g) level is lowered in energy by theheat of adsorption (see Figure 10a). The resulting adsorbedXe 6s(ad) state lies∼0.5 eV below the vacuum level. Whilethe Xe 6s(ad) retains a mostly Xe 6s(g) character, symmetrybreaking upon physisorption allows weak mixing of the un-occupied 6s(g) with other Xe atomic states (of differentsymmetries) and some Ni surfaces states. The contribution ofthe Xe 6s(ad) to the LDOS was calculated by subtracting thebare Ni LDOS from the Xe plus Ni LDOS, at a large distancefrom the surface probed by the STM tip (∼11 bohr).41 Thiscalculation revealed that the contribution of the Xe adsorbateto the LDOS (or the mixed surface/Xe 6s(ad) levels) is peaked0.5 eV below the vacuum level. The normally sharp atomic 6sresonance for isolated Xe is broadened by the interactionbetween the surface and the adsorbed atom, exhibiting a widthof roughly 0.5 eV. The key feature of these calculations,however, is that far away (>1.5 eV) from this Xe 6s resonancethe contribution of the Xe states to the local density of statesof the system becomes a very weak function of the energy,falling off only very slowly (see Figure 10a). Thus, althoughthe contribution of Xe to the local density of states at energieswell below that of the isolated lowest unoccupied 6s atomicorbital is small, it does not change very much with energy. Sincethe tunneling probability depends on the local density of statesat the Fermi level, the imaging of adsorbates should not dependsensitively on the electronic structure of the adsorbate as longas the energy difference between the lowest unoccupied
adsorbate level and the surface Fermi level is large. In additionthis picture also predicts that the tunneling current should bestrongly affected if the lowest unoccupied level of the adsorbateapproaches within∼0.5 eV of the surface Fermi level (sincethe resonance’s fwhm is∼0.5 eV).The two cases, lowest unoccupied adsorbate level far from
and near to the surface Fermi level, are somewhat analogous toordinary and resonant Raman scattering. In ordinary Ramanscattering the nonresonant interaction of a primary light beamwith the tails of high-energy electronic states makes thescattering probability insensitive to the difference between thephoton energy and the energy of electronic levels in thescattering medium. On the other hand a considerable enhance-ment in Raman scattering probability is observed when thephoton energy approaches the energy separation of the groundand electronically excited levels in the medium. Similar tononresonant Raman scattering, the energetically diffuse “tail”of the Xe 6s(ad) interacts with the Ni Fermi level, far in energyfrom the peak of the Xe resonance, to produce a smallprobability of tunneling.Another key feature of these calculations for the theoretically
tractable Xe on Ni system is that, despite the weak mixing ofthe Xe 6s and surface Fermi level electronic wave functions,the contribution of the adsorbate to the local density of statesat the Fermi level is∼2 orders of magnitude larger than thecontribution of the bare substrate to the LDOS at the largedistances from the surface typically probed by the STM tip inan experiment where adsorbates are being imaged.41 This isnot surprising, of course, since the adsorbate sits on top of thesurface, whicha priori guarantees that its electronic wavefunction will be localized much farther out from the surfacethan can be expected for the electronic levels of the bare surface.These observations suggest that Xe becomes visible in the STMbecause the Xe adsorbate spatially dominates the region probedby the STM tip, despite the Xe 6s(ad) level’s weak mixing withthe Fermi level surface wave function. The STM can thereby
Figure 10. (a) Energy level diagram for Xe adsorbed on a Ni surface. Both the highest occupied Xe 5p and lowest unoccupied Xe 6s levels liefar in energy from the Ni Fermi level. Prior to adsorption, the gas phase Xe 6s(g) level lies just above the vacuum level. Upon adsorption the Xe6s(ad) is lowered∼0.5 eV below the vacuum level by the heat of adsorption. Lang’s atom on jellium calculation of the contribution of the Xe(ad)to the local density of states of the surface/adsorbate complex reveals that the resonance corresponding to the Xe 6s(ad) state is broadened uponadsorption and develops a long energy tail which extends to the Ni Fermi level (ref 41). Although the contribution of the Xe to the surface LDOSat the Fermi level is small (typically 1%), it is a weak function of the energy separation between the Fermi level and the Xe 6s state and, mostimportantly, pushes the spatial distribution of the electronic wave function far away from the surface (ref 41). (b) General qualitative energy leveldiagram for a molecular adsorbate on graphite with a typical HOMO-LUMO gap of 10-12 eV. Organic molecules are normally insulators, andthe location of the HOMO and LUMO in the tunnel junction is not well-defined. However, by analogy with the Xe on Ni states in a, the adsorbatelevels most likely lie far in energy (several electronvolts) from the Fermi levels of the graphite substrate and the Pt tip.
13754 J. Phys. Chem., Vol. 100, No. 32, 1996 Cyr et al.

image the Xe through spatial overlap between the adsorbateand the tip and the residual state density of the Xe6s(ad) tail atthe Fermi level.41
In the case of Xe on Ni the energies of the Xe adsorbateelectronic levels are known from experiment, while for thefunctionalized organic adsorbates studied here the location ofthe LUMO level of the adsorbate with respect to the surfaceFermi level energy is unknown. Nevertheless, Xe physisorbedon Ni, with a 5p-6s gap of∼12 eV, appears to be the atomicanalog of the insulating molecular adsorbates studied here sinceorganic molecules typically have large HOMO-LUMO gapsof 8-12 eV. Recent experiments by Harrison et al. on CH3Br/Xe/CH3Br overlayers on Pt(111) place the LUMO of thetopmost layer of CH3Br in resonance with the Xe 6s ap-proximately 0.5 eV below the vacuum level.40 While the exactplacement of the long chain hydrocarbon adsorbate levels withrespect to the surface Fermi level is uncertain in the presentstudies, the frontier orbitals of the molecular adsorbates, likethe Xe 6s on Ni, almost certainly lie several electronvolts awaythe Fermi level of the graphite surface or the Pt tip, asschematically shown in Figure 10b. By analogy to Xe on Ni,the frontier orbitals of insulating organic molecules shouldparticipate in the tunneling process through a weak mixing ofthe adsorbate LUMO and the electronic levels of the graphiteat the Fermi level. The spatial extension of the molecule awayfrom the surface pushes the mixed adsorbate/surface electronicwave function out from the surface where the contribution ofthe bare graphite to the Fermi level LDOS is negligible. Thismay explain how the tunneling electrons can couple to themolecular framework of these insulating molecules and whythe shapes observed with the STM sometimes resemble theshape of the frontier orbitals.This picture provides a number of insights that can be used
to interpret much of the data observed in the present set ofexperiments involving a series of different adsorbates. To afirst approximation, we assume that the electronic structure ofthe adsorbate is not critical since the adsorbate LUMO energyis likely to be far from the Fermi level of the bare graphite. Insuch cases (nonresonant interactions between the surfaceelectronic states and the adsorbate electronic states) any featureof the adsorbate that pushes the spatial extent of its electronicwave function farther above the surface will enhance the tunnelcurrent associated with the adsorbate or specific functionalgroups on the adsorbate. The most obvious of these factors issimply the size of the adsorbate or a specific functional groupof the material, which is measured well by the polarizability ofthe adsorbate (the highly polarizable Xe, for example, is quitelarge, pushing its electronic wave function far from the surfaceof Ni). A second factor, one unavailable to sphericallysymmetric atomic Xe on Ni, is the geometric isomerization thatcan occur for molecular adsorbates. In the present series ofmolecules, this corresponds to whether functional groups burythemselves in the surface (point down), are parallel to thesurface, or protrude from the surface. The third factor, whichcan affect the spatial extent of the adsorbate or functional groupis the shape or localization of the LUMO. To the extent thatthis level and energetically nearby levels of the adsorbate arelocalized on a given functional group or stick up significantlyfrom the surface, the tunneling into these spatially localizedstates will be enhanced at distances far from the bare surface.Finally, of course, the electronic energy level structure of
the adsorbate and the strength of its coupling to the surface(the degree of mixing of the surface electronic levels and theadsorbate electronic states) will come into play. In cases wherethe adsorbate’s LUMO levels come near to the surface Fermi
level, one expects a large enhancement in the mixing of thesestates and a concomitant enhancement in the tunneling prob-ability (analogous to the situation that occurs with resonantRaman scattering). It should also be noted that, unlike atomicadsorbates, molecular adsorbates often have many electronicallyexcited states that are close in energy to each other. When manysuch levels begin to mix with the Fermi level of the surface,especially if these levels are far in energy from the Fermi level(nonresonant case), the mixing should become less sensitive tothe energy difference between the electronically excited levelof the adsorbate and the Fermi level of the surface. (Again theanalogy to nonresonant Raman scattering is appropriate heresince the Raman effect is due to the interaction of a light beamof low photon energy with the “tails” of many high-energyelectronically excited states.) In principle any of the frontierorbitals can make some contribution to the contrast observedin the STM images, but for simplicity we have neglected theparticipation of the adsorbate HOMO in our discussion of thetunneling process.By analogy with the case of Xe on Ni, the LUMO might be
expected to dominate the STM image contrast of these physi-sorbed films if the adsorbate LUMO lies closer in energy tothe surface Fermi level than the distant HOMO, as depicted inFigure 10a. In such cases the smaller energy difference betweenthe LUMO and the Fermi level could be expected to provide astronger coupling and thereby, a relatively large contributionof the LUMO to the STM contrast. Nevertheless, as notedabove, the energy gap between the Fermi and HOMO/LUMOlevels is expected to be large, resulting in a weak dependenceof the coupling on the energy gap. For adsorbates with smallHOMO-LUMO gaps (i.e. aromatics), both the adsorbateHOMO and the LUMO can be expected to have a significantcontribution to the STM image contrast.34,37,38,58,59
The present study establishes a good correspondence betweenadsorbate polarizability and image contrast. The possibility thatthe adsorbate directly participates in the tunneling process bycontributing to the LDOS through an energetically broadenedadsorbate LUMO, as discussed above, is appealing and appearsto be consistent with much of the data obtained in the presentstudy. We have also obtained some preliminary data indicatingthat Br and S substituents maintain bright STM image contrast(relative to the alkyl chain) over a wide range of bias voltages,from((2.0 to 0.5) eV.60 The large changes in bias voltage areaccompanied by loss of resolution along the alkyl chain, andfor bias voltages smaller than(0.5 eV, features of the graphitesubstrate begin to dominate the image.57 Similar voltagedependences have been reported in the STM images of fattyacids on graphite by Hibino et al.61 While these results are notdefinitive, they are consistent with the involvement of anenergetically diffuse adsorbate LUMO participating in thetunneling process. The contribution of a broadened adsorbateLUMO to the sample density of states should not dependstrongly on energy, (i.e. no resonances in the LDOS near theFermi level energy),41 suggesting that the contrast in the STMimages of polarizable adsorbates should be relatively insensitiveto bias voltage. Additionally, these results appear to rule outthe likelihood of resonant tunneling through spatially localizedand energetically “narrow” states, as has been observed in thedifferentiation of metals through their image potential states,62
where sharp changes in the image contrast with bias voltageare observed.The simple correlation between STM image contrast and
adsorbate polarizability may arise from the weak dependenceof the sample’s LDOS (for the species studied here) on biasvoltage, making the size of the functional group a primary factor
STM of Molecular Adsorbates J. Phys. Chem., Vol. 100, No. 32, 199613755
in determining the image contrast. However, the correlationof the polarizabilities with STM contrast is not perfect. Fromthe trend of increasing polarizability,-CH3 < -OH < -Cl <-NH2 < -SH< -Br < -I (see Figure 9), one might expectBr and I to be “brighter” than SH. However, SH is the brightestfunctional group observed here (Table 1). This disparity maybe related to the details of the electronic structure of the sampleand/or the tip. As mentioned earlier, when the energy differencebetween the adsorbate LUMO and the Fermi level is narrowed,the shoulder of the broadened LUMO may begin to contributemore strongly to the LDOS at the Fermi level and result in anenhancement in the tunnel current (the onset of resonanttunneling). In such cases, larger electronic mixing of the surfaceand adsorbate wave functions augments the contribution dueto the effective spatial overlap between the tip and the adsorbateat large distances from the surface. The gas phase molecularEA locates the relative position of a molecule’s LUMO withrespect to the vacuum level. Unfortunately the thiol EA, toour knowledge, has not been measured, and a comparison ofthe relative proximity of each of the sample’s LUMOs to thesubstrate’s Fermi level (or vacuum level) cannot yet be made.Contrast Variation in CH 3(CH2)21Br Films. The CH3-
(CH2)21Br films display a contrast variation over time (Figures6 and 7), and we consider here the factors which may controlthe changes in the image contrast. Since these images arecollected at the solution-solid interface, the contrast variationmay simply be due to the mobility of molecules into and out ofthe film, resulting in different molecules, possibly with differentorientation or surface geometry, being imaged at different times.However, exchange of molecules between the solution and theadsorbate film is usually associated with some disordering orloss of resolution from molecular motion during the course ofthe experiment; this isnotobserved. Piezo drift with time mayalso be potentially responsible for the film contrast variationssince drift would lead to imaging different regions of the filmfrom frame to frame. Two defects in the bright bromide film(indicated by an asterisk in Figure 7a) can be employed asreference points and are identifiable as among the few moleculesthat are oriented with their “bright” bromine terminated end inthe trough rather than aligned with the other “bright” spotswithin the row (marked byf). These defects appear to havecorresponding analogs in the darker bromide film (indicated byan asterisk in Figure 6a). Additionally, the relative positionsof the troughs (indicated byf andw) in both images (Figures6a and 7a) run throughout the same portion of the frame. Theseobservations affirm the stability of the piezo with time and ruleout the possibility that the contrast variation is simply due tothe imaging of different areas of the film.In an attempt to correlate the positions of the bromines in
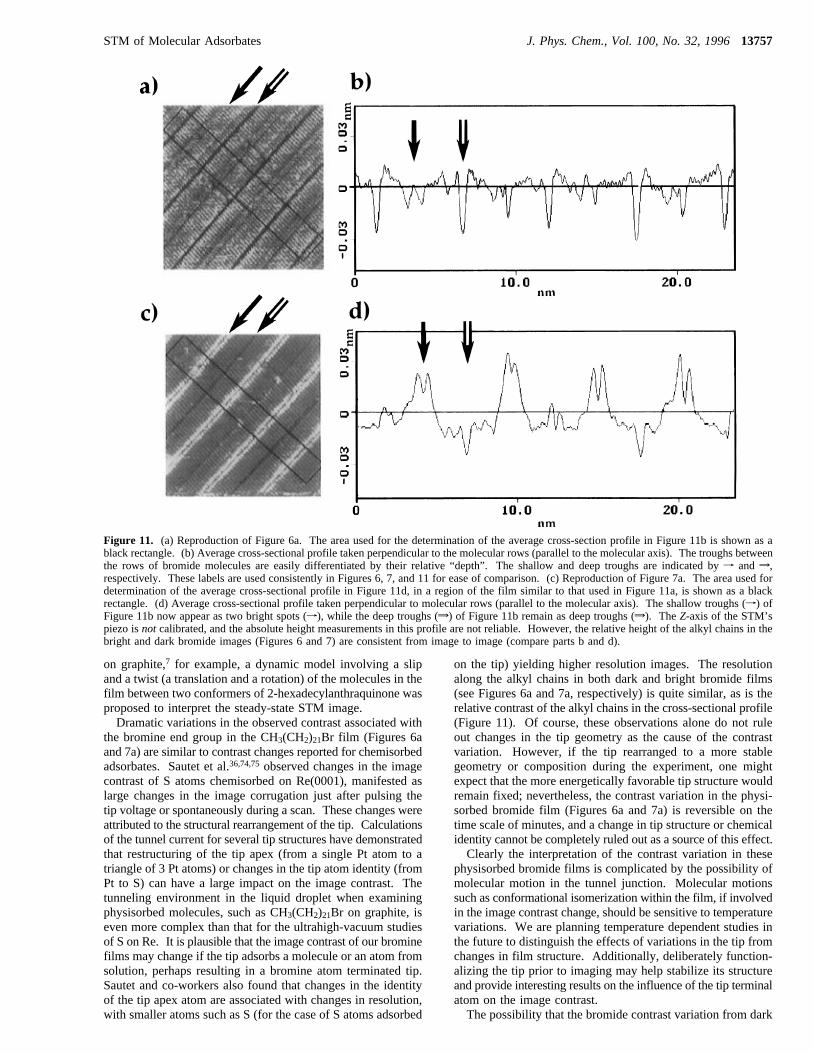
the dark and bright films, we compared the average cross-sectional profiles of both the dark and bright films (see parts band d of Figure 11, respectively). Examination of an averagecross-sectional profile of the bromide image perpendicular tothe direction of the rows (and parallel to the molecular axis)reveals alternating “deep” and “shallow” troughs, as shown inFigure 11b. In this cross-sectional profile of the “dark” imagethe bromine is not distinguishable from the remainder of thealkyl chain and appears to lie in the plane of the film.Comparison of the profiles for the dark and bright images revealsa good correspondence between the location of the shallowtrough (f, Figure 11a,b) in the dark image and the appearanceof bright spots in the bright image (w, Figure 11c,d). The deeptroughs (w), indicating the separation between rows of mol-ecules on the methyl terminated end, remain deep in bothprofiles (Figure 11b,d) with approximately the same depth
(∼0.025 nm). The absolute height scale in these images is notcalibrated, but is consistent between the images considered here.It can be considered that the bromine resides in the shallowtroughs of the darker image and exhibits “higher” contrastrelative to the alkyl chain in the bright image, suggesting thatthe bromine may be sticking up out of the film.Since the long chain adsorbates are quite flexible and are
mobile at the solution/solid interface, the observed changes inthe STM image contrast may reflect variations in the conforma-tion (or orientation) of the molecules in the film. In generalthese physisorbed films are formed a few degrees below themelting point of the bulk hydrocarbon. As the melting point isapproached, such crystals have been observed to undergorotational phase transitions which mark the onset of disorder inthe transition from the solid to the liquid phase.63-69 Theserotator phases near the melting point of the crystal arecharacterized by disorder due to pseudofree rotation of thealkanes about their molecular axis, which begins by rotation atthe chain ends.63-66 Reports of such disorder in bulk crystalsfrom diffraction data are correlated with an increase in thechain-chain spacing in the crystal.68 However no discerniblechange in chain-chain spacing is observed for the bromide filmin Figures 6a and 7a as the contrast changes from dark to bright.Changes in the density of the film would not be observed ifmolecular reorganization occurs only at the ends of themolecules, corresponding to a trans-gauche isomerizationaround the terminal C-C bond, as shown with the models inFigures 6b,c and 7b,c respectively. The energy differencebetween the gauche and trans conformers of 1-bromopropaneis quite small,∼0.1 kcal/mol70,71(less thanRT≈ 0.6 kcal/mol),with a slight preference for the gauche conformer. Intercon-version between the two rotatomers should be feasible at theexperimental temperatures in this study if the barrier to rotationis small. Trans-gauche isomerization may provide a mecha-nism for the ends of the molecules to reorient in the film,resulting in a change in the STM image through variation inthe effective spatial “overlap” between the tip and adsorbate inthe tunnel junction, as noted in the model above based on theXe/Ni interaction. Note that in the “dark” STM image of thebromides (Figure 6a) we speculate that the bromines lie in theplane of the film with molecules in an all-trans conformation(Figure 6b), which results in poor overlap between the bromineand the tip. On the other hand, if the molecule undergoesrotational isomerization to the gauche form (Figure 7b), thespatial extent of the bromine’s electronic wave function willprotrude farther above the surface, enhancing the tunnel currentassociated with the bromine end group, and result in the brightspots observed in the STM image (Figure 7a). As discussedabove, such a geometric rearrangement has the effect of pushingthe adsorbate LUMO wave function farther out from the surface,thereby enhancing the tunnel current associated with the specificBr functional group on the adsorbate. Rotation of the entiremolecule around its long axis, proposed for the bulk alkanerotator phases, may also be another plausible rearrangementmechanism.63-66
The close proximity of the molecules within the film mayorchestrate these motions in a concerted fashion, explaining whythe change in contrast is observed to occur rapidly over a largedomain. In fact, a “meshed gear” model65 has been proposedfor the motion of rotator phases in bulk crystals, since the barrierto rotation in the condensed phase would be relatively highwithout cooperation between neighboring molecules. Evidenceof cooperative reorganization within physisorbed organic filmshas been reported experimentally5,7,15,18,72and in moleculardynamics73 simulations. In films of 2-hexadecylanthraquinone
13756 J. Phys. Chem., Vol. 100, No. 32, 1996 Cyr et al.
on graphite,7 for example, a dynamic model involving a slipand a twist (a translation and a rotation) of the molecules in thefilm between two conformers of 2-hexadecylanthraquinone wasproposed to interpret the steady-state STM image.Dramatic variations in the observed contrast associated with
the bromine end group in the CH3(CH2)21Br film (Figures 6aand 7a) are similar to contrast changes reported for chemisorbedadsorbates. Sautet et al.36,74,75observed changes in the imagecontrast of S atoms chemisorbed on Re(0001), manifested aslarge changes in the image corrugation just after pulsing thetip voltage or spontaneously during a scan. These changes wereattributed to the structural rearrangement of the tip. Calculationsof the tunnel current for several tip structures have demonstratedthat restructuring of the tip apex (from a single Pt atom to atriangle of 3 Pt atoms) or changes in the tip atom identity (fromPt to S) can have a large impact on the image contrast. Thetunneling environment in the liquid droplet when examiningphysisorbed molecules, such as CH3(CH2)21Br on graphite, iseven more complex than that for the ultrahigh-vacuum studiesof S on Re. It is plausible that the image contrast of our brominefilms may change if the tip adsorbs a molecule or an atom fromsolution, perhaps resulting in a bromine atom terminated tip.Sautet and co-workers also found that changes in the identityof the tip apex atom are associated with changes in resolution,with smaller atoms such as S (for the case of S atoms adsorbed
on the tip) yielding higher resolution images. The resolutionalong the alkyl chains in both dark and bright bromide films(see Figures 6a and 7a, respectively) is quite similar, as is therelative contrast of the alkyl chains in the cross-sectional profile(Figure 11). Of course, these observations alone do not ruleout changes in the tip geometry as the cause of the contrastvariation. However, if the tip rearranged to a more stablegeometry or composition during the experiment, one mightexpect that the more energetically favorable tip structure wouldremain fixed; nevertheless, the contrast variation in the physi-sorbed bromide film (Figures 6a and 7a) is reversible on thetime scale of minutes, and a change in tip structure or chemicalidentity cannot be completely ruled out as a source of this effect.Clearly the interpretation of the contrast variation in these
physisorbed bromide films is complicated by the possibility ofmolecular motion in the tunnel junction. Molecular motionssuch as conformational isomerization within the film, if involvedin the image contrast change, should be sensitive to temperaturevariations. We are planning temperature dependent studies inthe future to distinguish the effects of variations in the tip fromchanges in film structure. Additionally, deliberately function-alizing the tip prior to imaging may help stabilize its structureand provide interesting results on the influence of the tip terminalatom on the image contrast.The possibility that the bromide contrast variation from dark
Figure 11. (a) Reproduction of Figure 6a. The area used for the determination of the average cross-section profile in Figure 11b is shown as ablack rectangle. (b) Average cross-sectional profile taken perpendicular to the molecular rows (parallel to the molecular axis). The troughs betweenthe rows of bromide molecules are easily differentiated by their relative “depth”. The shallow and deep troughs are indicated byf andw,respectively. These labels are used consistently in Figures 6, 7, and 11 for ease of comparison. (c) Reproduction of Figure 7a. The area used fordetermination of the average cross-sectional profile in Figure 11d, in a region of the film similar to that used in Figure 11a, is shown as a blackrectangle. (d) Average cross-sectional profile taken perpendicular to molecular rows (parallel to the molecular axis). The shallow troughs (f) ofFigure 11b now appear as two bright spots (f), while the deep troughs (w) of Figure 11b remain as deep troughs (w). TheZ-axis of the STM’spiezo isnot calibrated, and the absolute height measurements in this profile are not reliable. However, the relative height of the alkyl chains in thebright and dark bromide images (Figures 6 and 7) are consistent from image to image (compare parts b and d).
STM of Molecular Adsorbates J. Phys. Chem., Vol. 100, No. 32, 199613757
to bright may be due to molecular reorientation within the filmemphasizes the importance of an adsorbate’s physical size andspatial orientation during imaging. The alcohol groups, forexample, seem to have a contrast similar to that of CH3 in theSTM image (Figure 2a) even though-OH has a largerpolarizability than the remainder of the alkyl chain (Figure 9).The orientation of the OH groups in the alcohol film is optimizedfor hydrogen bonding in the plane of the film (Figure 2b,c),and the frontier orbitals for OH-functionalized hydrocarbonsare restricted to lie in the plane of the film. In this orientationthe LUMO wave function, localized on the OH group, will notbe available for more than average participation in the tunnelingprocess due to poor overlap with the STM tip during imaging.By contrast, the amines appear bright in the STM image (Figure4a). Examination of a computer model of the amine film(Figure 4b,c) indicates that the lone pair electrons of the NH2
groups are pointing up out of the film. It should be noted thatthe spatial distribution of the amine LUMO, localized on theNH2 group, is quite similar to the location of the N lone pair ofthe HOMO.76 This means that the amine LUMO, localized onthe NH2 group, also points up out of the film toward the probingSTM tip and is potentially available to participate in thetunneling process since it is spatially extended away from thesurface. The orientation of the SH LUMO in the thiol film,unlike the alcohols, is not restricted by a hydrogen-bondingnetwork to lie in the plane of the film, and they appear bright.The orientation of the molecules with respect to the surface, asdictated by intermolecular and molecule-surface interactionswithin the film (i.e. hydrogen-bonding and van der Waalsforces), may control the effective spatial interaction betweenthe tip/surface-adsorbate and be a factor governing the relativeimage contrast of the functional groups studied here.
Summary
Several functional groups, NH2, Br, I, and S, have beenidentified by their bright contrast in STM images of long chainhydrocarbon films physisorbed on graphite. Comparison of therelative brightness of the functional groups confirms an empiricalrelationship between increasing molecular polarizability andincreasing STM image brightness. A model has been proposedin which the molecular adsorbates contribute to the local densityof states at the Fermi level of the surface, as monitored by theSTM, through an energetically diffuse tail of the adsorbateLUMO, similar to the case of Xe on Ni.41 Since the adsorbate-induced increase in the LDOS depends only weakly on thedifference in energy between the surface Fermi level and theadsorbate LUMO, variations in the tunneling probability, andhence the STM contrast, become more sensitive to the effectivespatial overlap between the adsorbate and STM tip than to thedetails of the adsorbate electronic energies for the group ofmolecules surveyed here. The extent that the functional groupsprotrude away from the surface will then determine the degreeof tip/surface-adsorbate spatial overlap and will be highlydependent on the adsorbate’s physical size (or polarizability),the orientation of the adsorbate with respect to the surface, andthe spatial characteristics of the adsorbate LUMO. Theelectronic structure of the adsorbate is expected to play a largerrole in the STM image contrast in cases where the adsorbateLUMO and Fermi level are close in energy, as is the case inconductive organic films.
Acknowledgment. Work at Columbia was supported by theJoint Services Electronics Program (U.S. Army, Navy, and AirForce; DAAHO4-94-G0057), by the Donors of the PetroleumResearch Fund administered by the American Chemical Society,
by the National Institute of Health, (PHS Grant 1 R03 RR06987-01A1), and by the American Association of University Women.Equipment support was provided by the National ScienceFoundation (CHE-94-19465). Work at Harvard was supportedin part by ARPA and by the Office of Naval Research. Wewould like to thank Professor Clark Still for an introduction toMacromodel, the program used to generate the computer modelspresented in this paper, and for a number of stimulatingdiscussions. We are indebted to Dr. Norton Lang for pointingout the importance of the variation in tunnel barrier width indetermining the influence of different electronic levels on thetunneling process.
References and Notes
(1) Rabe, J. P.; Buchholz, S.; Askadskaya, L.Synth. Met. 1993, 54,339.
(2) Venkataraman, B.; Flynn, G. W.; Wilbur, J.; Folkers, J. P.;Whitesides, G. M.J. Phys. Chem. 1995, 99, 8684.
(3) Stevens, F.; Walba, D. M. Preprint1995.(4) Spong, J. K.; Mizes, H. A.; LaComb, L. J., Jr.; Dovek, M. M.;
Frommer, J. E.; Foster, J. S.Nature1989, 338, 137.(5) Nejoh, H.Appl. Phys. Lett. 1990, 57, 2907.(6) Breen, J. J.; Flynn, G. W.J. Phys. Chem. 1992, 96, 6825.(7) Stabel, A.; Heinz, R.; Rabe, J. P.; Wegner, G.; Schryver, F. C. D.;
Corens, D.; Dehaen, W.; Su¨ling, C. J. Phys. Chem. 1995, 99, 8690.(8) Patrick, D. L.; Beebe, T. P.Langmuir1994, 10, 298.(9) Smith, D. P. E.J. Vac. Sci. Technol. B 1991, 9, 1119.(10) Venkataraman, B.; Breen, J. J.; Flynn, G. W.J. Phys. Chem. 1995,
99, 6608.(11) Wawkuschewski, A.; Cantow, H.-J.; Magonov, S. N.Langmuir
1993, 9, 2778.(12) Rabe, J. P.; Buchholz, S.Science1991, 253, 424.(13) Bucher, J.-P.; Roeder, H.; Kern, K.Surf. Sci. 1993, 289, 370.(14) Salmeron, M.; Beebe, T.; Odriozola, J.; Wilson, T.; Ogletree, D.
R.; Siekhaus, W.J. Vac. Sci. Technol. A 1990, 8 (1), 635.(15) Liang, W.; Whangbo, M.-H.; Wawkuschewski, A.; Cantow, H. J.;
Magonov, S. N.AdV. Mater. 1993, 5, 817.(16) Yeo, Y. H.; Yackowboski, K.; McGonigal, G. C.; Thomson, D. J.
J. Vac. Sci. Technol. A 1992, 10, 600.(17) Biscarini, F.; Bustamante, C.; Kenkre, V. M.Phys. ReV. B 1995,
51, 11089.(18) Mizutani, W.; Shigeno, M.; Ono, M.; Kajimura, K.Appl. Phys.
Lett. 1990, 56, 1974.(19) Mintmire, J. W.; Harrison, J. A.; Colton, R. J.; White, C. T.J.
Vac. Sci. Technol. A 1992, 10, 603.(20) Ou-Yang, H.; Marcus, R. A.; Ka¨llebring, B.J. Chem. Phys. 1994,
100, 7814.(21) Winkler, R. G.; Hentschke, R.J. Chem. Phys. 1994, 100, 3930.(22) Thibaudau, R.; Watel, G.; Cousty, J.Surf. Sci. Lett. 1993, 281,
L303.(23) Wawkuschewski, A.; Cantow, H.-J.; Magonov, S. N.; Mo¨ller, M.;
Liang, W.; Whangbo, M.-H.AdV. Mater. 1993, 5, 821.(24) Hara, M.; Iwakabe, Y.; Tochigi, K.; Sasabe, H.; Garito, A. F.;
Yamada, A.Nature1990, 344, 228.(25) Morozov, V. N.; Seeman, N. C.; Kallenbach, N. R.Scanning
Microsc. 1993, 7, 757.(26) Fisher, A. J.; Blo¨chl, P. E.Phys. ReV. Lett. 1993, 70, 3263.(27) Poler, J. C.; Zimmerman, R. M.; Cox, E. C.Langmuir1995, 11,
2689.(28) Sleator, T.; Tycko, R.Phys. ReV. Lett. 1988, 60, 1418.(29) Lupkowski, M.; Maguire, J. F.Compos. Interfaces1994, 2, 1.(30) McGonigal, G. C.; Bernhadt, R. H.; Thomson, D. J.Appl. Phys.
Lett. 1990, 57, 28.(31) Yackoboski, K.; Yeo, Y. H.; McGonigal, G. C.; Thomson, D. J.
Ultramicroscopy1992, 42-44, 963.(32) Lindsay, S. M.; Sankey, O. F.; Li, Y.; C., H.; Rupprecht, A.J.
Phys. Chem. 1990, 94, 4655.(33) Smith, D. P. E.; Ho¨rber, J. K. H.; Binning, G.; Nejoh, H.Nature
1990, 344, 641.(34) Walba, D. M.; Stevens, F.; Parks, D.; Clark, N.; Wand, M.Science
1995, 267, 1144.(35) Hallmark, V. M.; Chiang, S.; Meinhardt, K.-P.; Hafner, K.Phys.
ReV. Lett. 1993, 70, 3740.(36) Sautet, P.; Joachim, C.Chem. Phys. Lett. 1991, 185, 23.(37) Ludwig, Z.Phys. B 1992, 86, 397.(38) Ludwig, Z.Phys. B 1994, 93, 375.(39) Traven, V. F.Frontier Orbitals and Properties of Organic
Molecules; Ellis Horwood: New York, 1992.(40) Ukraintsev, V. A.; Long, T. J.; Gowl, T.; Harrison, I.J. Chem.
Phys. 1992, 96, 9114.
13758 J. Phys. Chem., Vol. 100, No. 32, 1996 Cyr et al.
(41) Eigler, D. M.; Weiss, P. S.; Schweizer, E. K.; Lang, N. D.Phys.ReV. Lett. 1991, 66, 1189.
(42) Somorjai, G. A.Introduction to Surface Chemistry and Catalysis;Wiley-Interscience: New York, 1994.
(43) Weber, R. R.; Peria, W. T.Surf. Sci. 1969, 14, 13.(44) Antoniewicz, P. R.Surf. Sci. 1975, 52, 703.(45) The Whitesides group at Harvard have synthesized and purified
the CH3(CH2)21SH samples as previously described in the following: Bain,C. D.; Troughton, E. B.; Tao, Y.-T.; Evall, J.; Whitesides, G. M.; Nuzzo,R. G. J. Am. Chem. Soc. 1989, 111, 321.
(46) Macromodel is a program developed by Prof. Clark Still’s groupat Columbia University.
(47) Weiner, S. J.; Kollman, P. A.; Case, D. A.; Singh, U. C.; Ghio, C.;Alagona, G.; Profeta, S., Jr.; Weiner, P.J. Am. Chem. Soc. 1984, 106, 765.
(48) Findenegg, G. H.J. Chem. Soc., Faraday Trans. 1972, 68, 1799.(49) Groszek, A. J.J. Proc. R. Soc. London1970, 314, 473.(50) Leggetter, S.; Tildesley, D. J.Ber. Bunsen-Ges. Phys. Chem. 1990,
94, 285.(51) Elbel, N.; Gu¨nther, E.; Seggern, H.Appl. Phys. Lett. 1994, 65, 642.(52) Cyr, D. M.; Flynn, G. W. Unpublished Results. Sulfurs appear
bright for both CH3(CH2)21SS(CH2)21CH3 and CH3(CH2)17S(CH2)17CH3 onboth graphite and MoS2 surfaces.
(53) Liu, X.; Zheng, J. F.; Weber, E. R.; Salmeron, M.(54) Hoshino, A.; Isoda, S.; Kurata, H.; Kobayashi, T.J. Cryst.Growth
1995, 146, 636.(55) Handbook of Chemistry and Physics, 71st ed.; CRC Press, Inc.:
Boston, 1990-91.(56) Tersoff, J.; Hamman, D. R.Phys. ReV. Lett. 1983, 50, 1998.(57) Tersoff, J.; Hamann, D. R.Phys. ReV. B 1985, 31, 805.(58) Sautet, P.; Bocquet, M.-L.Surf. Sci. Lett. 1994, 304, 445.(59) Magonov, S. N.; Wawkuschewski, A.; Cantow, H.-J.; Liang, W.;
Whangbo, M.-H.Appl. Phys. 1994, 59, 119.
(60) Cyr, D. M.; Flynn, G. W. Unpublished results.(61) Hibino, M.; Sumi, A.; Hatta, I.Jpn. J. Appl. Phys. 1995, 34, 3354.(62) Jung, T.; Mo, Y. W.; Himpsel, F. J.Phys. ReV. Lett. 1995, 74,
1641.(63) Maroncelli, M.; Strauss, H. L.; Snyder, R. G.J. Chem. Phys. 1985,
82, 2811.(64) Synder, R. G.; Maroncelli, M.; Qi, S. P.; Strauss, H. L.Science
1981, 214, 188.(65) Levay, B.; Lalovic, M.; Ache, H. J.J.Chem. Phys. 1989, 90, 3282.(66) Hoffman, J. D.J. Chem. Phys. 1952, 20, 541.(67) Sirota, E. B.; King, J. H. E.; Singer, D. M.; Shao, H. H.J. Chem.
Phys. 1993, 98, 5809.(68) Ungar, G.J. Phys. Chem. 1983, 87, 689.(69) McClure, D. W.J. Chem. Phys. 1968, 49, 1830.(70) Momany, F. A.; Bonham, R. A.; McCoy, W. H.J. Am. Chem. Soc.
1963, 85, 3077.(71) Komaki, C.; Ichishima, I.; Kuratani, K.; Miyazawa, T.; Shiman-
ouchi, T.; Mizushima, S.-I.1955, 28, 330.(72) Askadskaya, L.; Rabe, J. P.Phys. ReV. Lett. 1992, 69, 1395.(73) Reinhard, H.; Schu¨rmann, B. L.; Rabe, J. P.J. Chem. Phys. 1992,
96, 6213.(74) Sautet, P.; Dunphy, J. C.; Ogletree, D. F.; Joachim, C.; Salmeron,
M. Surf. Sci. 1994, 315.(75) McIntyre, B. J.; Sautet, P.; Dunphy, J. C.; Salmeron, M.; Somorjai,
G. A. J. Vac. Sci. Technol. B 1994, 12, 1751.(76) Jorgensen, W. L.; Salem, L.The Organic Chemist’s Book of
Orbitals; Academic Press: New York, 1973.
JP9606467
STM of Molecular Adsorbates J. Phys. Chem., Vol. 100, No. 32, 199613759