functional foods and nutraceuticals: the development of value
TRANSCRIPT
Science, Innovation and Electronic Information Division
Functional Foods and Nutraceuticals: The Development of Value-added Food by Canadian Firms by Jacqueline Tebbens
Science, Innovation and Electronic Information Division (SIEID) 7-A, R.H. Coats Building, Ottawa, K1A 0T6
Telephone: 1 800 263-1136
Catalogue no. 88F0006XIE — No. 016
ISSN: 1706-8967
ISBN: 0-662-41612-0
Work ing Pape r
How to obtain more information For information on the wide range of data available from Statistics Canada, you can contact us by calling one of our toll-free numbers. You can also contact us by e-mail or by visiting our website. National inquiries line 1 800 263-1136 National telecommunications device for the hearing impaired 1 800 363-7629 Depository Services Program inquiries 1 800 700-1033 Fax line for Depository Services Program 1 800 889-9734 E-mail inquiries [email protected] Website www.statcan.ca Information to access the product This product, catalogue no. 88F0006XIE, is available for free. To obtain a single issue, visit our website at www.statcan.ca and select Our Products and Services. Standard of service to the public Statistics Canada is committed to serving its clients in a prompt, reliable and courteous manner and in the official language of their choice. To this end, the agency has developed standards of service which its employees observe in serving its clients. To obtain a copy of these service standards, please contact Statistics Canada toll free at 1 800 263-1136. The service standards are also published on www.statcan.ca under About Statistics Canada > Providing services to Canadians. Symbols The following standard symbols are used in Statistics Canada publications: . not available for any reference period .. not available for a specific reference period … not applicable 0 true zero or a value rounded to zero 0s value rounded to 0 (zero) where there is a meaningful distinction between true zero and the value that was rounded p preliminary r revised x suppressed to meet the confidentiality requirements of the Statistics Act E use with caution F too unreliable to be published Note Due to rounding, components may not add to the totals.
Statistics CanadaScience and Innovation Surveys SectionScience, Innovation and Electronic Information Division (SIEID)
Functional Foods and Nutraceuticals:The Development of Value-added
Food by Canadian Firms
2002
Note of appreciation
Canada owes the success of its statistical system to a long-standing partnership between Statistics Canada, the citizens of Canada, its businesses, governments and other institutions. Accurate and timely statistical information could not be produced without their continued cooperation and goodwill.
Published by authority of the Minister responsible for Statistics Canada
© Minister of Industry, 2005
All rights reserved. The content of this publication may be reproduced, in whole or in part, and by any means, without further permission from Statistics Canada, subject to the following conditions: that it is done solely for the purposes of private study, research, criticism, review, newspaper summary, and/or for non-commercial purposes; and that Statistics Canada be fully acknowledged as follows: Source (or “Adapted from”, if appropriate): Statistics Canada, name of product, catalogue, volume and issue numbers, reference period and page(s). Otherwise, no part of this publication may be reproduced, stored in a retrieval system or transmitted in any form or by any means, electronic, mechanical, photocopy, for any purposes, without the prior written permission of Licensing Services, Marketing Division, Statistics Canada, Ottawa, Ontario, Canada K1A 0T6.
September 2005
Catalogue no. 88F0006XIE, no. 016
ISSN: 1706-8967ISBN: 0-662-41612-0
Frequency: occasional
Ottawa
Cette publication est disponible en français sur demande (no 88F0006XIF au catalogue).
Statistics Canada 4 Catalogue no. 88F0006XIE
Contacts for more information Allison Miranda, Senior Market Development Officer New Foods and Technologies Agriculture and Agri-Food Canada 930 Carling Ave, Room 597 Ottawa ON K1A 0C5 Tel: (613) 759-7702 Fax: (613) 759-7480 E-mail: [email protected] Brian Rattray New Foods and Technologies Agriculture and Agri-Food Canada 930 Carling Ave, Room 597 Ottawa ON K1A OC5 Tel: (613) 759-6048 Fax: (613) 759-7480 E-mail: [email protected] Jacqueline Tebbens or Alan Bulley Analysis and Compendia Publishing Communications and Library Services R.H. Coats Building, 10th Floor, Section O Statistics Canada Ottawa ON K1A OT6 How to obtain more information National inquiries: 1 800 263-1136 E-mail inquiries : [email protected]
Statistics Canada 5 Catalogue no. 88F0006XIE
The science and innovation information program The purpose of this program is to develop useful indicators of science and technology activity in Canada based on a framework that ties them together into a coherent picture. To achieve the purpose, statistical indicators are being developed in five key entities:
Actors: are persons and institutions engaged in S&T activities. Measures include distinguishing R&D performers, identifying universities that license their technologies, and determining the field of study of graduates.
Activities: include the creation, transmission or use of S&T knowledge including research and development, innovation, and use of technologies.
Linkages: are the means by which S&T knowledge is transferred among actors. Measures include the flow of graduates to industries, the licensing of a university's technology to a company, co-authorship of scientific papers, the source of ideas for innovation in industry.
Outcomes: are the medium-term consequences of activities. An outcome of an innovation in a firm may be more highly skilled jobs. An outcome of a firm adopting a new technology may be a greater market share for that firm.
Impacts: are the longer-term consequences of activities, linkages and outcomes. Wireless telephony is the result of many activities, linkages and outcomes. It has wide-ranging economic and social impacts such as increased connectedness.
The development of these indicators and their further elaboration is being done at Statistics Canada, in collaboration with other government departments and agencies, and a network of contractors. Prior to the start of this work, the ongoing measurements of S&T activities were limited to the investment of money and human resources in research and development (R&D). For governments, there were also measures of related scientific activity (RSA) such as surveys and routine testing. These measures presented a limited picture of science and technology in Canada. More measures were needed to improve the picture. Innovation makes firms competitive and we are continuing with our efforts to understand the characteristics of innovative and non-innovative firms, especially in the service sector that dominates the Canadian Economy. The capacity to innovate resides in people and measures are being developed of the characteristics of people in those industries that lead science and technology activity. In these same industries, measures are being made of the creation and the loss of jobs as part of understanding the impact of technological change. The federal government is a principal player in science and technology in which it invests over five billion dollars each year. In the past, it has been possible to say only how much the federal government spends and where it spends it. Our report Federal Scientific Activities, 1998 (Cat. No. 88-204) first published socio-economic objectives indicators to show what the S&T money is spent on. As well as offering a basis for a public debate on the priorities of government spending, all of this information has been used to provide a context for performance reports of individual departments and agencies. As of April 1999, the Program has been established as a part of Statistics Canada's Science, Innovation and Electronic Information Division.
Statistics Canada 6 Catalogue no. 88F0006XIE
The final version of the framework that guides the future elaboration of indicators was published in December, 1998 (Science and Technology Activities and Impacts: A Framework for a Statistical Information System, Cat. No. 88-522). The framework has given rise to A Five-Year Strategic Plan for the Development of an Information System for Science and Technology (Cat. No. 88-523). It is now possible to report on the Canadian system on science and technology and show the role of the federal government in that system. Our working papers and research papers are available at no cost on the Statistics Canada Internet site at http://www.statcan.ca/cgi-bin/downpub/research.cgi?subject=193.
Statistics Canada 7 Catalogue no. 88F0006XIE
Table of Contents Highlights.............................................................................................................................. 9 Acknowledgments............................................................................................................... 10 Background ......................................................................................................................... 11 What are functional foods and nutraceuticals? ................................................................... 12 Functional food and nutraceutical activities ....................................................................... 12
Description of firms ..................................................................................................... 12 Participation in functional food and nutraceutical activities ........................................ 13 Product lines................................................................................................................. 14 Ingredients sourced in Canada and abroad................................................................... 15
Distribution of products ...................................................................................................... 15 Exporting products.............................................................................................................. 16
Export sales/revenues................................................................................................... 16 Export destinations....................................................................................................... 16 Exported products ........................................................................................................ 18
Business practices ............................................................................................................... 19 Ownership .................................................................................................................... 19 Partnerships .................................................................................................................. 19 Contracting out ............................................................................................................. 20
Raising capital..................................................................................................................... 21 Intellectual property ............................................................................................................ 22 Research and development ................................................................................................. 22 Impact of regulations .......................................................................................................... 23 Human Resources ............................................................................................................... 24 Challenges for the future..................................................................................................... 25 Bibliography ....................................................................................................................... 26 Methodology ....................................................................................................................... 27 Catalogued publications...................................................................................................... 28
List of tables and charts Table 1: Participation in functional food and nutraceutical activities, 2002 ...................... 13 Table 2: Participation of firms, by type of functional food or nutraceutical, 2002 ............ 14 Chart 1: Source of ingredients, 2002 .................................................................................. 15 Table 3: Total export revenues and total functional food and nutraceutical export revenues,
2002.............................................................................................................................. 16 Table 4: Countries or regions where functional foods and nutraceuticals were exported, 2002.............................................................................................................. 17 Table 5: Countries or regions of interest in 2002 for export of functional foods and
nutraceuticals in 2003 and 2004................................................................................... 18 Table 6: Exported functional food and nutraceutical products, 2002................................. 19 Table 7: Ownership structure of firms engaged in functional food and nutraceutical activities, 2002 ....................................................................................... 19 Table 8: Reasons for forming partnerships, 2002............................................................... 20
Statistics Canada 8 Catalogue no. 88F0006XIE
Table 9: Contracting out of functional food and nutraceutical related activities, 2002 ............................................................................................................. 20 Table 10: Sources of raised capital, 2002 ........................................................................... 21 Table 11: Capital raised, 2002 ............................................................................................ 22 Table 12: Purpose for raising or attempting to raise capital, 2002 ..................................... 22 Table 13: Firms’ perceptions of how changing compositional and labelling regulations to
match U.S. standards would impact areas of business, 2002....................................... 24 Table 14: Firms with employees who participate in functional food and nutraceutical related
activities, by firm size, 2002 ........................................................................................ 24 Table 15: Human resource competencies needed for unfilled functional food and
nutraceutical positions, 2002........................................................................................ 25
Statistics Canada 9 Catalogue no. 88F0006XIE
Highlights
• In 2002, an estimated 294 firms in Canada engaged in activities with functional food and nutraceutical products. Ontario counted 75 firms, Quebec and British Columbia each 72, and Saskatchewan 33E.1 One-third (37%) of firms had fewer than 10 employees.
• More firms were engaged in only nutraceutical activities (46%) than in only
functional food activities (28%), and just over one-quarter of firms were involved in both. Half of the firms (51%) were engaged in the production, distribution or sales of plant-based nutraceuticals.
• Wholesalers were the most commonly used distribution channel (61% of firms).
Over half of the firms surveyed (57%) indicated that they exported their products. One-quarter of firms sold products for export only.
• Three-quarters of firms (75%) classified themselves as private corporations. • One-third (37%) of firms invested in research and development of nutraceuticals
and one-third (34%) invested in research and development of functional foods. • Over 60% of all firms believed that the ability to use claims about reducing the
risk of diseases, generic health claims and structure-function specific claims would have a positive impact on sales.
1. The symbol E indicates a standard error of between 7.5% and 14.99% or a coefficient of variation (CV) between 15.00% and 29.99%. When the figure is not accompanied by a symbol, the standard error is between 0 and 7.5% or the CV is between 0 and 14.99%. Some data with a higher standard error or CV are precise enough for some purposes.
Statistics Canada 10 Catalogue no. 88F0006XIE
Acknowledgments Members of the Steering Committee for the Development of The Functional Foods and Nutraceuticals Survey: Agriculture and Agri-Food Canada David Culver Edward Farnworth Patti Miller Ahmed Mushtaq Allison Rodriguez Miranda Margaret Zafiriou Statistics Canada Yves Gauthier Shelley Harman Antoine Rose Patti Wunsch Saskatchewan Nutraceutical Network Kelley Fitzpatrick, President (former) For their assistance in developing this publication, the author would like to thank: Agriculture and Agri-Food Canada Allison Rodriguez Miranda Brian Rattray Statistics Canada Alan Bulley Christian Houle Antoine Rose Patti Wunsch
Statistics Canada 11 Catalogue no. 88F0006XIE
Background Agriculture and Agri-Food Canada (AAFC), in consultation with industry representatives, recognized the need to conduct The Functional Foods and Nutraceuticals Survey in Canada. The survey was designed to provide a benchmark measurement of the industry and a better understanding of the scope and nature of the sector. AAFC held a think tank session in February 2002 to begin the process of determining which information requirements of government and industry stakeholders could be obtained from a survey, and to discuss data collection and analysis as well as distribution of the information to end users. AAFC and Statistics Canada designed the survey instrument, and the survey was carried out in the spring of 2003 for the 2002 reference year. AAFC plans to conduct the survey every two years for purposes of tracking the development of functional foods and nutraceuticals over time—in other words, to enable analysis of trends and growth by categories. The next iteration of the survey is scheduled for 2005 for the 2004 reference year.
Statistics Canada 12 Catalogue no. 88F0006XIE
What are functional foods and nutraceuticals? Functional foods are food components that, according to Health Canada,2 provide demonstrated physiological benefits or reduce the risk of chronic disease, above and beyond their basic nutritional functions. Tomatoes with enhanced lycopene levels and foods with added soluble fibre, for example, are functional foods. According to AAFC, the following are examples of functional food products produced by Canadian companies: milk, cheese and eggs that are all enriched with omega-3 fatty acids; yogurt enhanced with live active cultures (probiotics); fruit juices and drinks with increased antioxidant levels; cereals and grains such as wheat, oat, barley and fenugreek products with enhanced amounts of dietary fibre; modified fatty acid vegetable oils; and vegetable proteins from soy, canola and hemp, legumes and fruit products.3 A nutraceutical, according to Health Canada2, is a product that is isolated or purified from foods that is generally sold in medicinal forms not usually associated with food, such as powders, tablets or capsules. It is demonstrated to have a physiological benefit, or to provide protection against chronic disease. AAFC describes nutraceuticals as products extracted, purified or produced from a plant, animal or marine source (e.g. antioxidants from blueberries, elk velvet, fish oils), or produced from dried, powdered, or pressed plant material, such as ginseng. Omega-3 and lycopene capsules are examples of nutraceutical products that are sold in Canada.3 Functional food and nutraceutical products represent a value-added growth opportunity for the Canadian agri-food industry, both domestically and internationally. The market is driven by the aging population, rising health care costs, advances in food technology and nutrition as well as a growing consumer understanding of the link between diet and health.
Functional food and nutraceutical activities
Description of firms The results of the survey showed that there were an estimated 294 firms in Canada—ranging from small start-ups to multinationals—engaged in activities with functional foods and nutraceuticals in 2002. Ontario counted 75 of these firms, Quebec and British Columbia
2. Health Canada. 1998. “Nutraceuticals/functional foods and health claims on foods.” Therapeutic Products Programme and the Food Directorate from the Health Protection Branch http://www.hc-sc.gc.ca/food-aliment/ns-sc/ne-en/health_claims-allegations_sante/e_nutra-funct_foods (acccessed on July 30, 2005). 3. Agriculture and Agri-Food Canada. 2002. “The functional food and nutraceutical industry: Innovation profile.” Innovation in Canada. http://innovation.ic.gc.ca/gol/innovation/site.nsf/en/in02585.html (accessed July 30, 2005).
Statistics Canada 13 Catalogue no. 88F0006XIE
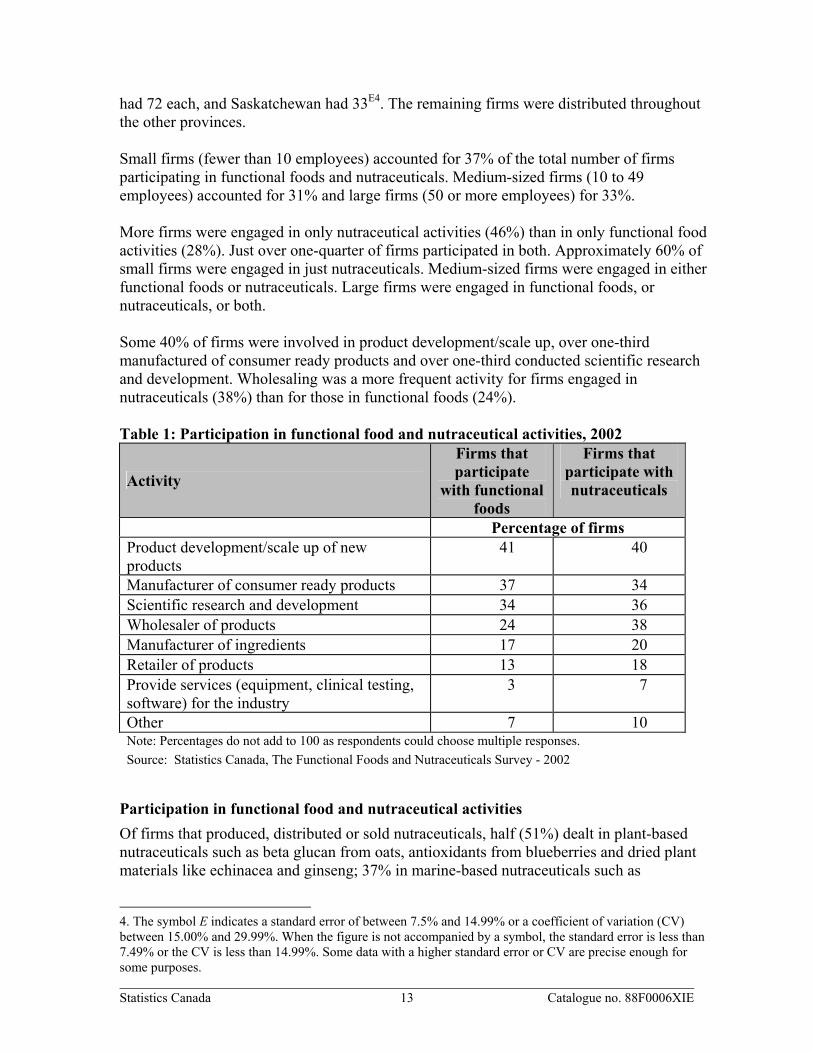
had 72 each, and Saskatchewan had 33E4. The remaining firms were distributed throughout the other provinces. Small firms (fewer than 10 employees) accounted for 37% of the total number of firms participating in functional foods and nutraceuticals. Medium-sized firms (10 to 49 employees) accounted for 31% and large firms (50 or more employees) for 33%. More firms were engaged in only nutraceutical activities (46%) than in only functional food activities (28%). Just over one-quarter of firms participated in both. Approximately 60% of small firms were engaged in just nutraceuticals. Medium-sized firms were engaged in either functional foods or nutraceuticals. Large firms were engaged in functional foods, or nutraceuticals, or both. Some 40% of firms were involved in product development/scale up, over one-third manufactured of consumer ready products and over one-third conducted scientific research and development. Wholesaling was a more frequent activity for firms engaged in nutraceuticals (38%) than for those in functional foods (24%). Table 1: Participation in functional food and nutraceutical activities, 2002
Activity
Firms that participate
with functional foods
Firms that participate with nutraceuticals
Percentage of firms Product development/scale up of new products
41 40
Manufacturer of consumer ready products 37 34 Scientific research and development 34 36 Wholesaler of products 24 38 Manufacturer of ingredients 17 20 Retailer of products 13 18 Provide services (equipment, clinical testing, software) for the industry
3 7
Other 7 10 Note: Percentages do not add to 100 as respondents could choose multiple responses. Source: Statistics Canada, The Functional Foods and Nutraceuticals Survey - 2002
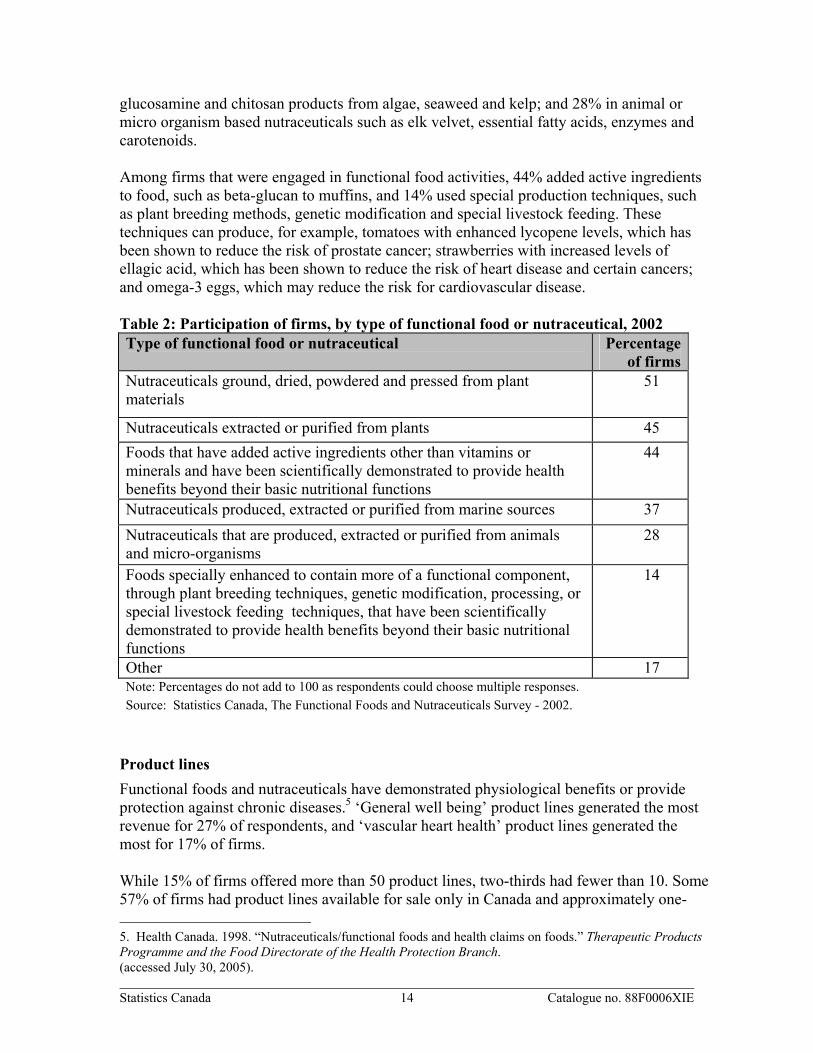
Participation in functional food and nutraceutical activities Of firms that produced, distributed or sold nutraceuticals, half (51%) dealt in plant-based nutraceuticals such as beta glucan from oats, antioxidants from blueberries and dried plant materials like echinacea and ginseng; 37% in marine-based nutraceuticals such as
4. The symbol E indicates a standard error of between 7.5% and 14.99% or a coefficient of variation (CV) between 15.00% and 29.99%. When the figure is not accompanied by a symbol, the standard error is less than 7.49% or the CV is less than 14.99%. Some data with a higher standard error or CV are precise enough for some purposes.
Statistics Canada 14 Catalogue no. 88F0006XIE
glucosamine and chitosan products from algae, seaweed and kelp; and 28% in animal or micro organism based nutraceuticals such as elk velvet, essential fatty acids, enzymes and carotenoids. Among firms that were engaged in functional food activities, 44% added active ingredients to food, such as beta-glucan to muffins, and 14% used special production techniques, such as plant breeding methods, genetic modification and special livestock feeding. These techniques can produce, for example, tomatoes with enhanced lycopene levels, which has been shown to reduce the risk of prostate cancer; strawberries with increased levels of ellagic acid, which has been shown to reduce the risk of heart disease and certain cancers; and omega-3 eggs, which may reduce the risk for cardiovascular disease. Table 2: Participation of firms, by type of functional food or nutraceutical, 2002 Type of functional food or nutraceutical Percentage
of firmsNutraceuticals ground, dried, powdered and pressed from plant materials
51
Nutraceuticals extracted or purified from plants 45 Foods that have added active ingredients other than vitamins or minerals and have been scientifically demonstrated to provide health benefits beyond their basic nutritional functions
44
Nutraceuticals produced, extracted or purified from marine sources 37 Nutraceuticals that are produced, extracted or purified from animals and micro-organisms
28
Foods specially enhanced to contain more of a functional component, through plant breeding techniques, genetic modification, processing, or special livestock feeding techniques, that have been scientifically demonstrated to provide health benefits beyond their basic nutritional functions
14
Other 17 Note: Percentages do not add to 100 as respondents could choose multiple responses. Source: Statistics Canada, The Functional Foods and Nutraceuticals Survey - 2002.
Product lines Functional foods and nutraceuticals have demonstrated physiological benefits or provide protection against chronic diseases.5 ‘General well being’ product lines generated the most revenue for 27% of respondents, and ‘vascular heart health’ product lines generated the most for 17% of firms. While 15% of firms offered more than 50 product lines, two-thirds had fewer than 10. Some 57% of firms had product lines available for sale only in Canada and approximately one- 5. Health Canada. 1998. “Nutraceuticals/functional foods and health claims on foods.” Therapeutic Products Programme and the Food Directorate of the Health Protection Branch. (accessed July 30, 2005).
Statistics Canada 15 Catalogue no. 88F0006XIE
third of firms offered fewer than 10 product lines for sale only in Canada. One-quarter of firms sold products for export only.
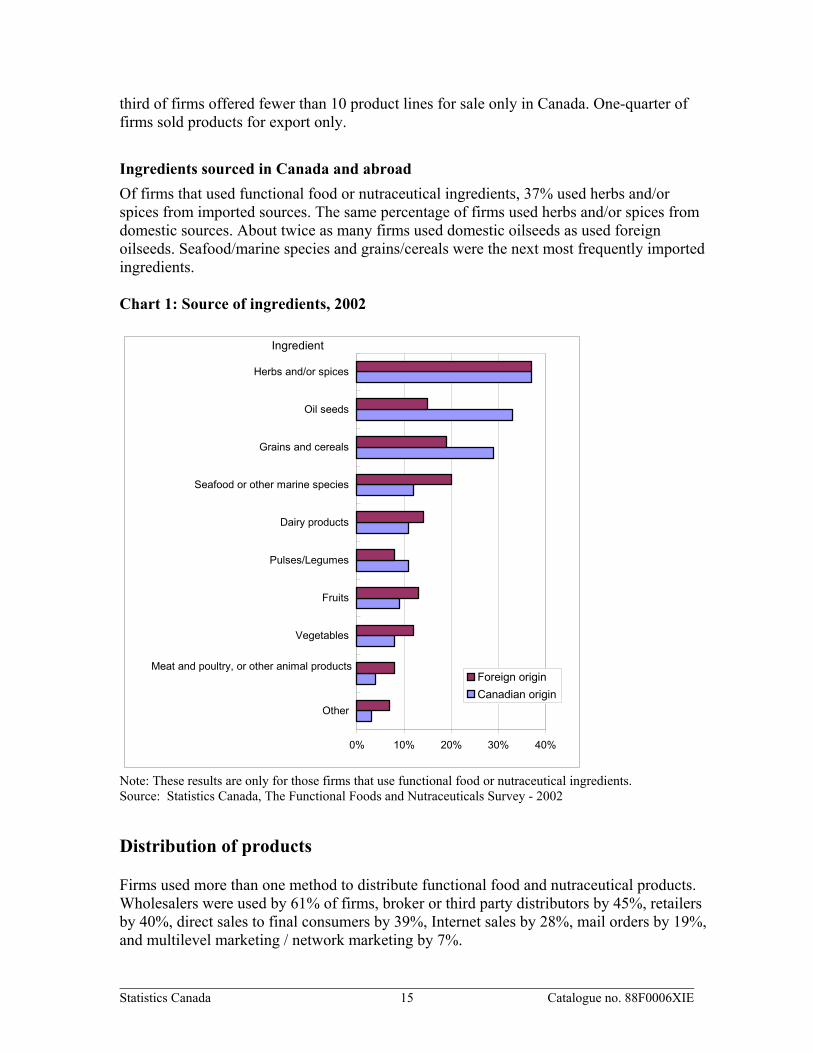
Ingredients sourced in Canada and abroad Of firms that used functional food or nutraceutical ingredients, 37% used herbs and/or spices from imported sources. The same percentage of firms used herbs and/or spices from domestic sources. About twice as many firms used domestic oilseeds as used foreign oilseeds. Seafood/marine species and grains/cereals were the next most frequently imported ingredients. Chart 1: Source of ingredients, 2002
0% 10% 20% 30% 40%
Other
Meat and poultry, or other animal products
Vegetables
Fruits
Pulses/Legumes
Dairy products
Seafood or other marine species
Grains and cereals
Oil seeds
Herbs and/or spices
Ingredient
Foreign originCanadian origin
Note: These results are only for those firms that use functional food or nutraceutical ingredients. Source: Statistics Canada, The Functional Foods and Nutraceuticals Survey - 2002
Distribution of products Firms used more than one method to distribute functional food and nutraceutical products. Wholesalers were used by 61% of firms, broker or third party distributors by 45%, retailers by 40%, direct sales to final consumers by 39%, Internet sales by 28%, mail orders by 19%, and multilevel marketing / network marketing by 7%.
Statistics Canada 16 Catalogue no. 88F0006XIE
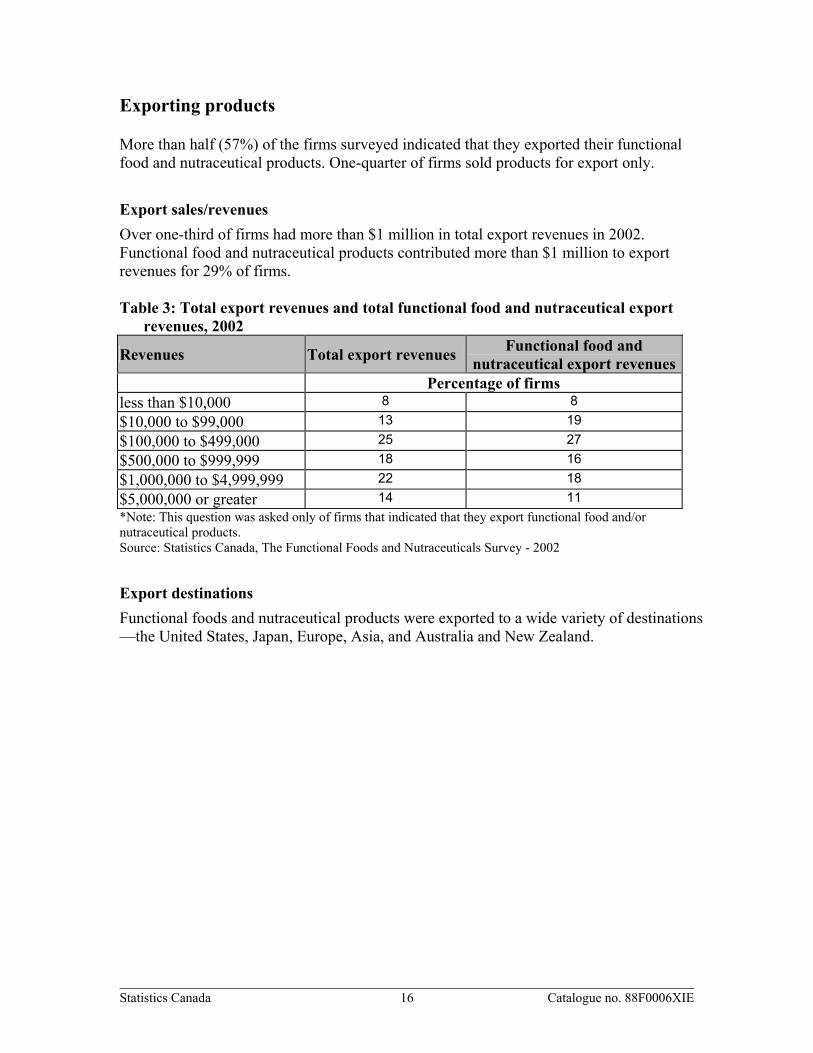
Exporting products More than half (57%) of the firms surveyed indicated that they exported their functional food and nutraceutical products. One-quarter of firms sold products for export only.
Export sales/revenues Over one-third of firms had more than $1 million in total export revenues in 2002. Functional food and nutraceutical products contributed more than $1 million to export revenues for 29% of firms. Table 3: Total export revenues and total functional food and nutraceutical export
revenues, 2002
Revenues Total export revenues Functional food and nutraceutical export revenues
Percentage of firms less than $10,000 8 8 $10,000 to $99,000 13 19 $100,000 to $499,000 25 27 $500,000 to $999,999 18 16 $1,000,000 to $4,999,999 22 18 $5,000,000 or greater 14 11 *Note: This question was asked only of firms that indicated that they export functional food and/or nutraceutical products. Source: Statistics Canada, The Functional Foods and Nutraceuticals Survey - 2002
Export destinations Functional foods and nutraceutical products were exported to a wide variety of destinations —the United States, Japan, Europe, Asia, and Australia and New Zealand.
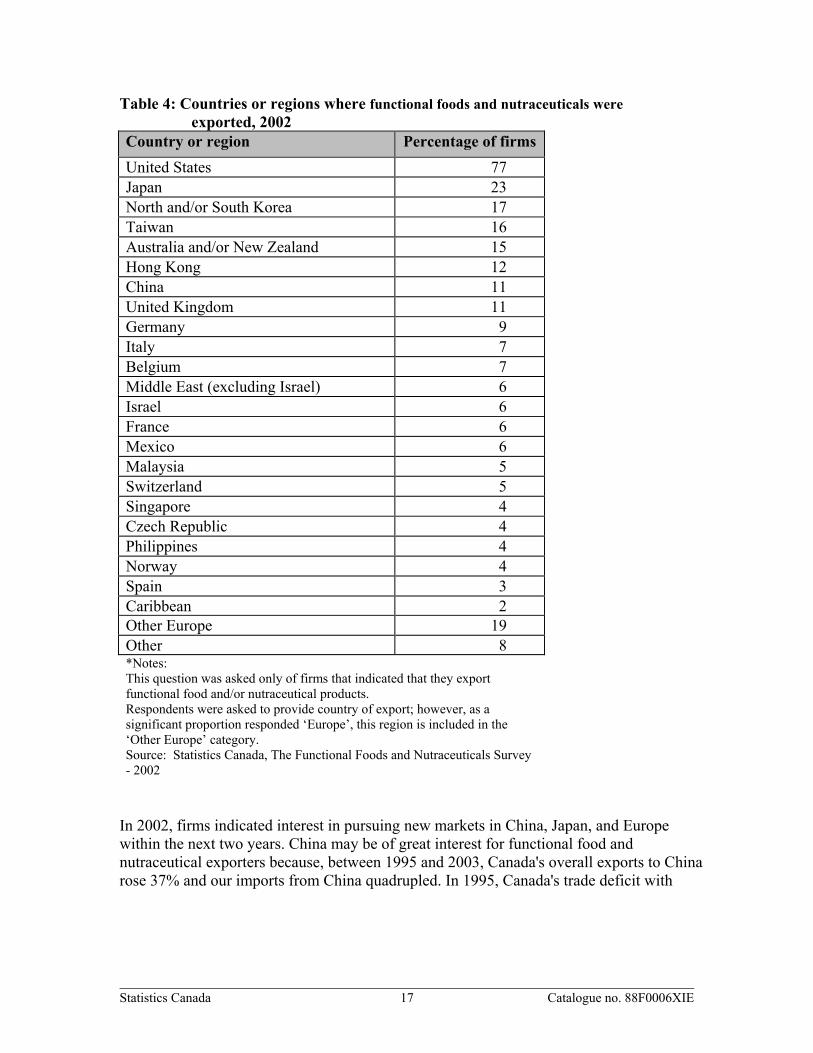
Statistics Canada 17 Catalogue no. 88F0006XIE
Table 4: Countries or regions where functional foods and nutraceuticals were exported, 2002
Country or region Percentage of firmsUnited States 77 Japan 23 North and/or South Korea 17 Taiwan 16 Australia and/or New Zealand 15 Hong Kong 12 China 11 United Kingdom 11 Germany 9 Italy 7 Belgium 7 Middle East (excluding Israel) 6 Israel 6 France 6 Mexico 6 Malaysia 5 Switzerland 5 Singapore 4 Czech Republic 4 Philippines 4 Norway 4 Spain 3 Caribbean 2 Other Europe 19 Other 8 *Notes: This question was asked only of firms that indicated that they export functional food and/or nutraceutical products. Respondents were asked to provide country of export; however, as a significant proportion responded ‘Europe’, this region is included in the ‘Other Europe’ category. Source: Statistics Canada, The Functional Foods and Nutraceuticals Survey - 2002
In 2002, firms indicated interest in pursuing new markets in China, Japan, and Europe within the next two years. China may be of great interest for functional food and nutraceutical exporters because, between 1995 and 2003, Canada's overall exports to China rose 37% and our imports from China quadrupled. In 1995, Canada's trade deficit with
Statistics Canada 18 Catalogue no. 88F0006XIE
China was $1.2 billion; by 2003, it was nearly $13.8 billion. Canada, as a large net exporter of resources, has benefited from this surge in demand.6
Europe was the region of greatest interest for functional food and nutraceutical exports in 2003 and 2004, perhaps because firms were looking to expand existing European markets.
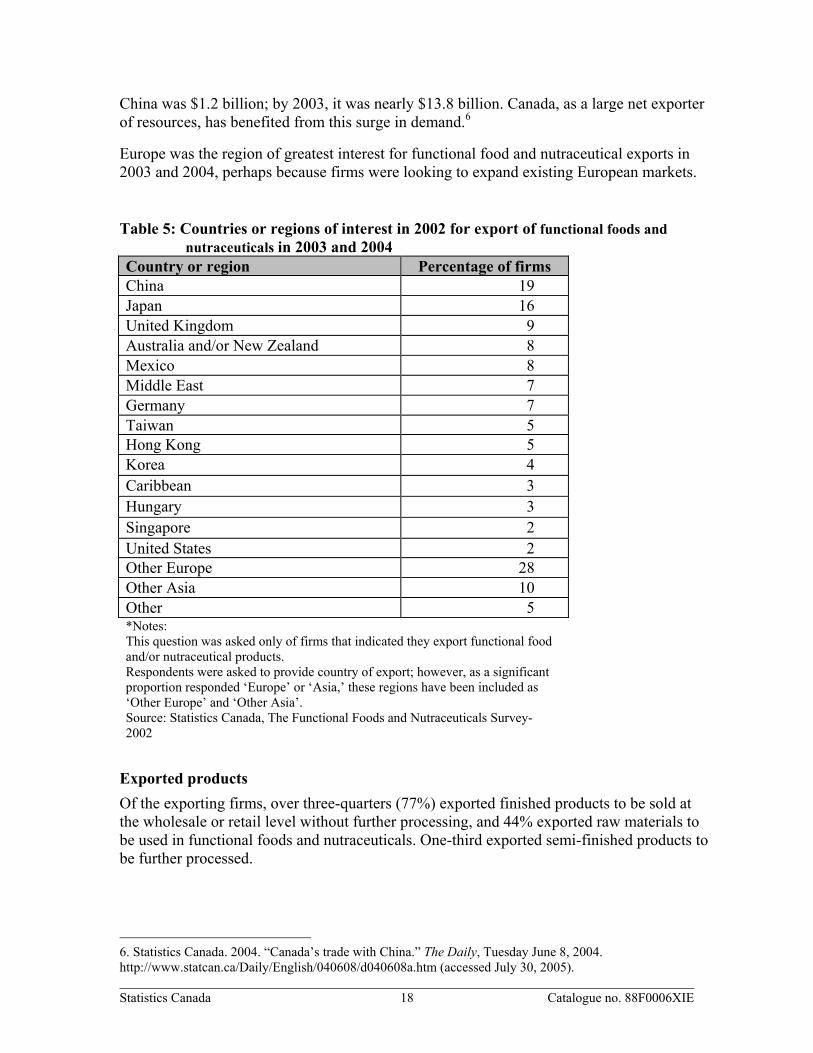
Table 5: Countries or regions of interest in 2002 for export of functional foods and
nutraceuticals in 2003 and 2004 Country or region Percentage of firms China 19 Japan 16 United Kingdom 9 Australia and/or New Zealand 8 Mexico 8 Middle East 7 Germany 7 Taiwan 5 Hong Kong 5 Korea 4 Caribbean 3 Hungary 3 Singapore 2 United States 2 Other Europe 28 Other Asia 10 Other 5 *Notes: This question was asked only of firms that indicated they export functional food and/or nutraceutical products. Respondents were asked to provide country of export; however, as a significant proportion responded ‘Europe’ or ‘Asia,’ these regions have been included as ‘Other Europe’ and ‘Other Asia’. Source: Statistics Canada, The Functional Foods and Nutraceuticals Survey- 2002
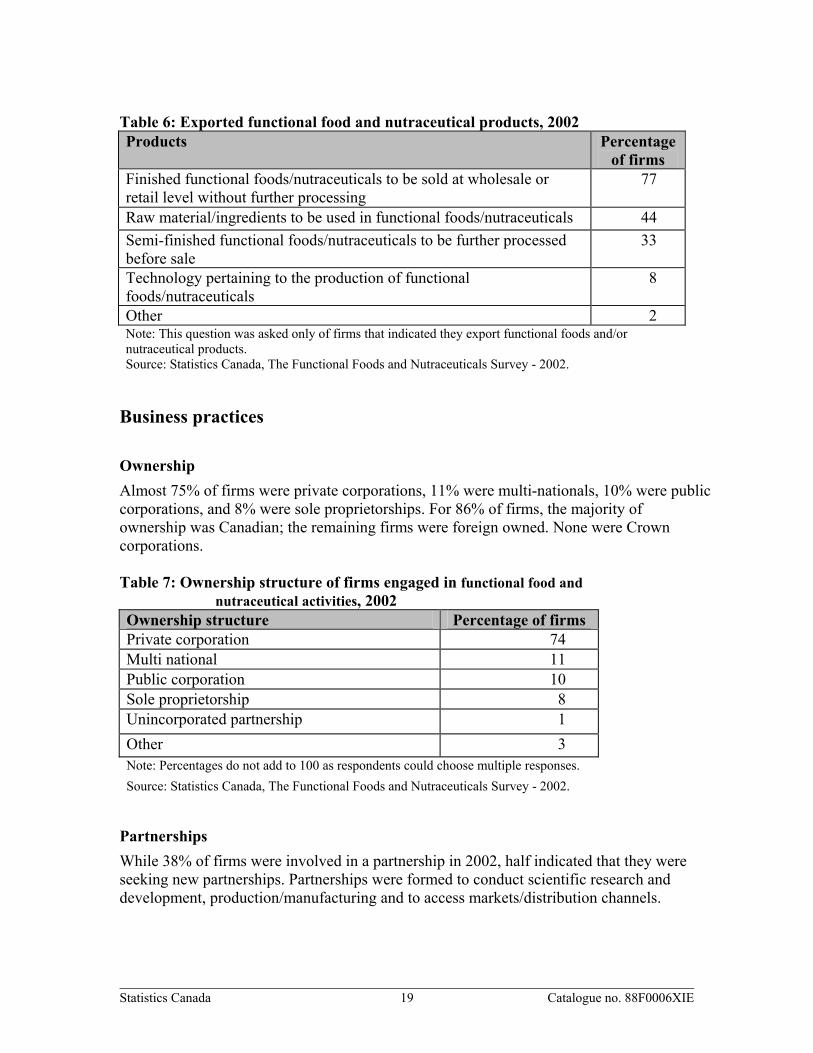
Exported products Of the exporting firms, over three-quarters (77%) exported finished products to be sold at the wholesale or retail level without further processing, and 44% exported raw materials to be used in functional foods and nutraceuticals. One-third exported semi-finished products to be further processed.
6. Statistics Canada. 2004. “Canada’s trade with China.” The Daily, Tuesday June 8, 2004. http://www.statcan.ca/Daily/English/040608/d040608a.htm (accessed July 30, 2005).
Statistics Canada 19 Catalogue no. 88F0006XIE
Table 6: Exported functional food and nutraceutical products, 2002 Products Percentage
of firms Finished functional foods/nutraceuticals to be sold at wholesale or retail level without further processing
77
Raw material/ingredients to be used in functional foods/nutraceuticals 44 Semi-finished functional foods/nutraceuticals to be further processed before sale
33
Technology pertaining to the production of functional foods/nutraceuticals
8
Other 2 Note: This question was asked only of firms that indicated they export functional foods and/or nutraceutical products. Source: Statistics Canada, The Functional Foods and Nutraceuticals Survey - 2002.
Business practices
Ownership Almost 75% of firms were private corporations, 11% were multi-nationals, 10% were public corporations, and 8% were sole proprietorships. For 86% of firms, the majority of ownership was Canadian; the remaining firms were foreign owned. None were Crown corporations. Table 7: Ownership structure of firms engaged in functional food and
nutraceutical activities, 2002 Ownership structure Percentage of firms Private corporation 74 Multi national 11 Public corporation 10 Sole proprietorship 8 Unincorporated partnership 1 Other 3 Note: Percentages do not add to 100 as respondents could choose multiple responses. Source: Statistics Canada, The Functional Foods and Nutraceuticals Survey - 2002.
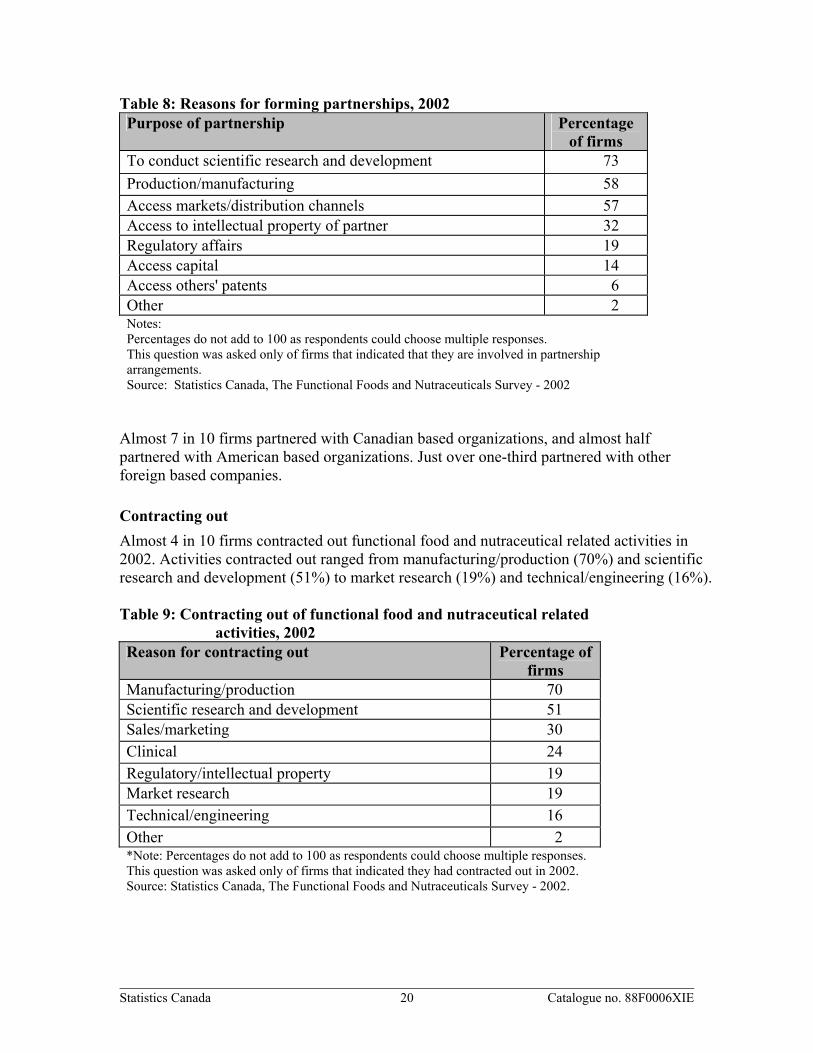
Partnerships While 38% of firms were involved in a partnership in 2002, half indicated that they were seeking new partnerships. Partnerships were formed to conduct scientific research and development, production/manufacturing and to access markets/distribution channels.
Statistics Canada 20 Catalogue no. 88F0006XIE
Table 8: Reasons for forming partnerships, 2002 Purpose of partnership Percentage
of firms To conduct scientific research and development 73 Production/manufacturing 58 Access markets/distribution channels 57 Access to intellectual property of partner 32 Regulatory affairs 19 Access capital 14 Access others' patents 6 Other 2 Notes: Percentages do not add to 100 as respondents could choose multiple responses. This question was asked only of firms that indicated that they are involved in partnership arrangements. Source: Statistics Canada, The Functional Foods and Nutraceuticals Survey - 2002
Almost 7 in 10 firms partnered with Canadian based organizations, and almost half partnered with American based organizations. Just over one-third partnered with other foreign based companies.
Contracting out Almost 4 in 10 firms contracted out functional food and nutraceutical related activities in 2002. Activities contracted out ranged from manufacturing/production (70%) and scientific research and development (51%) to market research (19%) and technical/engineering (16%). Table 9: Contracting out of functional food and nutraceutical related
activities, 2002 Reason for contracting out Percentage of
firms Manufacturing/production 70 Scientific research and development 51 Sales/marketing 30 Clinical 24 Regulatory/intellectual property 19 Market research 19 Technical/engineering 16 Other 2 *Note: Percentages do not add to 100 as respondents could choose multiple responses. This question was asked only of firms that indicated they had contracted out in 2002. Source: Statistics Canada, The Functional Foods and Nutraceuticals Survey - 2002.
Statistics Canada 21 Catalogue no. 88F0006XIE
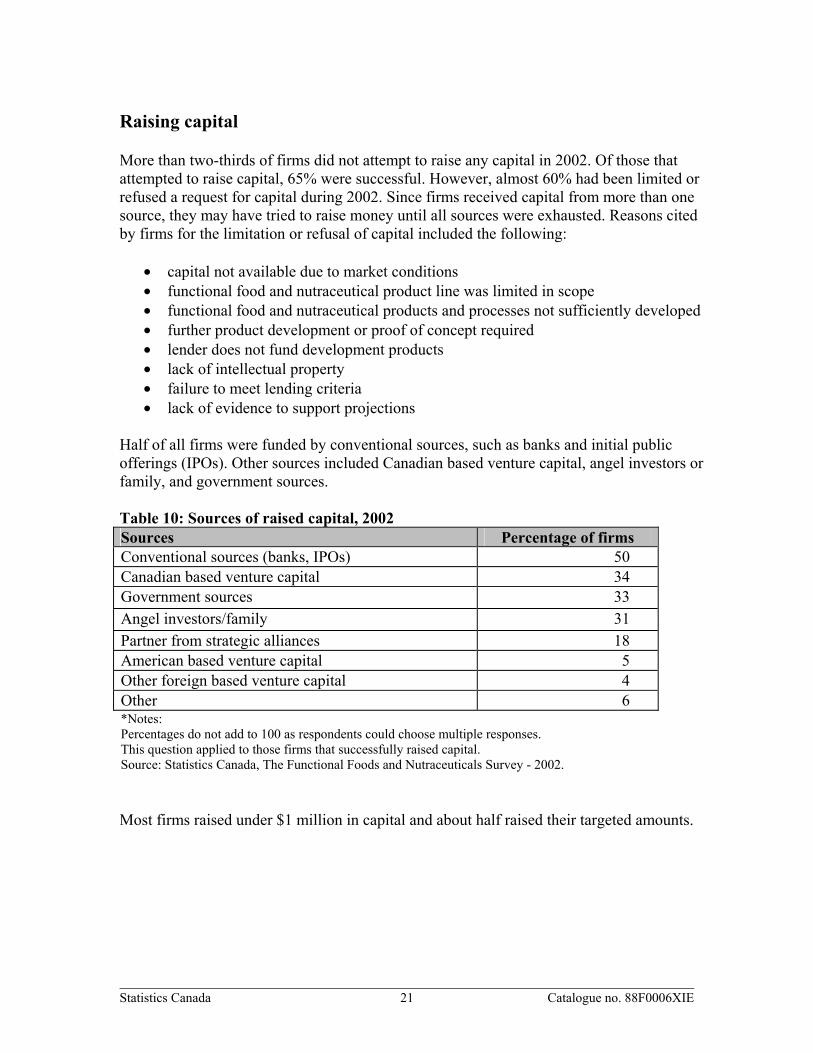
Raising capital More than two-thirds of firms did not attempt to raise any capital in 2002. Of those that attempted to raise capital, 65% were successful. However, almost 60% had been limited or refused a request for capital during 2002. Since firms received capital from more than one source, they may have tried to raise money until all sources were exhausted. Reasons cited by firms for the limitation or refusal of capital included the following:
• capital not available due to market conditions • functional food and nutraceutical product line was limited in scope • functional food and nutraceutical products and processes not sufficiently developed • further product development or proof of concept required • lender does not fund development products • lack of intellectual property • failure to meet lending criteria • lack of evidence to support projections
Half of all firms were funded by conventional sources, such as banks and initial public offerings (IPOs). Other sources included Canadian based venture capital, angel investors or family, and government sources. Table 10: Sources of raised capital, 2002 Sources Percentage of firms Conventional sources (banks, IPOs) 50 Canadian based venture capital 34 Government sources 33 Angel investors/family 31 Partner from strategic alliances 18 American based venture capital 5 Other foreign based venture capital 4 Other 6 *Notes: Percentages do not add to 100 as respondents could choose multiple responses. This question applied to those firms that successfully raised capital. Source: Statistics Canada, The Functional Foods and Nutraceuticals Survey - 2002. Most firms raised under $1 million in capital and about half raised their targeted amounts.
Statistics Canada 22 Catalogue no. 88F0006XIE
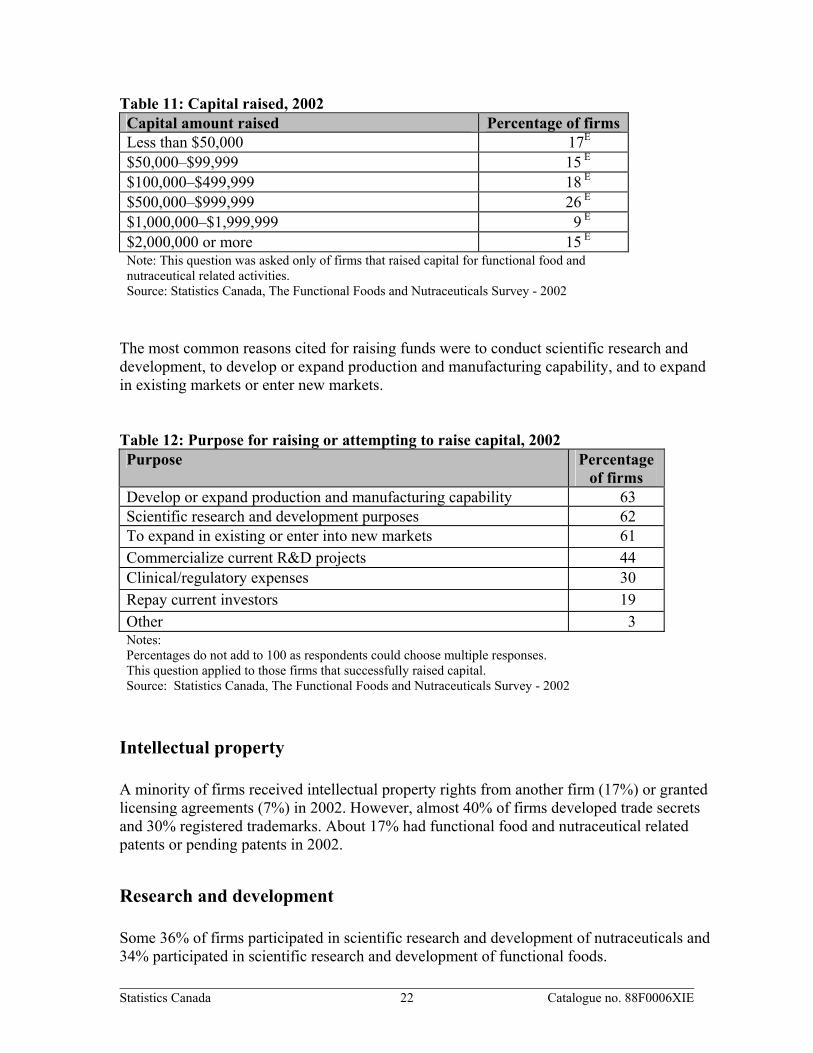
Table 11: Capital raised, 2002 Capital amount raised Percentage of firms Less than $50,000 17E $50,000–$99,999 15 E $100,000–$499,999 18 E $500,000–$999,999 26 E $1,000,000–$1,999,999 9 E $2,000,000 or more 15 E Note: This question was asked only of firms that raised capital for functional food and nutraceutical related activities. Source: Statistics Canada, The Functional Foods and Nutraceuticals Survey - 2002
The most common reasons cited for raising funds were to conduct scientific research and development, to develop or expand production and manufacturing capability, and to expand in existing markets or enter new markets. Table 12: Purpose for raising or attempting to raise capital, 2002 Purpose Percentage
of firms Develop or expand production and manufacturing capability 63 Scientific research and development purposes 62 To expand in existing or enter into new markets 61 Commercialize current R&D projects 44 Clinical/regulatory expenses 30 Repay current investors 19 Other 3 Notes: Percentages do not add to 100 as respondents could choose multiple responses. This question applied to those firms that successfully raised capital. Source: Statistics Canada, The Functional Foods and Nutraceuticals Survey - 2002
Intellectual property A minority of firms received intellectual property rights from another firm (17%) or granted licensing agreements (7%) in 2002. However, almost 40% of firms developed trade secrets and 30% registered trademarks. About 17% had functional food and nutraceutical related patents or pending patents in 2002.
Research and development Some 36% of firms participated in scientific research and development of nutraceuticals and 34% participated in scientific research and development of functional foods.
Statistics Canada 23 Catalogue no. 88F0006XIE
According to AAFC, Canadian companies have embraced research through innovative technologies to develop and enhance value-added constituents from both plants and animals. The food and food ingredient sector is a very important part of the Canadian nutrition industry. Canada has developed an industrial capacity in enhancing the nutritive value and functional properties of crops as well as in value-added processing and extracting nutritionally valuable constituents. For example, Canadian companies have developed specialized fractionation technologies for the processing of raw materials such as legumes, flax, soy, oats and other cereals into starch, protein and fibre. Canadian companies and researchers specializing in the standardization of herb and plant extracts have developed extraction, isolation, and purification expertise to manufacture herbal products to pharmaceutical standards. Companies have refined analytical methods to verify the potency and bio-activity of herbal extracts and other compounds. Canadian companies have also developed technologies and expertise in the extraction, characterization, stabilization, modification, and enhancement of the flavonoid constituents of fruits.
Impact of regulations Health Canada has jurisdiction over functional food and nutraceutical product regulations, and the Canadian Food Inspection Agency enforces these regulations. In 2003, Health Canada approved five generic health claims pertaining to the following:
• sodium, potassium and hypertension • calcium, vitamin D and osteoporosis • saturated fat, trans fat and heart disease • vegetables and fruits and some types of cancers • sugar alcohols and dental caries.
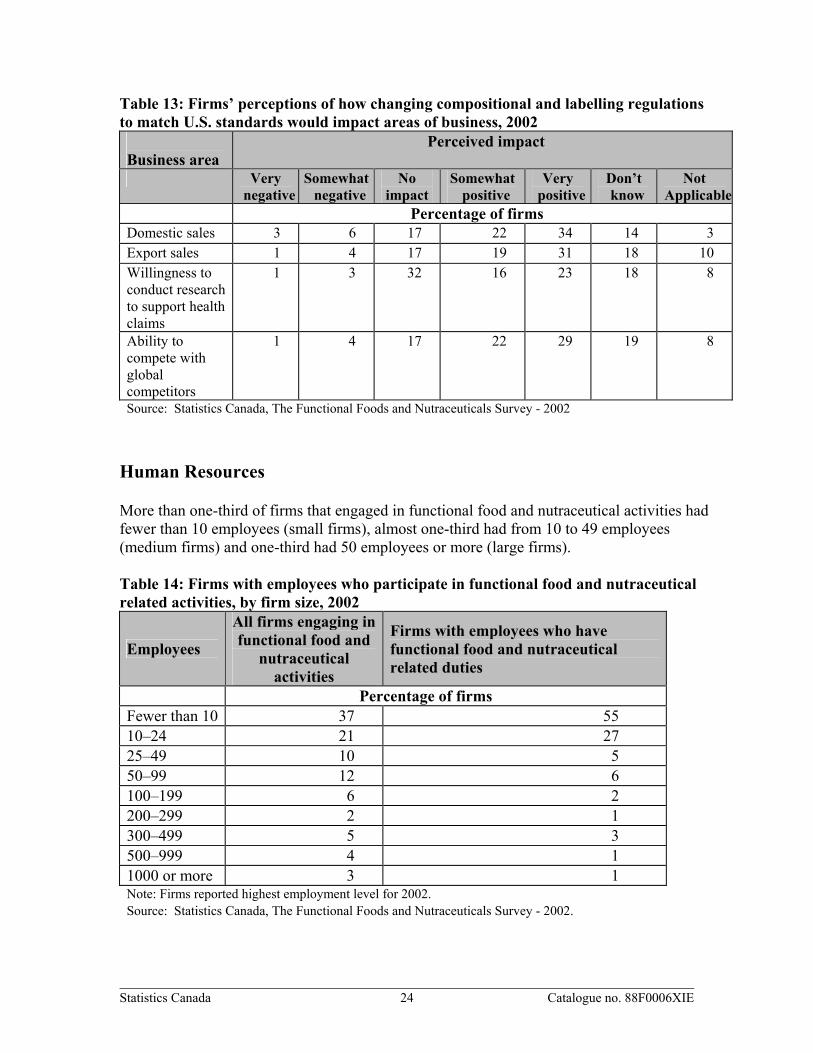
In 2002, over 60% of all firms believed that the ability to use claims about reducing the risk of diseases, generic health claims, and structure and function specific claims would have a positive impact on their domestic sales, their export sales and their ability to compete globally. If firms could make these types of claims, over half believed that they might be willing to conduct research to support them. Currently, Canada and the United States have different compositional and labelling requirements. Firms indicated that changing compositional and labelling regulations to match the US. standards would positively impact about half of all firms’ domestic and export sales as well as their ability to compete globally. About 40% of firms stated that they would be willing to conduct research to support health claims if the labelling regulations were changed while 32% of firms said that this would have no impact on them.
Statistics Canada 24 Catalogue no. 88F0006XIE
Table 13: Firms’ perceptions of how changing compositional and labelling regulations to match U.S. standards would impact areas of business, 2002 Business area
Perceived impact
Very negative
Somewhat negative
No impact
Somewhat positive
Very positive
Don’t know
Not Applicable
Percentage of firms Domestic sales 3 6 17 22 34 14 3 Export sales 1 4 17 19 31 18 10 Willingness to conduct research to support health claims
1 3 32 16 23 18 8
Ability to compete with global competitors
1 4 17 22 29 19 8
Source: Statistics Canada, The Functional Foods and Nutraceuticals Survey - 2002
Human Resources More than one-third of firms that engaged in functional food and nutraceutical activities had fewer than 10 employees (small firms), almost one-third had from 10 to 49 employees (medium firms) and one-third had 50 employees or more (large firms). Table 14: Firms with employees who participate in functional food and nutraceutical related activities, by firm size, 2002
Employees
All firms engaging in functional food and
nutraceutical activities
Firms with employees who have functional food and nutraceutical related duties
Percentage of firms Fewer than 10 37 55 10–24 21 27 25–49 10 5 50–99 12 6 100–199 6 2 200–299 2 1 300–499 5 3 500–999 4 1 1000 or more 3 1 Note: Firms reported highest employment level for 2002. Source: Statistics Canada, The Functional Foods and Nutraceuticals Survey - 2002.
Statistics Canada 25 Catalogue no. 88F0006XIE
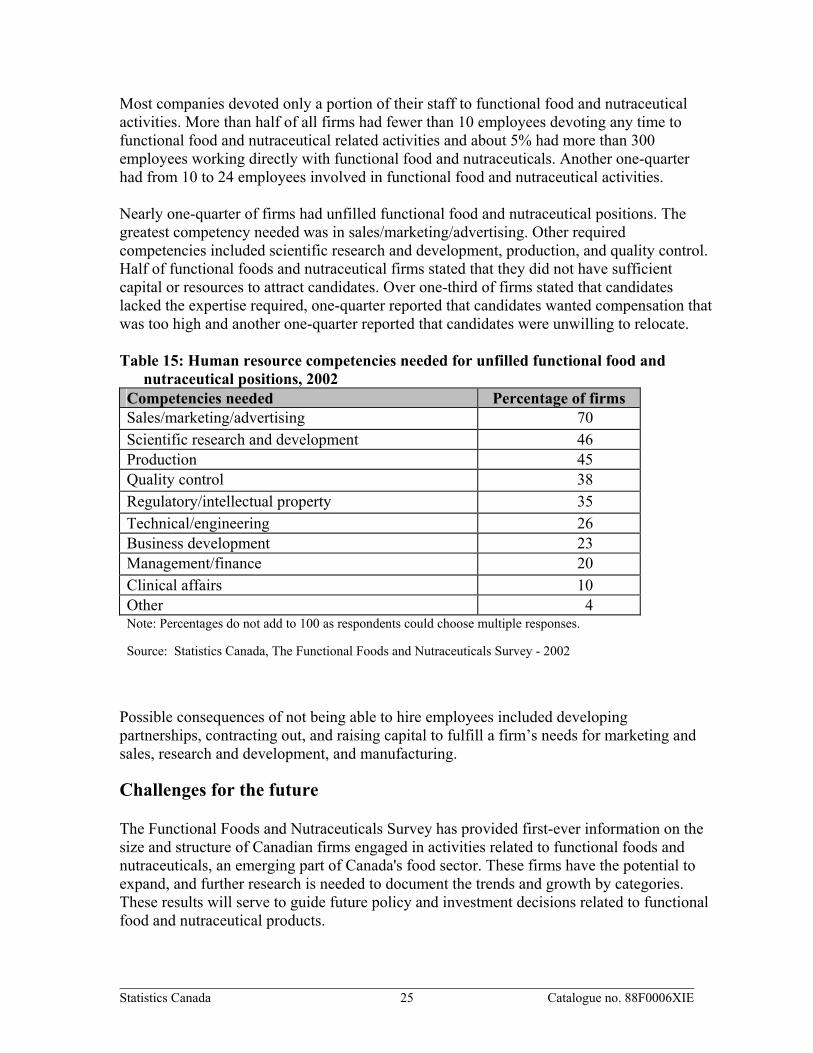
Most companies devoted only a portion of their staff to functional food and nutraceutical activities. More than half of all firms had fewer than 10 employees devoting any time to functional food and nutraceutical related activities and about 5% had more than 300 employees working directly with functional food and nutraceuticals. Another one-quarter had from 10 to 24 employees involved in functional food and nutraceutical activities. Nearly one-quarter of firms had unfilled functional food and nutraceutical positions. The greatest competency needed was in sales/marketing/advertising. Other required competencies included scientific research and development, production, and quality control. Half of functional foods and nutraceutical firms stated that they did not have sufficient capital or resources to attract candidates. Over one-third of firms stated that candidates lacked the expertise required, one-quarter reported that candidates wanted compensation that was too high and another one-quarter reported that candidates were unwilling to relocate. Table 15: Human resource competencies needed for unfilled functional food and
nutraceutical positions, 2002 Competencies needed Percentage of firms Sales/marketing/advertising 70 Scientific research and development 46 Production 45 Quality control 38 Regulatory/intellectual property 35 Technical/engineering 26 Business development 23 Management/finance 20 Clinical affairs 10 Other 4 Note: Percentages do not add to 100 as respondents could choose multiple responses.
Source: Statistics Canada, The Functional Foods and Nutraceuticals Survey - 2002
Possible consequences of not being able to hire employees included developing partnerships, contracting out, and raising capital to fulfill a firm’s needs for marketing and sales, research and development, and manufacturing.
Challenges for the future The Functional Foods and Nutraceuticals Survey has provided first-ever information on the size and structure of Canadian firms engaged in activities related to functional foods and nutraceuticals, an emerging part of Canada's food sector. These firms have the potential to expand, and further research is needed to document the trends and growth by categories. These results will serve to guide future policy and investment decisions related to functional food and nutraceutical products.
Statistics Canada 26 Catalogue no. 88F0006XIE
Bibliography Agriculture and Agri-Food Canada, Innovation in Canada: The Functional Food and Nutraceutical Industry, Innovation Profile, July 2002. Available: http://innovation.ic.gc.ca/gol/innovation/site.nsf/en/in02585.html (accessed on July 30, 2005). Health Canada, Therapeutic Products Programmes and the Food Directorate of the Health Protection Branch, (1998). Nutraceuticals/functional foods and health claims on foods. Available: http://www.hc-sc.gc.ca/food-aliment/ns-sc/ne-en/health_claims-allegations_sante/e_nutra-funct_foods (accessed on July 30, 2005). Canadian Gazette, Vol. 137, No. 1 — January 1, 2003 FOOD AND DRUGS ACT, Regulations Amending the Food and Drug Regulations Nutrition Labelling, Nutrient Content Claims and Health Claims http://canadagazette.gc.ca/partII/2003/20030101/html/sor11-e.html (accessed on July 31, 2005). Statistics Canada, The Daily, Tuesday June 8, 2004. Canada's Trade with China. http://www.statcan.ca/Daily/English/040608/d040608a.htm (accessed July 5, 2005).
Statistics Canada 27 Catalogue no. 88F0006XIE
Methodology Survey population AAFC provided Statistics Canada’s Small Business and Special Surveys Division with a list of firms involved in activities related to functional foods and nutraceuticals. Statistics Canada’s Science, Innovation and Electronic Information Division provided a list of companies that had indicated in the 2001 Canadian Biotechnology Survey that they were involved in functional food and/or nutraceutical related activities. These two lists were merged and duplicate units were identified. The final sample size for the survey was 576 firms. Responding to this survey is voluntary. Data are collected directly from survey respondents. The response rate for this survey was 48%. Sampling From 576 potential in-scope respondents, the survey had 276 responding questionnaires. A total of 147 of these respondents indicated involvement in functional food and nutraceutical activities. The remaining questionnaires were a mix of non-respondents, company deaths and out-of-scope businesses. Data quality and Standard error The standard error is a commonly used statistical measure indicating the sampling error of an estimate. The standard error and the coefficient of variation (standard error expressed as a percentage of the estimate) were used in the tables to provide an indication of the level of data quality of the estimate. The symbol E indicates a standard error of between 7.50% and 14.99% or a coefficient of variation (CV) between 15.00% and 29.99%. Some data with a higher standard error or CV are precise enough for some purposes; however one should proceed with caution. Reliable figures were not obtained through this survey for total sales, sales from functional foods and nutraceuticals, sales revenues, total spending on scientific research and development and total spending on functional food and nutraceutical research and development. As many respondents did not complete these questions, the standard error was too high for the numbers to be published.
Statistics Canada 28 Catalogue no. 88F0006XIE
Catalogued publications Statistical publication 88-202-XIE Industrial Research and Development, 2004 Intentions (with 2003 preliminary estimates and 2002 actual expenditures) 88-204-XIE Federal Scientific Activities, 2003-2004e (annual) 88-001-XIE Science Statistics (monthly) Volume 28 No. 1 Estimation of research and development expenditures in the higher education sector,
2001-2002 No. 2 Total spending on research and development in Canada, 1990 to 2003p, and provinces, 1990
to 2001 No. 3 Distribution of federal expenditures on science and technology by province and territories,
2001-2002 No. 4 Research and Development (R&D) expenditures of Private Non-Profit (PNP) organizations, 2002 No. 5 The provincial research organizations, 2001 No. 6 Scientific and technological (S&T) activities of provincial governments, 1994-95 to
2002-03 No. 7 Biotechnology scientific activities in selected federal government departments and agencies, 2002-2003 No. 8 Estimates of total spending on research and development in the health field in Canada, 1988 to 2003 No. 9 Industrial Research and Development, 2000 to 2004 No. 10 Estimation of Research and Development Expenditures in the Higher Education Sector, 2002-2003 No. 11 Federal government expenditures on scientific activities, 2004-2005p No. 12 Total spending on research and development in Canada, 1990 to 2004p, and provinces, 1990
to 2002
Statistics Canada 29 Catalogue no. 88F0006XIE
Volume 29 No. 1 Distribution of federal expenditures on science and technology by province and territories,
2002-2003 No. 2 Research and development (R&D) personnel in Canada, 1993 to 2002 No. 3 Biotechnology scientific activities in federal government departments and agencies, 2003-
2004 No. 4 Industrial Research and Development, 2001 to 2005 No. 5 Estimates of total spending on research and development in the health field in Canada, 1988
to 2004
Working papers - 1998 These working papers are available from the Science and Innovation Surveys Section of Statistics Canada, please contact: Science and Innovation Surveys Section Science, Innovation and Electronic Information Division Statistics Canada Ottawa, Ontario K1A 0T6 ST-98-01 A Compendium of Science and Technology Statistics, February 1998 ST-98-02 Exports and Related Employment in Canadian Industries, February 1998 ST-98-03 Job Creation, Job Destruction and Job Reallocation in the Canadian Economy,
February 1998 ST-98-04 A Dynamic Analysis of the Flows of Canadian Science and Technology Graduates
into the Labour Market, February 1998 ST-98-05 Biotechnology Use by Canadian Industry – 1996, March 1998 ST-98-06 An Overview of Statistical Indicators of Regional Innovation in Canada: A Provincial Comparison, March 1998 ST-98-07 Federal Government Payments to Industry 1992-93, 1994-95 and 1995-96,
September 1998 ST-98-08 Bibliometric Analysis of Scientific and Technological Research: A User’s Guide to
the Methodology, September 1998

Statistics Canada 30 Catalogue no. 88F0006XIE
ST-98-09 Federal Government Expenditures and Personnel on Activities in the Natural and Social Sciences, 1989-90 to 1998-99e, September 1998
ST-98-10 Knowledge Flows in Canada as Measured by Bibliometrics, October 1998 ST-98-11 Estimates of Canadian Research and Development Expenditures (GERD), Canada,
1987 to 1998e, and by Province 1987 to 1996, October 1998 ST-98-12 Estimation of Research and Development Expenditures in the Higher Education
Sector, 1996-97, November 1998 Working papers - 1999 ST-99-01 Survey of Intellectual Property Commercialization in the Higher Education Sector, 1998, February 1999 ST-99-02 Provincial Distribution of Federal Expenditures and Personnel on Science and
Technology, 1988-89 to 1996-97, June 1999 ST-99-03 An Analysis of Science and Technology Workers: Deployment in the Canadian
Economy, June 1999 ST-99-04 Estimates of Gross Expenditures on Research and Development in the Health Field
in Canada, 1970 to 1998e , July 1999 ST-99-05 Technology Adoption in Canadian Manufacturing, 1998, August 1999 ST-99-06 A Reality Check to Defining E-Commerce, 1999, August 1999 ST-99-07 Scientific and Technological Activities of Provincial Governments, 1990-1991 to
1998-1999e, August 1999 ST-99-08 Estimates of Canadian Research and Development Expenditures (GERD), Canada,
1988 to 1999e, and by Province, 1988 to 1997, November 1999 ST-99-09 Estimation of Research and Development Expenditures in the Higher Education
Sector, 1997-98 ST-99-10 Measuring the Attractiveness of R&D Tax Incentives: Canada and Major Industrial
Countries, December 1999 Working papers - 2000 ST-00-01 Survey of Intellectual Property Commercialization in the Higher Education Sector,
1999 April 2000 ST-00-02 Federal Government Expenditures and Personnel in the Natural and Social Sciences,
1990-91 to 1999-2000e, July 2000 ST-00-03 A Framework for Enhanced Estimations of Higher Education and Health R&D
Expenditures, by Mireille Brochu, July 2000
Statistics Canada 31 Catalogue no. 88F0006XIE
ST-00-04 Information and Communications Technologies and Electronic Commerce in Canadian Industry, 1999, November 2000
Working papers - 2001 ST-01-01 Estimates of Canadian Research and Development Expenditures (GERD), Canada,
1989 to 2000e, and by Province 1989 to 1998, January 2001 ST-01-02 Estimation of Research and Development Expenditures in the Higher Education
Sector, 1998-99, January 2001 ST-01-03 Innovation, Advanced Technologies and Practices in the Construction and Related
Industries: Provincial Estimates, 1999, January 2001 ST-01-04 Innovation, Advanced Technologies and Practices in the Construction and Related
Industries: National Estimates, 1999, February 2001 ST-01-05 Provincial Distribution of Federal Expenditures and Personnel on Science and
Technology 1990-91 to 1998-99, February 2001 ST-01-06 Estimates of Total Expenditures on Research and Development in the Health Field
in Canada, 1988 to 2000e, March 2001 ST-01-07 Biotechnology Use and Development, 1999, March 2001 ST-01-08 Federal Government Expenditures and Personnel in the Natural and Social Sciences,
1991-92 to 2000-2001e, April 2001 ST-01-09 Estimates of Research and Development Personnel in Canada, 1979 to 1999e, June
2001 ST-01-10 Innovation in Canadian Manufacturing: National Estimates, 1999, June 2001 ST-01-11 Practices and Activities of Canadian Biotechnology Firms: Results from the
Biotechnology Use & Development Survey -- 1999, August 2001 ST-01-12 Canadian Biotechnology Industrial Activities: Features from the 1997
Biotechnology Survey, September 2001 ST-01-13 Innovation in Canadian Manufacturing: Provincial Estimates, 1999, September 2001 ST-01-14 Estimates of Canadian Research and Development Expenditures (GERD), Canada,
1990 to 2001e, and by Province, 1990 to 1999, November 2001 ST-01-15 Estimation of Research and Development Expenditures in the Higher Education
Sector, 1999-2000, December 2001 Working papers - 2002 ST-02-01 Innovation and Change in the Public Sector: A Seeming Oxymoron, January 2002
Statistics Canada 32 Catalogue no. 88F0006XIE
ST-02-02 Measuring the Networked Economy, March 2002 ST-02-03 Use of Biotechnologies in the Canadian Industrial Sector: Results from the
Biotechnology Use & Development Survey - 1999, March 2002 ST-02-04 Profile of Spin-off Firms in the Biotechnology Sector: Results from the
Biotechnology Use and Development Survey - 1999, March 2002 ST-02-05 Scientific and Technological Activities of Provincial Governments 1992-1993 to
2000-2001e , April 2002 ST-02-06 Are we Managing our Knowledge? Results from the Pilot Knowledge Management
Practices Survey, 2001, April 2002 ST-02-07 Estimates of Total Expenditures on Research and Development in the Health Fields
in Canada, 1988 to 2001p, May 2002 ST-02-08 Provincial Distribution of Federal Expenditures and Personnel on Science and
Technology, 1991-92 to 1999-2000, May 2002 ST-02-09 An Overview of Organisational and Technological Change in the Private Sector,
1998-2000, June 2002 ST-02-10 Federal Government Expenditures and Personnel in the Natural and Social Sciences,
1992-1993 to 2001-2002p, June 2002 ST-02-11 Innovation in the Forest Sector, June 2002 ST-02-12 Survey of Innovation 1999, Methodological Framework: Decisions Taken and
Lessons Learned, June 2002 ST-02-13 Innovation and the Use of Advanced Technologies in Canada's Mineral Sector:
Metal Ore Mining, July 2002 ST-02-14 Estimation of Research and Development Expenditures in the Higher Education
Sector, 2000-2001, December 2002 ST-02-15 Estimates of Canadian Research and Development Expenditures (GERD), Canada,
1991 to 2002p, and by Province 1991 to 2000, December 2002 ST-02-16 Survey of Innovation 1999, Statistical Tables, Manufacturing Industries, Canada,
December 2002 ST-02-17 Determinants of Product and Process Innovations in Canada's Dynamic Service
Industries, December 2002 Working papers - 2003 ST-03-01 A Comparison of International R&D Performance: An Analysis of Countries That
Have Significantly Increased Their GERD/GDP Ratios During the Period 1989-1999, February 2003
Statistics Canada 33 Catalogue no. 88F0006XIE
ST-03-02 Who's Sharing What With Whom? How Canadian Businesses Used Electronic Networks to Share Information in 2001, February 2003
ST-03-03 How is the Canadian Biotechnology Evolving: A Comparison of the 1997 and 1999
Biotechnology Use and Development Surveys, March 2003 ST-03-04 Scientific and Technological Activities of Provincial Governments, 1993-1994 to
2001-2002e, March 2003 ST-03-05 Features of Canadian biotech innovative firms: results from the biotechnology use
and development survey - 2001, March 2003 ST-03-06 Innovation is a social process, March 2003 ST-03-07 Knowledge management in practice in Canada, 2001, March 2003 ST-03-08 Provincial distribution of federal expenditures and personnel on science and
technology, 1994-95 to 2000-2001, April 2003 ST-03-09 Federal government expenditures and personnel in the natural and social sciences,
1993-1994 to 2002-2003, April 2003 ST-03-10 Estimates of total expenditures on research and development in the health field in
Canada, 1988 to 2002p , November 2003 ST-03-11 Estimates of research and development personnel in Canada, 1979 to 2000,
November 2003 ST-03-12 Survey of intellectual property commercialization in the higher education sector,
2001, November 2003 ST-03-13 Bioproducts development by Canadian biotechnology firms: findings from the 2001
Biotechnology Use and Development Survey, December 2003 Working papers - 2004 ST-04-01 Starting the new century: technological change in the Canadian private sector, 2000-
2002, January 2004 ST-04-02 Estimation of research and development expenditures in the higher education sector,
2001-2002, January 2004 ST-04-03 Estimates of Canadian research and development expenditures (GERD), Canada,
1992 to 2003p, and by province 1992 to 2001, January 2004 ST-04-04 The many guises of innovation: what we have learnt and where we are heading,
2003, January 2004 ST-04-05 Provincial distribution of federal expenditures and personnel on science and
technology, 1995-96 to 2001-2002, February 2004
Statistics Canada 34 Catalogue no. 88F0006XIE
ST-04-06 Biotechnology use and development survey: methodology, issues and responses, February 2004
ST-04-07 An historical comparison of technological change, 1998-2000 and 2000-2002, in the
private and public sectors, March 2004 ST-04-08 Technological change in the public sector, 2000-2002, March 2004 ST-04-09 Regional disparities of research and development in the business services sector,
April 2004 ST-04-10 Innovative firms: A look at small firms, May 2004 ST-04-11 Scientific and technological activities of provincial governments, 1994/95 to
2002/2003, June 2004 ST-04-12 Federal government payments to industry, 1997-1998 to 2001-2002, July 2004 ST-04-13 Community innovation: Industrial specialization in Canadian cities, July 2004 ST-04-14 Estimates of total expenditures on research and development in the health field in
Canada, 1988 to 2003, July 2004 ST-04-15 Community innovation: innovation performance of manufacturing firms in
Canadian communities, September 2004 ST-04-16 List of papers published by Kluwer Academic Publishers, in the Economics of
Science, Technology and Innovation Series, October 2004 ST-04-17 Trends in Canadian biotechnology activity: 1997 to 2001, October 2004 ST-04-18 Public sector technology transfer in Canada, 2003, November 2004 ST-04-19 Estimation of research and development expenditures in the higher education sector,
2002-2003, November 2004 ST-04-20 Estimates of Canadian research and development expenditures (GERD), Canada,
1993 to 2004p, and by province 1993 to 2002, December 2004 ST-04-21 Characteristics of firms that grow from small to medium size: growth factors--
interviews and measurability, 1999, December 2004 ST-04-22 Characteristics of firms that grow from small to medium size: innovation and
growth in small manufacturing firms, 1997 to 1999, December 2004 Working papers - 2005 ST-05-01 Federal government expenditures and personnel in the natural and social sciences,
1995/96 to 2004/05, January 2005 ST-05-02 Provincial distribution of federal expenditures and personnel on science and
technology, 1996-97 to 2002-03, January 2005
Statistics Canada 35 Catalogue no. 88F0006XIE
ST-05-03 Industrial R&D statistics by region, 1994 to 2002, January 2005 ST-05-04 Knowledge sharing succeeds: how selected service industries rated the importance
of using knowledge management practices to their success, February 2005 ST-05-05 Characteristics of firms that grow from small to medium size: Industrial and
geographic distribution of small high-growth firms, February 2005 ST-05-06 Summary: Joint Statistics Canada – University of Windsor workshop on intellectual
property commercialization indicators, Windsor, November 2004, March 2005 ST-05-07 Summary: Meeting on commercialization measurement, indicators, gaps and
frameworks, Ottawa, December 2004, March 2005 ST-05-08 Estimates of research and development personnel in Canada, 1979 to 2002, April
2005 ST-05-09 Overview of the Biotechnology Use and Development Survey – 2003, April 2005 ST-05-10 Access to Financing Capital by Canadian Innovative Biotechnology Firms, April
2005 ST-05-11 Scientific and technological (S&T) activities of provincial governments and
provincial research organizations, 1995-96 to 2003-04, September 2005
Research papers – 1996-2002 No. 1 The State of Science and Technology Indicators in the OECD Countries, by Benoit
Godin, August 1996 No. 2 Knowledge as a Capacity for Action, by Nico Stehr, June 1996 No. 3 Linking Outcomes for Workers to Changes in Workplace Practices: An
Experimental Canadian Workplace and Employee Survey, by Garnett Picot and Ted Wannell, June 1996
No. 4 Are the Costs and Benefits of Health Research Measurable?, by M.B. Wilk,
February 1997 No. 5 Technology and Economic Growth: A Survey, by Petr Hanel and Jorge Niosi, April 1998 No. 6 Diffusion of Biotechnologies in Canada, by Anthony Arundel, February 1999 No. 7 Barriers to Innovation in Services Industries in Canada, by Pierre Mohnen and Julio
Rosa, November 1999 No. 8 Explaining Rapid Growth in Canadian Biotechnology Firms, by Jorge Niosi,
August 2000
Statistics Canada 36 Catalogue no. 88F0006XIE
No. 9 Internationally Comparable Indicators on Biotechnology: A Stocktaking, a Proposal for Work and Supporting Material, by W. Pattinson, B. Van Beuzekom and A. Wyckoff, January 2001
No. 10 Analysis of the Survey on Innovation, Advanced Technologies and Practices in the
Construction and Related Industries, 1999, by George Seaden, Michael Guolla, Jérôme Doutriaux and John Nash, January 2001
No. 11 Capacity to Innovate, Innovation and Impact: The Canadian Engineering Services
Industry, by Daood Hamdani, March 2001 No. 12 Patterns of Advanced Manufacturing Technology (AMT) Use in Canadian
Manufacturing: 1998 AMT Survey Results, by Anthony Arundel and Viki Sonntag, November 2001