functional analysis: a fundamental empirical … analysis: a fundamental empirical study for reverse...
TRANSCRIPT

Corresponding Author: K. L. Wood, [email protected], (512) 471-0095. Submitted to the 1997 ASME DTM Conference.
Functional Analysis: A Fundamental Empirical Study for Reverse Engineering, Benchmarking, and Redesign
Aaron D. Little, Graduate Research Assistant
and
Kristin L. Wood, Associate Professor
Department of Mechanical Engineering The University of Texas
ETC 5.160 Austin, TX 78712-1063
Abstract
At a basic level, product design composes three primary tasks: specification development, conceptual and configuration design, and product refinement. Customer needs analysis, product benchmarking, and business case analysis are fundamental to specification development, whereas conceptual design and product refinement entail functional analysis, the generation of solution principles and product geometry, concept selection, mathematical modeling, prototyping, and Taguchi analysis for variability. In this paper, we focus on an advanced method for functional analysis, a critical component of this process. This method demonstrates clear ties to customer needs, and is based on an empirical study of approximately 60 household consumer products. As part of this study, a common vocabulary for product functions and flows is developed and applied to the consumer products. House of Quality results are then used to correlate customer importance to the product functions. Data from these correlations provide a basis for determining critical functions and flows across all products and within important product domains, such as material processors and beverage brewers. From this study, we discuss how the results can be applied to product testing and benchmarking, design by analogy, the identification of functional groups and dependencies, and design education.
1. Introduction: Background and Motivation
Many research, educational, and industrial applications require a basic understanding of functionality. The concept of transforming function to form has been discussed and improved widely among researchers through conceptual design methods (Paul and Beitz, 1984; Ullman, 1992; Ulrich and Eppinger, 1995; Cross, 1994; Hubka et al., 1988; Wood and Otto, 1997); however, the link between customer needs and functional analysis has been unclear. Current methods for linking customer needs, such as “task listing” (Otto and Wood, 1996), simply assure that the needs are expressed in the function structure. This approach maps customer needs to material, energy, and signal flows to generate sub-function sequences; however, the finished functional analysis shows little or no preference from one sub-function to the next. This deficiency results because design methodologies, such as Paul and Beitz’s and Ullman’s, require
Little & Wood. Functional Analysis...
2
engineering specifications to be determined early in the design process, directly after the customer needs are obtained. This approach assumes the development of a novel product or class of products, not the evolution of current products. Because of the prevalence of product evolution or redesign, the opportunity exists to feed customer need data directly through several crucial phases in the “reverse engineering” design process. The “reverse engineering” design methodology by definition requires a product to be predicted, observed, disassembled, and “experienced” before specifications are determined and conceptual design begins (Ingle 1994; Otto and Wood, 1996). Therefore, it is natural to develop a direct relationship between customer needs and the function-flows of a product.
Customer needs are the driving force in all design and are currently related directly to engineering specifications (Ulrich and Eppinger 1995, Akao 1990, Paul and Beitz, 1984, Ullman, 1992) using tools such as the House of Quality (Hauser and Clausing, 1985). The initial motivation for the research reported in this paper was to develop a link between customer needs and functional analysis so that the function-flow data could be used in other areas, such as determining measurement equipment for a “reverse engineering tool-box.”. In this case, after determining common measurements for basic function-flow combinations, the relative importance of sub-functions in a product can be used to determine what to measure. This provides an alternative general approach for selecting product specifications directly from customer need weighted function-flows. By extracting function-flow information from a wide array of products, which have been directly linked to the customer needs, we can further understand the need-function-flow-form representation in engineering design.
In this paper, we will develop a new method which maps customer needs to the functional
analysis of current products. This method will be applied to previously redesigned products utilizing over 100 person years of work, including case studies from coursework and research at The University of Texas, and product development with industry. Immediate results will indicate the relative importance of function-flows within single products and more importantly within classes of products. The near-term goal is then to link the function-flows to measurements, so that measurement equipment can be selected for a product classes, in addition to aiding the designer in determining what to measure. Other objectives include developing a vocabulary for a consistent and complete functional specification which is necessary for bringing previous redesigns to a common basis. In addition, a product classification hierarchy will be developed to effectively group products. With these results, the intent is to use this methodology to understand and further develop techniques for product evolution such as the alternative general approach for determining product specifications.
The following section will detail the methodology step-by-step with examples from various
products used in the collection of data. The paper will end with the final results and a brief discussion with example applications.
2. Empirical Study: An Approach for Relating Product Function and Customer Needs
The following methodology, motivated by a sander power tool product in Figure 1, can be generalized for use in a variety of applications; however, we will focus on using the results for helping a designer determine what to measure in products. The methodology works for both single and multiple products with additional steps required for multiple products in order to normalize the results. For this application, results for a single product can be used to determine what to measure in one product, and the results from multiple products can help determine what tools to select for a given product classification.

Little & Wood. Functional Analysis...
3
connectsander
enable on conditionenergy
transformenergy
startsurfaceremoval
maintaincontrol
debrisremoval?
provideairflow
harnessairflow
attach debriscontainer
applyabrasive
removeabrasive
dispose ofdebris
collectdebris
is sandingcomplete
120 AC
roughsurface
humanenergy
newabrasive
debris
heat
status
debrislevel
abrasive
debris
importelectricity
actuateelectricity
regulateelectricity
convertelectricity tomech. rot.
removematerial
stabilizeproduct
indicatevolume
convertmech.rot. topneumatic
channelair
securematerial
securematerial
separatematerials
exportmaterial
storematerial
indicatestatus
120 AC
roughsurface
humanenergy
newabrasive
debr
heat
statu
debrislevel
abrasiv
debris
rotational energy
pneumatic
debrishumanenergy
rotational energy
debris
pneumatic
humanenergy
01
23
45
6
Sub-Functions
Imp
ort
ance
Normalized
Palm Grip Sander Electric Toothbrush . . . N
Basic Functions/Flows
Customer Needs 1. Quiet Operation 4 2. Lightweight 3 . . . N
Weighted Functions 1. Import Human Force 2. Electricity to
Rotational Energy . . . N
Verified Functions 1. Import Material 2. Import
Electricity 3. Indicate Status . . . N
Product Matrix
Transform Function Structures
.
.
. N
.
.
. N
.
.
. N
.
.
. N
.
.
. N
Importance Ratings
Start with N Products
Determine measurements and other application.

Little & Wood. Functional Analysis...
4
De
Wal
t San
der
Rea
l Pow
er T
ool S
hop
Pne
umat
ic A
ir R
atch
etP
rest
o P
opco
rn P
oppe
rS
alto
n S
andw
ich
Mak
erK
rups
Che
ese
Gre
ater
Daz
ey F
ruit
& V
eg. S
trip
per
Sup
er M
axx
Bal
l Sho
oter
Sal
on S
erie
s 79
5 H
air
Dry
erP
rest
o S
alad
Sho
oter
Channel Import Material 0 0 0 # 1 1 0 6 0 2Import Air 0 0 6 1 0 0 0 1 2 0Import Liquid 0 0 0 0 0 0 0 0 0 0Import Hand 0 0 0 0 0 0 0 0 0 0Import Human Force # 0 # 8 # # # # 6 9Import Electricity 2 0 0 1 1 0 8 0 2 2Import Pneumatics 0 0 1 0 0 0 0 0 0 0Import Linear Force 0 0 0 0 0 0 0 0 0 0Import Solar Energy 0 0 0 0 0 0 0 0 0 0Export Material 2 0 0 4 0 7 0 0 0 2Export Air 0 0 0 0 0 0 0 0 0 0Export Liquid 0 0 0 0 0 0 0 0 0 0
De
Wa
lt S
an
de
rR
ea
l Po
we
r T
oo
l Sh
op
Pn
eu
ma
tic A
ir R
atc
he
tP
rest
o P
op
corn
Po
pp
er
Sa
lton
Sa
nd
wic
h M
ake
rK
rup
s C
he
ese
Gre
ate
rD
aze
y F
ruit
& V
eg
. S
trip
pe
rS
up
er
Ma
xx B
all
Sh
oo
ter
Sa
lon
Se
ries
79
5 H
air
Dry
er
Pre
sto
Sa
lad
Sh
oo
ter
ChannelImport Material 9 1 1 4 1Import Air 6 1 1 1Import LiquidImport HandImport Human Force # # 6 # # 6 9 4 5Import Electricity 1 1 1 4 1 1Import Pneumatics 1Import Linear ForceImport Solar EnergyExport Material 1 3 7 1Export AirExport Liquid
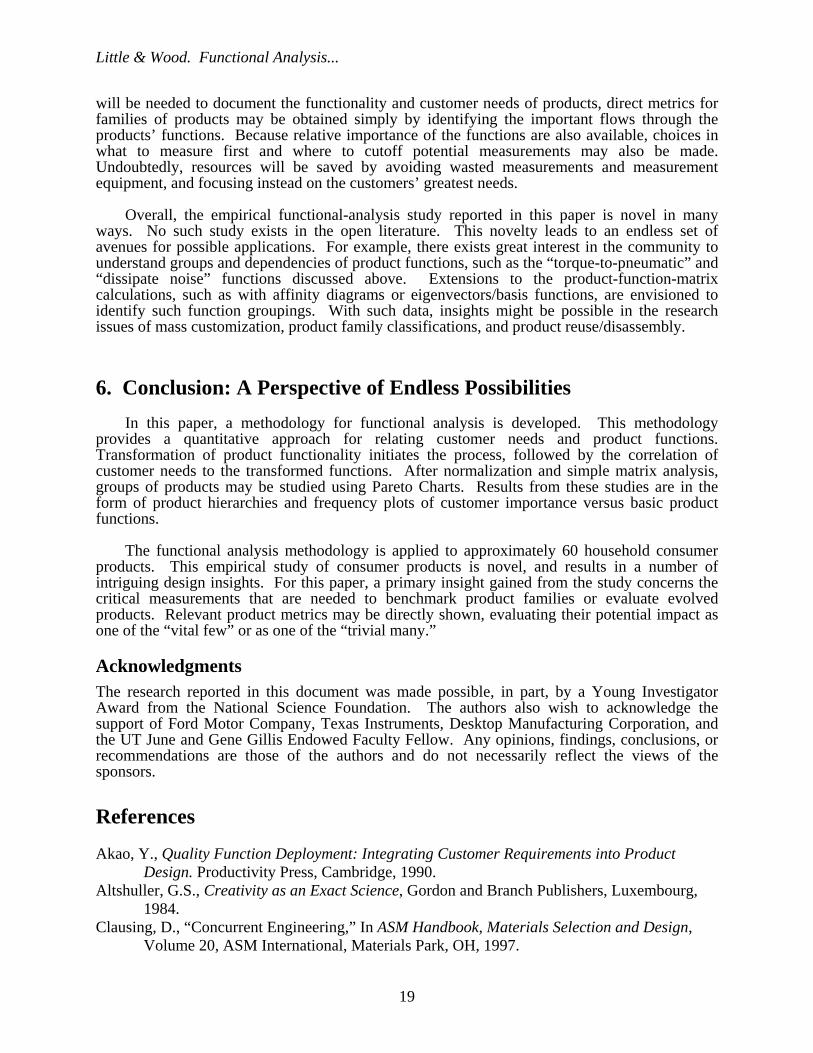
Figure 1 Graphical representation of methodology.

Little & Wood. Functional Analysis...
5
Relating customer needs to function-flows requires five steps (Figure 1), beginning with N products and ending with a list of weighted sub-functions, which for this application develops a list of suggested measurements. Before the procedure can be initiated, the designer must have completed the determination of customer needs and developed a function structure for the product. It is important to use a thorough method which weights the gathered customer needs, such as (Otto, 1996) or the House of Quality (Hauser and Clausing, 1985), in order to have a strong foundation to relate to the function-flows. In addition, any one of various methods can be used to develop a function structure (Pahl and Beitz, 1984; Miles, 1972; Hubka, et al. 1988; Ullman 1993; Shimomura, et al. 1995; Otto and Wood 1996); however, incorporating the function vocabulary in the first step of the methodology will eliminate having to transform the completed function structure.
In order to develop a common product basis for comparison, the first step in the
methodology transforms the function structures using a consistent vocabulary (Figure 1). Then, before weighting the sub-functions, they are screened to maintain the same level of complexity and to add/delete sub-functions which aren’t represented in the customer needs. The sub-functions are “weighted” or correlated to the customer need importance ratings, and each product’s results are added to a function product matrix where the results are normalized with respect to depth of customer needs and number of functions. The results are then plotted and applied to a given application.
Step 1: Function Structure Transform
The first step in the methodology involves transforming a product’s function structure into a common set of basic functions and flows (FigureÊ2). For this step, we developed a formal common basis of product functions and flows, as discussed below. We also sought to insure consistency and completeness of the common basis, and the ability to evolve the set of functions and flows as additional product domains are investigated.
There are various methods for classifying functions including (Fadel et al. 1996; Pahl and Beitz 1984; Collins 1976; Hundal 1990, Miles 1972, Wood and Otto 1997). Based on a careful study of this past research, the function classes of our representation (Figure 2) were developed primarily from Hundal’s (1990) work with a few major changes including a separate category for signals and a new category for functions which firmly support an energy or material into a defined location. Fadel’s et al. (1996) work gives a detailed view into a variety of function classifications and noticed the lack of a support/position category. This support category includes functions which position, secure, stabilize, etc. FigureÊ2 shows our extension of this function class and related synonyms. In an effort to insure completeness of our representation, a comparison study was completed with past research. A critical component of this comparison focused on the Theory of Inventive Problem Solving (Altshuller, 1984), similar to the method used by Malmqvist et al. (1996). Results revealed that the thirty TIPS functions, developed from analyzing over 2 million patents, are all represented by the function classes of Figure 2.
Based on this result, we extended the function classes to the basic functions implemented by consumer products. Basic functions, in this sense, uniquely operate on flows in a product to produce a desired performance. These basic functions and their critical flows, as listed in Figure 2, compose the formal common basis for our representation. Product function structures are converted to these functions and flows for consistency and to obtain meaningful results. If function structures were converted just to the high-level function classes or the three high-level flows of material, energy, and signal, significant information would be lost, and too generic of a

Little & Wood. Functional Analysis...
6
representation would be obtained. The thirty-one basic functions and eight function classes with formal definitions are located in AppendixÊA, assuming household consumer products from our study. The basic functions and flows can be extended from our approach as different product domains are studied.
Figure 2. A Common Basis: Function Classes and Flows...
Common Flows in Small Consumer ProductsMaterial Flows Energy Flows SignalsSolids Rotational Energy Vibration Human SignalHuman Hand Electricity Friction Energy Status (of Device)Product Human Energy Oscillating Linear Force PressureProduct Part Linear Energy Hydraulics TemperatureLiquid Pneumatics Light NoiseAir Heat Solar Energy Visual EffectCorrosive Materials Sound (Acoustic) Magnetism
Basic function (active verb) classes for small consumer products
Function Class Basic Functions Alternatives (Synonyms)
Channel Import Input, Receive, Allow, Form EntranceExport Discharge, Eject, Dispose, RemoveTransport Lift, Move, ChannelTransmit Conduct, Transfer, ConveyGuide Direct, Straighten, Steer
Stop Insulate, Protect, Resist, SheildStore/Supply Store Contain, Collect, Reserve
Supply Fill, Provide, ReplenishConnect Couple Join, Assemble, Attach
Mix Combine, Blend, Add, Pack, CoalesceBranch Branch Divide, Diverge, Switch, Valve
Filter Purify, Strain, Filtrate, Percolate, ClearSeparate Release, Detach, Disconnect, Disassemble, SubtractRemove Cut, Polish, Sand, Drill, LatheDistribute Scatter, Disperse, Diffuse, EmptyDissipate Absorb, Dampen, Dispel, Diffuse
Control Magnitude Actuate Start, InitiateRegulate Control, Allow/Prevent, Enable/Disable, Limit, InterruptChange Increase, Decrease, Amplify, Reduce, Normalize, Multiply
Scale, RectifyForm Compact, Crush, Shape
Convert Convert Transform, Liquefy, Solidify, Gyrate, Evaporate, CondenseIntegrate, Differentiate, Process
Support Stabilize SteadySecure Attach, Mount, Lock, Fasten, HoldPosition OrientTranslate Rotate Turn, SpinAllow DOF Constrain, Unsecure, Unlock
Signal Sense Perceive, Recognize, Discern, Check, Locate, VerifyIndicate MarkDisplayMeasure Calculate, Compare, Count

Little & Wood. Functional Analysis...
7
Using our common basis, the first step in transforming a function structure is to clearly understand the intent of each sub-function which may require further study of the product. The next step is to categorize each sub-function into its classification by selecting a function verb from the basic function list and a noun from the list of flows. Each basic function has been defined in Appendix A, and common synonyms for completing the transform are listed in Figure 2.
connectsander
enableon
conditionenergy
transform
startsurface
removal
maintaincontrol
debrisremoval?
provideairflow
harnessairflow
attachdebris
container
applyabrasive
removeabrasive
disposeof debris
collectdebris
is sandingcomplete
120 AC
roughsurface
humanenergy
newabrasive
debris
heatstatus
debrislevel
abrasive
debris
importelectricity
actuateelectricity
regulateelectricity
convertelectricityto mech.
rot
removematerial
stabilizeproduct
indicatevolume
convertmech.rot.
topneumatic
channelair
securematerial
securematerial
separatematerials
exportmaterial
storematerial
indicatestatus
120 AC
roughsurface
humanenergy
newabrasive
debris
heat
status
debrislevel
abrasive
debris
rotationalenergy
debrishumanenergy
rotationalenergy
debrishumanenergy
pneumatic pneumatic
Figure 3. Function structure transform for a palm grip sander.
To illustrate the transform process, Figure 3 shows function structures for a palm grip sander, before and after transformation. The basic functions listed in the transformed function structure are obtained directly from Figure 2, satisfying their definitions. Likewise, the selected flow names are chosen to maintain the information in the function structure since flows directly relate to customer needs.
In studying the transformed function structure for the palm sander, one important
observation should be clarified. There exist a few functions in consumer products which show up quite often, yet are difficult to place into one classification. These functions are placed into a global function category which includes maintain product, clean product, and protect product. These functions generally arise directly from customer needs such as easy to maintain, easy to clean product, and reliability; however, it is difficult to assign one specific function. These high-level functions can be accomplished through a combination of functions; however, for measurement purposes it is easier to represent them at this level. For example, the function “clean product” for a food processor could include a combination of functions exemplified by import hand, resist heat, release product part, resist food, guide soap and water, etc. By combining into one function, clean product, it reduces the complexity of the function structure and makes the evaluation easier, because measurements for clean product are naturally similar between different products. Developing a function structure with sub-functions having similar measurements across product classes is an important overall goal of this first step.
Step 2: Determine the Top Twenty Sub-Functions If a product has too many trivial functions, the intent of this step is to eliminate the less
important ones in order to assure products are compared at the same level of complexity. The number twenty was developed for consumer household products after completing this step for about sixty different products. This number is arbitrary; however, it is important to verify that the functions are meaningful; otherwise, significant sub-functions may be suppressed by a group
Little & Wood. Functional Analysis...
8
of functions used for completeness. Less meaningful sub-functions may include aesthetics or trivial repeated functions. For example, a function structure could include a “transmit electricity” sub-function for every electrical routing need in a product.
In addition to insuring the level of complexity, it is important to make sure each customer
need is represented by a sub-function. For example, the customer need “comfortable grip” is not represented in the palm grip function structure above; therefore, the sub-function “import human force” should be added. Similarly, “protect product” and “dissipate noise” were added to the electric polisher function list in Figure 4. In this way, each customer need should be reviewed to determine its representation in a product’s function structure.
Step 3: Weight/Correlate Sub-Functions to Customer Needs After a product’s function structure is transformed to a common basis, the customer needs
must be numerically correlated to the sub-functions. The first step is to weight the customer needs (rank the relative importance) using a method such as (Otto 1996). Next, convert to a 1-5 scale, and for each sub-function that is directly correlated to the customer need, assigning the 1-5 rating. To help determine which functions relate to the customer needs, it is important to look at the performance metrics in the quality function deployment, House of Quality. Some customer needs correlate to many sub-functions such as weight or size. In this case, it is not necessary to give a rating to any sub-function unless a set of specific sub-functions can be determined to greatly influence the weight/size of the product, such as a type of motor may contribute greatly to the weight of the product.
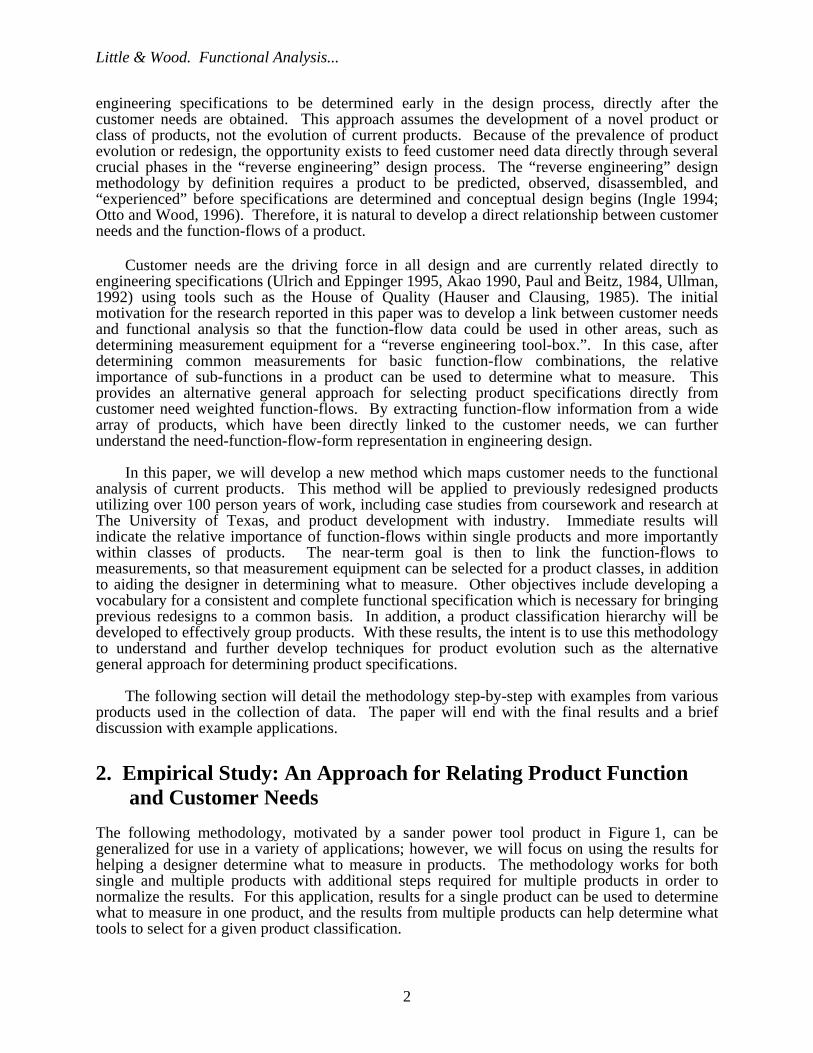
This step is represented by the arrows in Figure 4. Notice that the customer need for low
cost cannot be directly linked to any sub-functions (since it is a global product constraint); however, convert electricity to rotational energy is correlated to several customer needs.
Figure 4. Weighting/Correlating Sub-Functions for a 120V Electric Polisher. Functions that are important but do not directly correlate to a customer need are considered
supporting functions. In order to distinguish between functions directly related to customer needs and the supporting functions, a numerical value of one (1) is added to each sub-function
Categorized Sub-Functions1 Import Human Force1 Transmit Linear Force1 Actuate Electricity1 Import Electricity
Customer Needs 1 Transmit ElectricityLow Cost 5 1 Regulate ElectricityPolishes Quickly 4 1,4,4,3 Convert Elec. to Rotational EnergyLightweight 4 1 Transmit Rotational EnergyGood Finish Quality 3 1,3,3 Stabalize ProductSmall Size 3 1 Import MaterialSmooth Operation 4 1,3 Couple MaterialsQuiet Operation 4 1,4,3 Polish MaterialDurable 4 1 Separate Materials
4 Dissipate Vibrations1 Display Status
4 Dissipate Noise4 Protect Product

Little & Wood. Functional Analysis...
9
with an assigned customer need score (resulting in a final scale of 1-6 per customer need), and supporting functions are assigned a score of one (1). For example, stabilize product in Figure 4 will have a final cumulative rating of 7, and import human force will have a rating of 1 as a supporting function.
As a final check in this phase of the process, the need exists to investigate each supporting function. If the sub-function has no relevance to the device, eliminate it. Irrelevance can be determined if the sub-function has no connection to any customer need, and if the sub-function will not greatly affect the logical flow and performance of the product. In addition, if a supporting function subjectively appears more important than a score of one relative to the rating of other sub-functions, it may be necessary to assign the supporting function a value relative to a customer need it supports.
Step 4: Create Function Product Matrix To this point, product functional representations are converted to a common basis and correlated to the customer needs. We now need an approach for aggregating these data into a form for analysis across groups of products. An intuitive method for this aggregation is simply to formulate a function product matrix, where the columns are products, the rows are functions (active verb-noun pair, i.e., function-flow), and the cell values are the cumulative customer-need importance ratings for a given product’s function.
We also need to assure that the data are consistent and as unbiased as possible. The data obtained in the previous step could be very different between products depending on the method used to obtain customer needs and the complexity of the function structure. Even for the same product, one derived customer need list could be different from the next, depending on the number of customer needs retained; thus, a procedure has been developed to normalize the results across products with respect to both the depth of the customer need list and the complexity of the products. The end result will be a chart showing the relative importance of each function across the product domain. The study of a single product does not require this step.
Figure 5. Normalization process for Function Product Matrix (a) Weighted customer need data, (b) normalized across products, (c) normalized by number of functions, and (d) graph of results Importance vs. Functions.
The function product matrix,
, is developed by entering the weighted/correlated sub-
functions for each product, with the rows being the sub-functions and the columns being the products under study (Figure 5 (a)):
_ X=xij i=1,…,m, where m = the total number of sub-function (1)
j=1, … , n, where n = the number of products.
Pro
duct
1
Pro
duct
2
Pro
duct
3
Pro
duct
4
Pro
duct
1
Pro
duct
2
Pro
duct
3
Pro
duct
4
Pro
duct
1
Pro
duct
2
Pro
duct
3
Pro
duct
4
Tot
al
Function A 16 5 6 0 Function A 43 63 46 0 Function A 47 45 67 0 160Function B 12 0 1 4 Function B 32 0 8 44 Function B 35 0 11 32 79Function C 0 0 3 5 Function C 0 0 23 56 Function C 0 0 34 40 74Function D 9 3 3 0 Function D 24 38 23 0 Function D 27 27 34 0 87Total 37 8 13 9 Total 100 100 100 100 Total 109 73 145 73
# of funct. 3 2 4 2
0
20
40
60
80
100
120
140F
unct
ion
D
Fun
ctio
n A
Fun
ctio
n C
Fun
ctio
n B

Little & Wood. Functional Analysis...
10
To prevent one product from dominating others, such as Product 1 in the example, each product is normalized so that the customer need ratings sum to 100. Therefore, divide each cell by the sum of the matrix rows for each respective product column, resulting in a new matrix shown in Figure 5(b):
nijI
xij
I jp
*100, where I jp xij
i1
m
. (2)
For similar reasons, each cell must be scaled up or down by the relative number of functions in each product. This scaling operation prevents the over influence of products with a less than average number of functions such as product 2 in Figure 5(b). The scaling operation places more complex products with many functions and products with few functions on the same level. To count the number of functions per product p, convert matrix
to a binary form, i.e., if a
function exists, a cell will have a value equal to one (1), or 0 otherwise.
fij 0 if xij 0
1 otherwise
(3)
With this transformed matrix representation, sum the matrix rows for each respective product column the number of function , Nj
p,per product p:
Njp fij
i1
m
. (4)
Next, find the mean number of functions per product,
N Nj
p
nj1
n
. (5)
Finally, normalize with respect to the mean number of functions per product,
nijIF
nijI
N , (6)
as shown in Figure 5 (c).
Step 5: Develop a Pareto Chart The final matrix is then sorted and plotted in the form of a Pareto Chart (Figure 5(d)). The basic idea is to create a frequency plot of importance of product functions versus function names, and apply Pareto’s 20-80 rule to distinguish the critical functions that must be measured and benchmarked for the highest potential payoff. Pareto initially used this method to examine income level distributions; however, Juran (1975) has concluded that the underlying principle is universal and applied it in quality control. Pareto Charts are also frequently used in Design for Assembly for identifying assembly processes that need the most improvement (Hinckley 1994). For our application, the Pareto Chart is developed by listing the sub-functions along the x-axis in descending order of importance. The sub-function importance,si
F , is calculated by summing across respective columns for each sub-function in the normalized product function matrix:

Little & Wood. Functional Analysis...
11
siF nij
IF
j1
n
. (7)
The result provides a graphical means to determine the crucial sub-functions within the product domain.
If the importance, as listed along the y-axis of the Pareto Chart, is divided by the number of
products n, the value indicates the average percent importance for each function per product. However, a better value relates back to the weighted/correlated customer needs. For example, a sub-function importance of one (1) would indicate, conservatively, the function is on average a supporting function across all products. This interpretation is accomplished by multiplying by the number of products over the average sum of the weighted/correlated customer needs:
s iF si
F / (n
I) *100
, where I I j
P
j1
n
. (8)
Figure 6 illustrates an example plot of this process. The new plot shows Function C has on
average a weighted customer need of 3, indicating a function that is definitely important across all products studied. The scale shown in this plot also allows the ability to compare different plots which have different numbers of products and customer weighting/correlation values. Overall, this methodology allows various complexities of products with various quantities of data from customer needs to be analyzed together.
0
12
3
45
6
Sub-Functions
Imp
ort
ance
Figure 6. Example: Sub-function importance ratings.
Step 6: Apply Results The final objective of this procedure is to apply the results, which for the measurement case
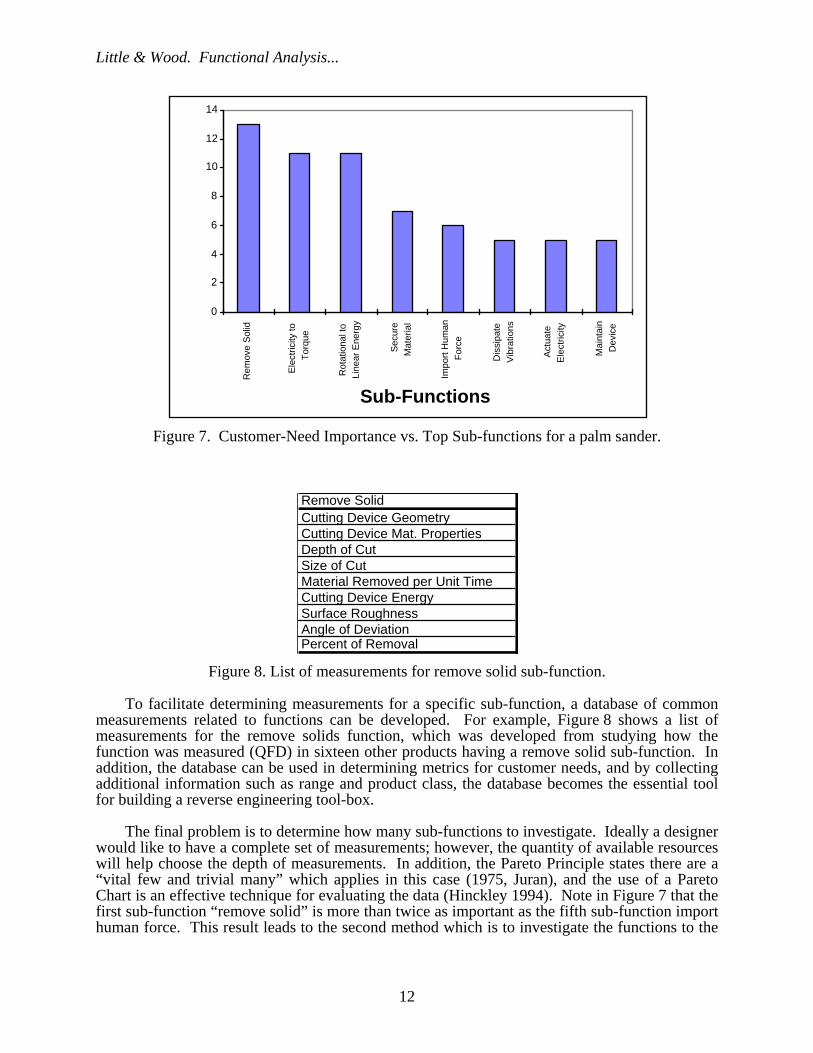
requires a list of measurements for a given product or products. Now that the sub-functions have been ranked by either weighting/correlating the sub-functions for a single product or in the matrix for a group of products, the designer can determine what to measure by investigating the more important sub-functions first. For example, for a palm sander (Figure 7), the designer should concentrate on the more important functions (remove solid, electricity to torque, rotational to linear energy, etc.). Therefore, the designer should start by focusing on measurements related to removing solids.
Little & Wood. Functional Analysis...
12
Figure 7. Customer-Need Importance vs. Top Sub-functions for a palm sander.
Figure 8. List of measurements for remove solid sub-function.
To facilitate determining measurements for a specific sub-function, a database of common measurements related to functions can be developed. For example, Figure 8 shows a list of measurements for the remove solids function, which was developed from studying how the function was measured (QFD) in sixteen other products having a remove solid sub-function. In addition, the database can be used in determining metrics for customer needs, and by collecting additional information such as range and product class, the database becomes the essential tool for building a reverse engineering tool-box.
The final problem is to determine how many sub-functions to investigate. Ideally a designer
would like to have a complete set of measurements; however, the quantity of available resources will help choose the depth of measurements. In addition, the Pareto Principle states there are a “vital few and trivial many” which applies in this case (1975, Juran), and the use of a Pareto Chart is an effective technique for evaluating the data (Hinckley 1994). Note in Figure 7 that the first sub-function “remove solid” is more than twice as important as the fifth sub-function import human force. This result leads to the second method which is to investigate the functions to the
0
2
4
6
8
10
12
14
Rem
ove
Sol
id
Ele
ctric
ity to
Tor
que
Rot
atio
nal t
o
Line
ar E
nerg
y
Sec
ure
Mat
eria
l
Impo
rt H
uman
For
ce
Dis
sipa
te
Vib
ratio
ns
Act
uate
Ele
ctric
ity
Mai
ntai
n
Dev
ice
Sub-Functions
Remove SolidCutting Device GeometryCutting Device Mat. PropertiesDepth of CutSize of CutMaterial Removed per Unit TimeCutting Device EnergySurface RoughnessAngle of DeviationPercent of Removal

Little & Wood. Functional Analysis...
13
left of the graphical cut-off point where the importance levels off. For the above example, the designer should initially focus on the first four or five sub-functions.
A primary motivation for this methodology, for this paper, is to develop a reverse
engineering tool-box; therefore, we must determine what to measure for a class of products so a tool-box can be developed for the product domain. The second method mentioned above also works well with multiple products; however, more sub-functions meet the cut-off point as the product domain is increased. Therefore, a classification system must be developed to attempt to keep products with similar key functions together.
3. Product Hierarchy
There are a variety of approaches for classifying products into organized domains. One common classification system used by Consumer Reports (1997) is to group products into high level categories, such as, yard tools, electronics, and household appliances; however, products can be very different within their class. For example, a toaster and a coffee grinder would be in the same category despite the fact they have few similar primary functions. Other approaches include classifying by the methods of fabrication, product features, off-the-shelf components, or by overall product customer needs. Although these are valid classifications, they do not follow our systematic approach. A more useful classification is to classify products by their dominant input flows, transferred by functions to the resulting output flow or consequence of the product.
Every product has an input flow which is transmitted and/or transformed through a product
and exported into a medium or as a signal. By following this flow through the product, we can develop a hierarchy. Electrical energy and human energy are the two primary input flows into products (at least for household consumer products). For example, for an electric screwdriver, electrical energy is converted into rotational energy which is then exported from the product to a solid material. A standard screwdriver uses human energy as the input which is directly transmitted out of the product to a solid material. Although these two products have similar functions, they have very different sub-functions, customer needs, and specifications.
Given the goal of classifying products according to similar functionality, a hierarchy is
developed by starting with the primary input flow and branching into different categories for each type of energy conversion. This continues until the flow is exported from the product into a material or signal. The hierarchy is further refined by categorizing the type of material: solid, liquid, and air. Figures 9 and 10 use electrical and human energy as the primary input flows. The basis for the choice of input flows is that consumer products convert energy to perform a useful task. Other hierarchies can be developed for pneumatic or hydraulic input energy. In addition, these hierarchies are by no means complete, but rather include the products studied for this research, which are underlined, with a few added to obtain a feel for others in their class. The hierarchies will be further reviewed in the discussion at the end of the paper.

Little & Wood. Functional Analysis...
14
Figure 9. Product hierarchy for products with electricity as primary input flow.
Figure 10. Product hierarchy for products with human energy as primary input flow.
4. Results from Applying the Methodology
A 58 product matrix with approximately 125 different sub-functions (basic function-flow pairs, Figure 2) was developed from a pool of previously reverse engineered and redesigned small household consumer products (Appendix B). The primary goal of this data is to determine the most important sub-functions for the group of products.
Data Acquisition The methodology was performed on groups of nine to ten products at a time, and the results were analyzed after each batch, implementing steps 1-5 of the functional analysis (Figure 1). After the fifth batch, it became apparent that the results were not changing, in other words, the sub-functions above the cut-off point were remaining fairly constant with no sub-functions changing by more
Electricity
Material Energy
Transform
Solid Rotational Energy Heat Linear Force
Stun Gun
Energy Material Signal Material Material
Transform
Pneumatic Vibration Hydraulic Dissipation Linear Vel Solid Metronome Solid Liquid Solid
Elec.Screwdriver Iron Coffee Maker Putting Cup
Material Material Signal Material Material Material Solder Iron Iced Tea Maker Elec. Stapler
Sandwich Maker Humidifier
Elec. Wok Deep Fry
Liquid Air Solid Bumble Ball Liquid Solid Solid Popcorn Maker
Bubble Toy Vacuum Massage Device Paint Roller Toy Car Crock Pot
Fan
Hair Dryer Non-Food Food
Power Blower Weed Trimmer Mixers
Lawn Mower Blender
Sander Food Processor
Elec.Toothbrush Cheese Grater
Can Opener Veg. Stripper
Elec. Engraver Pasta Machine
Pencil Sharpener
Real Power Tool Shop
Human Force
Energy Material Signal
Transform
Rotational Energy Linear Energy Dissipation Solid
Screwdriver
Energy Material Signal Energy Material Signal Material
Transform Transform
Dissipation Linear Enrgy Solid Liquid Liquid Solid Solid Liquid
Car Visor Swimming Toy Faucet Stapler Knife Sink Stop
Material Material Toy Gun Veg. Peeler
Crossfire Game
Solid Solid
Hand Drill Projectile Toy
Nut Cutter Fishing Rod

Little & Wood. Functional Analysis...
15
Figure 11. Pareto analysis for 48 household consumer products.
Figure 12. Pareto analysis for subsequent 10 household consumer products.
than one or two positions. However, in an effort to verify the results, the methodology was performed independently on a final batch of ten more products. These results were compared to the group of 48 products to verify, revealing seven of the top ten sub-functions in the 10 product group are also in the top ten for the 48 product group (Figure 11 and 12). In addition, the maximum importance is higher for the ten product group because the diversity of the 48 products is much higher. For example, notice the fifth and sixth sub-functions, convert electricity to heat and transmit heat, in the 10 product group are not represented in the top 25 sub-functions in the
0
1
2
3
4
5
Sub-Function
Imp
ort
ance
All Supporting Functions
0
1
2
3
4
5
6
7
8
9
Ele
ctri
city
to
Tor
que
Impo
rt H
uman
For
ce
Cha
nge
Tor
q/S
peed
Pro
tect
Dev
ice
Ele
ctri
city
to
Hea
t
Tra
nsm
it H
eat
Sen
se S
elec
tion
Rem
ove
Mat
eria
ls
Dis
sipa
te N
oise
Reg
ulat
e T
orqu
e
Sub-Function
All Supporting Functions
All Musts

Little & Wood. Functional Analysis...
16
48 product group. This is because we inadvertently selected 3 of 10 products that used heat compared to 5 of 48. This indicates the last batch of products was not as diverse; however, besides the two heat functions, the results were quite satisfactory.
Empirical Results for 58 products The 58 products were combined together to produce the final results for the category of
small household consumer products (Figure 13). The dashed lines indicate the point at which the sub-function importance levels off. This point occurs at about an importance of one, meaning on average all 58 products have the sub-function as a supporting function. In addition, the sub-functions to the left of the cut-off point varied by no more than one or two positions between the 48 and 58 product chart. This result further verifies the cut-off point because, as the importance levels off, the relative difference between sub-functions becomes insignificant.
Figure 13. Pareto analysis for 58 household consumer products.
The sub-functions import human force and convert electricity to torque have an importance of five, more than twice the importance of any other sub-functions. This result is not a revelation for the category of small-household consumer products, but it is intriguing. Many of the products utilize motors, and the customers want a powerful product whether it be cutting, suctioning, sanding, or blow drying their hair. In addition, they want it lightweight, small, and low on power consumption, if it uses batteries. Import human force is obviously a direct result of the linked customer needs, arising from customer ergonomic issues, such as wanting a better grip and/or less human energy required. The sub-function change torque/speed results from similar arguments for converting electricity to torque. Protect device and clean product are two of the global functions which arise directly from customers wanting a durable reliable product which is easy to clean. Further results will be discussed at the end of the paper; however, we will continue with an example of a product class application.
0
1
2
3
4
5
Sub-Function
Imp
ort
ance
All Supporting Functions
Little & Wood. Functional Analysis...
17
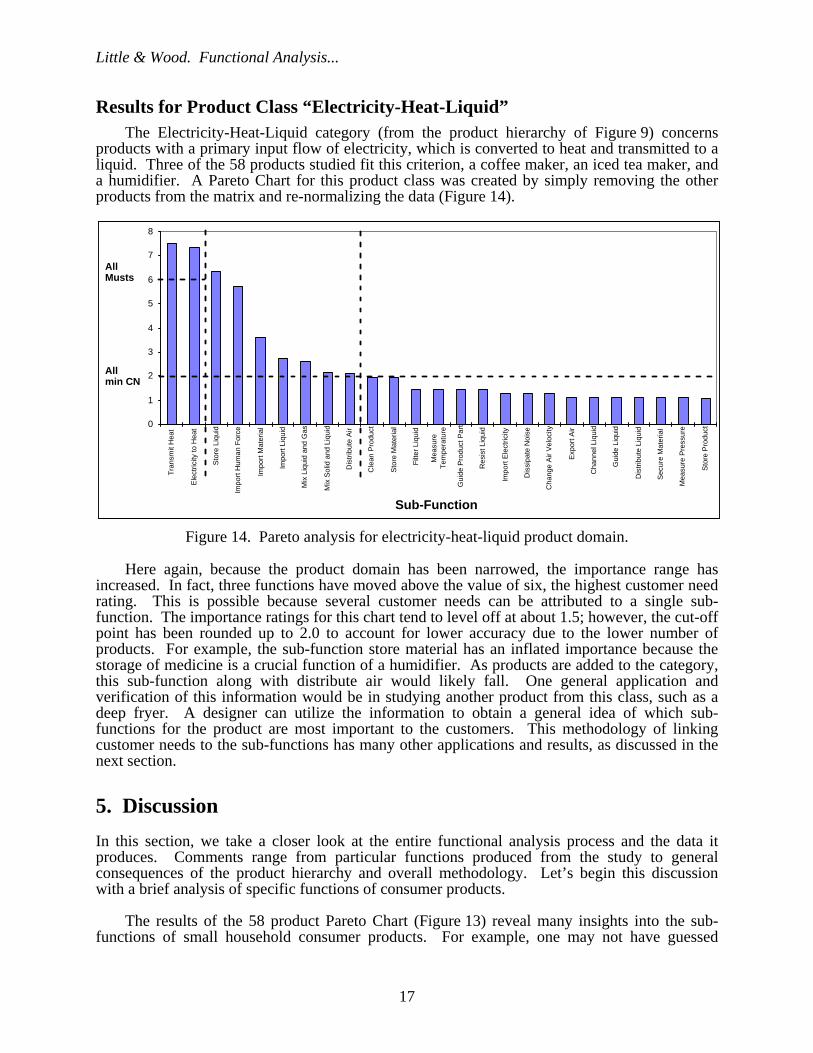
Results for Product Class “Electricity-Heat-Liquid” The Electricity-Heat-Liquid category (from the product hierarchy of Figure 9) concerns
products with a primary input flow of electricity, which is converted to heat and transmitted to a liquid. Three of the 58 products studied fit this criterion, a coffee maker, an iced tea maker, and a humidifier. A Pareto Chart for this product class was created by simply removing the other products from the matrix and re-normalizing the data (Figure 14).
Figure 14. Pareto analysis for electricity-heat-liquid product domain.
Here again, because the product domain has been narrowed, the importance range has increased. In fact, three functions have moved above the value of six, the highest customer need rating. This is possible because several customer needs can be attributed to a single sub-function. The importance ratings for this chart tend to level off at about 1.5; however, the cut-off point has been rounded up to 2.0 to account for lower accuracy due to the lower number of products. For example, the sub-function store material has an inflated importance because the storage of medicine is a crucial function of a humidifier. As products are added to the category, this sub-function along with distribute air would likely fall. One general application and verification of this information would be in studying another product from this class, such as a deep fryer. A designer can utilize the information to obtain a general idea of which sub-functions for the product are most important to the customers. This methodology of linking customer needs to the sub-functions has many other applications and results, as discussed in the next section.
5. Discussion
In this section, we take a closer look at the entire functional analysis process and the data it produces. Comments range from particular functions produced from the study to general consequences of the product hierarchy and overall methodology. Let’s begin this discussion with a brief analysis of specific functions of consumer products.
The results of the 58 product Pareto Chart (Figure 13) reveal many insights into the sub-
functions of small household consumer products. For example, one may not have guessed
0
1
2
3
4
5
6
7
8
Tra
nsm
it H
eat
Ele
ctric
ity to
Hea
t
Sto
re L
iqui
d
Impo
rt H
uman
For
ce
Impo
rt M
ater
ial
Impo
rt L
iqui
d
Mix
Liq
uid
and
Gas
Mix
Sol
id a
nd L
iqui
d
Dis
trib
ute
Air
Cle
an P
rodu
ct
Sto
re M
ater
ial
Filt
er L
iqui
d
Mea
sure
Tem
pera
ture
Gui
de P
rodu
ct P
art
Res
ist L
iqui
d
Impo
rt E
lect
ricity
Dis
sipa
te N
oise
Cha
nge
Air
Vel
ocity
Exp
ort A
ir
Cha
nnel
Liq
uid
Gui
de L
iqui
d
Dis
trib
ute
Liqu
id
Sec
ure
Mat
eria
l
Me
asu
re P
ress
ure
Sto
re P
rodu
ct
Sub-Function
AllMusts
Allmin CN

Little & Wood. Functional Analysis...
18
import human force would show up as the number one sub-function. This result shows ergonomic issues and industrial design must play a crucial role in the development of future products. Other sub-functions in the top 10%, such as convert torque to pneumatic, may be questioned at first; however, this function becomes important due to the use of fans and impellers which have many different uses in products including suction and cooling. In addition, the number five sub-function, remove material, is defined as the separation of part of a material from its prefixed place. This function is used to cut, sand, polish or chop anything from food to wood.
Besides these single function insights, relationships exist between many functions, for
example, torque to pneumatic and dissipate noise. When there is a fan or impeller used in a product, the customers usually want less noise; however, dissipate noise is more important than just torque to pneumatic because there are other functions which can cause the need to dissipate noise, such as a noisy motor in “convert electricity to torque”.
There are several interesting comments to make about the product hierarchy (Figures 9
and 10). Ulrich and Seering (1989) noted the heuristic that it is unwise to use more than two energy conversions in a design strategy. The product hierarchy classifies by following the primary energy flow through a product’s various energy transformations. Notice the energy flows shown in Figures 9 and 10 are never transformed more than twice, confirming this heuristic.
An additional use of the product hierarchy is to obtain direct analogy information both
within a product class and across product classes. For example, when a designer develops a deep fryer which transmits heat to a liquid he/she can locate analogous information (design by analogy) from products within the same class. Similarly, let’s say the designer wants to add a new feature which rotates the fryer to help stir the contents, he/she could then locate analogous products in the electricity-rotational energy-material-solid category to help generate successful concepts for this functional requirement.
In addition, some products from a hierarchy may fit into different categories depending on
what is judged as the primary flow through the product. For example, a hair dryer could be classified into the electricity-rotational energy-pneumatic-air or electricity-heat-air category. In general, an ingenious designer will apply information from both categories for the respective flows in the product.
The formal function-flow vocabulary developed in this research can be used for representing
functionality, for teaching systematic design approaches, and for exploring different directions in function perspectives. The vocabulary provides a more systematic approach because the user has a concise list to choose from with unambiguous definitions. This formalism will also allow others to have a better understanding of a completed function structure developed by someone else. In addition, a function structure can be converted to its common basis using the thirty or so basic functions and then converted back using different synonyms to provide a new perspective to the functional analysis.
It is clear in the literature (Clausing, 1997) that few if any methods exist for explicitly and
quantitatively relating customer needs to product functionality. At best (Otto and Wood, 1996), customer needs may be related to sub-functions with an indirect relationship to importance. For product evolution, the overall methodology in this paper allows customer needs to be directly related to the functionality of a device with clear and normalized importance ratings.
The method demonstrated in this paper forms a solid foundation for product benchmarking
and the development of measurement technologies. By applying the weighted/correlated function information, explicit methods for benchmarking can be derived with a range of measurements from the studied products. While a significant investment of time and resources
Little & Wood. Functional Analysis...
19
will be needed to document the functionality and customer needs of products, direct metrics for families of products may be obtained simply by identifying the important flows through the products’ functions. Because relative importance of the functions are also available, choices in what to measure first and where to cutoff potential measurements may also be made. Undoubtedly, resources will be saved by avoiding wasted measurements and measurement equipment, and focusing instead on the customers’ greatest needs.
Overall, the empirical functional-analysis study reported in this paper is novel in many
ways. No such study exists in the open literature. This novelty leads to an endless set of avenues for possible applications. For example, there exists great interest in the community to understand groups and dependencies of product functions, such as the “torque-to-pneumatic” and “dissipate noise” functions discussed above. Extensions to the product-function-matrix calculations, such as with affinity diagrams or eigenvectors/basis functions, are envisioned to identify such function groupings. With such data, insights might be possible in the research issues of mass customization, product family classifications, and product reuse/disassembly.
6. Conclusion: A Perspective of Endless Possibilities
In this paper, a methodology for functional analysis is developed. This methodology provides a quantitative approach for relating customer needs and product functions. Transformation of product functionality initiates the process, followed by the correlation of customer needs to the transformed functions. After normalization and simple matrix analysis, groups of products may be studied using Pareto Charts. Results from these studies are in the form of product hierarchies and frequency plots of customer importance versus basic product functions.
The functional analysis methodology is applied to approximately 60 household consumer
products. This empirical study of consumer products is novel, and results in a number of intriguing design insights. For this paper, a primary insight gained from the study concerns the critical measurements that are needed to benchmark product families or evaluate evolved products. Relevant product metrics may be directly shown, evaluating their potential impact as one of the “vital few” or as one of the “trivial many.”
Acknowledgments The research reported in this document was made possible, in part, by a Young Investigator Award from the National Science Foundation. The authors also wish to acknowledge the support of Ford Motor Company, Texas Instruments, Desktop Manufacturing Corporation, and the UT June and Gene Gillis Endowed Faculty Fellow. Any opinions, findings, conclusions, or recommendations are those of the authors and do not necessarily reflect the views of the sponsors.
References
Akao, Y., Quality Function Deployment: Integrating Customer Requirements into Product Design. Productivity Press, Cambridge, 1990.
Altshuller, G.S., Creativity as an Exact Science, Gordon and Branch Publishers, Luxembourg, 1984.
Clausing, D., “Concurrent Engineering,” In ASM Handbook, Materials Selection and Design, Volume 20, ASM International, Materials Park, OH, 1997.

Little & Wood. Functional Analysis...
20
Collins, J.A., Hagan, B.T., and Bratt, H. M., “The Failure-Experience Matrix - A Useful Design Tool”, Transactions of the ASME, Series B, Journal of Engineering in Industry, Vol. 98, Aug., pp. 1074-1079, 1976.
Consumer Reports, A Publication of Consumer Union, 1997. Cross, Nigel, Engineering Design Methods Strategies for Product Design 2nd ed., John Wiley &
Sons, New York, 1994. Fadel, G. M., C. C. Jara-Almonte, and C. F. Kirschman, “Classifying Functions for Mechanical
Design,” Proceedings of the 1996 ASME Design Engineering Technical Conference and Computers in Engineering Conference, Irvine, CA, 1996.
Hauser, J. and Clausing, D., “The House of Quality,” Harvard Business Review, May-June, pp. 63-73, 1988.
Hubka, V., et al., Practical Studies in Systematic Design. Butterworths, London, 1988. Hubka, V., et al. Theory of Technical Systems,” Springer-Verlag, Berlin, 1988. Hundal, M. S., “A Systematic Method for Developing Function Structures, Solutions and
Concept Variants,” Mech. Mach. Theory, Vol. 25, No. 3, pp. 243-256, 1990. Ingle, K., Reverse Engineering. McGraw-Hill, Inc., New York, 1994. Juran, J. M., “Then and Now in Quality Control”, Quality Progress, May, 1995. Malmqvist, J. et. al, “A Comparative Analysis of the Theory of Inventive Problem Solving and
the Systematic Approach of Pahl and Beitz,” Proceedings of the 1996 ASME Design Engineering Technical Conference and Computers in Engineering Conference, Irvine, CA, 1996.
Miles, L., Techniques of Value Analysis Engineering, McGraw-Hill, New York, 1972. Otto, K., “Forming Product Design Specifications,” in Proceedings of the 1996 ASME Design
Theory and Methodology Conference, Irvine, CA, 1996. Otto, K. and K. Wood, “A Reverse Engineering and Redesign Methodology for Product
Evolution”, Proceedings of the ASME Design Theory and Methodology Conference, Irvine, CA, 1996, pp. ????.
Paul, G. and W. Beitz, Engineering Design, The Design Council, London 1984. Shimomura, Y., et al., “Representation of Design Object Based on the Functional Evolution
Process Model,” Proceedings of the ASME Design Theory and Methodology Conference, Boston, MA, Sept. 1995.
Ullman, D., The Mechanical Design Process, McGraw-Hill, New York, 1992. Ullman, D., “A New View of Function Modeling,” International Conference on Engineering
Design, ICED ’93, The Hague, August 17-19, 1993. Ulrich, K. and S. Eppinger, Product Design and Development, McGraw-Hill, NY, 1995. Ulrich, K. T. and W. P. Seering, “Synthesis of Schematic Descriptions in Mechanical Design,”
Research in Engineering Design, Vol. 1, No. 1, pp. 3-18, 1989. Wood, K.L. and Otto, K.N., “Conceptual and Configuration Design of Products and
Assemblies,” In ASM Handbook, Materials Selection and Design, Volume 20, ASM International, Materials Park, OH, 1997. (Add reference at beginning of paper with other conceptual design and function structure methods.)

Little & Wood. Functional Analysis...
21
Appendix A-Function Class and Sub-Function Verb Definitions
Channel - to cause a direction of travel or path for a material or energy Import - to bring in an energy or material from outside the product. The item must not be permanently attached. Export - to send out an energy or material from the product. The item must not have been permanently attached. Transport - to move a material from one place to another Guide - to direct the course of an energy or material Stop - to cease the transport of a material or the transmission of an energy Transmit - to send an energy from one place to another
Store/Supply-to accumulate or provide material or energy
Store - to accumulate a material or energy Supply - to provide a material or energy from storage within the device
Connect - to bring two or more energies or materials together
Couple - to join or bring together an energy or material Mix - to combine two materials into a single uniform (homogenous) mass
Branch - to cause a material or energy to no longer be joined or mixed
Filter - to separate one material from another by using a “filter” Separate - to cause materials to no longer be joined or mixed Remove - to separate part of a material from its prefixed place Branch - to separate energy into two or more directions Distribute - to cause a material or energy to break up and go in many different directions Dissipate - to break up and ideally non-exist or disperse
Control Magnitude - to alter or govern the size or amplitude of a material or energy
Actuate - to commence the flow of energy or material enacted by a human signal Regulate - to adjust the flow of energy or material in response to a signal or characteristic of the flow Change - to adjust the flow of energy or material in a fixed manner Form - to mold or shape a material
Convert - to change from one form of energy to another
Linear Force, Oscillating Linear Force, Torque, Electricity, Heat, Noise, Vibration, Hydraulic, Pneumatic Support - to fix firmly a material or energy path into a defined location
Stabilize - to prevent the device from changing location Secure - to firmly fix a material or energy path Position - to place a material into a location by way of human force Translate - to fix the movement of a material into one linear direction Rotate - to fix the movement of a material into a rotation on one axis Allow DOF - to control the movement of a material into one or more directions
Signal - to provide information to, within, or out of the system boundary
Sense - to perceive or become aware of a human or device signal Indicate - to make something known to the user Display - to show a visual effect Measure - to determine the magnitude of something