fully coupled modelling of complex sand controlled …...fully coupled modelling of complex sand...
TRANSCRIPT
Fully coupled modelling of complex sand controlled completions
Michael Byrne
Outline
• Background
• Objectives
• Reservoir, Fluid Properties and Pressure
• Validating Modelling Fluid Flow Through Inflow Control Device (ICD)
• Sector Model Geometry and Results
• Complete Model Geometry and Results
• Summary

13
85
m
17
17
m
18
08
.4m
17
37
m
21
95
.1m
25
02
.9m
25
95
.8m
2
61
9.1
m
27
37
.7m
Sector 1: To Be Recompleted
332m
Sector 2 20m
Sector 3 71.4m
Sector 4 386.7m
Sector 5 307.8m
Sector 6 92.9m
Sector 7 23.3m
Sector 8 118.6m
9-5/8” 40# Casing, 12spf – 5-1/2” SAS
9-5/8” 40# Casing and 7” 29# Casing
6-5/8” SAS 5-1/2” SAS
Sector 1 Reservoir B1 Sand (10D) Annular Perm’ 5D Completion 9-5/8” 40# Cased + Perf’ 5-1/2” SAS + ICD
Completion 9-5/8” 40# Casing Completion
7” 29# Casing
Sector 4 Reservoir B1 Sand (10D) Annular Perm’ 5D Completion 9” Open Hole 1 port 33 x 6-5/8” SAS (1 SP)
Sector 5 Reservoir A3 Sand (2D) Annular Perm’ 1D Completion 9” Open Hole 1 x 6-5/8” SAS (1 SP) 10 port Crossover 25 x 5-1/2” SAS (1 SP) 10 port
Reservoir B1 Sand (10D) Annular Perm’ 5D Completion 9” Open Hole 8 x 5-1/2” SAS (1 SP) 1 port
Reservoir A3 Sand (2D) Annular Perm’ 1D Completion 9” Open Hole 2 x 5-1/2” SAS (1SP) 1 port
Sector 8 Reservoir A3 Sand (2D) Annular Perm’ 1D Completion 9” Open Hole 9 x 5-1/2” SAS (1SP) 10 port2
Well Length = 1352.7m Split into 4 Completion sections and
8 Reservoir sectors
Sector 4 B1 Sand
Sector 5 A3 Sand
Sector 6 B1 Sand
Sectors 7 + 8 A3 Sand
Sector 1 B1 Sand
Typical Sector 1 set-up, 1000’s of Perforations Background
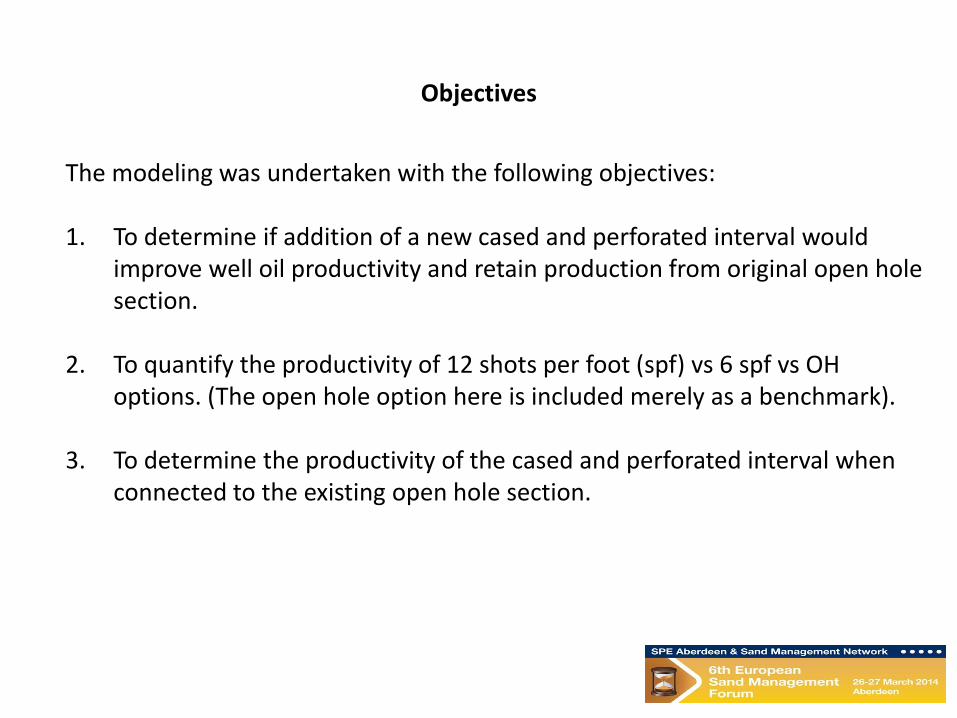
Objectives
The modeling was undertaken with the following objectives: 1. To determine if addition of a new cased and perforated interval would
improve well oil productivity and retain production from original open hole section.
2. To quantify the productivity of 12 shots per foot (spf) vs 6 spf vs OH options. (The open hole option here is included merely as a benchmark).
3. To determine the productivity of the cased and perforated interval when connected to the existing open hole section.
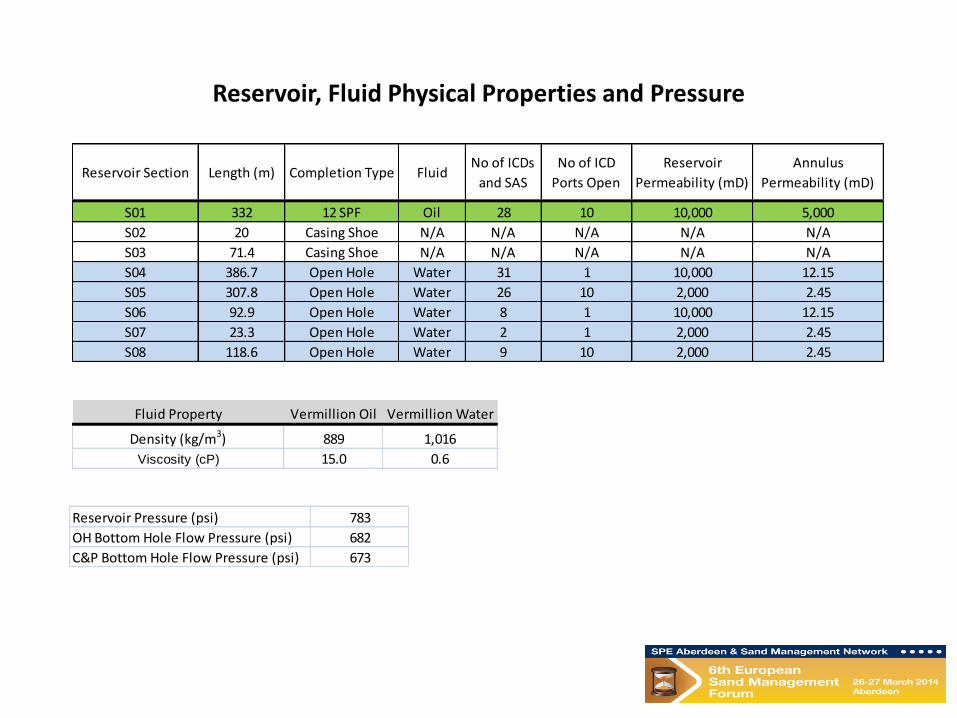
Reservoir, Fluid Physical Properties and Pressure
Reservoir Section Length (m) Completion Type FluidNo of ICDs
and SAS
No of ICD
Ports Open
Reservoir
Permeability (mD)
Annulus
Permeability (mD)
S01 332 12 SPF Oil 28 10 10,000 5,000
S02 20 Casing Shoe N/A N/A N/A N/A N/A
S03 71.4 Casing Shoe N/A N/A N/A N/A N/A
S04 386.7 Open Hole Water 31 1 10,000 12.15
S05 307.8 Open Hole Water 26 10 2,000 2.45
S06 92.9 Open Hole Water 8 1 10,000 12.15
S07 23.3 Open Hole Water 2 1 2,000 2.45
S08 118.6 Open Hole Water 9 10 2,000 2.45
Fluid Property Vermillion Oil Vermillion Water
Density (kg/m3) 889 1,016
Viscosity (cP) 15.0 0.6
Reservoir Pressure (psi) 783
OH Bottom Hole Flow Pressure (psi) 682
C&P Bottom Hole Flow Pressure (psi) 673
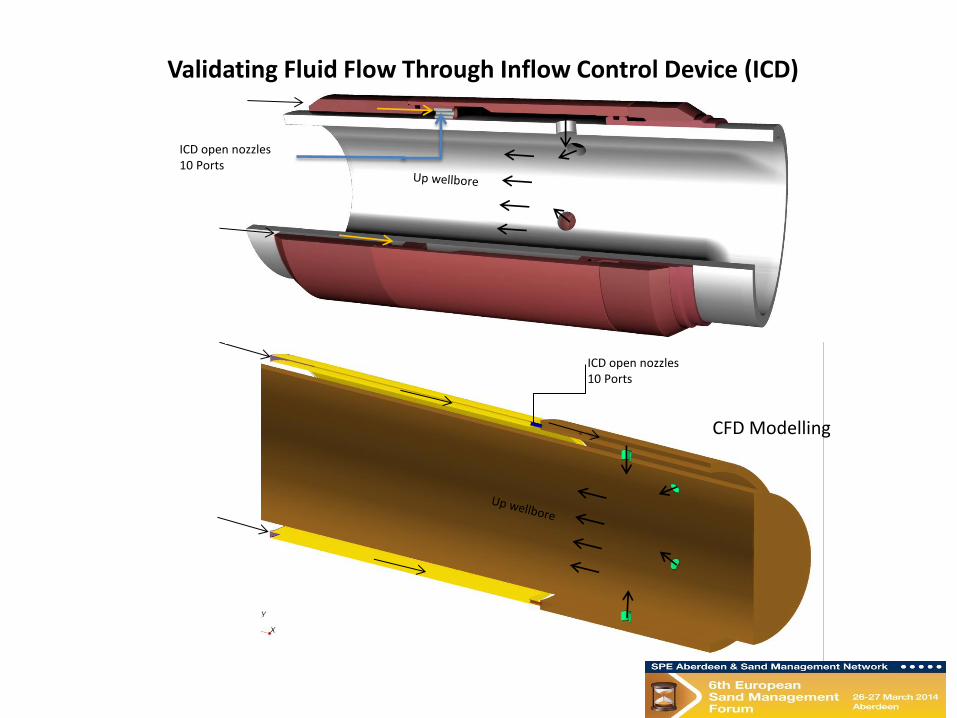
Validating Fluid Flow Through Inflow Control Device (ICD)
ICD open nozzles 10 Ports
CFD Modelling
ICD open nozzles 10 Ports
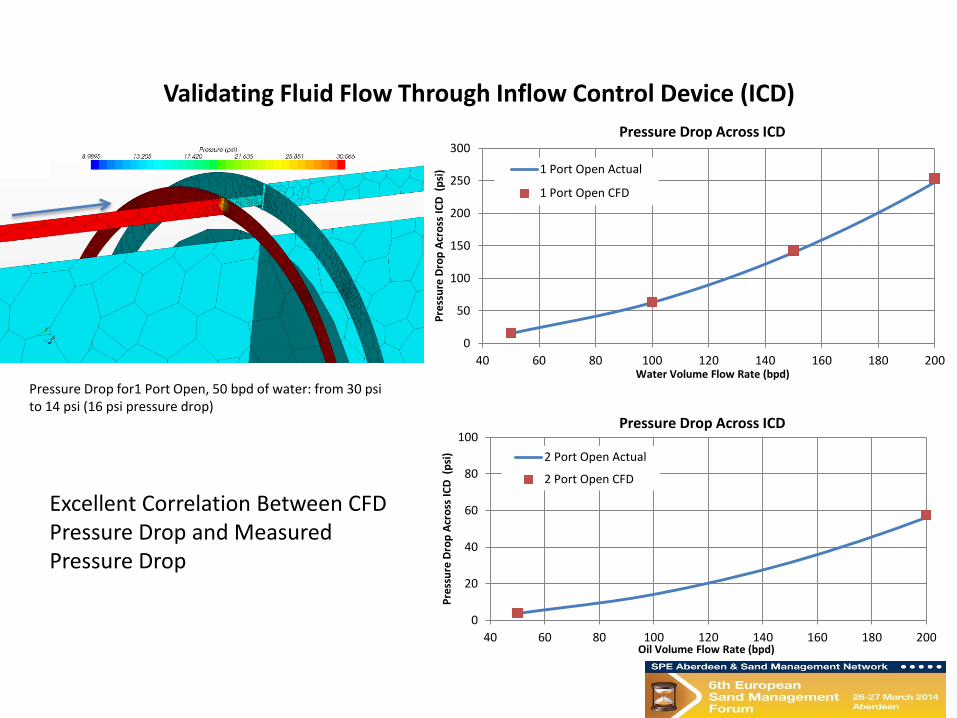
Validating Fluid Flow Through Inflow Control Device (ICD)
0
50
100
150
200
250
300
40 60 80 100 120 140 160 180 200
Pre
ssu
re D
rop
Acr
oss
IC
D (
psi
)
Water Volume Flow Rate (bpd)
Pressure Drop Across ICD
1 Port Open Actual
1 Port Open CFD
0
20
40
60
80
100
40 60 80 100 120 140 160 180 200
Pre
ssu
re D
rop
Acr
oss
IC
D (
psi
)
Oil Volume Flow Rate (bpd)
Pressure Drop Across ICD
2 Port Open Actual
2 Port Open CFD
Pressure Drop for1 Port Open, 50 bpd of water: from 30 psi to 14 psi (16 psi pressure drop)
Excellent Correlation Between CFD Pressure Drop and Measured Pressure Drop

Open Hole Sector Model (1 Joint ~ 39 ft Long) Geometry
ICD Drainage Layer Wellbore Annulus Reservoir
Drainage Layer Length
Detail Completion Modelling

C & P 6 spf Sector Model (1 Joint ~ 39 ft Long) Geometry
Detail Completion Modelling
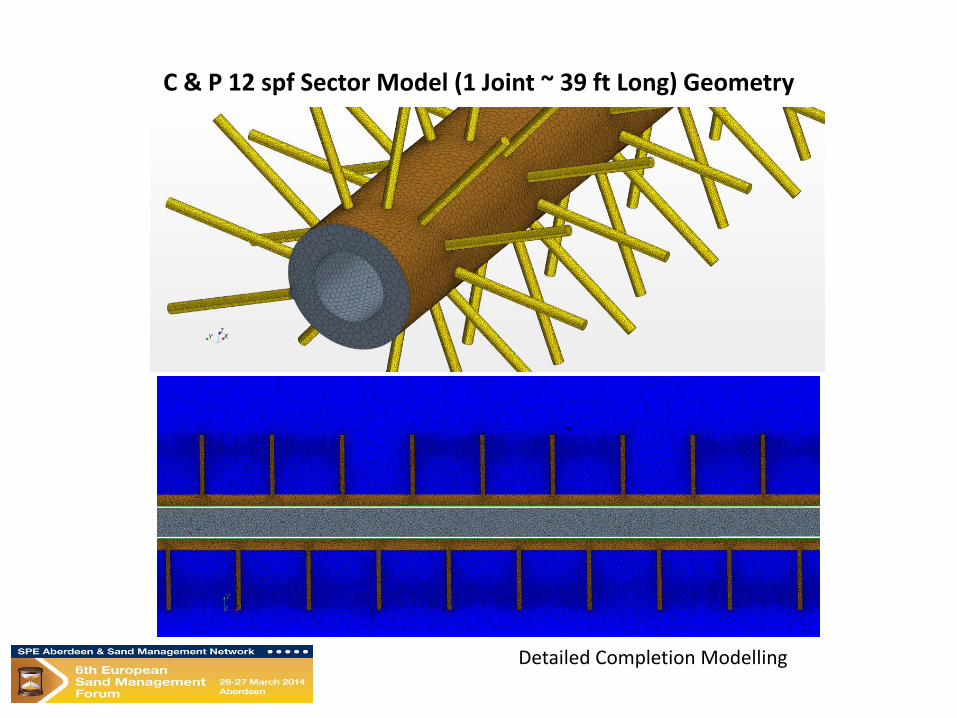
C & P 12 spf Sector Model (1 Joint ~ 39 ft Long) Geometry
Detailed Completion Modelling
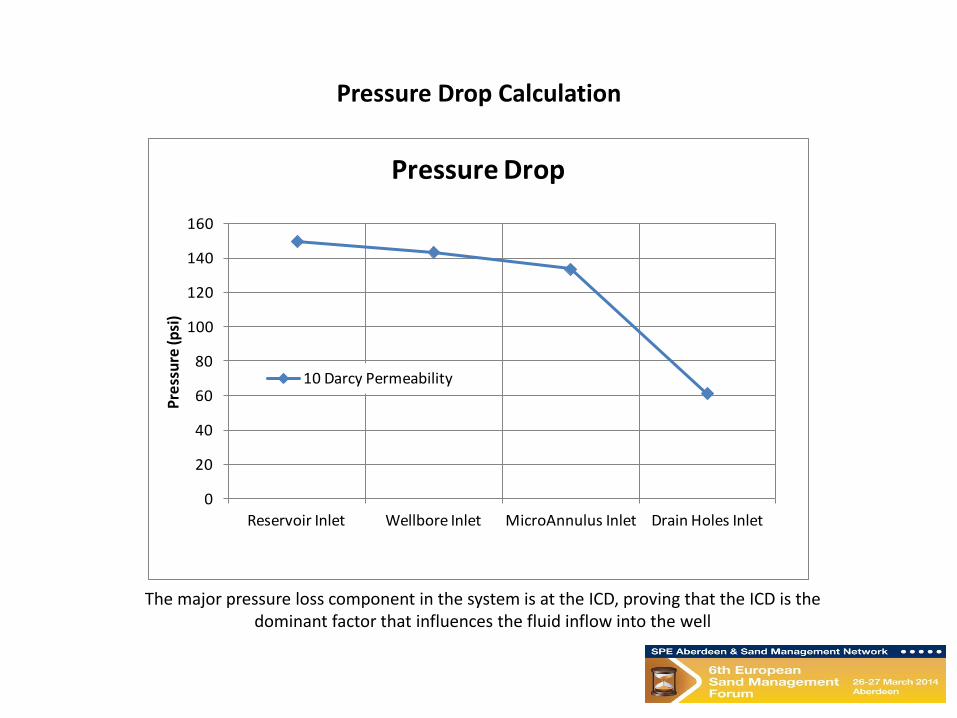
Pressure Drop Calculation
0
20
40
60
80
100
120
140
160
Reservoir Inlet Wellbore Inlet MicroAnnulus Inlet Drain Holes Inlet
Pre
ssu
re (p
si)Pressure Drop
10 Darcy Permeability
The major pressure loss component in the system is at the ICD, proving that the ICD is the dominant factor that influences the fluid inflow into the well
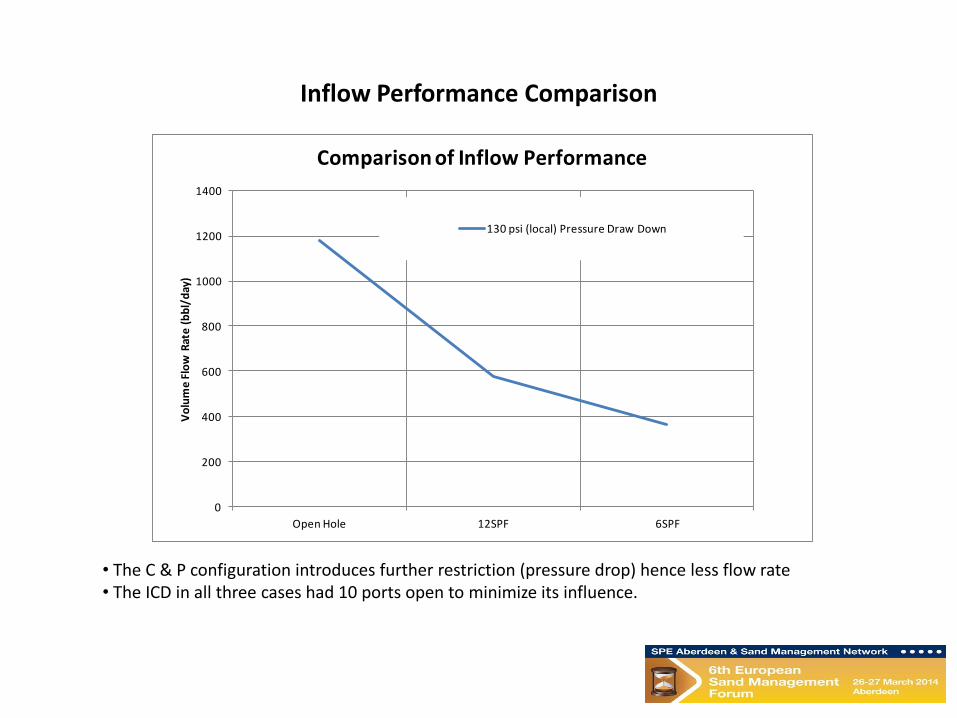
Inflow Performance Comparison
0
200
400
600
800
1000
1200
1400
Open Hole 12SPF 6SPF
Vo
lum
e F
low
Rat
e (
bb
l/d
ay)
Comparison of Inflow Performance
130 psi (local) Pressure Draw Down
• The C & P configuration introduces further restriction (pressure drop) hence less flow rate • The ICD in all three cases had 10 ports open to minimize its influence.

Productivity Index
y = 2.7065x + 13.626
y = 4.278x + 32.994
0
100
200
300
400
500
600
700
0 20 40 60 80 100 120 140
Vo
lum
e F
low
Rat
e (
bb
l/d
ay)
(Local) Pressure Draw Down (psi)
Inflow Performance Against Drawdown
6 SPF
12SPF
Linear (6 SPF)
Linear (12SPF)
• For the 12 spf configuration, increasing the drawdown results in higher inflow compared to the 6 spf configuration – hence higher Productivity Index • 12 spf is to be used for the complete model

C&P Completion Flow Structure Near the Wellbore
Hee
l
Toe
Insignificant pressure drop from reservoir to wellbore annulus away from the ICD and drainage layer ~ No inflow away from the drainage layer

The Complete Geometry: 12 spf C&P coupled to OH Completion
332 m of 12 SPF C&P 28 x Stand Alone Screen (SAS) , 28 x Inflow Control Device (ICD) More than 10,000 Perforations
930 m of OH 76 x Stand Alone Screen (SAS) , 76 x Inflow Control Device (ICD)
Over 500 million cells For multiphase runs up to 30,000 iterations Using 1024 parallel cores.......48 hours to convergence

Water Production; OH Completion On Its Own
0
500
1,000
1,500
2,000
2,500
3,000
3,500
4,000
4,500
S04 OH Only S05 OH Only S06 OH Only S07 OH Only S08 OH Only
Vo
lum
e F
low
Rat
e (
bp
d)
Reservoir Section
OH Completion Only
S04 OH Only
S05 OH Only
S06 OH Only
S07 OH Only
S08 OH Only
Section S05, despite having lower reservoir permeability and shorter length than the section S04, produces most of the water, due to all 10 ICD ports being open, compared to just 1 port being open on the S04 section; indicating that the ICD is the dominant factor to control the flow rate
10 D Permeability 1 ICD Port Open 386.7 m long
2 D Permeability 10 ICD Port Open 307.8 m long
10 D Permeability 1 ICD Port Open 92.9 m long
2 D Permeability 1 ICD Port Open 23.3 m long
10 D Permeability 10 ICD Port Open 118.6 m long
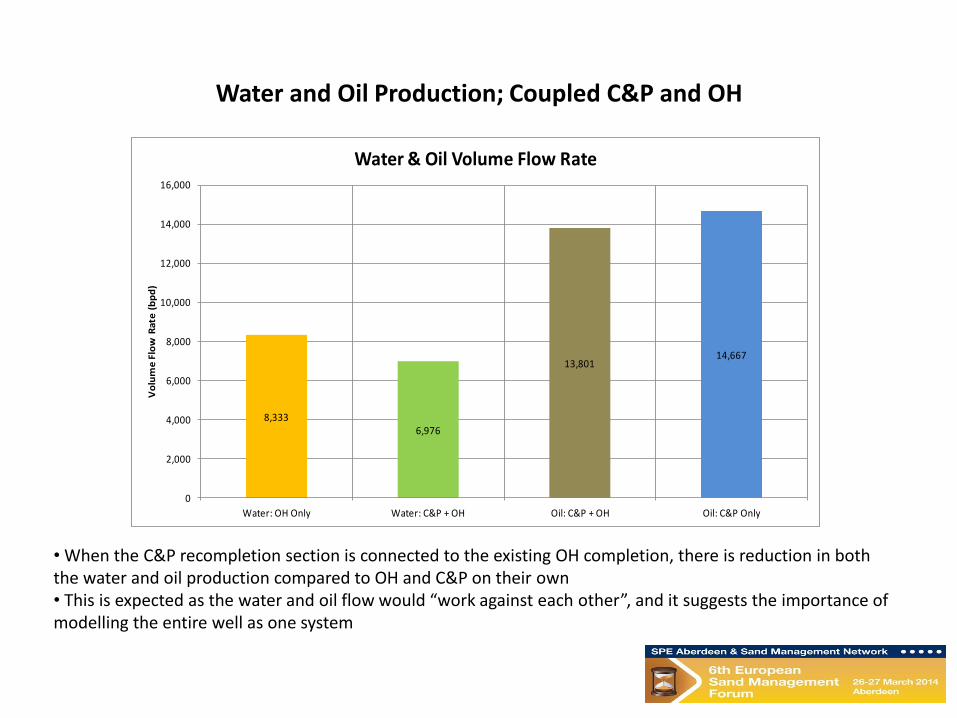
Water and Oil Production; Coupled C&P and OH
8,3336,976
13,80114,667
0
2,000
4,000
6,000
8,000
10,000
12,000
14,000
16,000
Water: OH Only Water: C&P + OH Oil: C&P + OH Oil: C&P Only
Vo
lum
e F
low
Rat
e (
bp
d)
Water & Oil Volume Flow Rate
• When the C&P recompletion section is connected to the existing OH completion, there is reduction in both the water and oil production compared to OH and C&P on their own • This is expected as the water and oil flow would “work against each other”, and it suggests the importance of modelling the entire well as one system
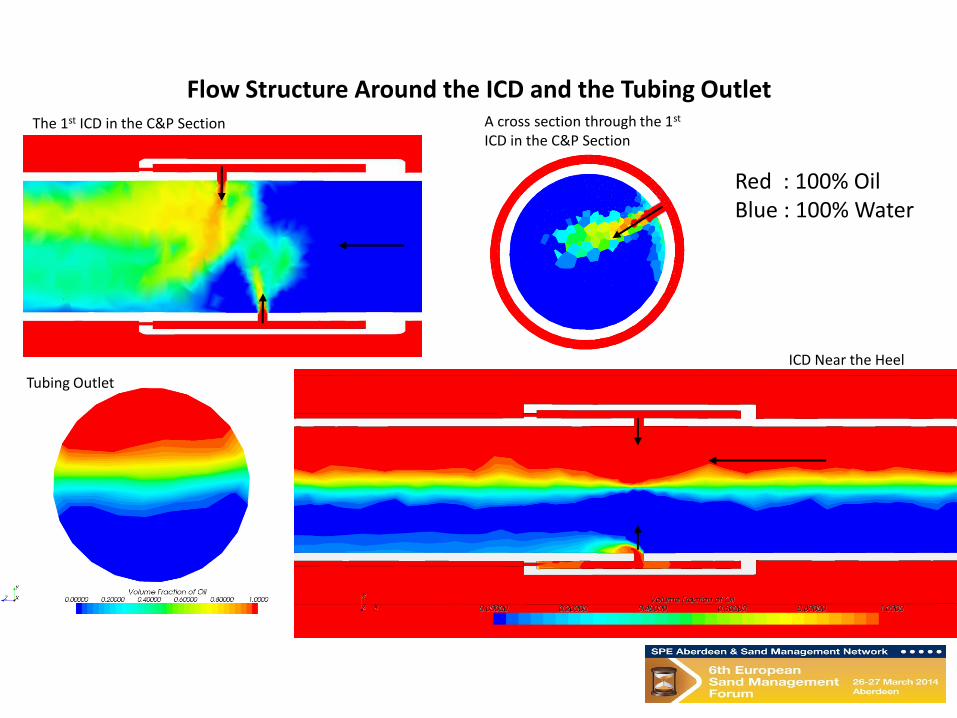
Flow Structure Around the ICD and the Tubing Outlet
Red : 100% Oil Blue : 100% Water
ICD Near the Heel
The 1st ICD in the C&P Section
Tubing Outlet
A cross section through the 1st ICD in the C&P Section
Summary
• A complex numerical challenge was solved using CFD and HPC
•Addition of the new completion will improve well productivity and still preserve drainage from the open hole section
• The sector model sensitivity runs proved that the perforations located away from the drainage layer of the screens had minimal contribution to the well’s productivity
• The sector models also proved that in terms of productivity, the OH ranked the best followed by the 12spf and 6spf completion
• ICD is the dominant factor in controlling the flow rate
• There is a considerable importance to model the C&P well and the OH well as one fully connected system
Acknowledgements
• Dr. Lesmana Djayapertapa, Ken Watson, Senergy •Barry Goodin, Vermilion Oil & Gas Australia Pty Ltd •Ken Ichihashi for his significant contribution in the early stages of this study • Vermillion and Senergy Management for permission to publish this material
Slide 20
Thank You Any Questions ?