full year 2020
TRANSCRIPT

FULL YEAR 2020 Results Presentation 7 May 2021

DISCLAIMER
2
This document has been prepared by Fine Foods & Pharmaceuticals N.T.M. S.p.A. for the sole purpose described herein. The
information herein is provided on a strictly confidential basis. By receiving this document the recipient undertakes with the Company to
maintain the contents of the document and the document itself strictly confidential. This document may not be copied, distributed or
reproduced in whole or in part, nor passed to any third party without the written consent of the Company.
The information contained herein does not purport to be comprehensive. The content of this document has a merely informative nature
and is not to be construed as providing investment advice. Interested parties should conduct their own investigation and analysis of the
Company and the data set forth in this document.
The statements contained herein have not been independently verified. No representation or warranty, either express or implied, is
made as to, and no reliance should be placed on, the fairness, accuracy, completeness, correctness or reliability of the information
contained herein. Neither the Company nor any of its representatives shall accept any liability whatsoever (whether in negligence or
otherwise) arising in any way in relation to such information or in relation to any loss arising from its use or otherwise arising in
connection with this presentation.
The information contained in this document, unless otherwise specified is only current as of the date of this document. Unless
otherwise stated in this document, the information contained herein is based on management information and estimates. This
presentation includes certain forward looking statements, projections, objectives and estimates reflecting the current views of the
management of the Company with respect to future events. Due to such uncertainties and risks, readers are cautioned not to place
undue reliance on such forward-looking statements as a prediction of actual results. All forward-looking statements included herein are
based on information available to the Company as of the date hereof. The Company undertakes no obligation to update publicly or
revise any forward-looking statement, whether as a result of new information, future events or otherwise, except as may be required by
applicable law. The information contained herein is subject to change without notice and past performance is not indicative of future
results. The Company may alter, modify or otherwise change in any manner the content of this document, without obligation to notify
any person of such revision or changes.

FINANCIAL HIGHLIGHTS
3
* Ebitda and Ebit Adjusted for non recurring costs amounting to 1.2 €m in 2020 and 2.8 €m in 2019
2020 and 2019 figures reported in this presentation have been prepared in accordance with IAS/IFRS also for the purposes of the translisting to MTA/STAR
2020 2019
REVENUE € 172.0 mln € 159.7 mln +8%
EBITDA * € 22.3 mln € 20.3 mln +10%
EBITDA MARGIN * 13.0% 12.7%
EBIT * € 10.7 mln € 10.9 mln - 2%
H2-2020 H2-2019
REVENUE € 96.6 mln € 76.5 mln + 26%
FINE FOODS I.D.
4
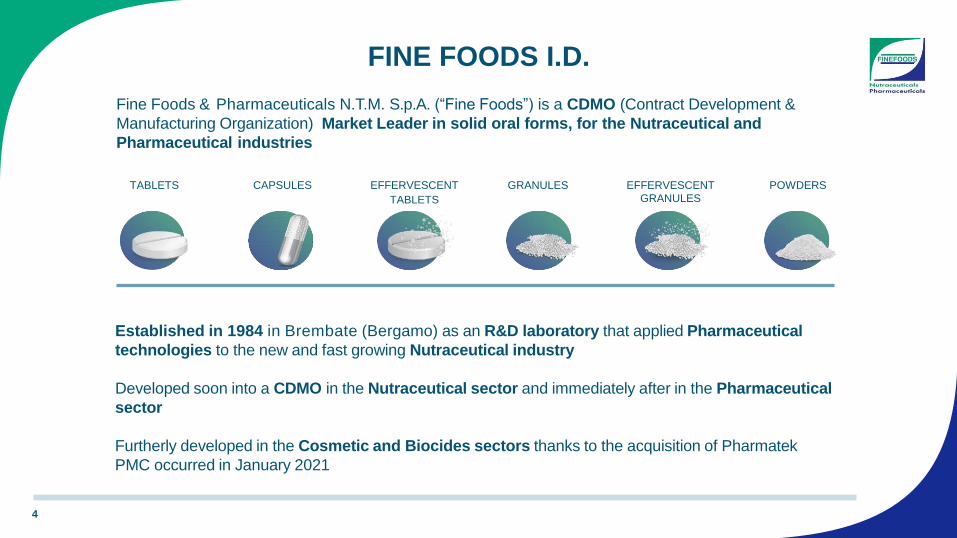
Fine Foods & Pharmaceuticals N.T.M. S.p.A. (“Fine Foods”) is a CDMO (Contract Development &
Manufacturing Organization) Market Leader in solid oral forms, for the Nutraceutical and
Pharmaceutical industries
Established in 1984 in Brembate (Bergamo) as an R&D laboratory that applied Pharmaceutical
technologies to the new and fast growing Nutraceutical industry
Developed soon into a CDMO in the Nutraceutical sector and immediately after in the Pharmaceutical
sector
Furtherly developed in the Cosmetic and Biocides sectors thanks to the acquisition of Pharmatek
PMC occurred in January 2021
TABLETS EFFERVESCENT
TABLETS
POWDERS GRANULES EFFERVESCENT
GRANULES
CAPSULES

CUSTOMERS’ LOYALTY
5
RETAINED KEY CLIENTS ACQUIRED BEFORE 2002 AND ADDED SEVERAL NEW ONES AFTERWARDS
2002
2010
* Sigma-Tau & Alfa Wassermann (now Alfasigma), Mylan (now Viatris), Fidifarm (now Dietpharm)
Selection of clients
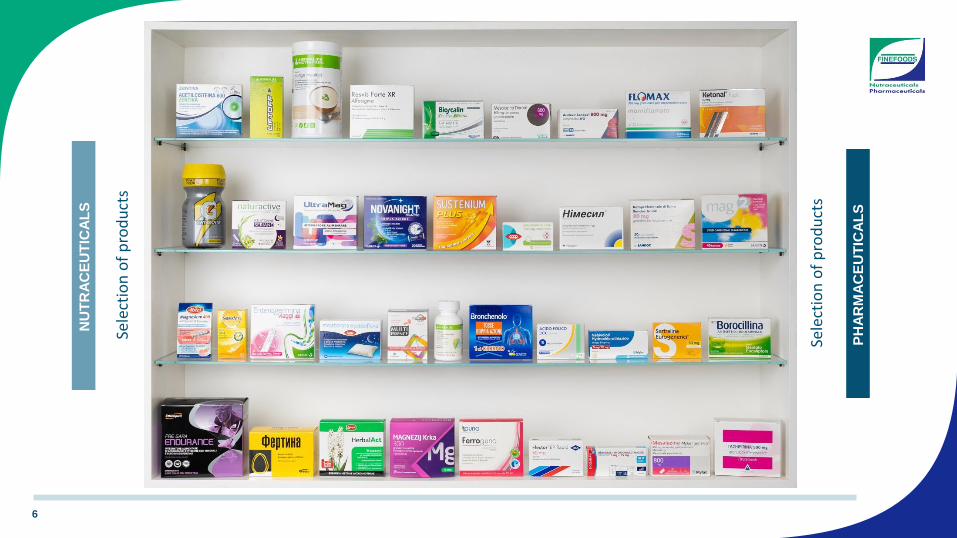
6
PH
AR
MA
CE
UT
ICA
LS
NU
TR
AC
EU
TIC
AL
S
Sele
ctio
n o
f p
rod
uct
s
Sele
ctio
n o
f p
rod
uct
s

FINE FOODS KEY FIGURES 2020
7
(1) 57€m revenue invoiced in Italy, of which 12€m delivered abroad | (2) SKUs means “Stock-Keeping Units”, namely single product codes
~ 52€m increase in revenue
over the last 3 years
162 new R&D
Projects in 2020
~100€m investments
over last 5 years
More than 100 customers,
mainly leading Pharmaceutical
and Nutraceutical players
~74% of products
sold in 2020 has been
delivered abroad (1)
~1.300 SKUs(2),
tailored to client needs
172€m Revenue in 2020 with
~11% CAGR over the last 10
years
~15% of employees
dedicated to R&D and QA
22.4 23.7 25.1
12.9 14.9 17.9
13.5 15.2
17.6
4.1%
13.5 15.2
17.6
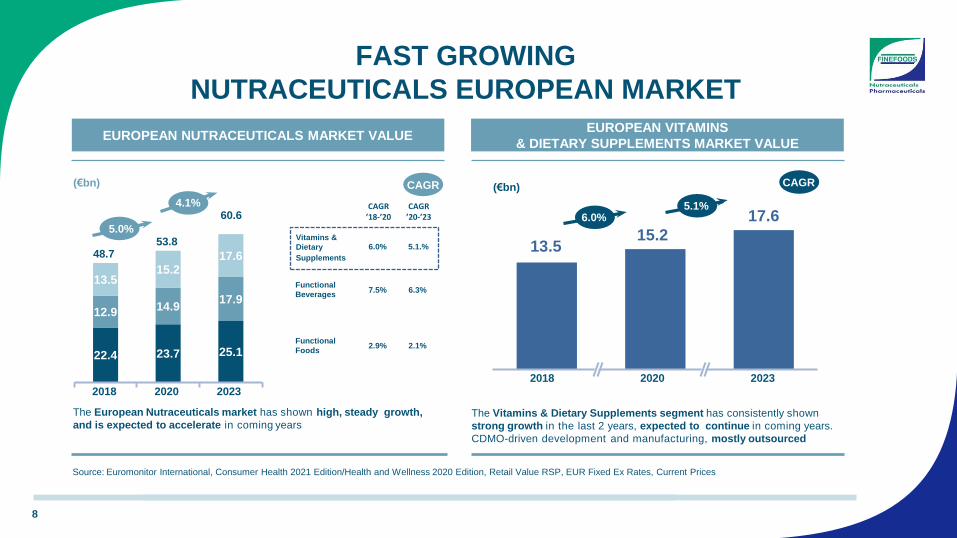
FAST GROWING
NUTRACEUTICALS EUROPEAN MARKET
8
EUROPEAN NUTRACEUTICALS MARKET VALUE EUROPEAN VITAMINS
& DIETARY SUPPLEMENTS MARKET VALUE
(€bn)
2018 2020 2023
The Vitamins & Dietary Supplements segment has consistently shown
strong growth in the last 2 years, expected to continue in coming years.
CDMO-driven development and manufacturing, mostly outsourced
5.0%
(€bn)
2018 2020 2023
6.0% 5.1%
CAGR
48.7 53.8
Source: Euromonitor International, Consumer Health 2021 Edition/Health and Wellness 2020 Edition, Retail Value RSP, EUR Fixed Ex Rates, Current Prices
6.0% 5.1.%
Functional
Beverages 7.5% 6.3%
Functional
Foods 2.9% 2.1%
CAGR ’18-’20
CAGR ’20-’23
Vitamins &
Dietary
Supplements
60.6
CAGR
The European Nutraceuticals market has shown high, steady growth,
and is expected to accelerate in coming years

PHARMACEUTICAL EUROPEAN PRODUCTION
SHOWS CONSISTENT NON-CYCLICAL GROWTH
9
EUROPEAN PHARMACEUTICAL PRODUCTION
Source: Euromonitor International, Industrial, Pharmaceuticals, 2020 Edition, Production MSP,
EUR Fixed Ex Rates, Current Prices
374 398
476
The European Pharmaceutical production is expected to continue its sound growth in coming years
(€bn)
2018 2020 2023
3.1%
CAGR
6.1% 23%
21%
19%
9%
7%
6%
15% Italia
Germania
Francia
Regno Unito
Spagna
Grecia
Altri paesi
Market Value:
9 €bn
Italy Germany France UK Spain Greece Other Countries
Source: Prometeia – Farmindustria 2020
EUROPEAN CDMOs (PHARMA) 2018 MARKET VALUE

FINE FOODS IS THE LARGEST ITALIAN CDMO
10
Note: Doppel, Biopharma, Nutrilinea, Mipharm, Procemsa and OFI are controlled by Private Equity investors
Source: Management elaboration on publicly retrievable selected information
SELECTED FINE FOODS’ ITALIAN COMPETITORS – 2019 REVENUES (€M)
020406080
100120140160180
Fin
e F
oo
ds
Do
pp
el
Bio
farm
a
SIIT
SPL
Lab
om
ar
Nu
trili
ne
a
Mip
har
m
E-P
har
ma
Pro
cem
sa
Val
ph
arm
a
Soch
im
Tru
ffin
i eR
egg
è OFI
Lach
ifar
ma
Pharma Nutra

Sources: Management elaboration on publicly retrievable selected information
Methodology: the three variables’ time series are divided by their respective value used as basis and multiplied by a factor of 100; the considered variables are Fine Foods and Competitors revenues
STRONGLY OUTPACED PEERS
Fine Foods has
substantially outgrown
its panel of Competitors
in the last 2 years
UNIQUE POSITIONING MASSIVE INVESTMENTS STRONG R&D
2017 2018 2019
Fine Foods
Competitors
trend
15%
5%
Fine Foods
Revenue
160 €m
Fine Foods
Revenue
120 €m
10%
2017-2019 REVENUES CAGR
~ 16% FINE FOODS vs ~ 5% AVERAGE OF COMPETITORS
% of growth
11
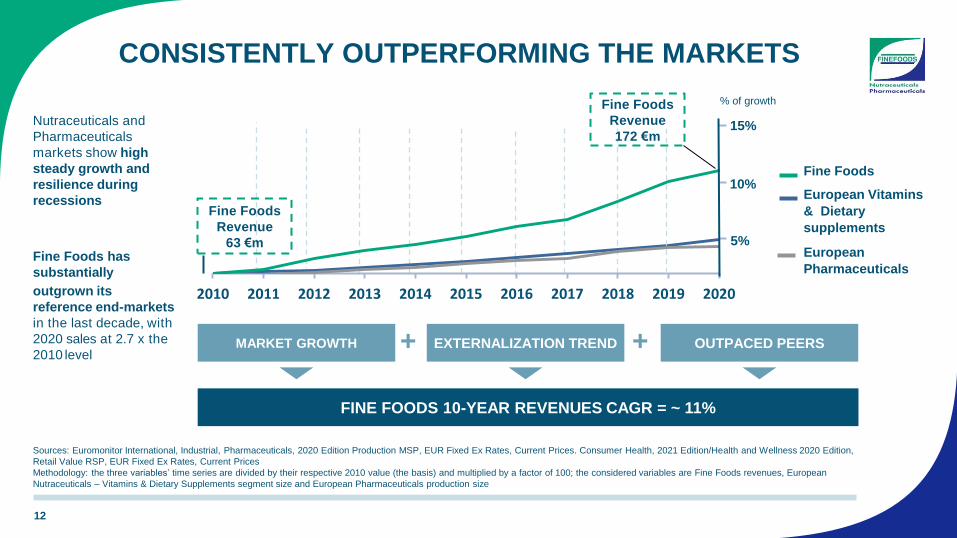
Nutraceuticals and
Pharmaceuticals
markets show high
steady growth and
resilience during
recessions
Fine Foods has
substantially
outgrown its
reference end-markets
in the last decade, with
2020 sales at 2.7 x the
2010 level
FINE FOODS 10-YEAR REVENUES CAGR = ~ 11%
MARKET GROWTH OUTPACED PEERS EXTERNALIZATION TREND +
Sources: Euromonitor International, Industrial, Pharmaceuticals, 2020 Edition Production MSP, EUR Fixed Ex Rates, Current Prices. Consumer Health, 2021 Edition/Health and Wellness 2020 Edition,
Retail Value RSP, EUR Fixed Ex Rates, Current Prices
Methodology: the three variables’ time series are divided by their respective 2010 value (the basis) and multiplied by a factor of 100; the considered variables are Fine Foods revenues, European
Nutraceuticals – Vitamins & Dietary Supplements segment size and European Pharmaceuticals production size
CONSISTENTLY OUTPERFORMING THE MARKETS
12
2010 2011 2012 2013 2014 2015 2016 2017 2018 2019 2020
Fine Foods
European Vitamins
& Dietary
supplements
European
Pharmaceuticals
15%
10%
5%
Fine Foods
Revenue
172 €m
Fine Foods
Revenue
63 €m
+
% of growth

projects in 2020
13
employees dedicated to scientific,
technical, quality & control activities
representing ~ 15% of total workforce
R&D has been an
integrating part of
the Company’s
Business Model
since foundation
new products
in production in 2020
R&D DRIVES THE GROWTH

14
INNOVATION Privileged access to new raw materials and
state-of-the-art technologies
TECHNICAL
EXPERTISE
Highly trained staff performs numerous advanced
activities, from sensory tests to stability assessments
(205 new stability tests started in 2020)
REGULATORY
COMPETENCE
Active FSE members, substantial in-house
regulatory expertise at the service of Customer’s
new developments
SUSTAINABILITY Continuous research of innovative solutions with
lower environmental impact
R&D COMPETITIVE ADVANTAGES

15
PHARMA LAB
at the service of
Food Supplement
innovative products
BRAIN &
MEMORY
BONE HEALTH
CHOLESTEROL
CONTROL
DIGESTIVE
TRACT HEALTH
EYE HEALTH
IMMUNE
DEFENCE
JOINT HEALTH
ORAL
REHYDRATION
WEIGHT
CONTROL
WOMAN, MAN
& CHILDREN
HEALTH
ANTIOXIDANTS
FIBERS
MULTIVITAMINS
& MINERALS
PROBIOTICS
SPORT
FORMULATIONS
TONICS &
ENERGETICS
AREAS OF COMPETENCE
OPPORTUNITY LAB
FORMULAE DATABANK
Huge assortment of finished
product formulations set to go
TAILOR-MADE SOLUTIONS
to support the most
demanding Customers
INNOVATION LAB
CROSS-FUNCTIONAL R&D
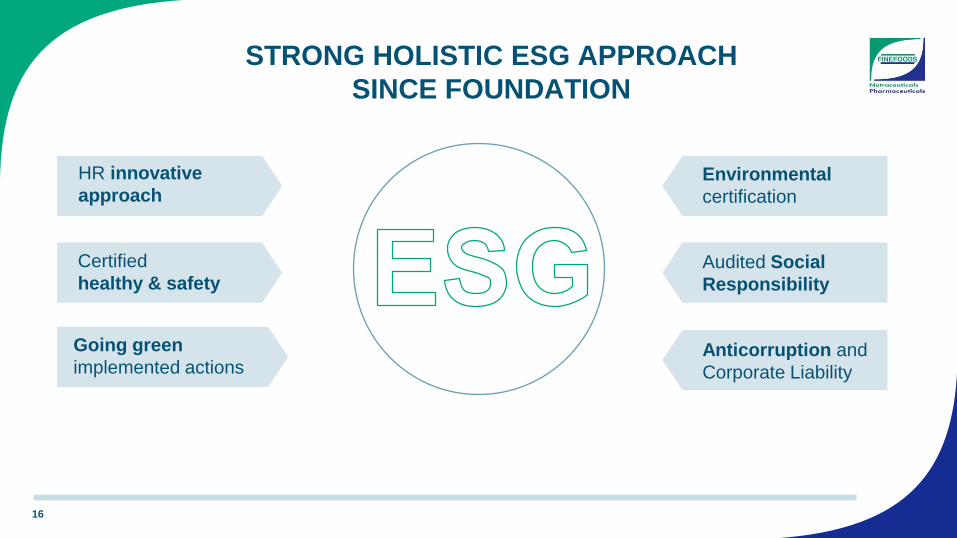
STRONG HOLISTIC ESG APPROACH
SINCE FOUNDATION
16
HR innovative
approach
Certified
healthy & safety
Going green
implemented actions
Environmental
certification
Audited Social
Responsibility
Anticorruption and
Corporate Liability

HR INNOVATIVE APPROACH
FOCUS ON HUMAN RESOURCES
WE HIRE
→ Our talents
Assessment Center to support an
innovative and sophisticated
recruiting process, including
personality, skills and language
tests
17
WE TRAIN
→ Our experts
• Ad hoc training for all
employees based on
competences gap analysis
• Tutoring Programs for
Production Operators
WE ENGAGE
→ Our team
• Value Sharing
• CEO bi-annual Results
Presentations to all employees
• Psychologist and Nutritionist
available to employee
• Twice-weekly HR desk for
employees
• Talent factory for young High
Potentials
WE VALUE
→ Our people
• Growth pattern for all employees
• High % of permanent employment
after a period of temporary
employment
• Diversity: gender, nationality, etc.
• A competitive compensation
system based on internal and
external benchmarking
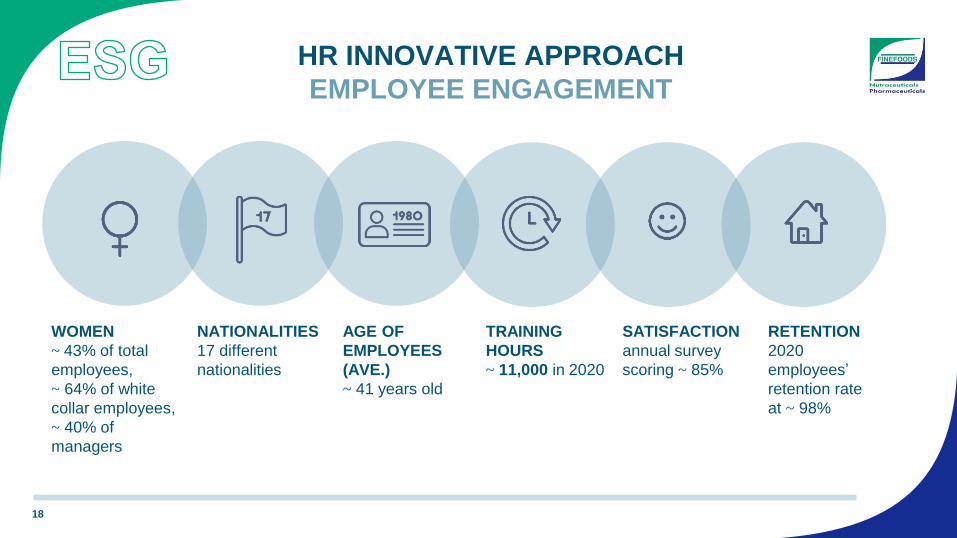
HR INNOVATIVE APPROACH
EMPLOYEE ENGAGEMENT
18
SATISFACTION
annual survey
scoring ~ 85%
RETENTION
2020
employees’
retention rate
at ~ 98%
WOMEN
~ 43% of total
employees,
~ 64% of white
collar employees,
~ 40% of
managers
NATIONALITIES
17 different
nationalities
AGE OF
EMPLOYEES
(AVE.)
~ 41 years old
TRAINING
HOURS
~ 11,000 in 2020

CERTIFIED HEALTH & SAFETY
19
WHAT Certified management
system
WHEN Certified since 2014
STANDARD International
SCOPE Continuous improvement on
Risk Prevention
and Staff Protection

ENVIRONMENTAL CERTIFICATION
20
WHAT Certified management
system
WHEN Certified since 2010
STANDARD
International
SCOPE Continuous improvements on
environmental issues

GOING GREEN – IMPLEMENTED ACTIONS
21
Programs for reduction of water consumption
Installation of 2 Co-generators
Installation of Solar panels
Programs for reduction of
environmental impact of waste

AUDITED SOCIAL RESPONSIBILITY
SMETA (Sedex Members Ethical Trade Audit) is the world’s leading social audit which aims at assessing a company based on its organization’s standards of labour, health
and safety, environment and business ethics.
Fine Foods has successfully been audited for the SMETA 4 Pillars, thus proving to be a reliable, sustainable and ethical supplier for all its clients.
22
Sedex Member
since 2016
ENVIRONMENTAL
HEALTH & SAFETY
LABOR STANDARDS
BUSINESS ETHICS

ANTICORRUPTION AND CORPORATE LIABILITY
23
WHAT
Organizational, managerial
and control models, to
prevent crimes committed
by employees and for
which the company may be
held liable.
WHEN since 2015
HOW risk assessment, code
of ethics, whistleblowing
SCOPE avoid corruption
and corporate liability
VERIFIED Independent controlling body
(ODV)
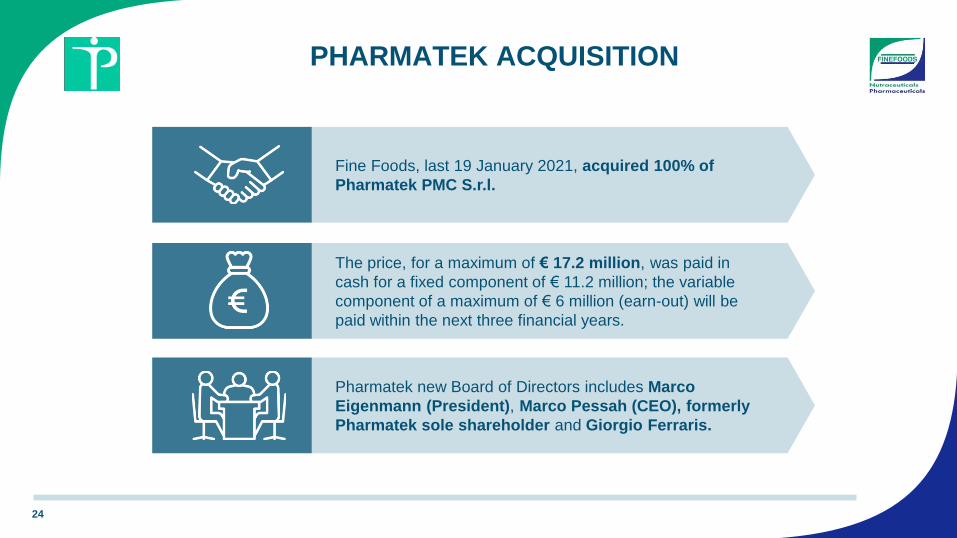
PHARMATEK ACQUISITION
24
Fine Foods, last 19 January 2021, acquired 100% of
Pharmatek PMC S.r.l.
The price, for a maximum of € 17.2 million, was paid in
cash for a fixed component of € 11.2 million; the variable
component of a maximum of € 6 million (earn-out) will be
paid within the next three financial years.
Pharmatek new Board of Directors includes Marco
Eigenmann (President), Marco Pessah (CEO), formerly
Pharmatek sole shareholder and Giorgio Ferraris.

PHARMATEK KNOW-HOW AND TECHNOLOGIES
25
Pharmatek is a CDMO active in the sectors of cosmetics,
biocides and medical devices manufactured in different
Pharmaceutical Forms
LIQUIDS GEL CREAMS OINTMENTS
Pharmatek production includes,
among others:
• body creams
• face creams
• tonic lotions
• scrubs
• toothpaste
• mouthwash
• moisturizers
• deodorants
• skin disinfectants
• sanitizing gel

26
Sele
ctio
n o
f p
rod
uct
s

STRONG CROSS SELLING POTENTIAL
27
Source: Fine Foods
FINE FOODS GROUP BUSINESS UNITS
NUTRACEUTICALS
PHARMACEUTICALS COSMETICS - BIOCIDES
Pharmatek will benefit of Fine Foods’
Organizational Structure,
Financial Solidity and
Consolidated Business Model
• new CDMO market segments
• new pharmaceutical forms
• R&D sinergies
• new commercial relationships
• cross selling relationship
with existing customers

The European Cosmetic and Biocide market is expected to accelerate growth in coming years
74 77 84
2018 2020 2023
CAGR
PHARMATEK REFERENCE MARKETS
28
(€bn)
Source: Euromonitor International, Consumer Health 2021 Edition/Beauty and Personal Care 2020 Edition, 2020/Home Care Edition 2021, Retail Value RSP, EUR Fixed Ex Rates, Current Prices
Cosmetics as per aggregation of Euromonitor’s Bath and Shower, Deodorants, Hair Care, Skin Care
Biocides as per aggregation of Euromonitor’s Oral Care, Dermatologicals, Surface Care, Adult Mouth Care
1.7%
2.8%
EUROPEAN COSMETIC AND BIOCIDES MARKET

FINE FOODS SIGNIFICANT OVERALL REVENUE GROWTH
29
Increase in 2020 Revenues
driven by very strong
growth in H2-2020: +26%
compared to H2-2019
FO
OD
119.2 132.0
31/12/2019 31/12/2020
40.5 40.0
31/12/2019 31/12/2020
PH
AR
MA
RE
VE
NU
ES
119.
6
159.7 172.0
31/12/2019 31/12/2020
Figures according to IAS-IFRS principles
Revenue break-down
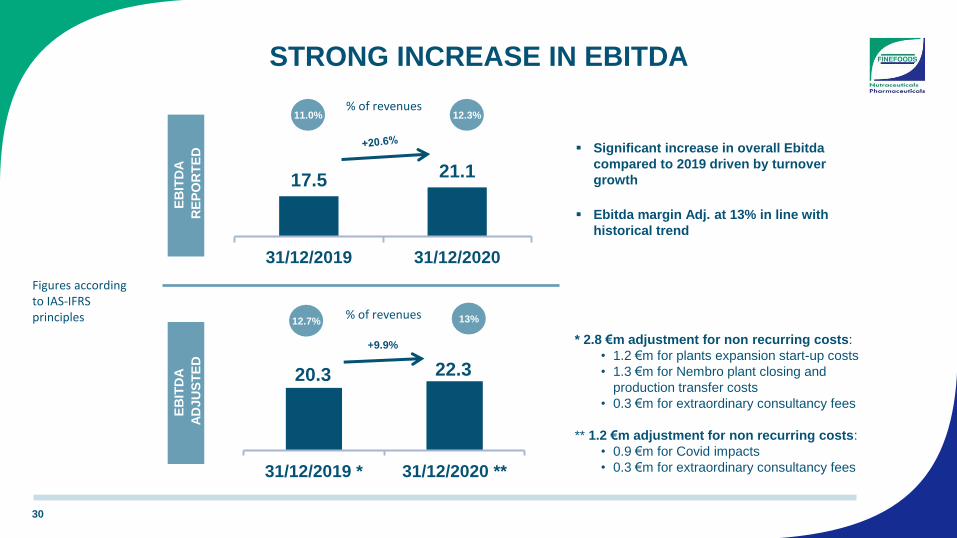
STRONG INCREASE IN EBITDA
30
RE
VE
NU
ES
119.6
12.7% 13%
20.3 22.3
31/12/2019 * 31/12/2020 **
+9.9%
11.0% 12.3%
17.5 21.1
31/12/2019 31/12/2020
Significant increase in overall Ebitda
compared to 2019 driven by turnover
growth
Ebitda margin Adj. at 13% in line with
historical trend
* 2.8 €m adjustment for non recurring costs:
• 1.2 €m for plants expansion start-up costs
• 1.3 €m for Nembro plant closing and
production transfer costs
• 0.3 €m for extraordinary consultancy fees
** 1.2 €m adjustment for non recurring costs:
• 0.9 €m for Covid impacts
• 0.3 €m for extraordinary consultancy fees
% of revenues
% of revenues
Figures according to IAS-IFRS principles
EB
ITD
A
AD
JU
ST
ED
EB
ITD
A
RE
PO
RT
ED
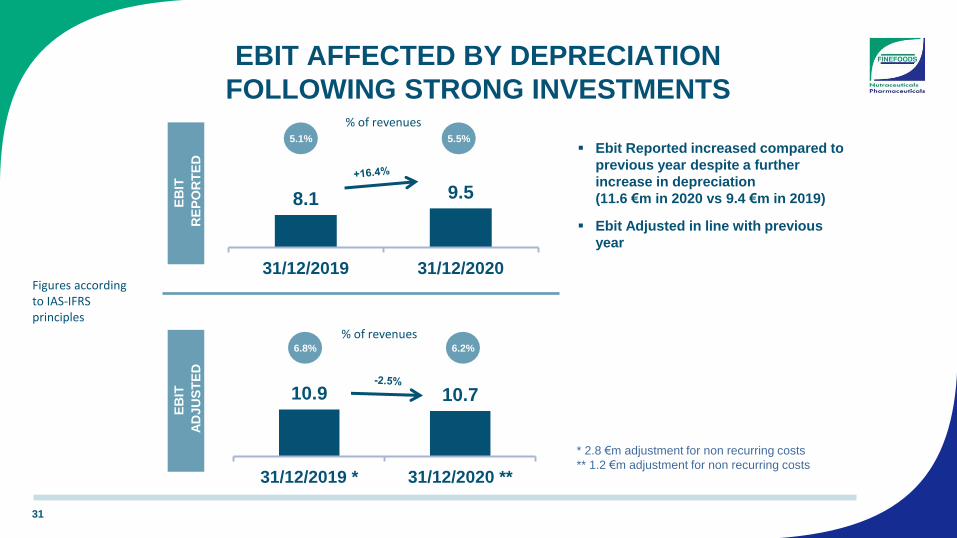
EBIT AFFECTED BY DEPRECIATION
FOLLOWING STRONG INVESTMENTS
31
RE
VE
NU
ES
E
BIT
AD
JU
ST
ED
119.6
6.8% 6.2%
10.9 10.7
31/12/2019 * 31/12/2020 **
5.1% 5.5%
8.1 9.5
31/12/2019 31/12/2020
EB
IT
RE
PO
RT
ED
Ebit Reported increased compared to
previous year despite a further
increase in depreciation
(11.6 €m in 2020 vs 9.4 €m in 2019)
Ebit Adjusted in line with previous
year
* 2.8 €m adjustment for non recurring costs
** 1.2 €m adjustment for non recurring costs
% of revenues
% of revenues
EB
IT
AD
JU
ST
ED
EB
IT
RE
PO
RT
ED
Figures according to IAS-IFRS principles

NET INCOME DRIVEN BY POSITIVE PERFORMANCE
32
RE
VE
NU
ES
N
ET
IN
CO
ME
AD
JU
ST
ED
119.6
7.4% 5.4%
11.9 9.3
31/12/2019 * 31/12/2020 **
-1.7% 7.8%
-2.8
13.4
31/12/2019 31/12/2020
NE
T I
NC
OM
E
RE
PO
RT
ED
Net Income 2020 mainly impacted by:
• fair value evaluation of financial asset (+2.1 €m
net of tax effect)
• fair value evaluation of warrants (+4.9 €m)
Net Income 2019 mainly impacted by:
• fair value evaluation of financial asset (+3.9 €m
net of tax effect)
• fair value evaluation of warrants (-12.6 €m)
In addition to what reported in previous slides, the
variance between these effects mainly explains the
variation occurred from 2019 to 2020
* 14.7 €m Adjustments:
• 2.1 €m non recurring costs net of tax effect
• 12.6 €m negative effect of warrant fair value measurement
** 4.1 €m Adjustments:
• 0.8 €m non recurring costs net of tax effect
• -4.9 €m positive effect on warrant fair value measurement
% of revenues
% of revenues
Figures according to IAS-IFRS principles
NE
T I
NC
OM
E
AD
JU
ST
ED
NE
T I
NC
OM
E
RE
PO
RT
ED

HEALTHY CAPITAL ALLOCATION
33
Capex support business expansion
22.5 19.6
17.1 12.6
(20.6) (22.7)
31/12/2019 31/12/2020
Inventory Trade Receivables Trade Payables
9.6
5.6% 11.9% % on Revenues
19.0
NWC strongly decreased compared to 2019 mainly
due to further impovement in collection terms
and inventory management
- 4.5
- 2.9
- 2.1
NET WORKING CAPITAL CAPEX
10.1
15.1
9.3
0,8
0,9
01/01/2019 - 31/12/2019 01/01/2020 - 31/12/2020
Extraordinary Capex Tangibles Ordinary Capex Intangibles
Ordinary Capex Tangibles
% on Revenues
9.3%
12.6%
16
20.2 Figures according to IAS-IFRS principles

1
1 1 11.6
9.4 3.7 (15.7)
(4.0)
43.0 42.8
13.4
24.4 53.8
(2.7) 2.7
NFP
ADJ
2019 *
NET FINANCIAL POSITION EVOLUTION
FROM 2019 TO 2020
34
NFP
ADJ
2020**
NWC Net
Income
Amortization
&
Depreciation
BuyBack Dividend
Equity Others NET CAPEX
Warrant
conversion
NFP
2019
NFP
2020
Cash-in of 17.5 €m before equity cash out for Buy Back and Dividends of 6.7 €m
*18.6 €m adjustment for warrant financial liability
** 11 €m adjustment for warrant financial liability
MOST SIGNIFICANT CASH-IN AND CASH-OUT

NEW BOARD OF DIRECTORS OF FINE FOODS
35
Marco Eigenmann
President
Giorgio Ferraris
CEO
Marco Costaguta*
Director
Ada Imperadore**
Director
Chiara Medioli**
Director
Adriano Pala*
Director
Susanna Pedretti**
Director
*Non Executive Director
**Indipendent Director
The Fine Foods Shareholders' Meeting has appointed a new Board of Directors, to be
a step ahead on the Corporate Governance best practice, including gender quotas

SHAREHOLDING STRUCTURE AS OF 06.05.2021
36
% OF EQUITY CAPITAL
53.5% Eigenfin S.r.l. + M. Eigenmann
3.7% Treasury Shares
42.8% Market
65.6%* Eigenfin S.r.l.
+ M. Eigenmann
34.4% Market
% OF VOTING RIGHTS
Fine Foods Shares N. of shares (Mln) %
Listed Shares 21.4 86%
Unlisted Shares 3.5 14%
Total 24.9 100%
FLOATING: ~ 46%
* Net of Treasury Shares

WHY FINE FOODS?
37
SOLID TRACK RECORDS
RELIABILITY
STRONG FINANCIALS
CRITICAL MASS
ROBUST MANAGEMENT
STRUCTURE
ADVANCED HR MANAGEMENT
GRANULAR FINANCIAL
CONTROLLING
HIGH AND STABLE CAGR IN THE LAST 10 YRS
PERFORMANCE
LONG LASTING CUSTOMER’S RELATIONS
HOLISTIC SUSTAINABILITY
SINCE 2010
GROWTH SUSTAINED
BY R&D PARTNERSHIPS
PHARMA FOOD COSMETIC UNIQUE
PRESENCE
FUTURE
CROSS FUNCTIONAL INNOVATIVE R&D
ATTRACTIVE AND GROWING MARKETS
STRUCTURE TO EXPLOIT M&A
OPPORTUNITIES

BACK-UP
38

MANUFACTURING PLANTS GEOGRAPHICAL FOOTPRINT
39
ZINGONIA
BERGAMO
BREMBATE
MILAN
HQ NUTRACEUTICALS PHARMACEUTICALS PMC - COSMETICS
PHARMATEK PLANT
CREMOSANO

CUSTOMER CONCENTRATION WITNESSES
SHARE OF WALLET STRONG RISE
40
2020 CUSTOMERS IN % OF TOTAL REVENUES
77%
5%
Top 5 Next 10 Other
18%
~ 800 SKUs
~ 60 Countries OW:
ITALY
UE
UK
RUSSIA
SOUTH AFRICA
TURKEY
MALAYSIA
ISRAEL
CHINA
SWITZERLAND
THAILAND
SINGAPORE
TAIWAN
AUSTRALIA
HONG KONG
JAPAN
……………..

NUTRACEUTICAL PLANT EXPANSION - ZINGONIA
41
The operating complex covers a total area of 45,600 sqm
19.7€m in CAPEX over the 2016-2019 period
The expansion increased the covered area by ~ 80% since 2016
Pre-existing covered area: 15,900 sqm Final covered area: 28,800 sqm
Note: all squared-meters data have been approximated to the nearest hundreds

PHARMACEUTICAL PLANT EXPANSION – BREMBATE
42
Note: all squared-meters data have been approximated to the nearest hundreds
Pre-existing covered area: 5,700 sqm
Final covered area: 14,200 sqm
The operating complex covers a total area of 26,100 sqm
15.2€m for Plant Expansion over 2016-2019 and further 3.8€m in 2020 for a new warehouse construction and the purchase of
a 5,400 sqm land
The expansion increased the covered area by ~ 150% since 2016
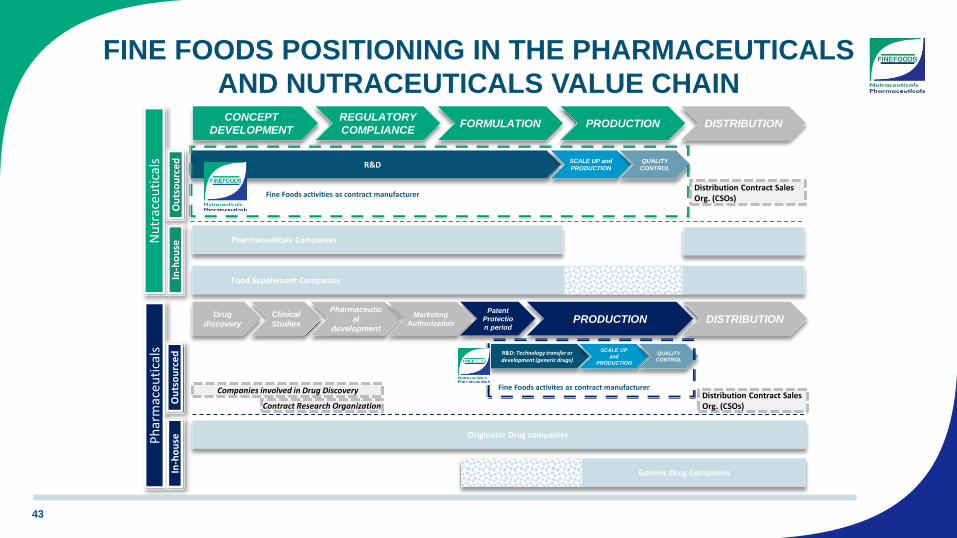
43
CONCEPT
DEVELOPMENT FORMULATION
REGULATORY
COMPLIANCE PRODUCTION DISTRIBUTION
Drug
discovery
Clinical
Studies DISTRIBUTION
Companies involved in Drug Discovery
Contract Research Organization
R&D P
har
mac
euti
cals
N
utr
aceu
tica
ls
SCALE UP and
PRODUCTION
QUALITY
CONTROL
In-h
ou
se
Ou
tso
urc
ed
Fine Foods activities as contract manufacturer
Originator Drug companies
Food Supplement Companies
In-h
ou
se
Ou
tso
urc
ed
Distribution Contract Sales Org. (CSOs)
Distribution Contract Sales Org. (CSOs)
Pharmaceuticals Companies
PRODUCTION Patent
Protectio
n period
R&D: Technology transfer or development (generic drugs)
SCALE UP
and
PRODUCTION
QUALITY
CONTROL
Fine Foods activites as contract manufacturer
Pharmaceutic
al
development
Marketing
Authorization
Generic Drug Companies
FINE FOODS POSITIONING IN THE PHARMACEUTICALS
AND NUTRACEUTICALS VALUE CHAIN

FINE FOODS FINANCIAL INSTRUMENTS
44
Total Shares as of 06.05.2021: 24,906,813
• Ordinary Shares: 21,406,813
• Multiple Voting Rights Shares: 3,500,000
Controlling Shareholder: Marco Francesco
Eigenmann even towards Eigenfin S.r.l.
• 53.5% of Share Capital
• 65.6% of voting rights (net of Treasury
Shares)
Total Warrants as of 06.05.2021: 3,091,616
• Warrant Fine Foods & Pharmaceutical N.T.M.
S.p.A.: 3,091,616
Buyback
• Max purchasable shares: 2,000,000
• N. Treasury Shares as of 06.05.2021: 933,473
• Total cash out: 10.1€m
• % of Treasury Shares on Total Shares as of
06.05.2021: 3.7%

FINE FOODS SHARES AND WARRANTS AS OF 06.05.2021
45
UNLISTED SHARES
LISTED SHARES
Multiple Voting Rights Shares:
3,500,000
• Totally owned by Marco Francesco
Eigenmann even towards Eigenfin
S.r.l.
• Conversion Ratio: 1x in Ordinary
Shares
• Conversion: among others at simple
request of the owner
• Same rights as ordinary shares, other
than voting rights.
• Each Multiple-voting Share provides
the holder with three votes in all
Shareholders’ Meetings
Ordinary Shares: 21,406,813
• Price: Warrants give right to buy shares at
price of € 0.10 each
• Conversion Ratio: is variable and based on
Monthly Share Price with strike price at €
9.50 and Cap at € 13.00
• Maximum converted Ordinary Shares: No.
838,755 (at Max Conversion Ratio 0.2713x),
with capital increase of € 83,875.5
• Warrants expiry on 1 October 2023 (or
before, in case of “Accelerated Condition”, if
Monthly Share Price is higher than the
Threshold Price
(€ 13.00))
LISTED WARRANTS
Warrant Fine Foods & Pharmaceutical
N.T.M. S.p.A.: 3,091,616

Fine Foods & Pharmaceuticals N.T.M. S.p.A. Investor Relations Tel. +39 035 4821382 [email protected]
Banca Akros S.p.A. Nomad Viale Eginardo 29, Milano [email protected]
CDR Communication IR Advisor Paola Buratti – [email protected] Media Relations Marianna Tremolada - [email protected]
CONTACTS