full year 2017 conference call - welcome to novo … 4 5,05 4,10 3,50 4,72 11,82 11,82 highlights...
TRANSCRIPT

Slide 1
5,05
4,10
3,50
4,72
11,82 11,82
Full year 2017
Conference call
Manato Ohara, diagnosed with type 1 diabetes Kanagawa, Japan
Slide 2
5,05
4,10
3,50
4,72
11,82 11,82
Agenda
Conference call Full year 2017
Highlights and key events
R&D update
Financials and outlook
Sales update

Slide 3
5,05
4,10
3,50
4,72
11,82 11,82
Forward-looking statements
Novo Nordisk’s reports filed with or furnished to the US Securities and Exchange Commission (SEC), including the company’s Annual Report 2016 and Form 20-F, which are both filed with the SEC in February 2017 in continuation of the publication of the Annual Report 2016, and written information released, or oral statements made, to the public in the future by or on behalf of Novo Nordisk, may contain forward-looking statements. Words such as ‘believe’, ‘expect’, ‘may’, ‘will’, ‘plan’, ‘strategy’, ‘prospect’, ‘foresee’, ‘estimate’, ‘project’, ‘anticipate’, ‘can’, ‘intend’, ‘target’ and other words and terms of similar meaning in connection with any discussion of future operating or financial performance identify forward-looking statements. Examples of such forward-looking statements include, but are not limited to:
• Statements of targets, plans, objectives or goals for future operations, including those related to Novo Nordisk’s products, product research, product development, product introductions and product approvals as well as cooperation in relation thereto
• Statements containing projections of or targets for revenues, costs, income (or loss), earnings per share, capital expenditures, dividends, capital structure, net financials and other financial measures
• Statements regarding future economic performance, future actions and outcome of contingencies such as legal proceedings, and
• Statements regarding the assumptions underlying or relating to such statements.
These statements are based on current plans, estimates and projections. By their very nature, forward-looking statements involve inherent risks and uncertainties, both general and specific. Novo Nordisk cautions that a number of important factors, including those described in this presentation, could cause actual results to differ materially from those contemplated in any forward-looking statements.
Factors that may affect future results include, but are not limited to, global as well as local political and economic conditions, including interest rate and currency exchange rate fluctuations, delay or failure of projects related to research and/or development, unplanned loss of patents, interruptions of supplies and production, product recall, unexpected contract breaches or terminations, government-mandated or market-driven price decreases for Novo Nordisk’s products, introduction of competing products, reliance on information technology, Novo Nordisk’s ability to successfully market current and new products, exposure to product liability and legal proceedings and investigations, changes in governmental laws and related interpretation thereof, including on reimbursement, intellectual property protection and regulatory controls on testing, approval, manufacturing and marketing, perceived or actual failure to adhere to ethical marketing practices, investments in and divestitures of domestic and foreign companies, unexpected growth in costs and expenses, failure to recruit and retain the right employees, and failure to maintain a culture of compliance.
Please also refer to the overview of risk factors in ‘Risk Management’ on pp 40-43 of the Annual Report 2016.
Unless required by law, Novo Nordisk is under no duty and undertakes no obligation to update or revise any forward-looking statement after the distribution of this presentation, whether as a result of new information, future events or otherwise.
Important drug information
• Victoza® (liraglutide 1.2 mg & 1.8 mg) is approved for the management of type 2 diabetes only
• Saxenda® (liraglutide 3 mg) is approved in the US and EU for the treatment of obesity only
Conference call Full year 2017

Slide 4
5,05
4,10
3,50
4,72
11,82 11,82
Highlights – Full year 2017
Conference call Full year 2017
Research and Development • Ozempic® approved in the US and positive CHMP opinion issued in the EU • Cardiovascular outcomes study, SOUL, for Ozempic® to be initiated mid 2018 • Phase 3a programme STEP and cardiovascular outcomes study SELECT with semaglutide in obesity to be initiated in 2018
Sales development • Sales increased by 2% in local currencies and were unchanged in Danish kroner
• International Operations grew by 5% in local currencies • North America Operations sales were unchanged in local currencies • Tresiba® and Victoza® accounted for the largest share of growth and grew by 85% and 18% in local currencies, respectively
Financials • Operating profit increased by 5% in local currencies and by 1% in Danish kroner • Diluted earnings per share increased by 3% to 15.39 DKK per share • 3% increase in total dividend to DKK 7.85 per share of DKK 0.20 proposed (including interim dividend of DKK 3.00 paid in
August 2017) • New share repurchase programme of up to DKK 14 billion to be executed during the coming 12 months • 2018 financial outlook:
• Sales growth is expected to be 2-5% measured in local currencies (around 7% lower reported) • Operating profit growth is expected to be 1-5% measured in local currencies (around 10% lower reported)
Slide 5
5,05
4,10
3,50
4,72
11,82 11,82
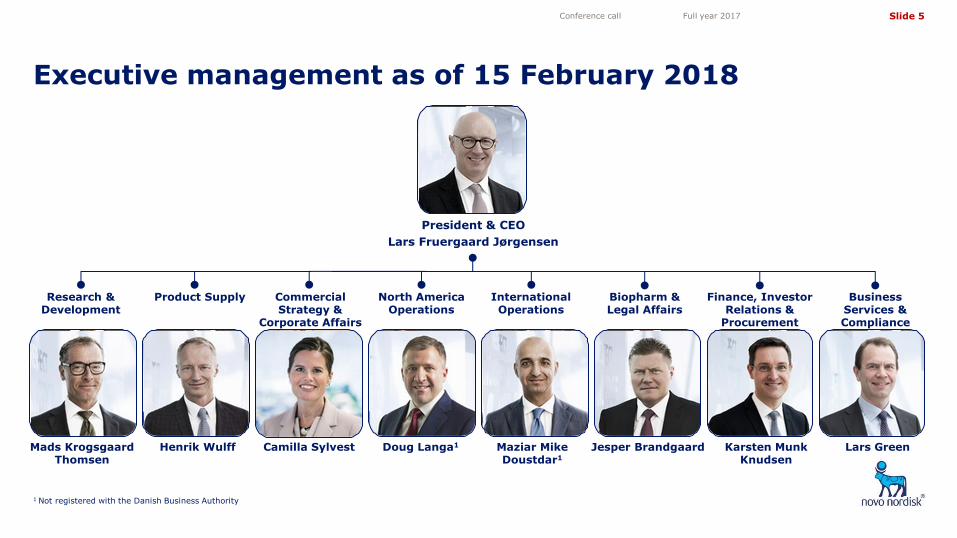
Executive management as of 15 February 2018
Conference call Full year 2017
President & CEO
Doug Langa1
Maziar Mike Doustdar1
Mads Krogsgaard Thomsen
Karsten Munk Knudsen
Henrik Wulff
North America Operations
International Operations
Research & Development
Biopharm & Legal Affairs
Product Supply
Lars Fruergaard Jørgensen
Business Services & Compliance
Lars Green
1 Not registered with the Danish Business Authority
Commercial Strategy &
Corporate Affairs
Camilla Sylvest
Finance, Investor Relations &
Procurement
Jesper Brandgaard
Slide 6
5,05
4,10
3,50
4,72
11,82 11,82
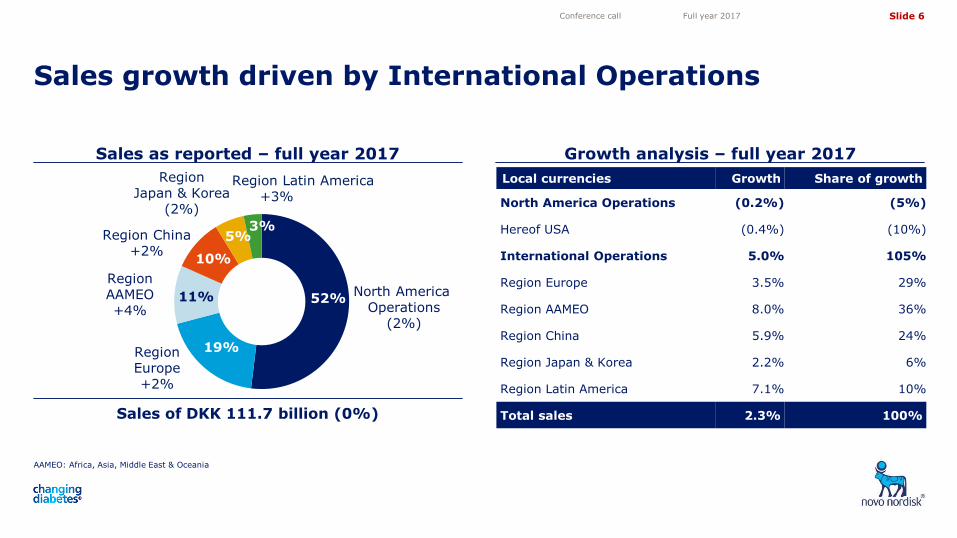
Growth analysis – full year 2017
Sales growth driven by International Operations
Conference call Full year 2017
Sales as reported – full year 2017
Sales of DKK 111.7 billion (0%)
Local currencies Growth Share of growth
North America Operations (0.2%) (5%)
Hereof USA (0.4%) (10%)
International Operations 5.0% 105%
Region Europe 3.5% 29%
Region AAMEO 8.0% 36%
Region China 5.9% 24%
Region Japan & Korea 2.2% 6%
Region Latin America 7.1% 10%
Total sales 2.3% 100%
Region AAMEO +4%
Region China +2%
Region Japan & Korea
(2%)
Region Europe +2%
North America Operations
(2%)
Region Latin America +3%
AAMEO: Africa, Asia, Middle East & Oceania
19%
11%
10%
5% 3%
52%
Slide 7
5,05
4,10
3,50
4,72
11,82 11,82
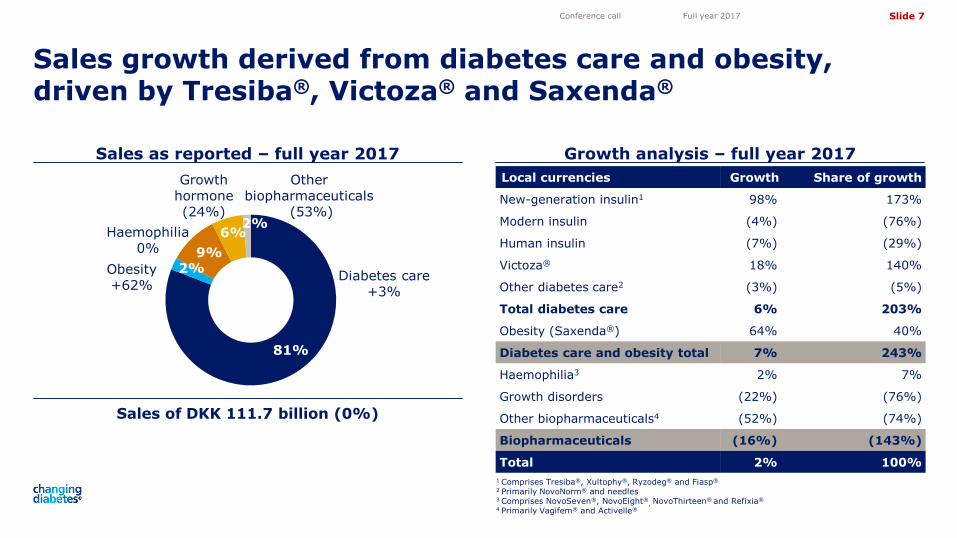
Local currencies Growth Share of growth
New-generation insulin1 98% 173%
Modern insulin (4%) (76%)
Human insulin (7%) (29%)
Victoza® 18% 140%
Other diabetes care2 (3%) (5%)
Total diabetes care 6% 203%
Obesity (Saxenda®) 64% 40%
Diabetes care and obesity total 7% 243%
Haemophilia3 2% 7%
Growth disorders (22%) (76%)
Other biopharmaceuticals4 (52%) (74%)
Biopharmaceuticals (16%) (143%)
Total 2% 100%
Sales growth derived from diabetes care and obesity, driven by Tresiba®, Victoza® and Saxenda®
Conference call Full year 2017
Sales as reported – full year 2017 Growth analysis – full year 2017
1 Comprises Tresiba®, Xultophy®, Ryzodeg® and Fiasp®
2 Primarily NovoNorm® and needles 3 Comprises NovoSeven®, NovoEight®
, NovoThirteen® and Refixia®
4 Primarily Vagifem® and Activelle®
Other biopharmaceuticals
(53%)
7% Haemophilia 0%
11% Diabetes care
+3%
79%
3%
Growth hormone
(24%)
Sales of DKK 111.7 billion (0%)
Obesity +62%
2% 9%
6% 2%
81%
Slide 8
5,05
4,10
3,50
4,72
11,82 11,82
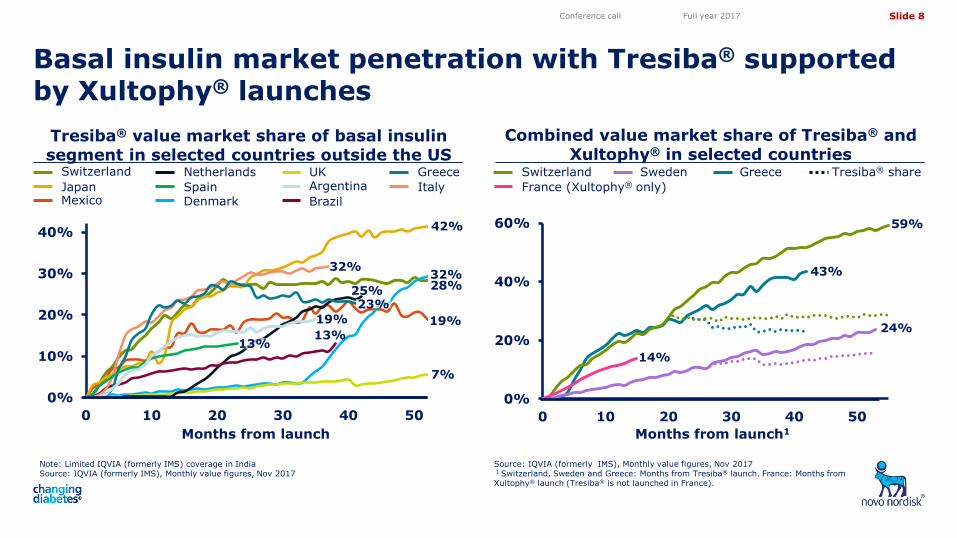
Basal insulin market penetration with Tresiba® supported by Xultophy® launches
0%
20%
40%
60%
0 10 20 30 40 50
0%
10%
20%
30%
40%
0 10 20 30 40 50
Conference call Full year 2017
Combined value market share of Tresiba® and Xultophy® in selected countries
Months from launch1
Switzerland Sweden Greece
59%
43%
24%
Tresiba® share
Tresiba® value market share of basal insulin segment in selected countries outside the US
Note: Limited IQVIA (formerly IMS) coverage in India Source: IQVIA (formerly IMS), Monthly value figures, Nov 2017
Months from launch
Mexico
Switzerland
Japan Denmark
Netherlands
Brazil
UK Greece
Italy Spain
13%
7%
32%
25%
13%
28%
42%
32%
19%
Source: IQVIA (formerly IMS), Monthly value figures, Nov 2017 1 Switzerland, Sweden and Greece: Months from Tresiba® launch. France: Months from Xultophy® launch (Tresiba® is not launched in France).
France (Xultophy® only)
14%
19%
Argentina
23%

Slide 9
5,05
4,10
3,50
4,72
11,82 11,82
glargine U100
0%
10%
20%
30%
40%
50%
60%
70%
01/01/2016
Weekly TRx volume market shares in the US
Total Novo Nordisk basal insulin volume market share has increased to 34% in the US
Tresiba® launch in the US
• The ambition to reach 10% Tresiba® TRx volume market share in 2017 achieved
• Tresiba® TRx volume market share is now 10.7%
• Tresiba® formulary access expected to remain largely unchanged at approximately 70% for commercial and Medicare Part D combined in 2018
• Opportunity for Tresiba® to grow volume market share further in early 2018 due to changes in the Part D formulary access
Basal volume TRx MS
Levemir® NN Total Basal
Tresiba® glargine U300
biosimilar glargine U100
Source: IQVIA weekly Xponent Plantrak (excludes Medicaid), 12 Jan, 2018, VANTAGE FingerTip Formulary bridge, Nov 2017
Note: The graph does not show NPH, which accounts for the residual market share Source: IQVIA weekly Xponent Plantrak (excludes Medicaid), 12 Jan 2018 TRx volume: Insulin volume in mega units (MU) associated with total number of prescriptions; MS: Market share
Jan 2018
Jan 2016
Conference call Full year 2017
45%
34%
23%
8% 6%
11%

Slide 10
5,05
4,10
3,50
4,72
11,82 11,82
GLP-1 TRx market share
GLP-1 TRx volume (000)
albiglutide
MAT GLP-1 TRx volume (million)
0%
20%
40%
60%
80%
100%
0
50
100
150
200
250
300
350
400
Conference call Full year 2017
US GLP-1 market development
Source: IQVIA NPA monthly, Nov 2017
US GLP-1 volume market share
Total TRx Growth rate MAT volume growth rate
Nov 2017
Nov 2014
0%
5%
10%
15%
20%
25%
30%
35%
0
2
4
6
8
10
Mill
ions
Nov 2014
Nov 2017
US GLP-1 market monthly TRx
Nov 2014
Nov 2017
exenatide Victoza®
dulaglutide
Victoza® continues strong growth trajectory in the US driven by GLP-1 market volume growth of 23%
albiglutide
exenatide Victoza®
dulaglutide
44%
37%
15%
4%
Slide 11
5,05
4,10
3,50
4,72
11,82 11,82
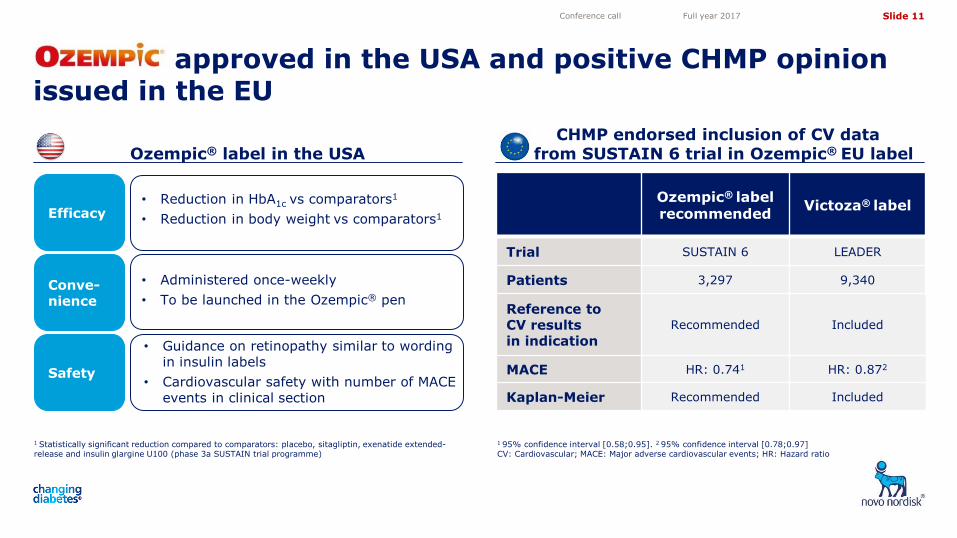
Ozempic® label in the USA CHMP endorsed inclusion of CV data
from SUSTAIN 6 trial in Ozempic® EU label
approved in the USA and positive CHMP opinion issued in the EU
1 95% confidence interval [0.58;0.95]. 2 95% confidence interval [0.78;0.97] CV: Cardiovascular; MACE: Major adverse cardiovascular events; HR: Hazard ratio
Conference call Full year 2017
Ozempic® label recommended Victoza® label
Trial SUSTAIN 6 LEADER
Patients 3,297 9,340
Reference to CV results in indication
Recommended Included
MACE HR: 0.741 HR: 0.872
Kaplan-Meier Recommended Included
Safety
Efficacy
Safety
• Guidance on retinopathy similar to wording in insulin labels
• Cardiovascular safety with number of MACE events in clinical section
Safety • Reduction in HbA1c vs comparators1
• Reduction in body weight vs comparators1
Safety Conve-nience
• Administered once-weekly
• To be launched in the Ozempic® pen
1 Statistically significant reduction compared to comparators: placebo, sitagliptin, exenatide extended-release and insulin glargine U100 (phase 3a SUSTAIN trial programme)

Slide 12
5,05
4,10
3,50
4,72
11,82 11,82
Conference call Full year 2017
1 Inclusion criteria: Type 2 diabetes, established cardiovascular disease or cardiovascular kidney disease, HbA1c 6.5%-10% sc: Subcutaneous; QW: Once-weekly
SOUL study design Study purpose and end-points
Large cardiovascular outcomes study, SOUL, to be initiated mid 2018 with
• Purpose: To confirm that treatment with Ozempic® results in decreased cardiovascular risk compared to placebo
• Study design: Randomised and double-blinded
• Primary endpoint: Cardiovascular death, non-fatal myocardial infarction or non-fatal stroke (MACE)
• Results: SOUL study results expected in 2023
Ozempic® 1.0 mg sc QW
Around 3.5-5 years
Placebo
~13,000 patients on standard of care1
MACE: Major adverse cardiovascular event

Slide 13
5,05
4,10
3,50
4,72
11,82 11,82
Phase 3a programme STEP and CV outcomes study SELECT with semaglutide 2.4 mg in obesity to be initiated
Conference call Full year 2017
1 Inclusion criteria: Male or female, age ≥18 years, BMI: ≥30 kg/m2 or ≥27 kg/m2 and ≥1 comorbidity Note: All treatment arms are adjunct to diet and exercise CV: Cardiovascular; T2D: Type 2 diabetes
Semaglutide in obesity phase 3a programme, STEP, expected to include ~4,500 patients1
Expected phase 3a programme completion: 2020
STEP 1: Weight loss 1,950 patients, 68 weeks
STEP 2: T2D non-insulin patients 1,200 patients, 68 weeks
STEP 3: Maximising weight loss 600 patients, 68 weeks
STEP 4: Maintained weight loss 900 patients, 68 weeks
2018 2019 2020
Cardiovascular outcomes study, SELECT, planned for semaglutide in obesity
1 Inclusion criteria: Male or female >45 years, BMI >27 kg/m2, myocardial infarction or stroke >60 days, HbA1c <6.5% QW: Once-weekly; sc: Subcutaneous
~17,500 people with obesity1
Semaglutide 2.4 mg sc QW
Placebo
Event-driven
Completion: Pre-defined number of events
Slide 14
5,05
4,10
3,50
4,72
11,82 11,82
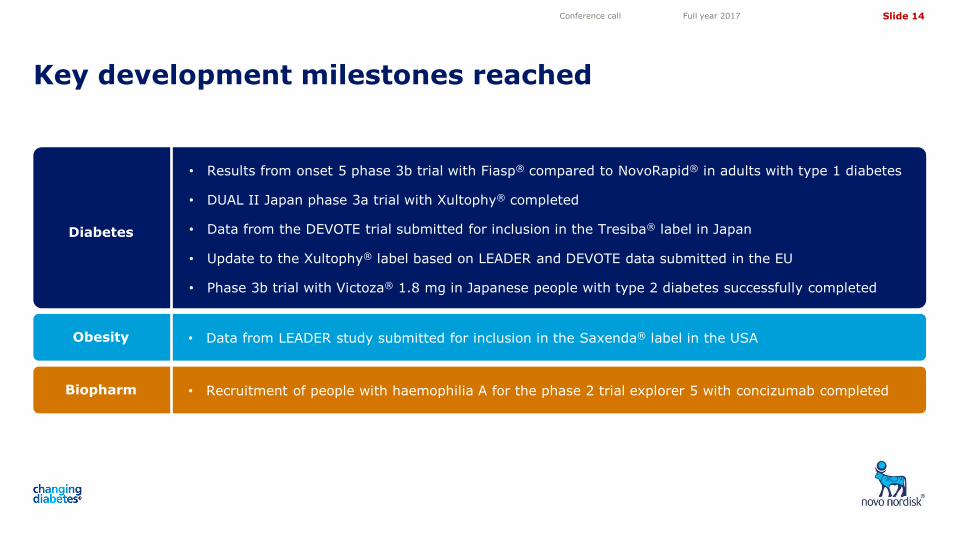
• Recruitment of people with haemophilia A for the phase 2 trial explorer 5 with concizumab completed Biopharm
Key development milestones reached
• Results from onset 5 phase 3b trial with Fiasp® compared to NovoRapid® in adults with type 1 diabetes
• DUAL II Japan phase 3a trial with Xultophy® completed
• Data from the DEVOTE trial submitted for inclusion in the Tresiba® label in Japan
• Update to the Xultophy® label based on LEADER and DEVOTE data submitted in the EU
• Phase 3b trial with Victoza® 1.8 mg in Japanese people with type 2 diabetes successfully completed
• Data from LEADER study submitted for inclusion in the Saxenda® label in the USA
Diabetes
Obesity
Conference call Full year 2017

Slide 15
5,05
4,10
3,50
4,72
11,82 11,82
R&D milestones in 2018
Project Q1 2018 Q2 2018 Q3 2018 Q4 2018
Tresiba®
Xultophy®
Ozempic®
N9-GP
somapacitan
Results available1 Regulatory milestone
REAL 3 data
√
Japan regulatory decision
DUAL I Japan Phase 3a
oral semaglutide PIONEER 1 data
LAI287 Phase 1 data
AM833 Phase 1 data
N8-GP US/EU submission
DEVOTE and SWITCH US regulatory decision
EU and Japan regulatory decision
Tresiba® vs insulin glargine U300 data
PIONEER 5 and 10 data PIONEER 2, 3, 4 and 7
data PIONEER 6, 8 and 9
data
Conference call Full year 2017
Japan submission
Japan submission
Fiasp® Japan submission
G530L Phase 1 data
concizumab explorer 5 data explorer 4 data
Diabetes Haemophilia Growth disorders Obesity
1 Expected to be published in the given quarter or in the subsequent quarterly company announcement AGHD: Adult growth hormone deficiency
REAL 1 AGHD data
DUAL II Japan Phase 3a

Slide 16
5,05
4,10
3,50
4,72
11,82 11,82
Financial results – full year 2017
Conference call Full year 2017
DKK million FY 2017 FY 2016 Change
(reported DKK) Change
(local currency)
Sales 111,696 111,780 (0%) 2%
Gross profit 94,064 94,597 (1%) 2% Gross margin 84.2% 84.6%
Sales and distribution costs 28,340 28,377 (0%) 2% Percentage of sales 25.4% 25.4%
Research and development costs 14,014 14,563 (4%) (3%) Percentage of sales 12.5% 13.0%
Administration costs 3,784 3,962 (4%) (3%) Percentage of sales 3.4% 3.5%
Other operating income, net 1,041 737 41% 45%
Operating profit 48,967 48,432 1% 5% Operating margin 43.8% 43.3%
Financial items (net) (287) (634)
Profit before income tax 48,680 47,798 2%
Income taxes 10,550 9,873 7% Effective tax rate 21.7% 20.7%
Net profit 38,130 37,925 1%
Diluted earnings per share (DKK) 15.39 14.96 3%
Slide 17
5,05
4,10
3,50
4,72
11,82 11,82
40
60
80
100
120
140
160
75
80
85
90
95
100
105
110
115
120
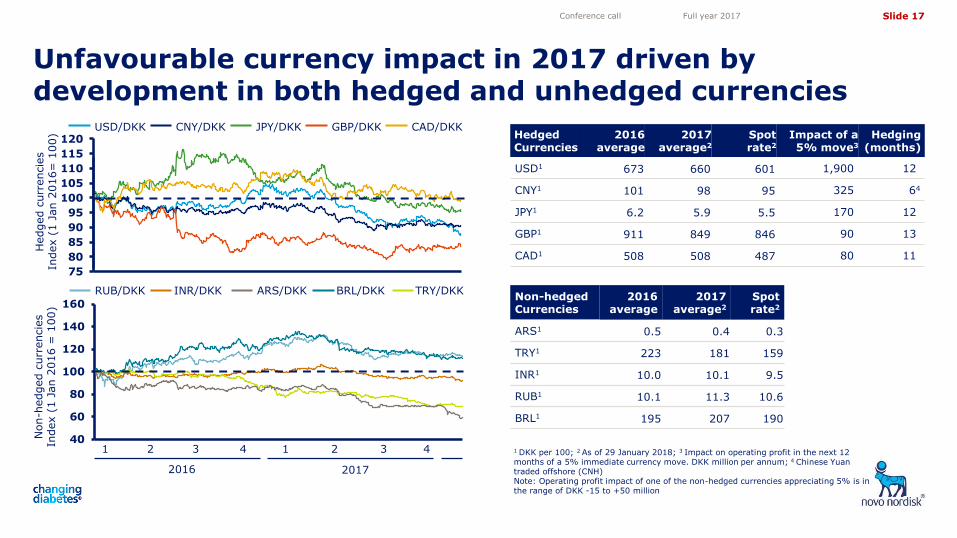
Unfavourable currency impact in 2017 driven by development in both hedged and unhedged currencies
Conference call Full year 2017
Hedged c
urr
encie
s
Index (
1 J
an 2
016=
100)
CNY/DKK JPY/DKK USD/DKK CAD/DKK GBP/DKK
3 1 2 4
2016 2017
1 2
Non-h
edged c
urr
encie
s
Index (
1 J
an 2
016 =
100)
1 DKK per 100; 2 As of 29 January 2018; 3 Impact on operating profit in the next 12 months of a 5% immediate currency move. DKK million per annum; 4 Chinese Yuan traded offshore (CNH) Note: Operating profit impact of one of the non-hedged currencies appreciating 5% is in the range of DKK -15 to +50 million
INR/DKK ARS/DKK RUB/DKK TRY/DKK BRL/DKK Non-hedged Currencies
2016 average
2017 average2
Spot rate2
ARS1 0.5 0.4 0.3
TRY1 223 181 159
INR1 10.0 10.1 9.5
RUB1 10.1 11.3 10.6
BRL1 195 207 190
Hedged Currencies
2016 average
2017 average2
Spot rate2
Impact of a 5% move3
Hedging (months)
USD1 673 660 601 1,900 12
CNY1 101 98 95 325 64
JPY1 6.2 5.9 5.5 170 12
GBP1 911 849 846 90 13
CAD1 508 508 487 80 11
3 4
Slide 18
5,05
4,10
3,50
4,72
11,82 11,82
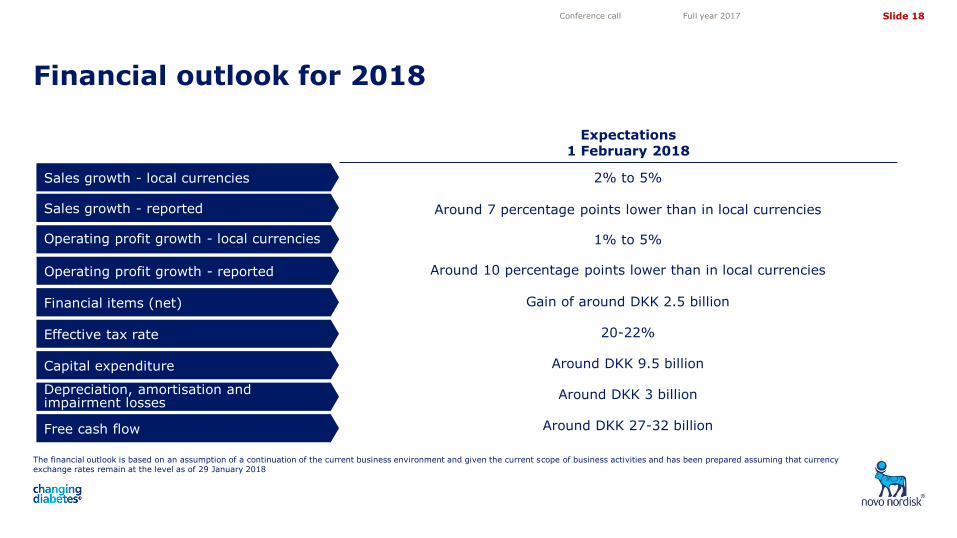
Financial outlook for 2018
The financial outlook is based on an assumption of a continuation of the current business environment and given the current scope of business activities and has been prepared assuming that currency exchange rates remain at the level as of 29 January 2018
Conference call Full year 2017
Sales growth - local currencies
Sales growth - reported
Operating profit growth - local currencies
Operating profit growth - reported
Financial items (net)
Effective tax rate
Capital expenditure
Free cash flow
Depreciation, amortisation and impairment losses
Expectations 1 February 2018
2% to 5%
1% to 5%
Gain of around DKK 2.5 billion
20-22%
Around DKK 9.5 billion
Around DKK 3 billion
Around DKK 27-32 billion
Around 7 percentage points lower than in local currencies
Around 10 percentage points lower than in local currencies
Slide 19
5,05
4,10
3,50
4,72
11,82 11,82
12 13 16
11 12
7.6
7.4 15
17
15
17 14
0
5
10
15
20
25
30
35
40
45
2014 2015 2016 2017 2018E*
Cash return priorities
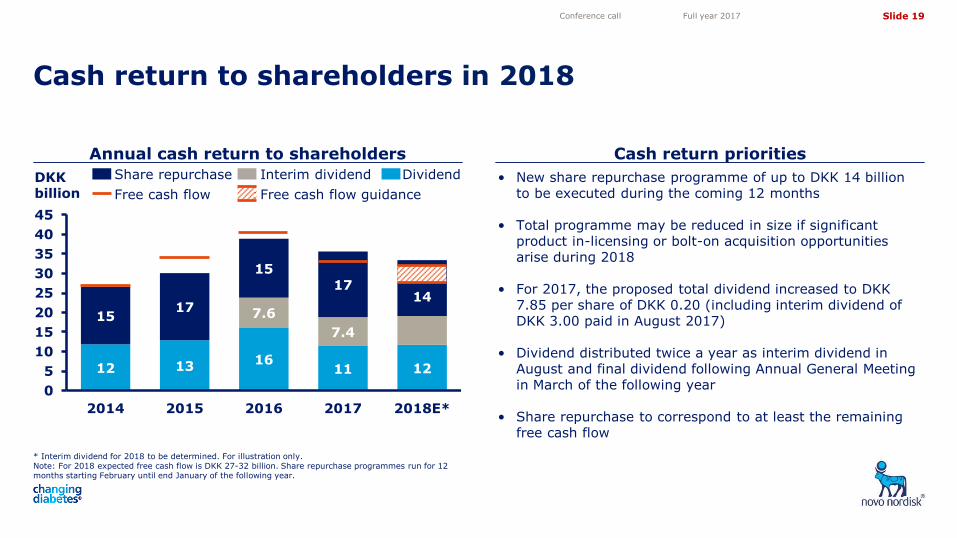
Cash return to shareholders in 2018
Conference call Full year 2017
• New share repurchase programme of up to DKK 14 billion to be executed during the coming 12 months
• Total programme may be reduced in size if significant product in-licensing or bolt-on acquisition opportunities arise during 2018
• For 2017, the proposed total dividend increased to DKK 7.85 per share of DKK 0.20 (including interim dividend of DKK 3.00 paid in August 2017)
• Dividend distributed twice a year as interim dividend in August and final dividend following Annual General Meeting in March of the following year
• Share repurchase to correspond to at least the remaining free cash flow
Annual cash return to shareholders
* Interim dividend for 2018 to be determined. For illustration only. Note: For 2018 expected free cash flow is DKK 27-32 billion. Share repurchase programmes run for 12 months starting February until end January of the following year.
DKK billion
Share repurchase Dividend
Free cash flow
Interim dividend
Free cash flow guidance
Slide 20
5,05
4,10
3,50
4,72
11,82 11,82
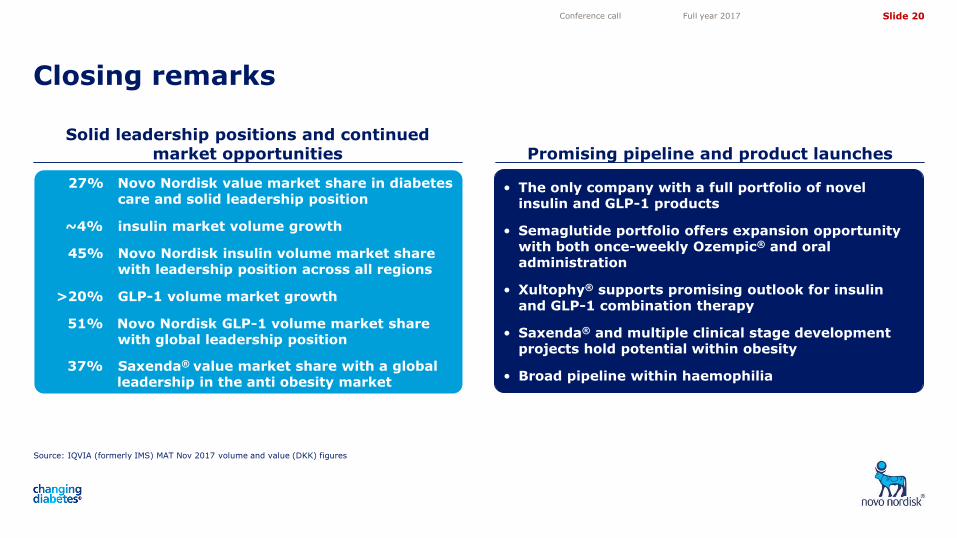
Source: IQVIA (formerly IMS) MAT Nov 2017 volume and value (DKK) figures
Solid leadership positions and continued market opportunities Promising pipeline and product launches
Closing remarks
Conference call Full year 2017
> > • The only company with a full portfolio of novel insulin and GLP-1 products
• Semaglutide portfolio offers expansion opportunity with both once-weekly Ozempic® and oral administration
• Xultophy® supports promising outlook for insulin and GLP-1 combination therapy
• Saxenda® and multiple clinical stage development projects hold potential within obesity
• Broad pipeline within haemophilia
27% Novo Nordisk value market share in diabetes care and solid leadership position
~4% insulin market volume growth
45% Novo Nordisk insulin volume market share with leadership position across all regions
>20% GLP-1 volume market growth
51% Novo Nordisk GLP-1 volume market share with global leadership position
37% Saxenda® value market share with a global leadership in the anti obesity market
Slide 21
5,05
4,10
3,50
4,72
11,82 11,82
Share information Investor Relations contacts
Investor contact information
Conference call Full year 2017
Novo Nordisk’s B shares are listed on the stock exchange in Copenhagen under the symbol ‘NOVO B’. Its ADRs are listed on the New York Stock Exchange under the symbol ‘NVO’. For further company information, visit Novo Nordisk on the internet at: novonordisk.com
Peter Hugreffe Ankersen +45 3075 9085 [email protected]
Hanna Ögren +45 3079 8519 [email protected]
Anders Mikkelsen +45 3079 4461 [email protected]
Christina Kjær
+45 3079 3009
In North America:
Kasper Veje +1 609 235 8567 [email protected]
Novo Nordisk A/S Investor Relations Novo Allé, DK-2880 Bagsværd
Upcoming events
22 Mar 2018 Annual General Meeting 2018
02 May 2018 Financial statement for the first three months of 2018
08 Aug 2018 Financial statement for the first six months of 2018
01 Nov 2018 Financial statement for the first nine months of 2018
01 Feb 2019 Financial statement for 2018