full year 2016 results february 2 , 2017 - ferrari...
TRANSCRIPT
Full Year 2016 Results – February 2nd, 2017
2 Full Year 2016 Results February 2nd, 2017
SAFE HARBOUR STATEMENT
This document, and in particular the section entitled “2017 Outlook”, contains forward-looking statements. These statements may include terms
such as “may”, “will”, “expect”, “could”, “should”, “intend”, “estimate”, “anticipate”, “believe”, “remain”, “on track”, “successful”, “grow”, “design”,
“target”, “objective”, “goal”, “forecast”, “projection”, “outlook”, “prospects”, “plan”, or similar terms. Forward-looking statements are not guarantees
of future performance. Rather, they are based on the Group’s current expectations and projections about future events and, by their nature, are
subject to inherent risks and uncertainties. They relate to events and depend on circumstances that may or may not occur or exist in the future and,
as such, undue reliance should not be placed on them.
Actual results may differ materially from those expressed in such statements as a result of a variety of factors, including: the Group’s ability to
preserve and enhance the value of the Ferrari brand; the success of Ferrari’s Formula 1 racing team and the expenses the Group incurs for Formula
1 activities; the Group’s ability to keep up with advances in high performance car technology and to make appealing designs for its new models; the
Group’s low volume strategy; the ability of Maserati, the Group’s engine customer, to sell its planned volume of cars; changes in client preferences
and automotive trends; changes in the general economic environment and changes in demand for luxury goods, including high performance luxury
cars, which is highly volatile; the impact of increasingly stringent fuel economy, emission and safety standards; the Group’s ability to successfully
carry out its growth strategy and, particularly, the Group’s ability to grow its presence in emerging market countries; competition in the luxury
performance automobile industry; reliance upon a number of key members of executive management and employees; the performance of the
Group’s dealer network on which the Group depend for sales and services; increases in costs, disruptions of supply or shortages of components and
raw materials; disruptions at the Group’s manufacturing facilities in Maranello and Modena; the Group’s ability to provide or arrange for adequate
access to financing for its dealers and clients; the performance of the Group’s licensees for Ferrari-branded products; the Group’s ability to protect
its intellectual property rights and to avoid infringing on the intellectual property rights of others; product recalls, liability claims and product
warranties; exchange rate fluctuations, interest rate changes, credit risk and other market risks; potential conflicts of interest due to director and
officer overlaps with the Group’s largest shareholders and other factors discussed elsewhere in this document.
Any forward-looking statements contained in this document speak only as of the date of this document and the Company does not undertake any
obligation to update or revise publicly forward-looking statements. Further information concerning the Group and its businesses, including factors
that could materially affect the Company’s financial results, is included in the Company’s reports and filings with the U.S. Securities and Exchange
Commission, the AFM and CONSOB.
2
3 Full Year 2016 Results February 2nd, 2017
Note: (1) Reconciliations to non-gaap financial measures are provided in the appendix (2) Margins without FX hedges have been calculated excluding FX hedges impact from net revenues, adjusted EBIT and adjusted EBITDA
(3) Subject to approval by the Board of Directors and to the adoption of the Company’s 2016 Annual Accounts by the Shareholders’ Annual General Meeting (4) Assuming FX consistent with current market conditions (5) Including a cash distribution to the holders of common shares and excluding potential share repurchases
…ON THE WAY TO ITS 70TH ANNIVERSARY IN 2017
2016: A YEAR OF RECORDS…
Shipments reached 8,014 units, up by 350
units vs. previous year (+5%) – Solid performance supported by both V8 and V12
– Strong performance of the 488 GTB, the 488 Spider and
the F12tdf; the newly launched GTC4Lusso and LaFerrari
Aperta ramping up
– LaFerrari finished its limited series run
Financial results – Net revenues grew 9% to €3,105 million
– Adjusted EBITDA(1) of €880 million, margin at 28.3% (30%
without FX hedges(2))
– Adjusted EBIT(1) of €632 million, 380 bps margin increase
to 20.4% (22.2% without FX hedges(2))
– Adjusted net profit up 37% to €425 million
– Net industrial debt(1) reduced to €653 million
– Cash distribution proposal of €120 million or 0.635 per
common share(3)
2016, a year full of events – Spin-off from FCA
– Listing on the Milan Stock Exchange
– Bond issuance
– Deconsolidation of the European Financial Services
business
2017 Outlook(4) – Shipments: ~ 8,400 including supercars
– Net revenues: > €3.3 billion
– Adjusted EBITDA: > €950 million
– Net industrial debt(5): ~ €500 million
4 Full Year 2016 Results February 2nd, 2017
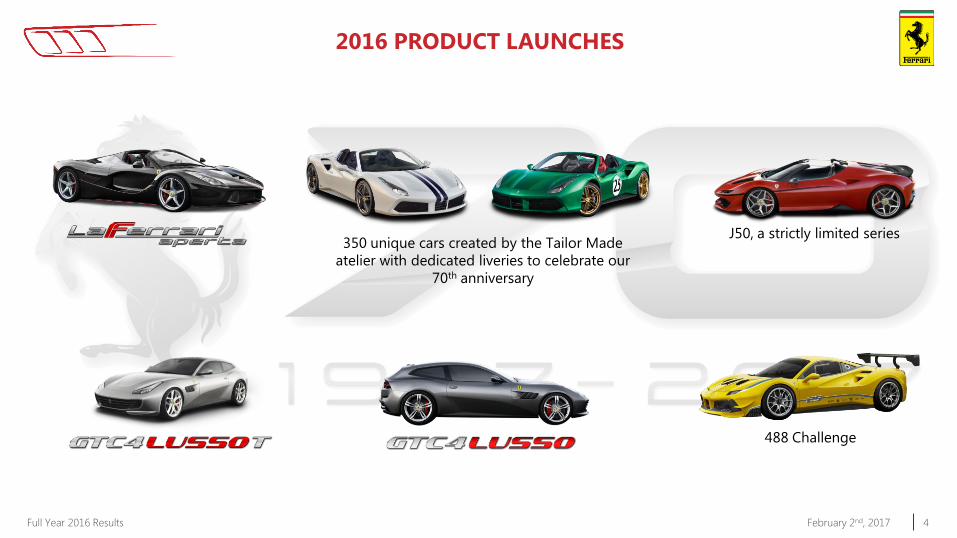
2016 PRODUCT LAUNCHES
350 unique cars created by the Tailor Made
atelier with dedicated liveries to celebrate our
70th anniversary
J50, a strictly limited series
488 Challenge
5 Full Year 2016 Results February 2nd, 2017
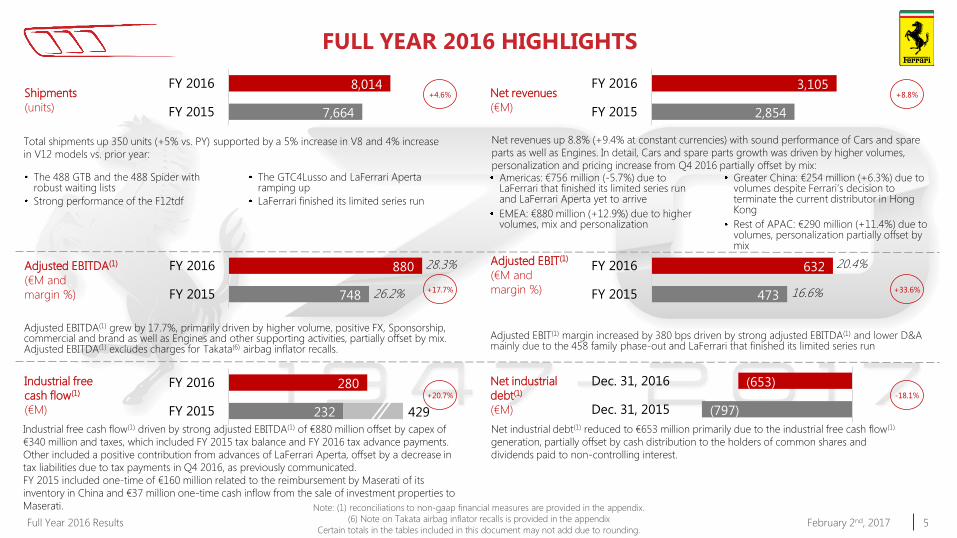
Adjusted EBITDA(1) grew by 17.7%, primarily driven by higher volume, positive FX, Sponsorship, commercial and brand as well as Engines and other supporting activities, partially offset by mix. Adjusted EBITDA(1) excludes charges for Takata(6) airbag inflator recalls.
Adjusted EBIT(1) margin increased by 380 bps driven by strong adjusted EBITDA(1) and lower D&A mainly due to the 458 family phase-out and LaFerrari that finished its limited series run
FULL YEAR 2016 HIGHLIGHTS
(797)
(653)
Dec. 31, 2015
Dec. 31, 2016
Shipments
(units)
Total shipments up 350 units (+5% vs. PY) supported by a 5% increase in V8 and 4% increase
in V12 models vs. prior year:
2,854
3,105
FY 2015
FY 2016
748
880
FY 2015
FY 2016
Net revenues up 8.8% (+9.4% at constant currencies) with sound performance of Cars and spare
parts as well as Engines. In detail, Cars and spare parts growth was driven by higher volumes,
personalization and pricing increase from Q4 2016 partially offset by mix:
7,664
8,014
FY 2015
FY 2016
Industrial free
cash flow(1)
(€M)
Net revenues
(€M)
Adjusted EBITDA(1)
(€M and
margin %)
Net industrial
debt(1)
(€M)
Industrial free cash flow(1) driven by strong adjusted EBITDA(1) of €880 million offset by capex of
€340 million and taxes, which included FY 2015 tax balance and FY 2016 tax advance payments.
Other included a positive contribution from advances of LaFerrari Aperta, offset by a decrease in
tax liabilities due to tax payments in Q4 2016, as previously communicated.
FY 2015 included one-time of €160 million related to the reimbursement by Maserati of its
inventory in China and €37 million one-time cash inflow from the sale of investment properties to
Maserati.
Net industrial debt(1) reduced to €653 million primarily due to the industrial free cash flow(1)
generation, partially offset by cash distribution to the holders of common shares and
dividends paid to non-controlling interest.
Americas: €756 million (-5.7%) due to LaFerrari that finished its limited series run and LaFerrari Aperta yet to arrive
EMEA: €880 million (+12.9%) due to higher volumes, mix and personalization
Greater China: €254 million (+6.3%) due to volumes despite Ferrari’s decision to terminate the current distributor in Hong Kong
Rest of APAC: €290 million (+11.4%) due to volumes, personalization partially offset by mix
20.4%
16.6%
Adjusted EBIT(1)
(€M and
margin %) 473
632
FY 2015
FY 201628.3%
26.2%
The 488 GTB and the 488 Spider with robust waiting lists
Strong performance of the F12tdf
The GTC4Lusso and LaFerrari Aperta ramping up
LaFerrari finished its limited series run
Note: (1) reconciliations to non-gaap financial measures are provided in the appendix.
(6) Note on Takata airbag inflator recalls is provided in the appendix
Certain totals in the tables included in this document may not add due to rounding.
232
280
429 FY 2015
FY 2016
+4.6% +8.8%
+17.7% +33.6%
+20.7% -18.1%
6 Full Year 2016 Results February 2nd, 2017
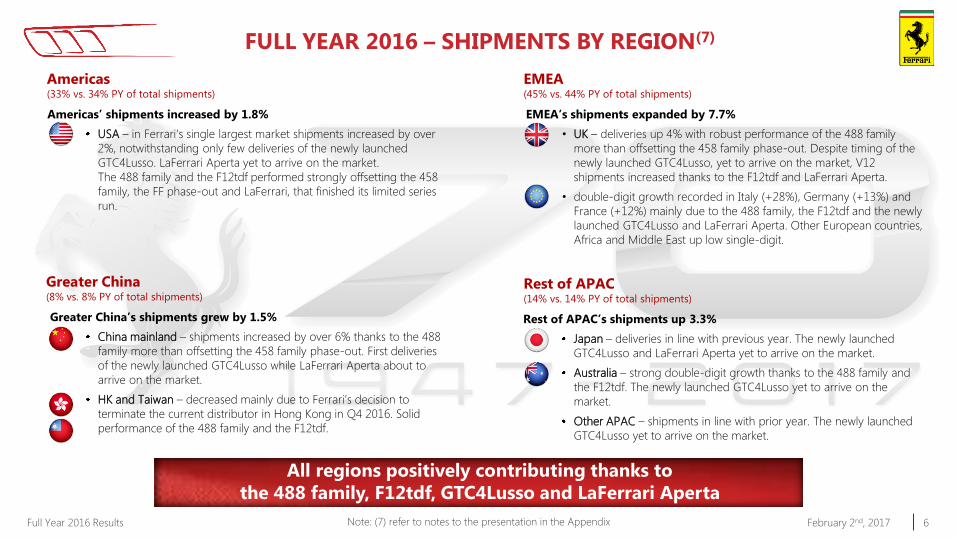
FULL YEAR 2016 – SHIPMENTS BY REGION(7)
Americas (33% vs. 34% PY of total shipments)
Americas’ shipments increased by 1.8%
USA – in Ferrari’s single largest market shipments increased by over
2%, notwithstanding only few deliveries of the newly launched
GTC4Lusso. LaFerrari Aperta yet to arrive on the market.
The 488 family and the F12tdf performed strongly offsetting the 458
family, the FF phase-out and LaFerrari, that finished its limited series
run.
Greater China (8% vs. 8% PY of total shipments)
Greater China’s shipments grew by 1.5%
China mainland – shipments increased by over 6% thanks to the 488
family more than offsetting the 458 family phase-out. First deliveries
of the newly launched GTC4Lusso while LaFerrari Aperta about to
arrive on the market.
HK and Taiwan – decreased mainly due to Ferrari’s decision to
terminate the current distributor in Hong Kong in Q4 2016. Solid
performance of the 488 family and the F12tdf.
Rest of APAC (14% vs. 14% PY of total shipments)
Rest of APAC’s shipments up 3.3%
Japan – deliveries in line with previous year. The newly launched
GTC4Lusso and LaFerrari Aperta yet to arrive on the market.
Australia – strong double-digit growth thanks to the 488 family and
the F12tdf. The newly launched GTC4Lusso yet to arrive on the
market.
Other APAC – shipments in line with prior year. The newly launched
GTC4Lusso yet to arrive on the market.
EMEA (45% vs. 44% PY of total shipments)
EMEA’s shipments expanded by 7.7%
• UK – deliveries up 4% with robust performance of the 488 family
more than offsetting the 458 family phase-out. Despite timing of the
newly launched GTC4Lusso, yet to arrive on the market, V12
shipments increased thanks to the F12tdf and LaFerrari Aperta.
• double-digit growth recorded in Italy (+28%), Germany (+13%) and
France (+12%) mainly due to the 488 family, the F12tdf and the newly
launched GTC4Lusso and LaFerrari Aperta. Other European countries,
Africa and Middle East up low single-digit.
All regions positively contributing thanks to
the 488 family, F12tdf, GTC4Lusso and LaFerrari Aperta
Note: (7) refer to notes to the presentation in the Appendix
7 Full Year 2016 Results February 2nd, 2017
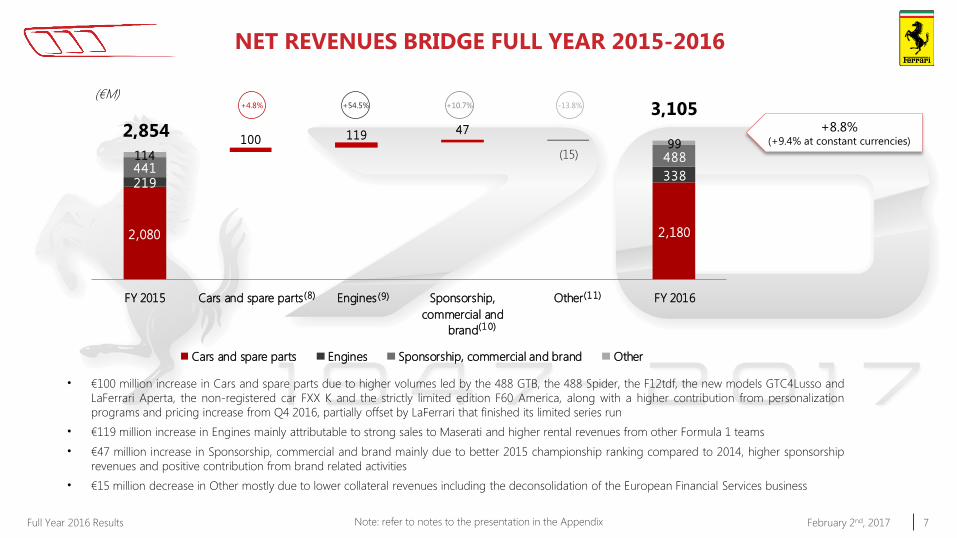
2,080 2,180
219338
44148811499
(15)
100 119 47
FY 2015 Cars and spare parts Engines Sponsorship,
commercial and
brand
Other FY 2016
Cars and spare parts Engines Sponsorship, commercial and brand Other
2,854
3,105(€M)
(8) (9)
(10)
(11)
NET REVENUES BRIDGE FULL YEAR 2015-2016
+8.8% (+9.4% at constant currencies)
Note: refer to notes to the presentation in the Appendix
• €100 million increase in Cars and spare parts due to higher volumes led by the 488 GTB, the 488 Spider, the F12tdf, the new models GTC4Lusso and
LaFerrari Aperta, the non-registered car FXX K and the strictly limited edition F60 America, along with a higher contribution from personalization
programs and pricing increase from Q4 2016, partially offset by LaFerrari that finished its limited series run
• €119 million increase in Engines mainly attributable to strong sales to Maserati and higher rental revenues from other Formula 1 teams
• €47 million increase in Sponsorship, commercial and brand mainly due to better 2015 championship ranking compared to 2014, higher sponsorship
revenues and positive contribution from brand related activities
• €15 million decrease in Other mostly due to lower collateral revenues including the deconsolidation of the European Financial Services business
+4.8% +54.5% +10.7% -13.8%
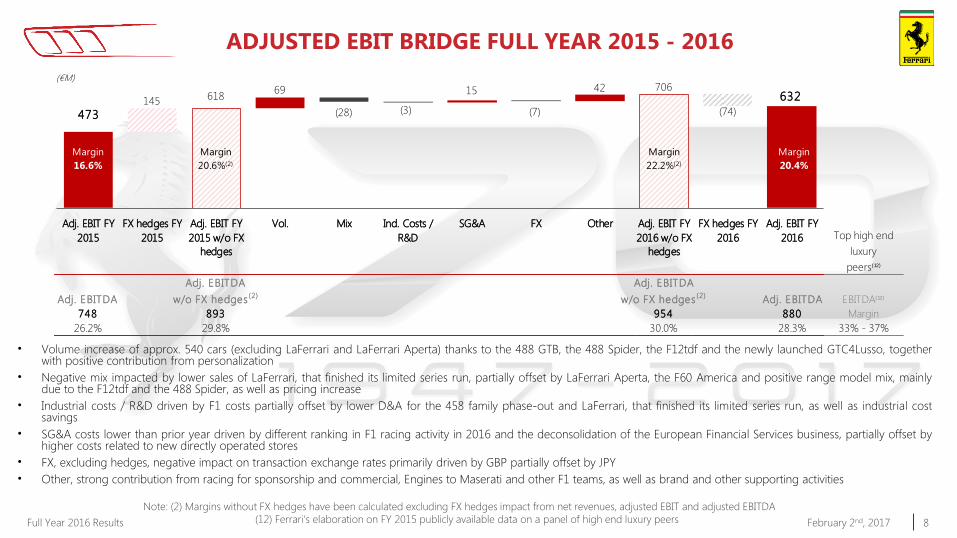
8 Full Year 2016 Results February 2nd, 2017
(€M)
Top high end
luxury
peers(12)
Adj. EBITDA Adj. EBITDA
Adj. EBITDA w/o FX hedges (2) w/o FX hedges (2) Adj. EBITDA EBITDA(12)
748 893 954 880 Margin
26.2% 29.8% 30.0% 28.3% 33% - 37%
618 706
(28) (3) (7) (74)473 145
69 15 42 632
Adj. EBIT FY
2015
FX hedges FY
2015
Adj. EBIT FY
2015 w/o FX
hedges
Vol. Mix Ind. Costs /
R&D
SG&A FX Other Adj. EBIT FY
2016 w/o FX
hedges
FX hedges FY
2016
Adj. EBIT FY
2016
Margin
16.6%
Margin
20.4%
Margin
22.2%(2)
Margin
20.6%(2)
ADJUSTED EBIT BRIDGE FULL YEAR 2015 - 2016
• Volume increase of approx. 540 cars (excluding LaFerrari and LaFerrari Aperta) thanks to the 488 GTB, the 488 Spider, the F12tdf and the newly launched GTC4Lusso, together with positive contribution from personalization
• Negative mix impacted by lower sales of LaFerrari, that finished its limited series run, partially offset by LaFerrari Aperta, the F60 America and positive range model mix, mainly due to the F12tdf and the 488 Spider, as well as pricing increase
• Industrial costs / R&D driven by F1 costs partially offset by lower D&A for the 458 family phase-out and LaFerrari, that finished its limited series run, as well as industrial cost savings
• SG&A costs lower than prior year driven by different ranking in F1 racing activity in 2016 and the deconsolidation of the European Financial Services business, partially offset by higher costs related to new directly operated stores
• FX, excluding hedges, negative impact on transaction exchange rates primarily driven by GBP partially offset by JPY
• Other, strong contribution from racing for sponsorship and commercial, Engines to Maserati and other F1 teams, as well as brand and other supporting activities
Note: (2) Margins without FX hedges have been calculated excluding FX hedges impact from net revenues, adjusted EBIT and adjusted EBITDA
(12) Ferrari’s elaboration on FY 2015 publicly available data on a panel of high end luxury peers
9 Full Year 2016 Results February 2nd, 2017
(€M)
(797)
(653)
December 31,
2015
Net Industrial
Debt
Adj. EBITDA Net ∆ working
capital
Tax paid Capex Other Cash distribution
and dividends
paid
FX and other December 31,
2016
Net Industrial
Debt
Industrial FCF €280m
880
(16)
(340)
8
(104)
(32)
(252)
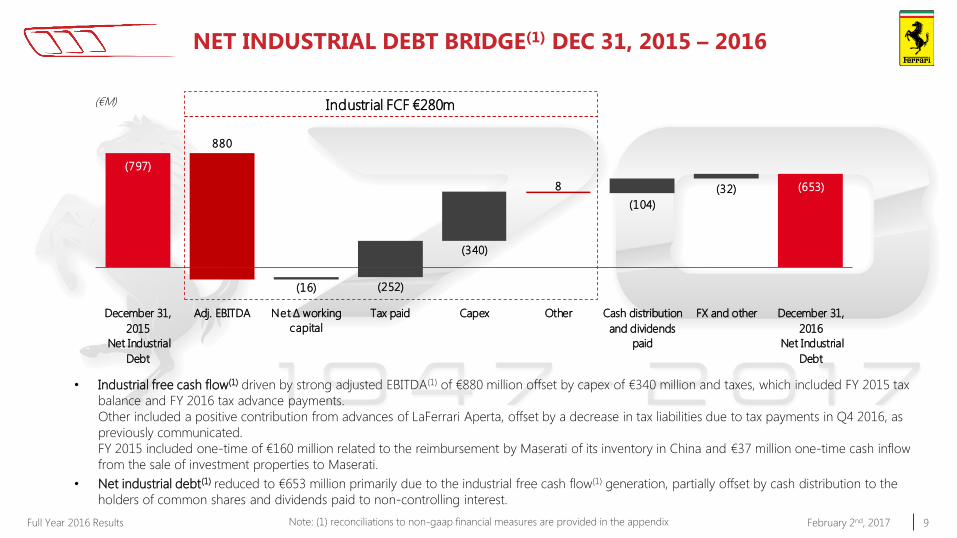
NET INDUSTRIAL DEBT BRIDGE(1) DEC 31, 2015 – 2016
Note: (1) reconciliations to non-gaap financial measures are provided in the appendix
• Industrial free cash flow(1) driven by strong adjusted EBITDA(1) of €880 million offset by capex of €340 million and taxes, which included FY 2015 tax
balance and FY 2016 tax advance payments.
Other included a positive contribution from advances of LaFerrari Aperta, offset by a decrease in tax liabilities due to tax payments in Q4 2016, as
previously communicated.
FY 2015 included one-time of €160 million related to the reimbursement by Maserati of its inventory in China and €37 million one-time cash inflow
from the sale of investment properties to Maserati.
• Net industrial debt(1) reduced to €653 million primarily due to the industrial free cash flow(1) generation, partially offset by cash distribution to the
holders of common shares and dividends paid to non-controlling interest.
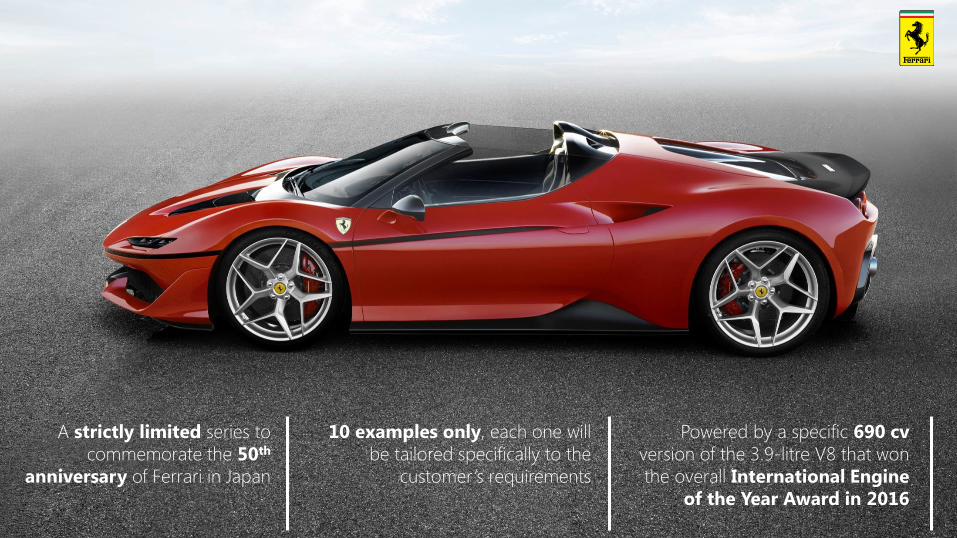
A strictly limited series to
commemorate the 50th
anniversary of Ferrari in Japan
10 examples only, each one will
be tailored specifically to the
customer’s requirements
Powered by a specific 690 cv
version of the 3.9-litre V8 that won
the overall International Engine
of the Year Award in 2016
11 Full Year 2016 Results February 2nd, 2017
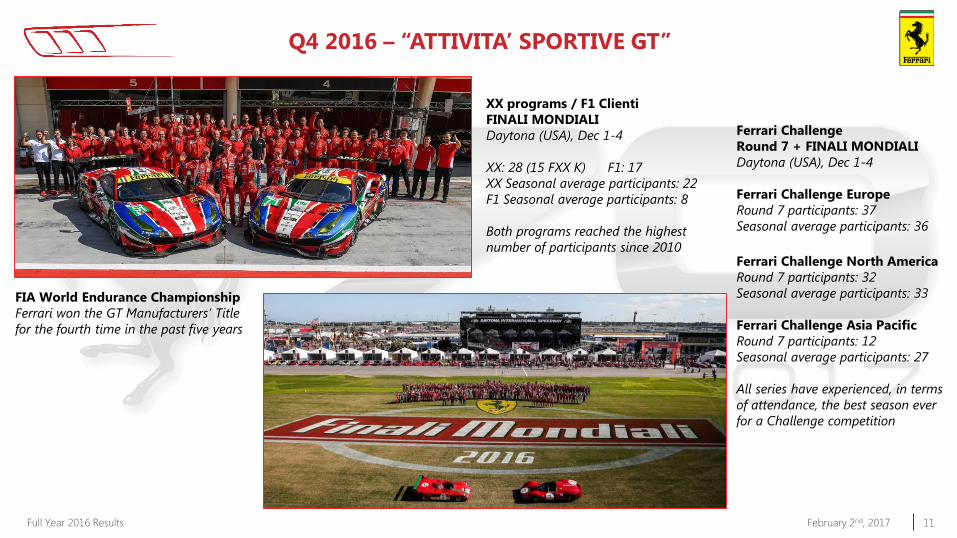
Q4 2016 – “ATTIVITA’ SPORTIVE GT”
XX programs / F1 Clienti
FINALI MONDIALI
Daytona (USA), Dec 1-4
XX: 28 (15 FXX K) F1: 17
XX Seasonal average participants: 22
F1 Seasonal average participants: 8
Both programs reached the highest
number of participants since 2010
Ferrari Challenge
Round 7 + FINALI MONDIALI
Daytona (USA), Dec 1-4
Ferrari Challenge Europe
Round 7 participants: 37
Seasonal average participants: 36
Ferrari Challenge North America
Round 7 participants: 32
Seasonal average participants: 33
Ferrari Challenge Asia Pacific
Round 7 participants: 12
Seasonal average participants: 27
All series have experienced, in terms
of attendance, the best season ever
for a Challenge competition
FIA World Endurance Championship
Ferrari won the GT Manufacturers’ Title
for the fourth time in the past five years
12 Full Year 2016 Results February 2nd, 2017
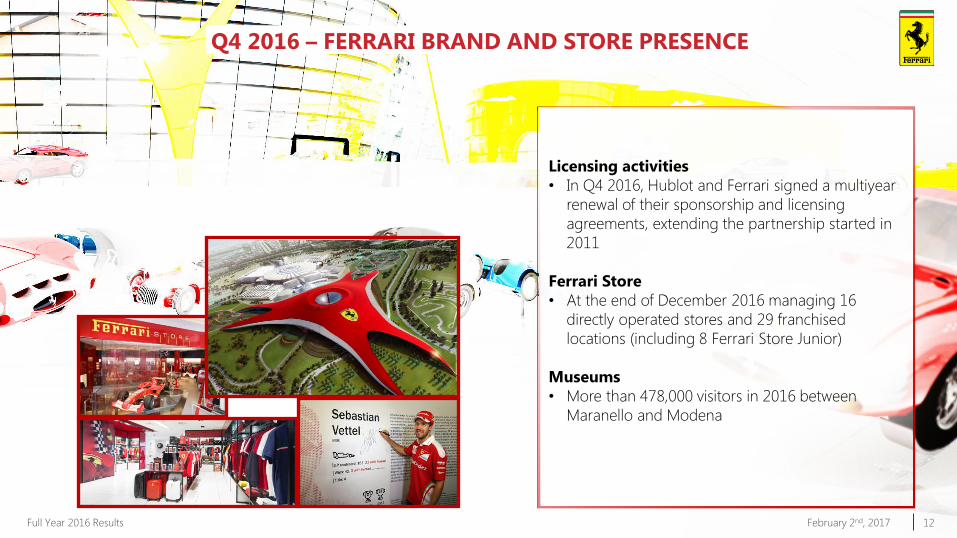
Licensing activities
• In Q4 2016, Hublot and Ferrari signed a multiyear
renewal of their sponsorship and licensing
agreements, extending the partnership started in
2011
Ferrari Store
• At the end of December 2016 managing 16
directly operated stores and 29 franchised
locations (including 8 Ferrari Store Junior)
Museums
• More than 478,000 visitors in 2016 between
Maranello and Modena
Q4 2016 – FERRARI BRAND AND STORE PRESENCE
13 Full Year 2016 Results February 2nd, 2017
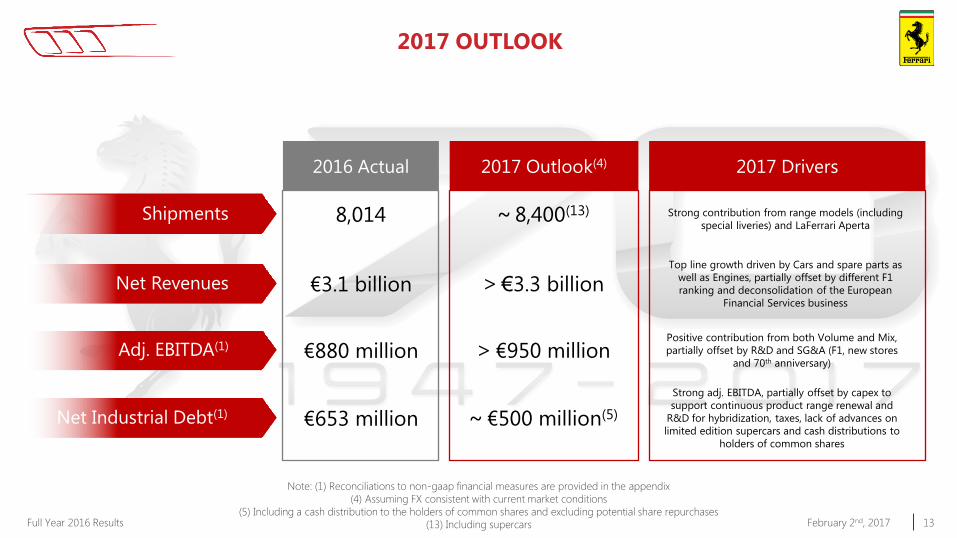
2017 OUTLOOK
Note: (1) Reconciliations to non-gaap financial measures are provided in the appendix
(4) Assuming FX consistent with current market conditions
(5) Including a cash distribution to the holders of common shares and excluding potential share repurchases
(13) Including supercars
Shipments
Net Revenues
Adj. EBITDA(1)
Net Industrial Debt(1)
2017 Outlook(4) 2016 Actual
~ 8,400(13)
> €3.3 billion
> €950 million
~ €500 million(5)
8,014
€3.1 billion
€880 million
€653 million
2017 Drivers
Top line growth driven by Cars and spare parts as
well as Engines, partially offset by different F1
ranking and deconsolidation of the European
Financial Services business
Positive contribution from both Volume and Mix,
partially offset by R&D and SG&A (F1, new stores
and 70th anniversary)
Strong adj. EBITDA, partially offset by capex to
support continuous product range renewal and
R&D for hybridization, taxes, lack of advances on
limited edition supercars and cash distributions to
holders of common shares
Strong contribution from range models (including
special liveries) and LaFerrari Aperta
Q&A
Appendix
16 Full Year 2016 Results February 2nd, 2017
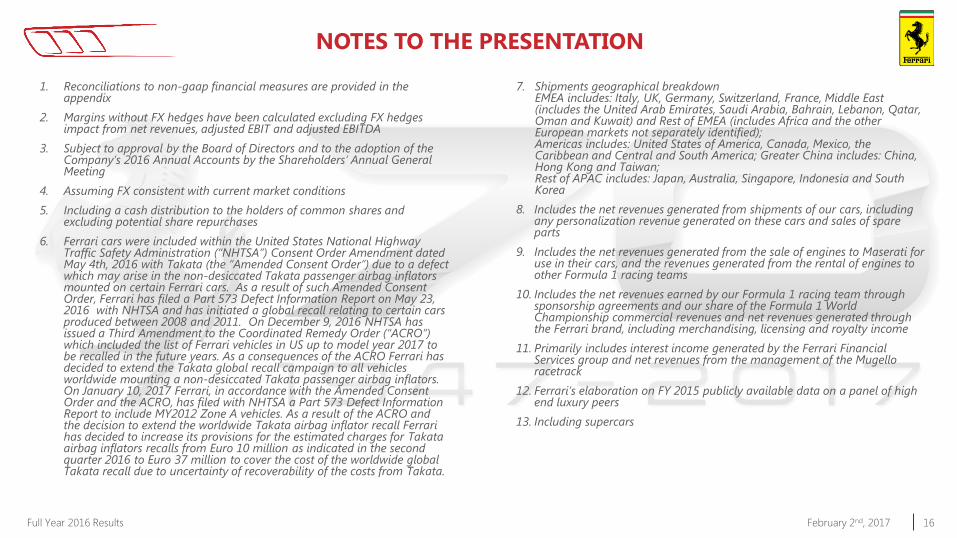
NOTES TO THE PRESENTATION
1. Reconciliations to non-gaap financial measures are provided in the appendix
2. Margins without FX hedges have been calculated excluding FX hedges impact from net revenues, adjusted EBIT and adjusted EBITDA
3. Subject to approval by the Board of Directors and to the adoption of the Company’s 2016 Annual Accounts by the Shareholders’ Annual General Meeting
4. Assuming FX consistent with current market conditions
5. Including a cash distribution to the holders of common shares and excluding potential share repurchases
6. Ferrari cars were included within the United States National Highway Traffic Safety Administration (“NHTSA”) Consent Order Amendment dated May 4th, 2016 with Takata (the “Amended Consent Order”) due to a defect which may arise in the non-desiccated Takata passenger airbag inflators mounted on certain Ferrari cars. As a result of such Amended Consent Order, Ferrari has filed a Part 573 Defect Information Report on May 23, 2016 with NHTSA and has initiated a global recall relating to certain cars produced between 2008 and 2011. On December 9, 2016 NHTSA has issued a Third Amendment to the Coordinated Remedy Order (“ACRO”) which included the list of Ferrari vehicles in US up to model year 2017 to be recalled in the future years. As a consequences of the ACRO Ferrari has decided to extend the Takata global recall campaign to all vehicles worldwide mounting a non-desiccated Takata passenger airbag inflators. On January 10, 2017 Ferrari, in accordance with the Amended Consent Order and the ACRO, has filed with NHTSA a Part 573 Defect Information Report to include MY2012 Zone A vehicles. As a result of the ACRO and the decision to extend the worldwide Takata airbag inflator recall Ferrari has decided to increase its provisions for the estimated charges for Takata airbag inflators recalls from Euro 10 million as indicated in the second quarter 2016 to Euro 37 million to cover the cost of the worldwide global Takata recall due to uncertainty of recoverability of the costs from Takata.
7. Shipments geographical breakdown EMEA includes: Italy, UK, Germany, Switzerland, France, Middle East (includes the United Arab Emirates, Saudi Arabia, Bahrain, Lebanon, Qatar, Oman and Kuwait) and Rest of EMEA (includes Africa and the other European markets not separately identified); Americas includes: United States of America, Canada, Mexico, the Caribbean and Central and South America; Greater China includes: China, Hong Kong and Taiwan; Rest of APAC includes: Japan, Australia, Singapore, Indonesia and South Korea
8. Includes the net revenues generated from shipments of our cars, including any personalization revenue generated on these cars and sales of spare parts
9. Includes the net revenues generated from the sale of engines to Maserati for use in their cars, and the revenues generated from the rental of engines to other Formula 1 racing teams
10. Includes the net revenues earned by our Formula 1 racing team through sponsorship agreements and our share of the Formula 1 World Championship commercial revenues and net revenues generated through the Ferrari brand, including merchandising, licensing and royalty income
11. Primarily includes interest income generated by the Ferrari Financial Services group and net revenues from the management of the Mugello racetrack
12. Ferrari’s elaboration on FY 2015 publicly available data on a panel of high end luxury peers
13. Including supercars
17 Full Year 2016 Results February 2nd, 2017
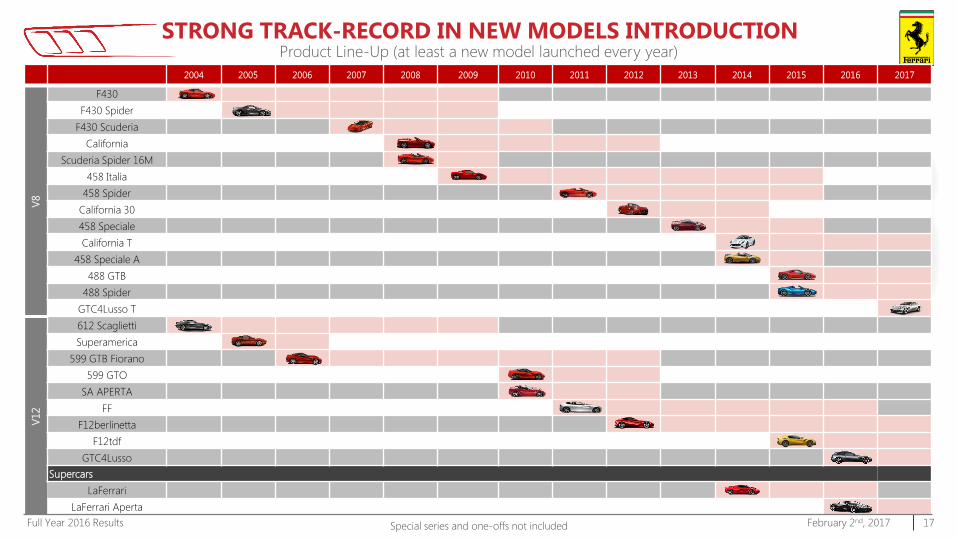
2004 2005 2006 2007 2008 2009 2010 2011 2012 2013 2014 2015 2016 2017
V8
F430
F430 Spider
F430 Scuderia
California
Scuderia Spider 16M
458 Italia
458 Spider
California 30
458 Speciale
California T
458 Speciale A
488 GTB
488 Spider
GTC4Lusso T
V12
612 Scaglietti
Superamerica
599 GTB Fiorano
599 GTO
SA APERTA
FF
F12berlinetta
F12tdf
GTC4Lusso
Supercars
LaFerrari
LaFerrari Aperta
Special series and one-offs not included
STRONG TRACK-RECORD IN NEW MODELS INTRODUCTION Product Line-Up (at least a new model launched every year)
18 Full Year 2016 Results February 2nd, 2017
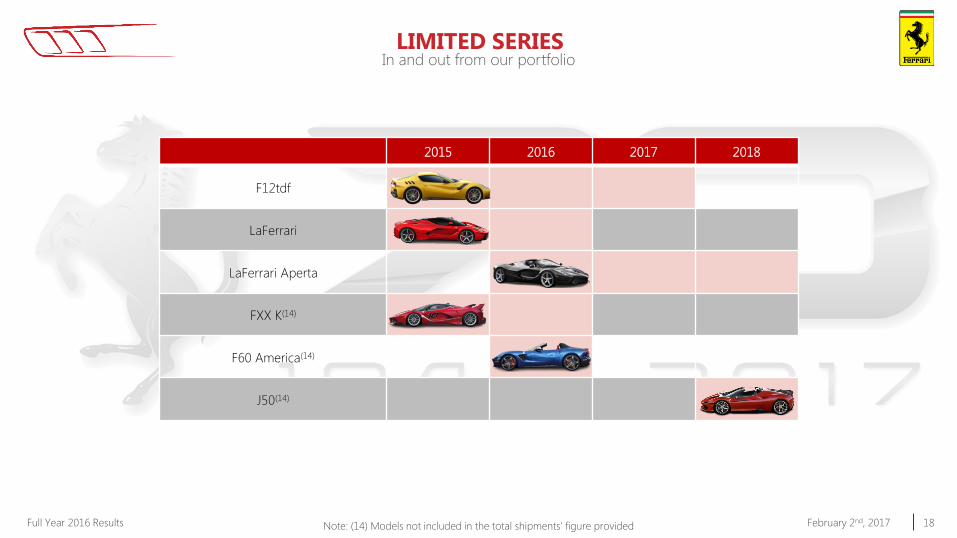
2015 2016 2017 2018
F12tdf
LaFerrari
LaFerrari Aperta
FXX K(14)
F60 America(14)
J50(14)
Note: (14) Models not included in the total shipments’ figure provided
LIMITED SERIES In and out from our portfolio
19 Full Year 2016 Results February 2nd, 2017
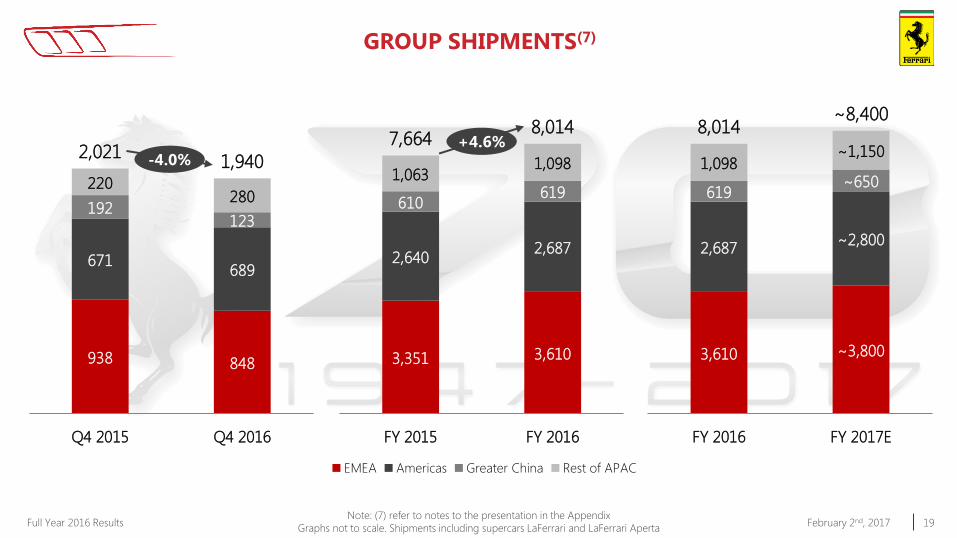
GROUP SHIPMENTS(7)
938 848
671 689
192 123
220 280
2,021 1,940
Q4 2015 Q4 2016
3,351 3,610
2,640 2,687
610 619
1,063 1,098
7,664 8,014
FY 2015 FY 2016
EMEA Americas Greater China Rest of APAC
3,610 ~3,800
2,687 ~2,800
619 ~650
1,098 ~1,150
8,014 ~8,400
FY 2016 FY 2017E
Note: (7) refer to notes to the presentation in the Appendix
Graphs not to scale. Shipments including supercars LaFerrari and LaFerrari Aperta
-4.0% +4.6%
20 Full Year 2016 Results February 2nd, 2017
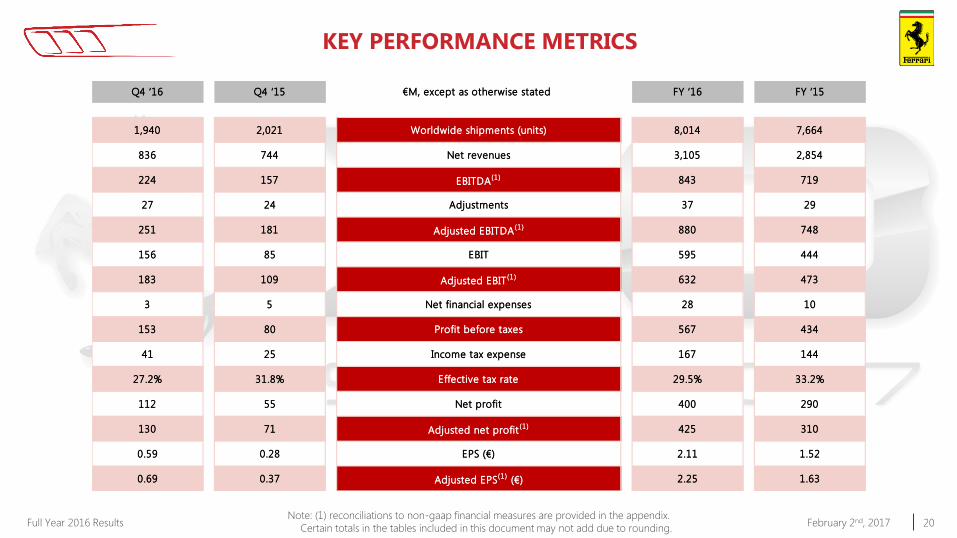
Q4 ‘16 Q4 ‘15 €M, except as otherwise stated FY ‘16 FY ‘15
1,940 2,021 Worldwide shipments (units) 8,014 7,664
836 744 Net revenues 3,105 2,854
224 157 EBITDA(1) 843 719
27 24 Adjustments 37 29
251 181 Adjusted EBITDA(1) 880 748
156 85 EBIT 595 444
183 109 Adjusted EBIT(1) 632 473
3 5 Net financial expenses 28 10
153 80 Profit before taxes 567 434
41 25 Income tax expense 167 144
27.2% 31.8% Effective tax rate 29.5% 33.2%
112 55 Net profit 400 290
130 71 Adjusted net profit(1) 425 310
0.59 0.28 EPS (€) 2.11 1.52
0.69 0.37 Adjusted EPS(1)
(€) 2.25 1.63
KEY PERFORMANCE METRICS
Note: (1) reconciliations to non-gaap financial measures are provided in the appendix.
Certain totals in the tables included in this document may not add due to rounding.
21 Full Year 2016 Results February 2nd, 2017
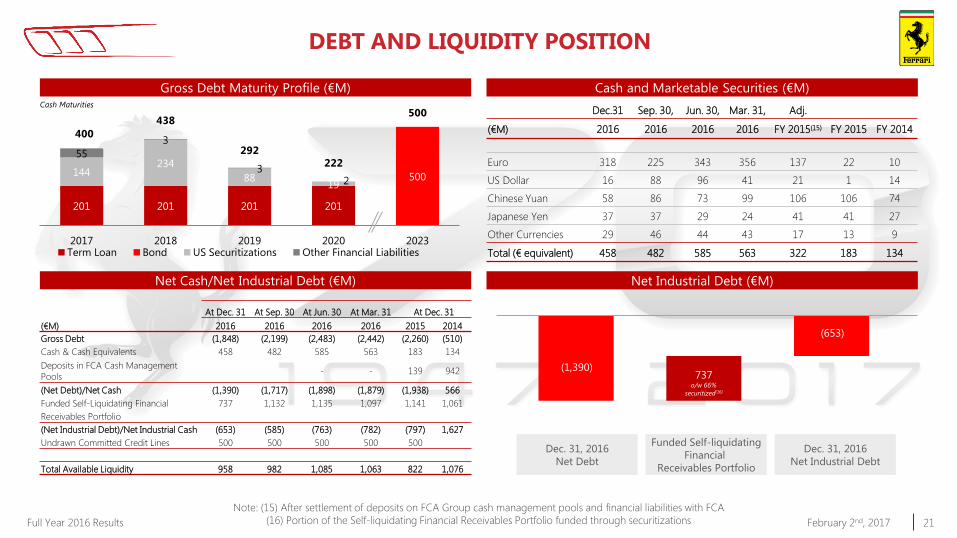
201 201 201 201
500 144 234
88 19
55
3
3 2
400
438
292
222
500
2017 2018 2019 2020 2023Term Loan Bond US Securitizations Other Financial Liabilities
DEBT AND LIQUIDITY POSITION
Gross Debt Maturity Profile (€M) Cash and Marketable Securities (€M)
Net Cash/Net Industrial Debt (€M) Net Industrial Debt (€M)
Note: (15) After settlement of deposits on FCA Group cash management pools and financial liabilities with FCA
(16) Portion of the Self-liquidating Financial Receivables Portfolio funded through securitizations
Cash Maturities
(1,390) 737
o/w 66%
securitized(16)
Dec. 31, 2016
Net Industrial Debt
Funded Self-liquidating
Financial
Receivables Portfolio
Dec. 31, 2016
Net Debt
(653)
At Dec. 31 At Sep. 30 At Jun. 30 At Mar. 31 At Dec. 31
(€M) 2016 2016 2016 2016 2015 2014
Gross Debt (1,848) (2,199) (2,483) (2,442) (2,260) (510)
Cash & Cash Equivalents 458 482 585 563 183 134
Deposits in FCA Cash Management
Pools - - 139 942
(Net Debt)/Net Cash (1,390) (1,717) (1,898) (1,879) (1,938) 566
Funded Self-Liquidating Financial 737 1,132 1,135 1,097 1,141 1,061
Receivables Portfolio
(Net Industrial Debt)/Net Industrial Cash (653) (585) (763) (782) (797) 1,627
Undrawn Committed Credit Lines 500 500 500 500 500
Total Available Liquidity 958 982 1,085 1,063 822 1,076
Dec.31 Sep. 30, Jun. 30, Mar. 31, Adj.
(€M) 2016 2016 2016 2016 FY 2015(15) FY 2015 FY 2014
Euro 318 225 343 356 137 22 10
US Dollar 16 88 96 41 21 1 14
Chinese Yuan 58 86 73 99 106 106 74
Japanese Yen 37 37 29 24 41 41 27
Other Currencies 29 46 44 43 17 13 9
Total (€ equivalent) 458 482 585 563 322 183 134
22 Full Year 2016 Results February 2nd, 2017
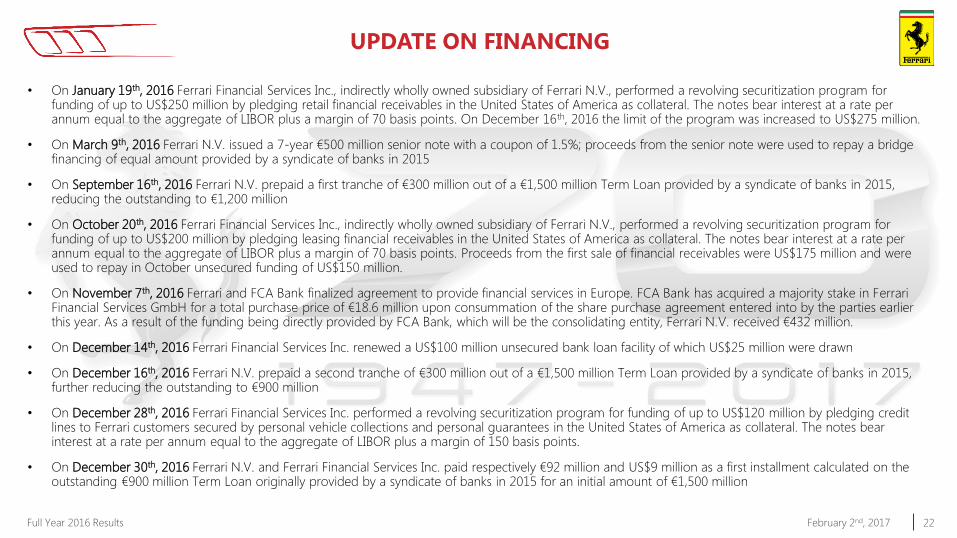
UPDATE ON FINANCING
• On January 19th, 2016 Ferrari Financial Services Inc., indirectly wholly owned subsidiary of Ferrari N.V., performed a revolving securitization program for funding of up to US$250 million by pledging retail financial receivables in the United States of America as collateral. The notes bear interest at a rate per annum equal to the aggregate of LIBOR plus a margin of 70 basis points. On December 16th, 2016 the limit of the program was increased to US$275 million.
• On March 9th, 2016 Ferrari N.V. issued a 7-year €500 million senior note with a coupon of 1.5%; proceeds from the senior note were used to repay a bridge financing of equal amount provided by a syndicate of banks in 2015
• On September 16th, 2016 Ferrari N.V. prepaid a first tranche of €300 million out of a €1,500 million Term Loan provided by a syndicate of banks in 2015, reducing the outstanding to €1,200 million
• On October 20th, 2016 Ferrari Financial Services Inc., indirectly wholly owned subsidiary of Ferrari N.V., performed a revolving securitization program for funding of up to US$200 million by pledging leasing financial receivables in the United States of America as collateral. The notes bear interest at a rate per annum equal to the aggregate of LIBOR plus a margin of 70 basis points. Proceeds from the first sale of financial receivables were US$175 million and were used to repay in October unsecured funding of US$150 million.
• On November 7th, 2016 Ferrari and FCA Bank finalized agreement to provide financial services in Europe. FCA Bank has acquired a majority stake in Ferrari Financial Services GmbH for a total purchase price of €18.6 million upon consummation of the share purchase agreement entered into by the parties earlier this year. As a result of the funding being directly provided by FCA Bank, which will be the consolidating entity, Ferrari N.V. received €432 million.
• On December 14th, 2016 Ferrari Financial Services Inc. renewed a US$100 million unsecured bank loan facility of which US$25 million were drawn
• On December 16th, 2016 Ferrari N.V. prepaid a second tranche of €300 million out of a €1,500 million Term Loan provided by a syndicate of banks in 2015, further reducing the outstanding to €900 million
• On December 28th, 2016 Ferrari Financial Services Inc. performed a revolving securitization program for funding of up to US$120 million by pledging credit lines to Ferrari customers secured by personal vehicle collections and personal guarantees in the United States of America as collateral. The notes bear interest at a rate per annum equal to the aggregate of LIBOR plus a margin of 150 basis points.
• On December 30th, 2016 Ferrari N.V. and Ferrari Financial Services Inc. paid respectively €92 million and US$9 million as a first installment calculated on the outstanding €900 million Term Loan originally provided by a syndicate of banks in 2015 for an initial amount of €1,500 million
23 Full Year 2016 Results February 2nd, 2017
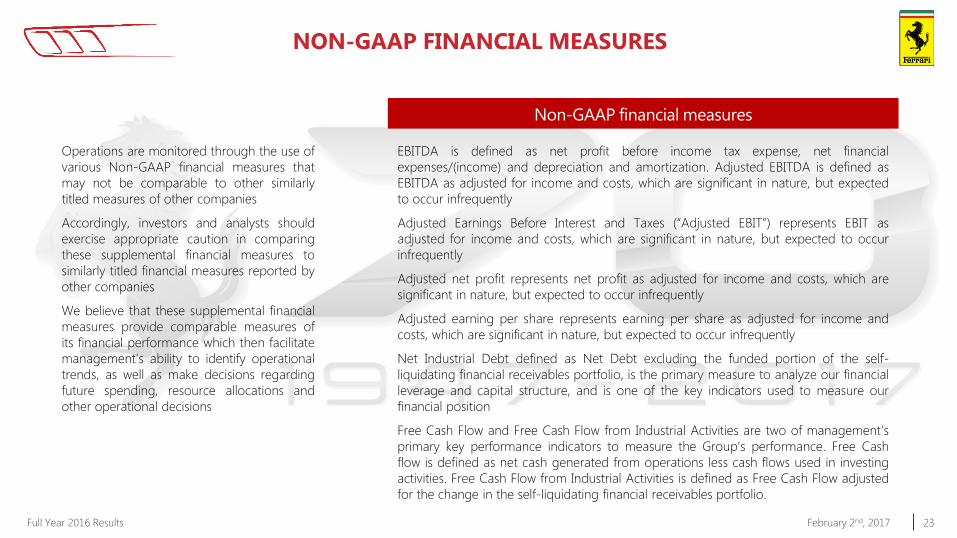
NON-GAAP FINANCIAL MEASURES
Operations are monitored through the use of
various Non-GAAP financial measures that
may not be comparable to other similarly
titled measures of other companies
Accordingly, investors and analysts should
exercise appropriate caution in comparing
these supplemental financial measures to
similarly titled financial measures reported by
other companies
We believe that these supplemental financial
measures provide comparable measures of
its financial performance which then facilitate
management’s ability to identify operational
trends, as well as make decisions regarding
future spending, resource allocations and
other operational decisions
Non-GAAP financial measures
EBITDA is defined as net profit before income tax expense, net financial
expenses/(income) and depreciation and amortization. Adjusted EBITDA is defined as
EBITDA as adjusted for income and costs, which are significant in nature, but expected
to occur infrequently
Adjusted Earnings Before Interest and Taxes (“Adjusted EBIT”) represents EBIT as
adjusted for income and costs, which are significant in nature, but expected to occur
infrequently
Adjusted net profit represents net profit as adjusted for income and costs, which are
significant in nature, but expected to occur infrequently
Adjusted earning per share represents earning per share as adjusted for income and
costs, which are significant in nature, but expected to occur infrequently
Net Industrial Debt defined as Net Debt excluding the funded portion of the self-
liquidating financial receivables portfolio, is the primary measure to analyze our financial
leverage and capital structure, and is one of the key indicators used to measure our
financial position
Free Cash Flow and Free Cash Flow from Industrial Activities are two of management’s
primary key performance indicators to measure the Group’s performance. Free Cash
flow is defined as net cash generated from operations less cash flows used in investing
activities. Free Cash Flow from Industrial Activities is defined as Free Cash Flow adjusted
for the change in the self-liquidating financial receivables portfolio.
24 Full Year 2016 Results February 2nd, 2017
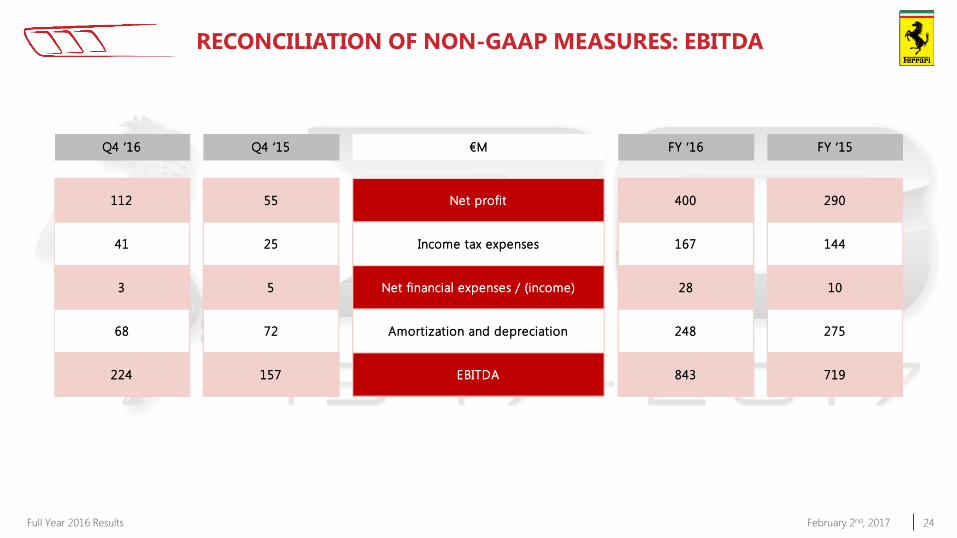
Q4 ‘16 Q4 ‘15 €M FY ‘16 FY ‘15
112 55 Net profit 400 290
41 25 Income tax expenses 167 144
3 5 Net financial expenses / (income) 28 10
68 72 Amortization and depreciation 248 275
224 157 EBITDA 843 719
RECONCILIATION OF NON-GAAP MEASURES: EBITDA
25 Full Year 2016 Results February 2nd, 2017
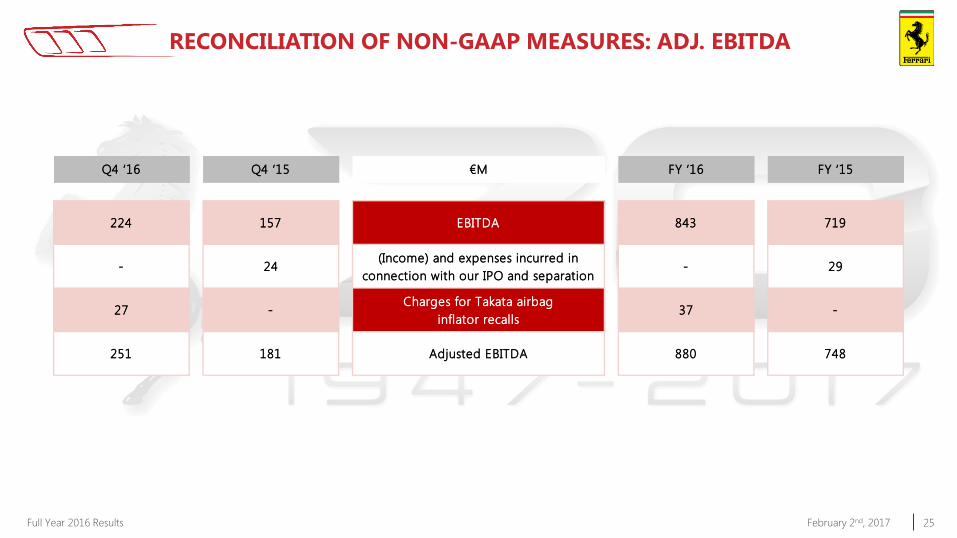
Q4 ‘16 Q4 ‘15 €M FY ‘16 FY ‘15
224 157 EBITDA 843 719
- 24 (Income) and expenses incurred in
connection with our IPO and separation- 29
27 -Charges for Takata airbag
inflator recalls37 -
251 181 Adjusted EBITDA 880 748
RECONCILIATION OF NON-GAAP MEASURES: ADJ. EBITDA
26 Full Year 2016 Results February 2nd, 2017
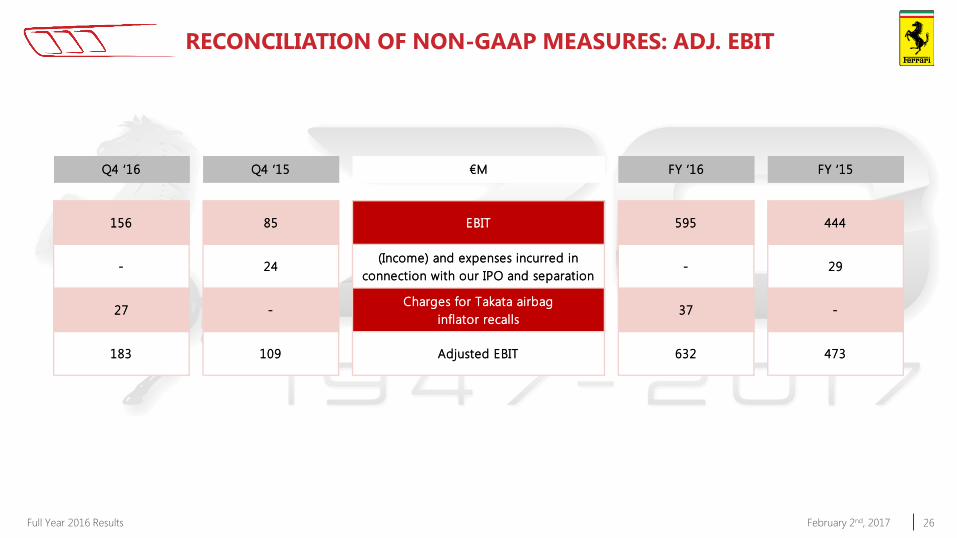
Q4 ‘16 Q4 ‘15 €M FY ‘16 FY ‘15
156 85 EBIT 595 444
- 24 (Income) and expenses incurred in
connection with our IPO and separation- 29
27 -Charges for Takata airbag
inflator recalls37 -
183 109 Adjusted EBIT 632 473
RECONCILIATION OF NON-GAAP MEASURES: ADJ. EBIT
27 Full Year 2016 Results February 2nd, 2017
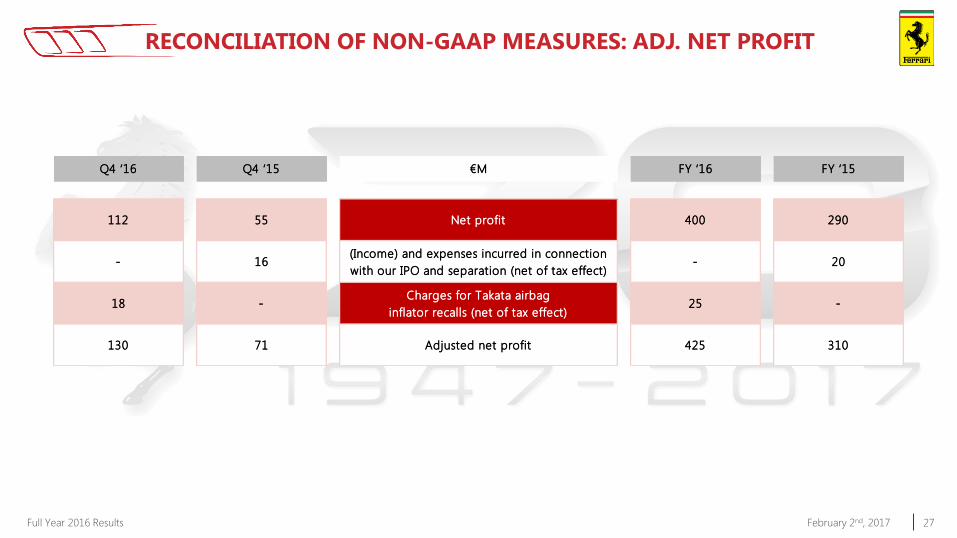
Q4 ‘16 Q4 ‘15 €M FY ‘16 FY ‘15
112 55 Net profit 400 290
- 16 (Income) and expenses incurred in connection
with our IPO and separation (net of tax effect)- 20
18 -Charges for Takata airbag
inflator recalls (net of tax effect)25 -
130 71 Adjusted net profit 425 310
RECONCILIATION OF NON-GAAP MEASURES: ADJ. NET PROFIT
28 Full Year 2016 Results February 2nd, 2017
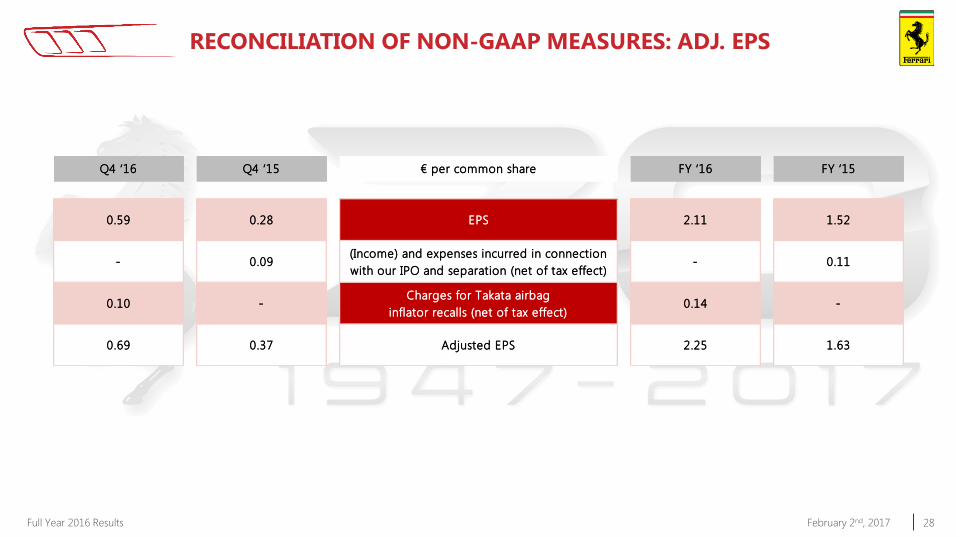
Q4 ‘16 Q4 ‘15 € per common share FY ‘16 FY ‘15
0.59 0.28 EPS 2.11 1.52
- 0.09 (Income) and expenses incurred in connection
with our IPO and separation (net of tax effect)- 0.11
0.10 -Charges for Takata airbag
inflator recalls (net of tax effect)0.14 -
0.69 0.37 Adjusted EPS 2.25 1.63
RECONCILIATION OF NON-GAAP MEASURES: ADJ. EPS
29 Full Year 2016 Results February 2nd, 2017
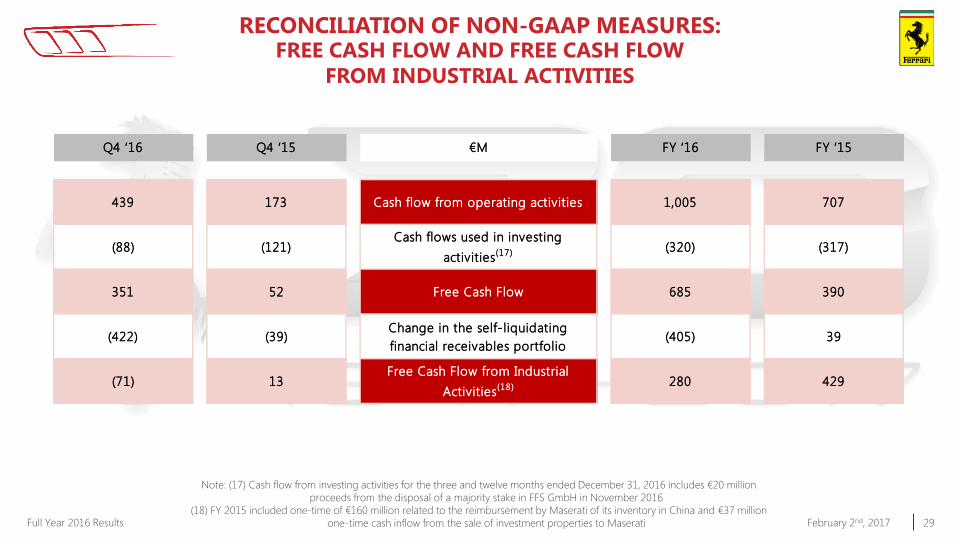
Q4 ‘16 Q4 ‘15 €M FY ‘16 FY ‘15
439 173 Cash flow from operating activities 1,005 707
(88) (121)Cash flows used in investing
activities(17) (320) (317)
351 52 Free Cash Flow 685 390
(422) (39)Change in the self-liquidating
financial receivables portfolio(405) 39
(71) 13 Free Cash Flow from Industrial
Activities(18) 280 429
Note: (17) Cash flow from investing activities for the three and twelve months ended December 31, 2016 includes €20 million
proceeds from the disposal of a majority stake in FFS GmbH in November 2016
(18) FY 2015 included one-time of €160 million related to the reimbursement by Maserati of its inventory in China and €37 million
one-time cash inflow from the sale of investment properties to Maserati
RECONCILIATION OF NON-GAAP MEASURES: FREE CASH FLOW AND FREE CASH FLOW
FROM INDUSTRIAL ACTIVITIES
30 Full Year 2016 Results February 2nd, 2017
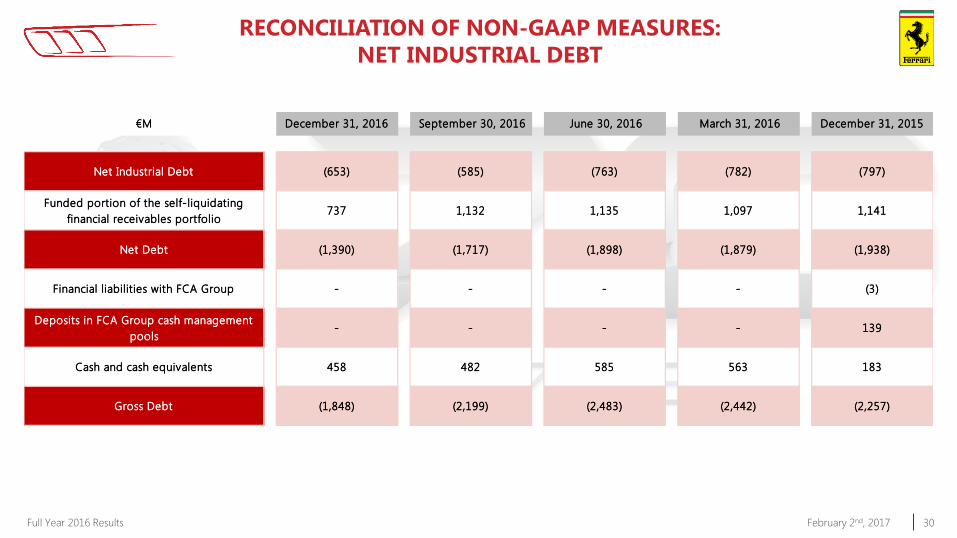
RECONCILIATION OF NON-GAAP MEASURES:
NET INDUSTRIAL DEBT
€M December 31, 2016 September 30, 2016 June 30, 2016 March 31, 2016 December 31, 2015
Net Industrial Debt (653) (585) (763) (782) (797)
Funded portion of the self-liquidating
financial receivables portfolio737 1,132 1,135 1,097 1,141
Net Debt (1,390) (1,717) (1,898) (1,879) (1,938)
Financial liabilities with FCA Group - - - - (3)
Deposits in FCA Group cash management
pools- - - - 139
Cash and cash equivalents 458 482 585 563 183
Gross Debt (1,848) (2,199) (2,483) (2,442) (2,257)