full year 2015 investor presentation - s3.amazonaws.com€¦why titan? 2015 objectives 12 “one...
TRANSCRIPT

Full Year 2015
Investor presentation
MARCH 2016

Titan International Overview
Titan International, Inc.
2
Titan International Inc. (TWI) is a publicly traded company on the New York Stock
Exchange. Headquartered in the heartland of the U.S. in Quincy, Illinois, Titan has
grown to become a top global manufacturer of specialty tires, wheels and tracks.
Titan has a heritage of over 100 years in the off-highway wheel manufacturing business
and is the world’s largest manufacturer of off-highway wheels. Titan has complete
research and development test facilities to validate wheel and rim designs.
Since Titan's entrance into the tire market in 1993, we have evolved into a leading
global supplier of complete wheel and tire assemblies for off-highway vehicles. Titan
manufactures two distinct tire brands: Titan Tire and Goodyear Farm Tires.
Titan International Overview
Corporate Strategy
3
To become the worldwide leader in manufacturing and distribution of wheels, tires,
assemblies and undercarriage products and to serve our customers’ needs through
product innovation and quality service in our key markets:
Agriculture
Earthmoving/Construction
Consumer

Titan International Overview
Products
4
Wheels Tires and Assemblies Undercarriage Components (ITM)
85%
15%
OEM Aftermarket
60%
40%
OEM Aftermarket
75%
25%
OEM Aftermarket
Titan International Overview
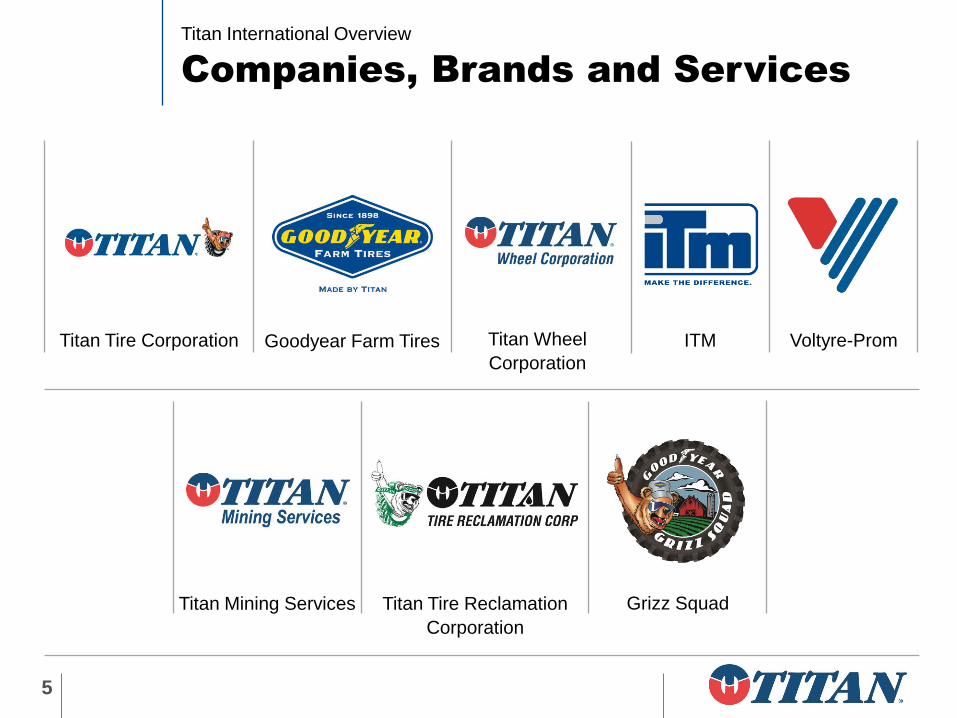
Companies, Brands and Services
5
Titan Wheel
Corporation
Titan Tire Corporation ITM Voltyre-Prom
Titan Mining Services
Goodyear Farm Tires
Titan Tire Reclamation
Corporation
Grizz Squad

Titan International Overview
Customers
6

Titan International Overview
Market Leader – North American Ag
7
Wheels TIRES:
OEM 48%; REPLACEMENT 29%
WHEELS:
OEM & REPLACEMENT > 75%
Why Titan?

Titan International Headquarters Quincy, Illinois, USA Titan Wheel Corporation Quincy, Illinois, USA Saltville, Virginia, USA Titan Tire Corporation Des Moines, Iowa, USA Freeport, Illinois, USA Bryan, Ohio, USA Union City, Tennessee, USA São Paulo, Brazil Voltyre-Prom Volgograd, Russia (Majority Share)
Titan Mining Services (TMS) SWT Saskatchewan, Canada Titan Mining Services (TMS) Titan Australia Pty Ltd Emerald , QLD, Australia Kalgoorlie, WA, Australia Karratha, WA, Australia Muswellbrook, NSW, Australia Perth, WA, Australia Port Hedland, WA, Australia Sydney, NSW, Australia Yatala, QLD, Australia
Titan Mining Services (TMS) Titan Wheels South Africa (Pty) Ltd Nuffield, Springs, SA Titan Mining Services (TMS) PT Titan Wheels Indonesia Jakarta, Indonesia
Titan Mining Services (TMS) Aros del Pacifico S.A.C. Lima, Peru
Titan Mining Services (TMS) Aros del Pacifico S.A. Santiago, Chile
Titan Steel Wheels Ltd Kidderminster, UK Titan Distribution (UK) Ltd St. Helens, UK Titan Italia SpA Crespellano (BO), Italy Finale Emilia (MO), Italy Jesi (AN), Italy
Titan France SAS Flers, France
Titan Asia A.S. Aydin, Turkey
Wheels India Ltd Tamilnadu, India (Minority Share) Italtractor ITM SpA Fanano (MO), Italy Ceprano (FR), Italy Potenza, Italy Titan Intertractor GmbH Gevelsberg, Germany Pyrsa Piezas y Rodajes S.A. Monreal del Campo (Teruel), Spain
Intertractor America Corp. Elkhorn, WI, USA Winston-Salem, NC, USA ITM Latin America Ltda Atibaia, São Paulo, Brazil ITM Track (Tianjin) Ltd Tianjin, P.R. of China Titan ITM (Tianjin) Co. Ltd WDA Tianjin, P.R. of China Titan ITM Japan Ltd Akasaka, Tokyo, Japan
Why Titan?
Our Global Footprint
9

TIRES
WHEELS
UNDERCARRIAGE
SERVICE CENTERS
RECLAMATION
Best Portfolio in the World
Why Titan?
10

Why Titan?
Innovation
11
WAFFLE WHEEL
ONE PIECE HIGH-SPEED CRANE WHEEL
20kg lighter than current three-piece wheel
Increased safety - due to removal of loose parts
Rim profile is approved by Michelin and Bridgestone
We have 100% of European high-speed crane market
Patented product
Simplified design
Ease of wheel offset changes
Superior durability and long-term reliability
Reduced wheel wobble and hop
10 year agreement with Suncor to recycle used tires
Oil, carbon black and steel reclaimed
First location, Fort McMurray, Canada, to be in operation in 2016

Why Titan?
2015 Objectives
12
“ONE TITAN”
• Maximize collaboration between wheel and tire business units to accelerate market penetration
• Exercise one common strategy across company divisions
WHEEL/TIRE
SYSTEM
ADVANTAGE
• Exploit our competitive advantage as the only wheel/tire assembly solution provider in North America
• Accelerating adoption of our unique “system” solution (“One stop” supplier)
PROFIT
OPTIMIZATION
• Measure, Evaluate and drive Net Economic Profit
• Align investments with “One Titan” strategy
• Drive decision making through detailed understanding of “Cost to Serve”
= INCREASE SHAREHOLDER
VALUE

Market Summary
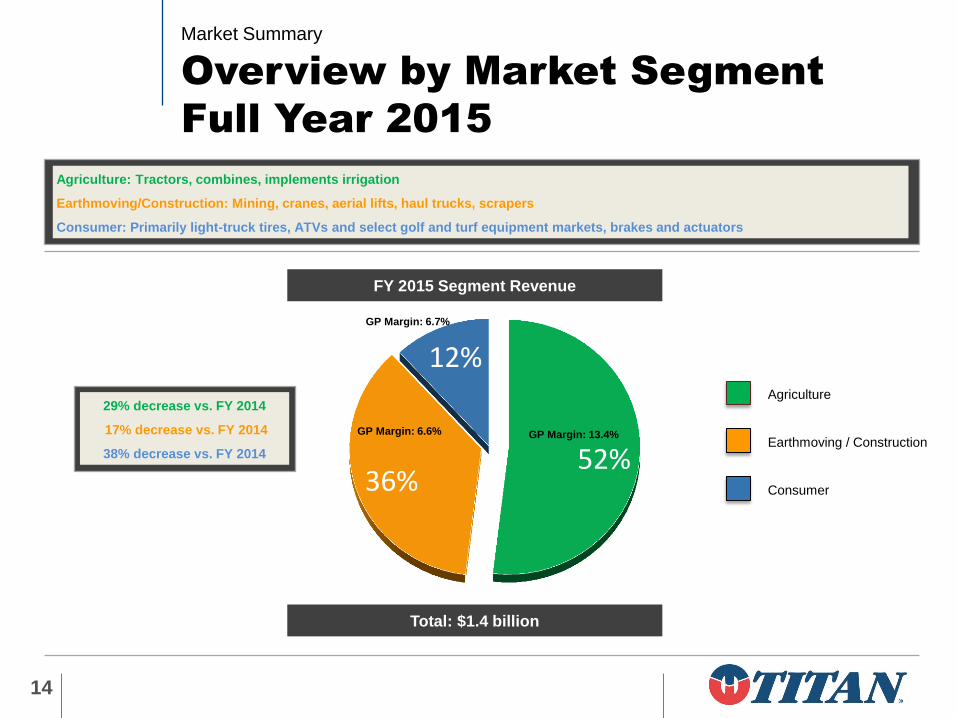
52% 36%
12%
GP Margin: 6.7%
GP Margin: 6.6% GP Margin: 13.4%
Market Summary
Overview by Market Segment
Full Year 2015
14
Agriculture: Tractors, combines, implements irrigation
Earthmoving/Construction: Mining, cranes, aerial lifts, haul trucks, scrapers
Consumer: Primarily light-truck tires, ATVs and select golf and turf equipment markets, brakes and actuators
Agriculture
Consumer
Earthmoving / Construction
FY 2015 Segment Revenue
Total: $1.4 billion
29% decrease vs. FY 2014
17% decrease vs. FY 2014
38% decrease vs. FY 2014

Market Summary
Agriculture Drivers
15
$0.00
$5.00
$10.00
$15.00Pr/Bussel
Farm Commodity PricesCorn Soybeans
0%
20%
40%
60%
80%
100%
2007 2008 2009 2010 2011 2012 2013 2014 2015
Global Ag Machinery Production
Europe Americas Asia Rest of the World
Mix Shift - Large hp equipment (4WD tractors and Combines) continue a cyclical downturn which began in
2014. Smaller hp tractor demand remains strong, but at lower ASP and gross margins
Passed legislation to reinstate tax incentives including Section 179 deduction (permanent) and bonus
depreciation (phased out in 2020)
Grain prices remain at lower levels; resulting in lower farm income
Potential EPA weakening of the Renewable Fuel Standard impacting ethanol
Used equipment inventory levels remain high, but have shown signs of stabilizing
Interest rates remain low for financing new equipment purchases
Market Summary
Earthmoving/Construction Drivers
16
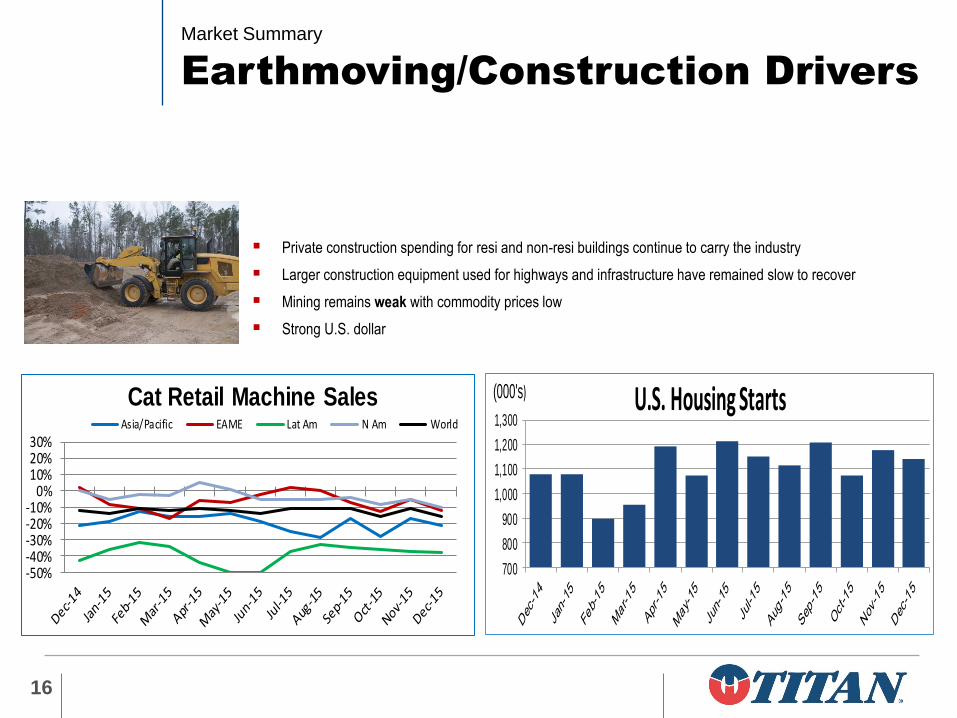
Private construction spending for resi and non-resi buildings continue to carry the industry
Larger construction equipment used for highways and infrastructure have remained slow to recover
Mining remains weak with commodity prices low
Strong U.S. dollar
700
800
900
1,000
1,100
1,200
1,300U.S. Housing StartsU(000's)
-50%-40%-30%-20%-10%
0%10%20%30%
Asia/Pacific EAME Lat Am N Am World
Cat Retail Machine Sales

Financial Performance
Financial Performance
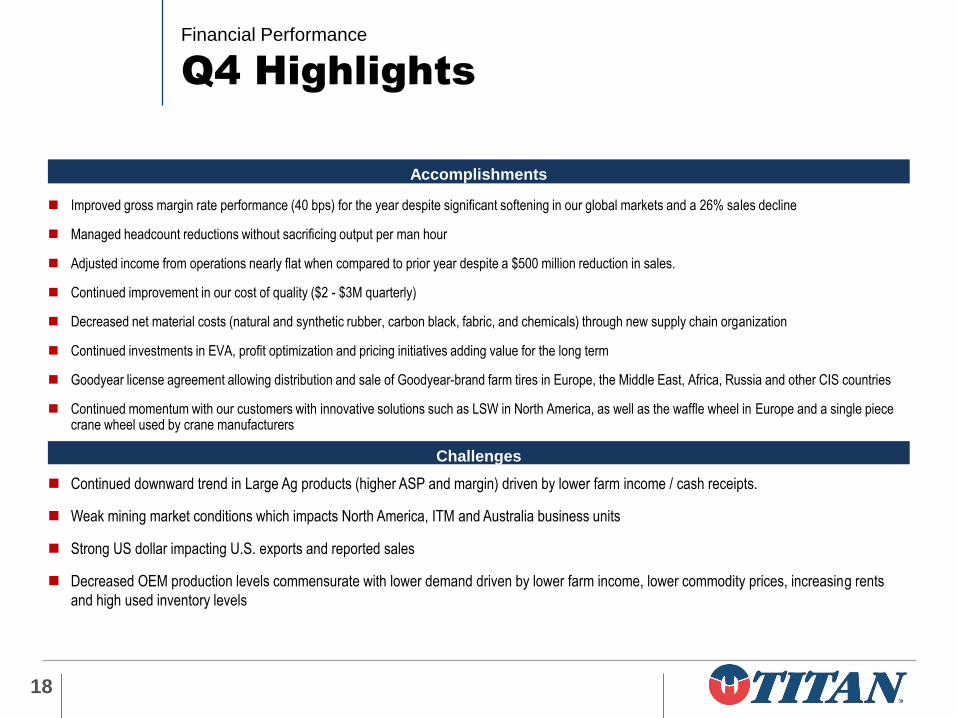
Q4 Highlights
Improved gross margin rate performance (40 bps) for the year despite significant softening in our global markets and a 26% sales decline
Managed headcount reductions without sacrificing output per man hour
Adjusted income from operations nearly flat when compared to prior year despite a $500 million reduction in sales.
Continued improvement in our cost of quality ($2 - $3M quarterly)
Decreased net material costs (natural and synthetic rubber, carbon black, fabric, and chemicals) through new supply chain organization
Continued investments in EVA, profit optimization and pricing initiatives adding value for the long term
Goodyear license agreement allowing distribution and sale of Goodyear-brand farm tires in Europe, the Middle East, Africa, Russia and other CIS countries
Continued momentum with our customers with innovative solutions such as LSW in North America, as well as the waffle wheel in Europe and a single piece crane wheel used by crane manufacturers
Accomplishments
Challenges
Continued downward trend in Large Ag products (higher ASP and margin) driven by lower farm income / cash receipts.
Weak mining market conditions which impacts North America, ITM and Australia business units
Strong US dollar impacting U.S. exports and reported sales
Decreased OEM production levels commensurate with lower demand driven by lower farm income, lower commodity prices, increasing rents
and high used inventory levels
18
Financial Performance
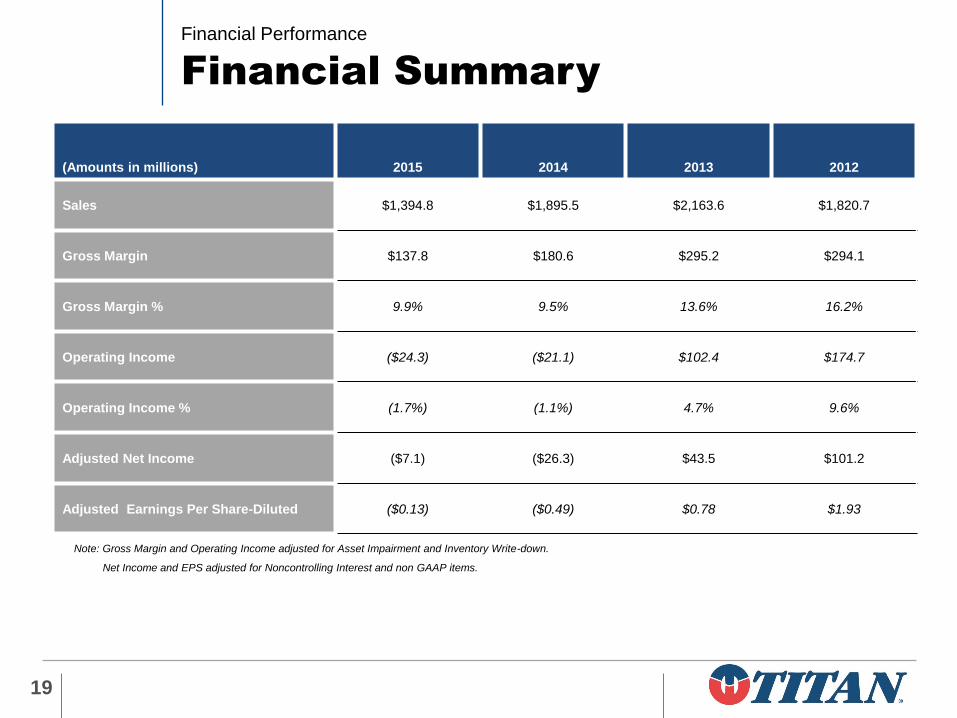
Financial Summary
19
Note: Gross Margin and Operating Income adjusted for Asset Impairment and Inventory Write-down.
Net Income and EPS adjusted for Noncontrolling Interest and non GAAP items.
(Amounts in millions) 2015 2014 2013 2012
Sales $1,394.8 $1,895.5 $2,163.6 $1,820.7
Gross Margin $137.8 $180.6 $295.2 $294.1
Gross Margin % 9.9% 9.5% 13.6% 16.2%
Operating Income ($24.3) ($21.1) $102.4 $174.7
Operating Income % (1.7%) (1.1%) 4.7% 9.6%
Adjusted Net Income ($7.1) ($26.3) $43.5 $101.2
Adjusted Earnings Per Share-Diluted ($0.13) ($0.49) $0.78 $1.93

Financial Performance
Adjusted Income
20
Note: Adjustments for non GAAP items are net of taxes.
Financial Performance
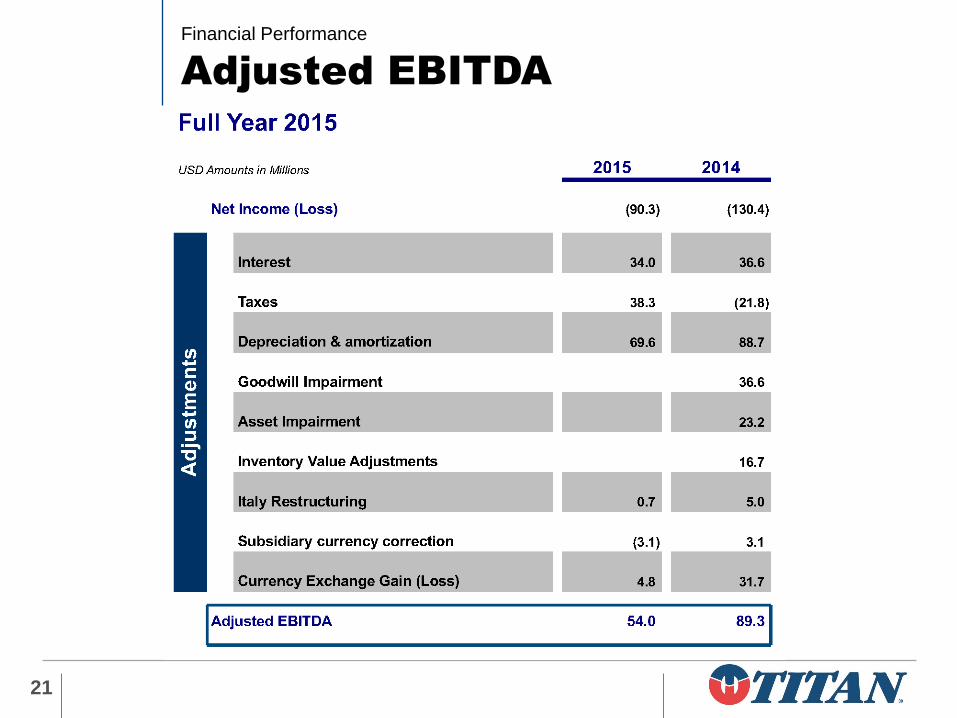
Adjusted EBITDA
21

Financial Performance
Sales and Gross Margin by Market
22
Net Sales: Down (29%) 2015 vs. 2014
High - Horsepower Tractor/Combine sales continued weakness
Reduced OEM demand for products
FX devaluation of (8%); volume down (17%); price/mix down (4%)
AG
52%
Net Sales: Down (38%) 2015 vs. 2014
Exit from several low-margin compound supply agreements (10%) as
a result of bringing this process in-house to improve profit
FX devaluation of (18%); volume down (6%); price/mix down (4%)
Consumer
12%
EMC
36%
Net Sales: Down (17%) 2015 vs. 2014
Mining remains weak with commodity prices low
FX devaluation of (11%); volume down (1%); price/mix down (5%)
$1,080$1,182
$1,017
$724
19% 17%13% 13%
$100
$300
$500
$700
$900
$1, 100
$1, 300
$1, 500
0%
10%
20%
30%
40%
50%
60%
70%
2012 2013 2014 2015
$502
$749
$611$505
15%11%
5% 7%
$0
$100
$200
$300
$400
$500
$600
$700
$800
$900
$1, 000
-2%
8%
18%
28%
38%
48%
58%
68%
78%
2012 2013 2014 2015
$239 $232$268
$165
7% 7%6% 7%
$0
$25
$50
$75
$100
$125
$150
$175
$200
$225
$250
$275
$300
$325
$350
$375
$400
$425
$450
$475
$500
-2%
8%
18%
28%
38%
48%
58%
68%
78%
2012 2013 2014 2015
Note: Gross Margin adjusted for Asset Impairment and Inventory Write-down.

Financial Performance
Titan performance: 2012-2015
23
$621$798
$519$345
$0
$500
$1,000
2012 2013 2014 2015
Shareholder EquityIn millions
$244$197
$89$54
$0
$100
$200
$300
2012 2013 2014 2015
Adjusted EBITDAIn millions
50% Domestic;
50% International
$1,821$2,164
$1,896$1,395
$0
$1,000
$2,000
$3,000
2012 2013 2014 2015
SalesIn millions
Financial Appendix
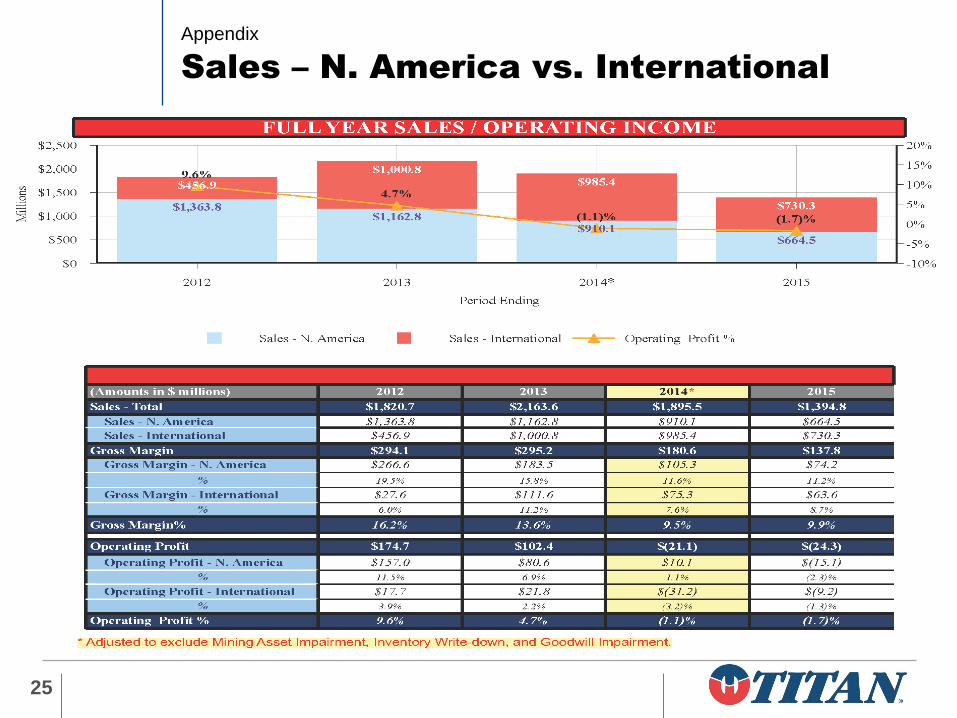
Appendix
Sales – N. America vs. International
25
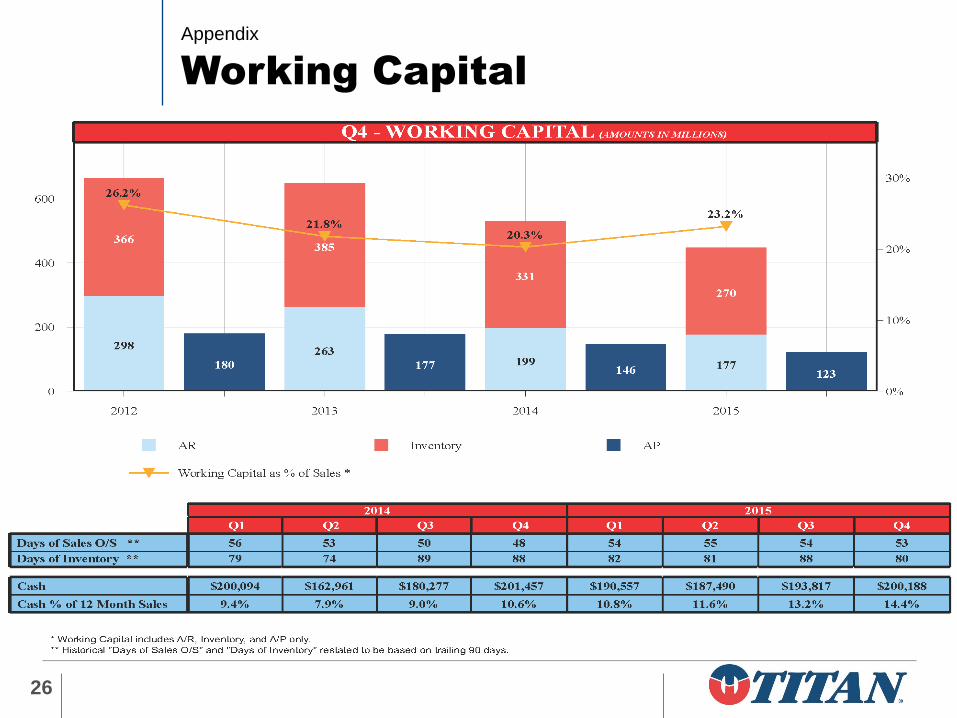
Appendix
Working Capital
26

Appendix
Cash Activity
27

Appendix
Debt Structure
28

Appendix
Cost Structure
29
Raw
Materials
55%
Overhead
25%
Labor
20%
Primary Raw Materials Cost Structure Breakdown
Steel
Natural Rubber
Synthetic Rubber
Carbon Black
Nylon

LSW Technology Appendix

LSW Technology Appendix
What is LSW Technology?
31

LSW Technology Appendix
Why LSW in Agriculture?
32

LSW Technology Appendix
Why LSW in Agriculture?
33

LSW Technology Appendix
Why LSW in Agriculture?
34

LSW Technology Appendix
Why LSW in Agriculture?
35

LSW Technology Appendix
Why LSW in Agriculture?
36
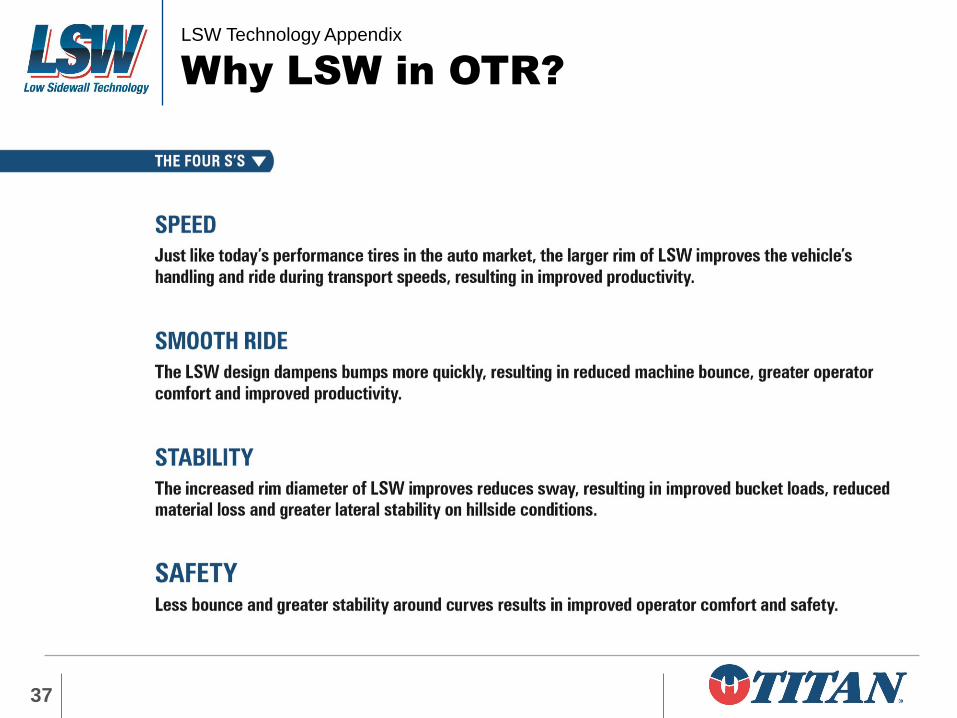
LSW Technology Appendix
Why LSW in OTR?
37
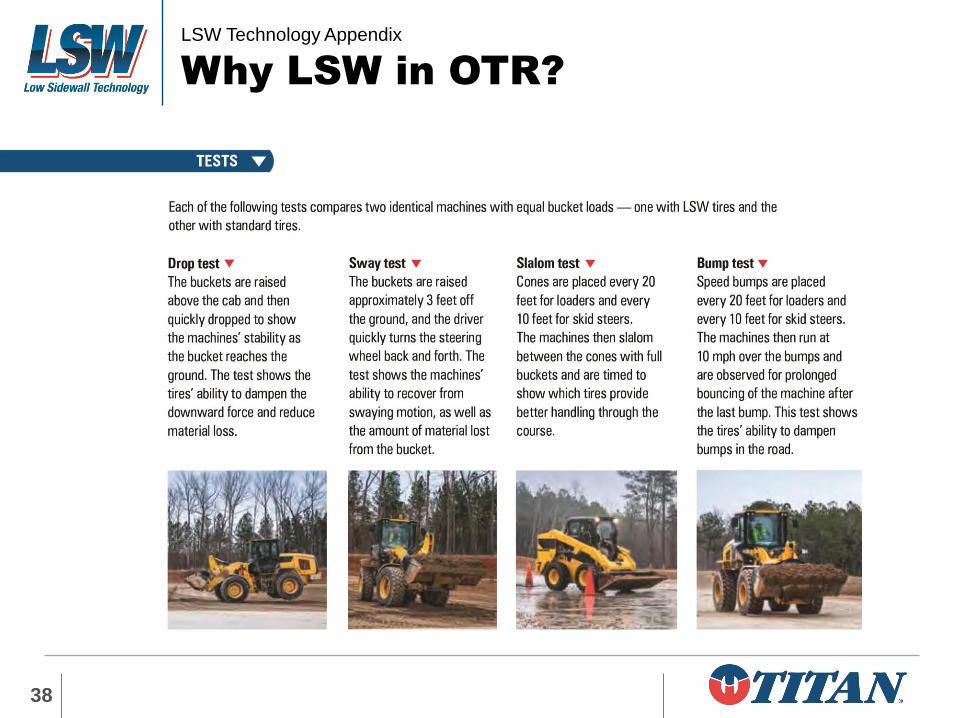
LSW Technology Appendix
Why LSW in OTR?
38

LSW Technology Appendix
Why LSW in OTR?
39

LSW Technology Appendix
Why LSW in OTR?
The stability is great. You can work
faster because there’s not as much
side-to-side movement when you’re
digging. It’s got a good tread and it
rides smooth. It runs faster, harder;
it’s definitely a lot better.”
Mickey Cook, comparing the Titan STL3 LSW
to a comparable standard tire.
Cedar Lake Mining, Inc.
Pinson, Alabama
40

LSW Technology Appendix
LSWAdvantage.com
The site includes an overview of LSW technology and its benefits, the history behind the development of the technology, product
information, details on how to buy from your dealer and videos of real-world equipment owners who have benefited from making the
switch from standard tires to LSW tires.
41

Investor Relations
SAFE HARBOR STATEMENT: The accompanying material includes forward-looking comments and information concerning the company’s expectations and objectives for the
future. Readers of this material should understand that these forward looking statements are based on the Company’s expectations and subject to a number of risks and
uncertainties, certain of which are beyond the Company’s control.
Actual results may differ materially from those projected in these forward looking statements as a result of certain factors which are contained in the Company’s most recent 10K
filing. The Company undertakes no obligation to publicly update or revise any forward-looking statements, whether as a result of new information, future events or otherwise. In light of these risks and uncertainties, there can be no assurance that the forward-looking information contained in this document will in fact transpire.
Company Website:
www.titan-intl.com