full text (pdf) - jahajaha.ahajournals.org/content/ahaoa/4/2/e001477.full.pdf · plaque...
TRANSCRIPT
Atherosclerotic Plaque Inflammation Varies Between Vascular Sitesand Correlates With Response to Inhibition of Lipoprotein-AssociatedPhospholipase A2Robert S. Fenning, MD; Mark E. Burgert, MS; Damir Hamamdzic, DVM, PhD; Eliot G. Peyster, MD; Emile R. Mohler, III, MD; Shreya Kangovi,MD; Beat M. Jucker, PhD; Stephen C. Lenhard, MS; Colin H. Macphee, PhD; Robert L. Wilensky, MD
Background-—Despite systemic exposure to risk factors, the circulatory system develops varying patterns of atherosclerosis forunclear reasons. In a porcine model, we investigated the relationship between site-specific lesion development and inflammatorypathways involved in the coronary arteries (CORs) and distal abdominal aortas (AAs).
Methods and Results-—Diabetes mellitus (DM) and hypercholesterolemia (HC) were induced in 37 pigs with 3 healthy controls.Site-specific plaque development was studied by comparing plaque severity, macrophage infiltration, and inflammatory geneexpression between CORs and AAs of 17 DM/HC pigs. To assess the role of lipoprotein-associated phospholipase A2 (Lp-PLA2) inplaque development, 20 DM/HC pigs were treated with the Lp-PLA2 inhibitor darapladib and compared with the 17 DM/HCuntreated pigs. DM/HC caused site-specific differences in plaque severity. In the AAs, normalized plaque area was 4.4-fold higher(P<0.001) and there were more fibroatheromas (9 of the 17 animals had a fibroatheroma in the AA and not the COR, P=0.004),while normalized macrophage staining area was 1.5-fold higher (P=0.011) compared with CORs. DM/HC caused differentialexpression of 8 of 87 atherosclerotic genes studied, including 3 important in inflammation with higher expression in the CORs.Darapladib-induced attenuation of normalized plaque area was site-specific, as CORs responded 2.9-fold more than AAs (P=0.045).
Conclusions-—While plaque severity was worse in the AAs, inflammatory genes and inflammatory pathways that use Lp-PLA2 weremore important in the CORs. Our results suggest fundamental differences in inflammation between vascular sites, an importantfinding for the development of novel anti-inflammatory therapeutics. ( J Am Heart Assoc. 2015;4:e001477 doi: 10.1161/JAHA.114.001477)
Key Words: arteriosclerosis • coronary disease • darapladib • inflammation • lipoprotein-associated phospholipase A2 •peripheral vascular disease
A lthough atherosclerosis is a systemic disease and thecirculatory system is uniformly exposed to risk factors
such as hyperglycemia and hypercholesterolemia, plaquedevelopment varies between vascular sites. For decades,clinicians have noted such heterogeneity of presentation,1 and
researchers have shown distinct risk factor profiles for arterialbeds.2 We have previously demonstrated variable diseasedevelopment of atherosclerosis in diabetic/hypercholesterol-emic (DM/HC) pigs with severe, high-risk lesion development inthe coronary arteries (CORs), less severe disease in thethoracic aorta, and minimal disease in the carotid arteries.3
Extensive atherosclerosis in the distal abdominal aortas (AAs)extending into the proximal iliac vessels has also been reportedin these animals.4 The cause of such variable site-specificdisease development, observed in both humans and DM/HCpigs, is unclear but clinically important.
Lipoprotein-associated phospholipase A2 (Lp-PLA2) is apotential target for atherosclerosis treatment.5 An enzymesecreted by inflammatory cells, it generates the proinflamma-tory mediators lysophosphatidylcholine and oxidized noneste-rified fatty acids fromoxidized low-density lipoproteinwithin thearterial wall.6 We previously showed that selective inhibition ofLp-PLA2 with darapladib reduced the development of high-riskCOR atherosclerotic plaques in a DM/HC pig model,7 and
From the Hospital of the University of Pennsylvania, Philadelphia, PA (R.S.F,D.H., E.G.P., E.R.M., S.K., R.L.W.); GlaxoSmithKline, King of Prussia, PA (M.E.B.,B.M.J., S.C.L., C.H.M.).
Accompanying Tables S1 through S3 are available at http://jaha.ahajournals.org/content/4/2/e001477/suppl/DC1
Correspondence to: Robert L. Wilensky, MD, Hospital of the University ofPennsylvania, 3400 Spruce St, 9 Gates, Philadelphia, PA 19104. E-mail:[email protected]
Received October 23, 2014; accepted January 9, 2015.
ª 2015 The Authors. Published on behalf of the American Heart Association,Inc., by Wiley Blackwell. This is an open access article under the terms of theCreative Commons Attribution-NonCommercial License, which permits use,distribution and reproduction in any medium, provided the original work isproperly cited and is not used for commercial purposes.
DOI: 10.1161/JAHA.114.001477 Journal of the American Heart Association 1
ORIGINAL RESEARCH
by guest on May 4, 2018
http://jaha.ahajournals.org/D
ownloaded from
by guest on M
ay 4, 2018http://jaha.ahajournals.org/
Dow
nloaded from
by guest on May 4, 2018
http://jaha.ahajournals.org/D
ownloaded from
by guest on M
ay 4, 2018http://jaha.ahajournals.org/
Dow
nloaded from
by guest on May 4, 2018
http://jaha.ahajournals.org/D
ownloaded from
by guest on M
ay 4, 2018http://jaha.ahajournals.org/
Dow
nloaded from
by guest on May 4, 2018
http://jaha.ahajournals.org/D
ownloaded from
by guest on M
ay 4, 2018http://jaha.ahajournals.org/
Dow
nloaded from
by guest on May 4, 2018
http://jaha.ahajournals.org/D
ownloaded from
by guest on M
ay 4, 2018http://jaha.ahajournals.org/
Dow
nloaded from
by guest on May 4, 2018
http://jaha.ahajournals.org/D
ownloaded from
by guest on M
ay 4, 2018http://jaha.ahajournals.org/
Dow
nloaded from
by guest on May 4, 2018
http://jaha.ahajournals.org/D
ownloaded from
by guest on M
ay 4, 2018http://jaha.ahajournals.org/
Dow
nloaded from
by guest on May 4, 2018
http://jaha.ahajournals.org/D
ownloaded from
by guest on M
ay 4, 2018http://jaha.ahajournals.org/
Dow
nloaded from
by guest on May 4, 2018
http://jaha.ahajournals.org/D
ownloaded from
by guest on M
ay 4, 2018http://jaha.ahajournals.org/
Dow
nloaded from
by guest on May 4, 2018
http://jaha.ahajournals.org/D
ownloaded from
by guest on M
ay 4, 2018http://jaha.ahajournals.org/
Dow
nloaded from
by guest on May 4, 2018
http://jaha.ahajournals.org/D
ownloaded from
by guest on M
ay 4, 2018http://jaha.ahajournals.org/
Dow
nloaded from
by guest on May 4, 2018
http://jaha.ahajournals.org/D
ownloaded from
by guest on M
ay 4, 2018http://jaha.ahajournals.org/
Dow
nloaded from
by guest on May 4, 2018
http://jaha.ahajournals.org/D
ownloaded from

The Stabilization of Atherosclerotic Plaque by Initiation ofDarapladib Therapy Trial (STABILITY) has shown that darapladibsignificantly reduced the risk of the secondary end points ofmajor coronary events and total coronary events in patientswith stable coronary heart disease, although it failed todemonstrate significant reductions in the risk of the primaryend point of cardiovascular death, myocardial infarction, andstroke.8 In the current study, we addressed the question ofwhether the mechanism of atherosclerosis in 2 areas ofextensive lesion development―the CORs and the distalAAs―differed with regard to inflammatory pathways, specifi-cally those using Lp-PLA2. We assessed differences in plaquedevelopment by comparing plaque severity, macrophage infil-tration, and inflammatory gene expression profiles caused byDM/HC induction between the CORs and AAs. In addition, weassessed for differences in the role of Lp-PLA2 in plaquedevelopment and gene expression by analyzing differences inresponse to darapladib treatment between the CORs and AAs.
Methods
Animals and Experimental ProtocolThe DM/HC porcine model has been previously described.3,7
Briefly, 37 male Yorkshire domestic pigs weighing 20 to 25 kg(Archer Farms) were made DM/HC with 3 healthy pigs servingas controls (non-DM/HC control). DM was induced by125 mg/kg of intravenous streptozotocin (Sicor Pharmaceu-ticals), and exogenous insulin was administered via a slidingscale for blood glucose levels >350 mg/dL to avoid ketoac-idosis. Hypercholesterolemia was induced with a hyperlipi-demic diet containing 0.5% cholesterol, 10% lard, and 1.5%sodium cholate (Animal Specialties) to achieve a targetcholesterol level of 400 to 800 mg/dL. Four weeks after DM/HC induction, pigs were randomly assigned into a controlgroup (DM/HC control, n=17) or a treatment group (DM/HCdarapladib, n=20) receiving 10 mg/kg/d orally of the selec-tive Lp-PLA2 inhibitor darapladib (SB480848; GlaxoSmithK-line). Twenty-eight weeks after DM/HC induction (24 weeksfrom treatment), pigs were killed (Eutasol; Virbac AH) andtissue was harvested for analysis. A distal section of AAincluding the proximal iliac and the right CORs wereprocessed for gene expression. Following fixation withformaldehyde, the remaining distal AA underwent magneticresonance imaging (MRI). Then, the tissue was processed forhistologic and immunohistochemical analyses. The left ante-rior descending coronary artery was used for the analyses.Glucose and cholesterol levels for each animal were measuredmonthly for the duration of the study and were plotted overtime. The cumulative total plasma glucose or cholesterol levelwas determined by calculating the area under the curvefor the respective levels for each animal. All studies were
approved by the University of Pennsylvania Animal Care andUse Committee. These experiments are a further analysisderived from the 40 pigs from which only the coronary datawere published.7 In the current experiment, the magnitude ofeffect of DM/HC induction and darapladib treatment on theAAs is compared with the magnitude of effect of DM/HCinduction and darapladib treatment on the CORs. Furtherdetails of the methods have been previously published.7
Histologic and Immunohistochemical EvaluationArteries were cut into 5-mm sections and embedded in paraffin.Histologic sections were stained with Movat’s pentachromeand analyzed with the use of Image Pro 6.2 software(MediaCybernetics). Morphometric analysis of all arterialsections was performed to determine lesion area, area ofcalcification, necrotic core area, presence of intraplaquehemorrhage, medial destruction, and lesion classification aspreviously described.7 The normalized plaque area, defined asthe ratio of the lesion area to medial area, was used to adjust tocompare arteries of different sizes. The normalized calcificationarea was defined as the ratio of the calcification area to lesionarea of the most severe lesion, and the normalized necroticcore area was defined as the ratio of the necrotic core area tolesion area of the most severe lesion. Each section wasclassified by using the modified American Heart Association(AHA)/Virmani score (0=no disease, 1=intimal thickening,2=intimal xanthoma, 3=pathologic intimal thickening,4=fibrous cap atheroma, and 5=thin fibrous cap atheroma)9
with the maximum AHA score of the artery used for analysis.The maximum medial destruction score was determined usingthe following scale from 0 to 4: 0=normal, 1=internal elasticlamina disrupted, 2=destruction of <50% of the medialthickness, 3=destruction of >50% of the medial thickness,and 4=destruction of >50% of the medial thickness along withdisruption of the external elastic lamina.7 Intraplaque hemor-rhage was identified by the presence of extravasated red bloodcells outside of the vasa vasorum.9 Adjacent sections of theAAs and CORs were stained with a goat polyclonal cathepsin Santibody (Santa Cruz Biotechnology Inc) for inflammatory cellswith augmented protease activity, mostly macrophages, aspreviously described.7 The normalized macrophage area wasdefined by the ratio of cathepsin S staining area divided by thelesion area of the most severe lesion.
Gene Expression Using Quantitative Real-TimePolymerase Chain ReactionThe details for the gene expression analysis have beenpreviously published.7 Briefly, a Taqman plate was con-structed using 87 genes shown to be expressed in humanatherosclerotic plaque10 that have pig orthologs (see Table S1
DOI: 10.1161/JAHA.114.001477 Journal of the American Heart Association 2
Site-Specific Plaque Development Fenning et alORIG
INALRESEARCH
by guest on May 4, 2018
http://jaha.ahajournals.org/D
ownloaded from

for sequences). The effect of DM/HC induction on geneexpression was analyzed by comparing the non-DM/HCcontrol group (n=3) with the DM/HC control group (n=17).The effect of darapladib treatment on gene expression wasanalyzed by comparing the DM/HC control group (n=17) withthe DM/HC darapladib group (n=20). Whole minced arterieswere homogenized on ice in Trizol reagent (Sigma). Total RNAwas extracted, purified, and, after on-column DNase treat-ment, eluted with RNase-free water. Genomic DNA contam-ination was removed with DNase I (Ambion). Quantification ofthe RNA was performed and converted to cDNA via reversetranscription. TaqMan gene expression data were analyzed onthe basis of normalized expression values, by using scaledgeometric mean of selected reference genes for the normal-ization factor calculations.
Ex Vivo MRIThe distal AAs were placed in 0.2% gadopentetate dimeglu-mine–doped water solution, and imaging was performed witha 9.4-T l-imaging system (Bruker). A gradient echo coronalscout image to properly orient the axial high-resolution T2-weighted images had the following parameters: TE/TR=4.2/137 ms, 2569256 matrix, excitations=1, field of view=4 cm,slice width=50 kHz, flip angle=30°, 10 slices, 1-mm slicethickness. Once the scout image was acquired, a T2-weightedspin echo image was acquired in the axial plane with thefollowing parameters: TE/TR=40/2000 ms, slice width=50 kHz, 2569256 matrix, excitations=16, field of view=1.6 cm, 20 slices, 1-mm slice thickness.
Statistical AnalysisTo assess for site-specific effects of DM/HC induction onplaque severity and macrophage infiltration, the effect size ofDM/HC induction on the CORs was compared with the effectsize on the AAs among the 17 DM/HC pigs. As appropriatefor the data type and sample distributions, paired-response ormixed-model analysis methods were used to allow eachanimal to serve as its own control. The paired analysisapproach was used for all the categorical responses (fibro-atheroma, intraplaque hemorrhage, AHA score, and medialdestruction score) with a signed rank comparison for thepaired difference of the artery responses. The paired analysisapproach was also used for the continuous response valuesthat did not have normal distributions (normalized calcifica-tion area and normalized necrotic core area) with a nonpara-metric signed rank comparison for the paired difference of theartery values. The mixed model analysis was used forcontinuous response values with approximately normaldistributions after log transformations (normalizedmacrophage area and normalized plaque area) with a 2-sided
t test of the contrast estimates of the log-transformed values.The P values test for a significant interaction between theeffect size of DM/HC induction and vascular site.
To assess for site-specific effects of darapladib treatment onplaque severity and macrophage infiltration, the effect size oftreatment on the CORs was compared with the effect size onthe AAs by comparing the DM/HC control pigs with the DM/HCdarapladib pigs. As in the comparisons of the inductiondifferences, the comparisons between the treatments by arterylocation used paired-response or mixed-model analysis meth-ods to allow each animal to serve as its own control. Forcategorical responses, the Exact Cochran–Mantel–Haenszeltest was used. For continuous response values that did not havenormal distributions, the Wilcoxon–Mann–Whitney test wasused. For continuous response values with normal distributionsafter log transformation, 2-sided t tests of the contrastestimates of log-transformed values were used.
To assess for site-specific effects of DM/HC induction anddarapladib treatment on gene expression, mixed-modelanalysis of log-transformed expression levels was used. Foreach gene at each vascular site, the change in expression wascompared with the baseline normal expression levels from the3 normal pigs. The assessment of the effects of darapladibtreatment and of the treatment differences between thevascular sites also used the same mixed-model analysismethods for comparing the 17 DM/HC control pigs with the20 DM/HC treatment pigs. Log-transformed values weretested using 2-sided t tests for the contrasts, and theunadjusted P values were reported for all mixed-modelcomparisons. The log-transformed comparisons were retrans-formed into fold-change values. Positive fold-change valuesindicate increased expression compared with control, whilenegative fold-change values indicate decreased expression.
The correlation estimation used the Spearman rankmethod to assess for associations between cumulative totalplasma cholesterol levels or glucose levels and normalizedplaque area in the 2 vascular sites with induction of DM/HC,as well as to assess for the association of normalized plaquearea between the CORs and the AAs.
All statistical tests were assessed for significance at the0.05 level, regardless of the number of tests performed.Specifically, the P values reported for the gene expressioncomparisons were not adjusted for the 87 separate geneswith comparisons.
Results
Induction of DM/HC Causes More Severe LesionDevelopment in AAs Compared With CORsThe induction of DM/HC led to a sustained elevation ofglucose and cholesterol levels, respectively, as previously
DOI: 10.1161/JAHA.114.001477 Journal of the American Heart Association 3
Site-Specific Plaque Development Fenning et alORIG
INALRESEARCH
by guest on May 4, 2018
http://jaha.ahajournals.org/D
ownloaded from

published (glucose �380 mg/dL and cholesterol �700 mg/dL).7 In an analysis of the 17 DM/HC control pigs to study thesite-specific effects of DM/HC induction on plaque severityand macrophage infiltration, the AAs had more plaque, higherAHA/Virmani scores, more fibroatheromas, more intraplaquehemorrhage, more calcification, and more macrophagescompared with thew CORs, illustrating a higher disease
burden with more high-risk features. The normalized plaquearea was 4.4-fold greater in the AAs compared with the CORs(95% CI 2.0 to 9.3, P<0.001, Figure 1A). The median AHAscore was 5 in the AAs compared with 3 in the CORs, and 12/17 (71%) DM/HC control pigs had higher AHA scores in theAAs compared with the CORs, while only 2/17 (12%) pigs hadhigher AHA scores in the CORs (P=0.013, Figure 1B). More
AA COR
p<0.001
Nor
mal
ized
Pl
aque
Are
a
1.5
1.0
0.5
0
0.57
0.320.17
2.5
1.38
0.76
2.0
2.5
p=0.013
AHA
Scor
e
3
2
1
0
4
5
AA COR
C
CO
R
p=0.04AA
-+
- +1
0 7
9
B
A
Nor
mal
ized
C
alci
ficat
ion
Area
AA COR
p=0.004
0.2
0.1
0
0.08
0.00 0.00
0.26
0.17
0.08
0.3D
E
Fibr
oath
erom
aSt
atus
Nor
mal
ized
M
acro
phag
e Ar
ea
AA COR
P=0.01
0.02
0
0.09
0.06
0.03
0.14
0.08
0.05
0.04
0.06
0.08
0.10
F
0.01.02.03.04.05.06.07.08.0
Nor
mal
ized
Pl
aque
Are
a
AA COR
Figure 1. Diabetes and hypercholesterolemia cause more severe disease in the abdominal aorta compared with the coronary artery in ananalysis of the DM/HC control pigs (n=17). A, DM/HC control pigs had a significantly higher normalized plaque area in the AAs compared withthe CORs by a factor of 4.4. Values represent the geometric means � 95% CIs. B, Induction of DM/HC caused significantly higher AHA scores inthe AAs, and (C) more pigs had fibroatheromas in the AAs. D, Normalized calcification area was greater in the AAs. Values represent the medianarea difference � lower and upper quartiles. E, Normalized macrophage area was also significantly higher in the AAs. Values represent thegeometric means � 95% CIs. F, Normalized plaque area is shown for the AA and COR vascular bed for each DM/HC control animal, illustratingmore severe disease in the AA. Each line represents one of the seventeen DM/HC control animals. All P values are testing for a significantinteraction between the respective measure of plaque severity and vascular site. AA indicates abdominal aorta; COR, coronary artery; DM,diabetes mellitus; HC, hypercholesterolemia.
DOI: 10.1161/JAHA.114.001477 Journal of the American Heart Association 4
Site-Specific Plaque Development Fenning et alORIG
INALRESEARCH
by guest on May 4, 2018
http://jaha.ahajournals.org/D
ownloaded from

pigs had fibroatheromas in the AAs (9/17 animals werediscordant with all the discordant pairs positive forfibroatheroma in the AAs, P=0.004, Figure 1C). For intrapl-aque hemorrhage, more pigs had this high-risk finding in theAAs (6/17 animals were discordant with all the discordantpairs positive for intraplaque hemorrhage in the AAs,P=0.031). The median normalized calcification area was0.17 higher in the AAs (0.08 to 0.26 for lower and upperquartiles, P=0.0042, Figure 1D), and the normalized macro-phage area was 1.5-fold higher in the AAs (95% CI 0.7 to 3.1,
P=0.011, Figure 1E). Normalized necrotic core size andmedial destruction scores were not significantly differentbetween the vascular sites. Figure 1F shows for each DM/HCcontrol animal the normalized plaque area of the AA and COR,illustrating more severe atherosclerosis of the AA. Examplesof concordant severe disease involving vascular sites as wellas discordant minimal disease in the CORs but severe,complex disease in the AAs are shown in Figure 2A and 2B,respectively. Figure 2B (1 to 4) highlights advanced athero-sclerotic features of the AAs, including thin cap fibroathero-
Coronary artery Abdominal aorta
100 um 500 um
1
100 um
2
100 um
3
100 um
4
25 um
200 um 500 um
Coronary artery Abdominal aorta
DM/HC control
A
B
C
Figure 2. Illustrative example of more severe atherosclerosis involving the AA. A, Example of a DM/HC control pig with the development ofadvanced, complex atherosclerosis in both the COR and the AA. B, In contrast, an example of a DM/HC control pig with very minimal intimalthickening of the COR but advanced plaque in the AA. All images represent the most severe lesion of the arterial bed for the animal. B, Magnifydifferent findings of advanced disease of the AA plaque: (1) Thin cap fibroatheroma as evident by a thin layer of smooth muscle and collagenoverlying a necrotic core. (2) Atherosclerotic destruction of the medial layer. This represents a medial destruction score of 4 since >50% of themedial layer is destroyed with loss of a clear external elastic lamina border. (3) An area of calcification as seen by an absence of Movat’sstaining. (4) Intraplaque hemorrhage as seen by extravasated red blood cells into a plaque. All histology slides are stained with Movat’spentachrome. C, There is no significant correlation of plaque size between the 2 sites in an analysis of the DM/HC control pigs (n=17), as shownby a plot of COR normalized plaque area to AA normalized plaque area with a Spearman correlation coefficient of 0.16, P>0.5. AA indicatesabdominal aorta; COR, coronary artery; DM/HC, diabetes mellitus and hypercholesterolemia.
DOI: 10.1161/JAHA.114.001477 Journal of the American Heart Association 5
Site-Specific Plaque Development Fenning et alORIG
INALRESEARCH
by guest on May 4, 2018
http://jaha.ahajournals.org/D
ownloaded from

ma, medial destruction, calcification, and intraplaque hemor-rhage. Disease severity as assessed by plaque size in onevascular bed did not predict disease severity in the othervascular bed, as illustrated by a lack of correlation ofnormalized plaque area in Figure 2C (Spearman correlationcoefficient of 0.16, P>0.5).
DM/HC Induces Unique Site-Specific GeneExpression ProfilesReal-time quantitative PCR on whole arteries was used toexplore differences in gene expression profiles between theAAs and CORs caused by the induction of DM/HC. Eight ofthe 87 atherosclerotic genes studied had differentialexpression between the 2 sites. Interestingly, many ofthese genes play a significant role in the inflammatorycascade and showed expression levels that were increasedin the CORs and either decreased or not as robustlyincreased in the AAs (Table 1). For example, CD97,expressed by active lymphocytes, monocytes, and macro-phages,11 showed a 1.5-fold increase in expression in theCORs versus a 1.5-fold decrease in expression in the AAs(P=0.013). Similarly, the inflammatory cytokine CHI3L1 (alsoknown as YKL-40), which has been shown to be importantin atherosclerotic lesion development,12,13 was significantlymore upregulated in the CORs compared with the AAs. ForCHI3L1, DM/HC resulted in an 18.1-fold increase in theCORs versus a 4.0-fold increase in the AAs (P=0.042).While 46 of the 87 genes analyzed showed increasedexpression in both sites, including genes important to theinflammatory process (Table 2 for selected genes and TableS2 in supplemental material for all genes analyzed), thedifferential expression of these 8 genes suggests apotentially more robust inflammatory response in the CORs.
Role of Lp-PLA2 Varies Among Vascular SitesGiven this difference in gene expression profiles between theCORs and the AAs we tested the hypothesis that a targetedanti-inflammatory agent would preferably affect the site withmore inflammatory genes upregulated. To this end, differ-ences in effect size of darapladib treatment on plaqueseverity in the CORs and AAs was assessed by comparing 17DM/HC control pigs with 20 DM/HC darapladib pigs. In ourprevious work, darapladib treatment resulted in significantattenuation of COR atherosclerosis with a notable decreasein coronary plaque and necrotic core area, medial destruc-tion score, as well as fewer lesions with unstable features.7
In the current analysis, darapladib modified disease progres-sion to a lesser extent in the AAs. There was a statisticallysignificant site-specific effect of treatment on normalizedplaque area while the effect of treatment on the develop-ment of fibroatheromas approached statistical significance.The response to treatment with darapladib on attenuation ofnormalized plaque area was 2.9-fold greater in the CORscompared with the AAs (95% CI 1.0 to 8.2, P=0.045 for aninteraction between response to darapladib therapy andvascular site, Figure 3A). For the development of fibroath-eromas, there was a trend toward a site-specific differentialeffect from darapladib treatment. In the CORs, darapladibtreatment reduced the number of fibroatheromas (7/17versus 2/20), while in the AAs, darapladib treatment did notaffect the development of fibroatheromas (16 of 17 versus19 of 20), P=0.069 for an interaction between response todarapladib therapy and vascular site, Figure 3B. Figure 4shows representative sections of AAs from DM/HC controland darapladib pigs demonstrating similar disease severityand similar macrophage infiltration. This is in contrast torepresentative sections of CORs from DM/HC control anddarapladib pigs showing a significant effect of treatment on
Table 1. Influence of DM/HC Induction on Gene Expression for the Genes Differentially Affected by DM/HC in the CORs and AAsin an Analysis of the DM/HC Control Pigs (n=17)
Gene Category Gene Name Fold-change CORs P Value Fold-Change AAs P Value Fold Ratio (AA vs COR) P Value
Inflammatory cell marker CD97 1.5 0.121 �1.5 0.025 �2.2 0.013
Cytokine CHI3L1 18.1 0.001 4.0 0.060 �4.5 0.042
Inflammatory enzyme TIMP1 1.6 0.037 �1.1 0.586 �1.7 0.024
Metabolic regulator IRS1 2.2 0.077 �1.2 0.358 �2.7 0.029
PPARG 3.8 0.001 18.7 <0.001 5.0 0.022
SLC27A4 3.2 <0.001 1.4 0.154 �2.3 0.029
Prostaglandin biosynthesis PTGS1 2.4 0.050 �1.2 0.411 �3.0 0.015
Transmembrane transport MFSD1 3.0 <0.001 1.3 0.330 �2.3 0.021
DM indicates diabetes mellitus; HC, hypercholesterolemia; COR, coronary arteries; AA, abdominal aortas.
DOI: 10.1161/JAHA.114.001477 Journal of the American Heart Association 6
Site-Specific Plaque Development Fenning et alORIG
INALRESEARCH
by guest on May 4, 2018
http://jaha.ahajournals.org/D
ownloaded from

disease severity. Interestingly, treatment with darapladibsignificantly affected development of AA intraplaque hemor-rhage (1 of 20 darapladib pigs versus 6 of 17 control pigshad intraplaque hemorrhage, P=0.033). No CORs demon-strated intraplaque hemorrhage in either group.
Lp-PLA2 Inhibition Has a Similar Effect onAtherosclerotic Gene Expression in the AAs andthe CORsIn previous work, darapladib treatment was shown tosignificantly affect 24 of the 87 genes studied in the CORs,including important inflammatory genes associated withmacrophage function (CD68, Lp-PLA2, cathepsin S), T-helpertype 1 lymphocyte function (CXCR3), and monocyte and T-cellfunction (CD18, BIN2).7 In the current study, the effect ofdarapladib treatment on atherosclerotic gene expression
showed similar changes in 85 of 87 genes analyzed for boththe AAs and the CORs (Table S3). One gene that wasdifferentially affected by darapladib was CCR2, a geneencoding the receptor for monocyte chemoattractant protein1 (MCP-1), important for the recruitment of monocytes toareas of active inflammatory plaque.14 Its expression wassignificantly decreased by 1.8-fold in CORs versus a 1.2-folddecrease in the AAs with darapladib treatment (P=0.032). Theother gene with differential expression was ADAMDEC1, agene encoding for a secreted protein belonging to thedisintegrin metalloproteinase family important for dendriticcell maturation and shown to have increased expression inunstable human carotid plaques.10 Its expression wasincreased in the CORs by 1.2-fold versus a decrease of 3.3-fold in the AAs with darapladib treatment (P=0.040). Despitesimilar effects on gene expression patterns in the CORs andAAs, Lp-PLA2 inhibition had a significantly greater effect on
Table 2. Influence of DM/HC Induction on Gene Expression for Selected Genes Similarly Affected by DM/HC in Both the CORsand AAs in an Analysis of the DM/HC Control Pigs (n=17)
Gene Category Gene Name Fold-Change CORs P Value Fold-Change AAs P Value
Inflammatory cell markers CD4 25.1 <0.001 10.3 <0.001
CD48 19.7 <0.001 15.5 <0.001
CD68 16.9 <0.001 14.1 <0.001
BIN2 7.1 <0.001 6.0 0.002
IL2RA 6.0 0.005 2.6 0.01
CD163 4.8 <0.001 3.2 0.009
CD36 4.5 <0.001 11.8 <0.001
Cytokines, chemokines, or chemokine receptors CCL5 7.2 <0.001 3.0 0.02
CCL3 2.5 0.01 4.6 0.003
IL18 4.1 <0.001 6.5 <0.001
IL6 2.5 0.007 3.9 0.006
TNF 2.1 0.005 2.7 0.005
CCR1 11.2 0.004 10.0 0.003
Inflammatory cell chemotaxis ITGB2 14.7 <0.001 10.7 <0.001
VCAM1 5.3 <0.001 5.8 <0.001
PTAFR 5.8 <0.001 3.8 0.003
Inflammatory enzymes MMP9 71.1 0.002 112.4 <0.001
CTSS 16.1 <0.001 15.4 <0.001
Lp-PLA2 15.7 <0.001 11.6 <0.001
PLAUR 6.7 <0.001 3.2 <0.001
Oxidative stress CYBB 19.8 <0.001 13.9 <0.001
NCF1 10.5 <0.001 6.9 0.005
HMOX1 6.4 <0.001 3.4 0.006
UCP2 6.2 <0.001 4.4 0.004
DM indicates diabetes mellitus; HC, hypercholesterolemia; COR, coronary arteries; AA, abdominal aortas.
DOI: 10.1161/JAHA.114.001477 Journal of the American Heart Association 7
Site-Specific Plaque Development Fenning et alORIG
INALRESEARCH
by guest on May 4, 2018
http://jaha.ahajournals.org/D
ownloaded from

attenuation of plaque development in the CORs, suggestingthat the inflammatory cascade is of greater importance in theCORs compared with the AAs.
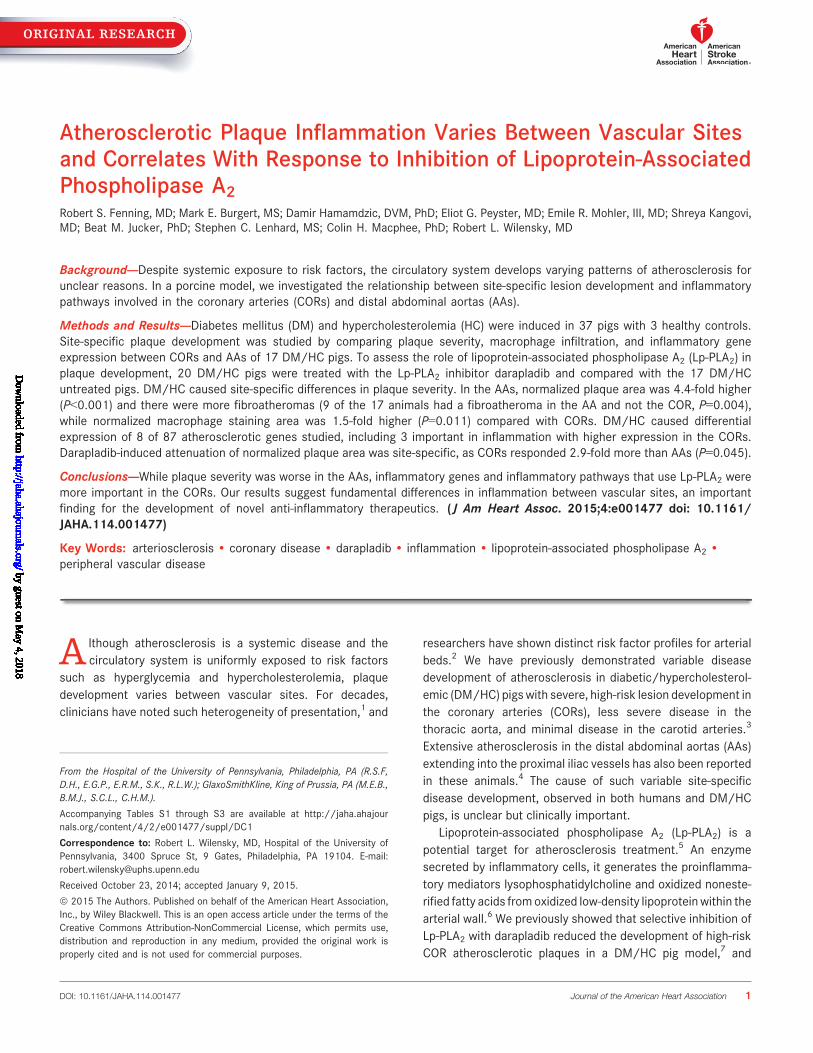
Glucose Levels Are Correlated to AA Lesion Areabut Not COR Lesion AreaTo study the relationships between the normalized plaquearea and the severity of hyperglycemia and hypercholester-olemia, the normalized plaque area was plotted against totalcumulative plasma glucose levels and total cumulativeplasma cholesterol levels for each vascular site. For therange of total cumulative plasma glucose and cholesterollevels observed in the study, the AA normalized plaque areasignificantly correlated with the severity of hyperglycemia(Figure 5A) while the COR normalized plaque area did not(Figure 5B). Neither AA nor COR normalized plaque area
significantly correlated with severity of dyslipidemia (Fig-ure 5C and 5D).
DiscussionIn this study, we have shown that DM/HC induction results invariable development of atherosclerosis in CORs and AAs.Plaque severity and inflammatory gene expression differedbetween the 2 vascular beds, with more inflammatory geneexpression in the CORs yet greater plaque severity in the AAs.There was no correlation of severity of disease response toDM/HC induction between the 2 sites and response to Lp-PLA2 inhibition was site specific. Even though darapladibtreatment reduced Lp-PLA2 activity in the proximal iliacarteries/distal AA7 and had a similar effect on inflammatorygenes at both arterial sites, Lp-PLA2 inhibition was effective inreducing plaque area in the CORs but not the AAs. Takentogether, these results suggest a differential role of inflam-matory pathways between vascular sites. Furthermore, thesefindings demonstrate the difficulty of using noncardiacvasculature as a surrogate marker for coronary heart diseasein the detection and management of atherosclerosis as wellas the development of novel targeted anti-inflammatorytherapeutics.
Our data suggest that the DM/HC state may have resultedin increased expression of more inflammatory genes in theCORs compared with the AAs with functions important inactivated lymphocyte and macrophage functioning (CD97)and cytokine signaling (CHI3L1). Despite this, CORs devel-oped less severe lesions compared with the AAs. Thisdiscordance between plaque severity and inflammatoryresponse in the AAs was unexpected but corroboratespreviously published human data. Clinical studies have shownthat systemic inflammation defined by CRP levels is greater inpatients with COR atherosclerosis and evidence of plaquerupture, whereas the largest study to assess peripheral plaquerupture in the iliofemoral arteries showed no such associationwith CRP levels.15,16 By showing that AA lesion areacorrelates with levels of plasma glucose while COR lesionarea does not, it appears that disease severity in the AAs isdirectly related to hyperglycemia while in the CORs this is notthe case. A potential explanation is that the presence ofhyperglycemia indirectly drives atherosclerosis developmentand progression in the CORs via an effect on inflammation.Perhaps other potent risk factors for peripheral atheroscle-rosis not present in this study such as smoking are importantfor the link between inflammation and plaque severity inthe AAs.
The underlying mechanism causing these fundamentaldifferences in the development of atherosclerosis and thedifferential role of Lp-PLA2 in the inflammatory cascade
AA
DM/HC-Control (n=17)
DM/HC-darapladib (n=20)
p=0.069
%P
igs
with
fibr
oath
erom
a
0
50
100
75
25
COR
COR
DM/HC-Control (n=17)
DM/HC-darapladib (n=20)
p=0.04N
orm
aliz
ed P
laqu
e A
rea
0
1.0
2.0
1.5
0.5
AA
2.5
0.170.100.06
0.570.320.17
2.18
1.26
0.73
2.5
1.38
0.76
A
B
Figure 3. Inhibition of lipoprotein-associated phospholipase A2has site specific effects in an analysis comparing DM/HC controlpigs (n=17) to DM/HC darapladib pigs (n=20). A, Darapladib-induced attenuation of normalized plaque area was significantlygreater in the CORs by a factor of 2.9 compared with the AAs.Values represent the geometric means � 95% CIs. B, Darapladib-induced attenuation of fibroatheroma development trendedtoward a site-specific differential effect in the CORs comparedwith the AAs. All P values test for a significant interactionbetween the respective measure of darapladib treatment andvascular site. AA indicates abdominal aorta; COR, coronary artery;DM, diabetes mellitus; HC, hypercholesterolemia.
DOI: 10.1161/JAHA.114.001477 Journal of the American Heart Association 8
Site-Specific Plaque Development Fenning et alORIG
INALRESEARCH
by guest on May 4, 2018
http://jaha.ahajournals.org/D
ownloaded from

between the 2 sites is unclear but possibly relates todifferences in flow hemodynamics as well as embryologicorigin of the vasculature. Using a similar model, the Stonegroup has shown that local differences in endothelial shearstress in the coronary vasculature led to changes in inflam-matory gene expression and the development of thin fibrouscap atheromas. Areas of low endothelial shear stress in thecoronary vasculature, which typically occur at bifurcations orareas of curvature, are at increased risk of developing focalatherosclerotic lesions.17 These disturbances in laminar flowhave been shown to change expression profiles of endothelialcells in healthy pigs and correlate to areas of high susceptibilityto atherosclerosis.18 Other work has illustrated differences inwall shear stress based on the anatomic location of thevascular bed in reference to the distance from the aortic root aswell as the diameter of the blood vessels and the location ofbranching segments.19,20 As such, the local variation inhemodynamic forces and shear stress in the CORs and theAAs caused by differences in vessel diameter, tortuosity andbranching may account for some of the unique site-specificfeatures observed in this study. The embryologic origin ofsmooth muscle cells at different sites has also been shown toaffect the development of atherosclerosis and may relate tosome of the observed differences in this study. Haimovici et al
showed that a relatively atherosclerosis-resistant thoracicaorta transplanted to an atherosclerosis-susceptible distal AAlocation remains resistant to atherosclerosis. The atheroscle-rosis-susceptible distal AA transplanted to the thoracic aortawould still develop disease.21 In healthy Rapacz familialhypercholesterolemic swine, Bahls et al showed that athero-protected brachial arteries differ from the athero-susceptiblefemoral arteries in gene expression profiles despite similarpatterns of blood flow.22
Given these findings of fundamental differences inatherosclerotic plaque development between vascular sitesin DM/HC pigs with human-like lesions, similar observationsin human and animal studies can be better appreciated. Anautopsy study of 100 individuals comparing lesions at thecoronary, carotid, and superficial femoral arteries showedimportant histologic differences in plaque morphologybetween the sites.23 There is also evidence that geneexpression profiles of human carotid arteries, femoralarteries, and aortas vary significantly,24 and animal studieshave also shown that experimental COR atherosclerosis isassociated with more inflammatory gene expression than AAatherosclerosis.3,25 The present study supports findingsshowing the site-specific efficacy of novel targeted anti-inflammatory pharmacologic agents.26 These differences in
DM
/HC
con
trol
AA
DM
/HC
dar
apla
dib
AAMovats Cathepsin S MRI
500 um
500 um
500 um
500 um
10 um
10 um
DM
/HC
con
trol
CO
RD
M/H
C d
arap
ladi
b C
OR
500 um
500 um
Movats
Figure 4. Illustrative example of the lack of plaque attenuation in the AA from inhibition of lipoprotein-associated phospholipase A2 comparedwith a significant effect on plaque attenuation in the COR. Movat’s pentachrome staining of representative sections from a DM/HC control AAand a DM/HC darapladib AA reveals little effect of darapladib on lesion progression at this vascular site. Cathepsin S staining shows nosignificant effect of darapladib on macrophage plaque infiltration. MRI imaging confirms the findings found by histology. This is in contrast to therepresentative COR sections showing significantly less disease severity in the DM/HC darapladib coronary section compared with the DM/HCcontrol coronary section. AA indicates abdominal aorta; COR, coronary artery; DM/HC, diabetes/hypercholesterolemia.
DOI: 10.1161/JAHA.114.001477 Journal of the American Heart Association 9
Site-Specific Plaque Development Fenning et alORIG
INALRESEARCH
by guest on May 4, 2018
http://jaha.ahajournals.org/D
ownloaded from
variability of disease, plaque severity, gene expression, andresponse to targeted therapies are consistent with ourfindings in DM/HC pigs and may be explained by adifferential role of inflammatory pathways between vascularsites.
The present study lends insight into the mechanism ofdifferences between Lp-PLA2 associations with atheroscle-rosis in the CORs and AAs observed in human studies.While multiple epidemiologic studies show that Lp-PLA2 isindependently associated with risk of coronary heartdisease,27 several studies have also shown that Lp-PLA2levels do not correlate with the degree of atherosclerosis inthe AA. In the Rotterdam Study, the odds ratio of thepresence of aortic-iliac-femoral atherosclerosis according to
tertiles of Lp-PLA2 activity lost statistical significance afteradjusting for total cholesterol and HDL levels.28 In theVeterans Affairs Diabetes Trial, Lp-PLA2 mass after adjust-ment for standard risk factors predicted progression ofcoronary calcium on computed tomography (CT) but did notpredict progression of AA calcium.29 Similarly, in the DallasHeart Study, Lp-PLA2 mass was independently associatedwith COR calcium on CT but not AA plaque and aortic wallthickness on MRI.30 The Lp-PLA2 inhibitor rilapladib clini-cally showed no significant effect of treatment on FDG-PETuptake at the carotid and ascending aorta sites,31 and mostrecently, in a randomized clinical trial of darapladib in stablecoronary heart disease, there was a nominally significantreduction in the risk of 2 secondary composite end points
A
C
B
D
DM/HC control
Cumulative Total Plasma Glucose Level (mg/dL)
DM/HC control
Cumulative Total Plasma Glucose Level (mg/dL)
DM/HC control
Cumulative Total Plasma Cholesterol Level (mg/dL)
DM/HC control
Cumulative Total Plasma Cholesterol Level (mg/dL)
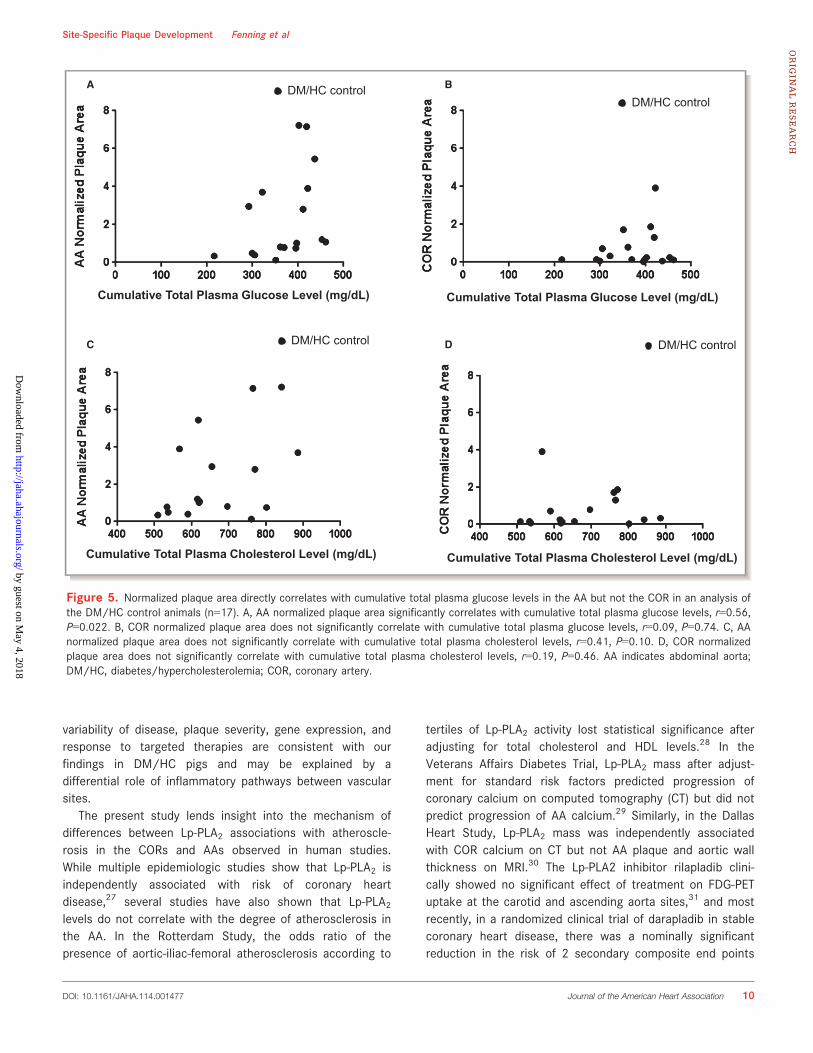
Figure 5. Normalized plaque area directly correlates with cumulative total plasma glucose levels in the AA but not the COR in an analysis ofthe DM/HC control animals (n=17). A, AA normalized plaque area significantly correlates with cumulative total plasma glucose levels, r=0.56,P=0.022. B, COR normalized plaque area does not significantly correlate with cumulative total plasma glucose levels, r=0.09, P=0.74. C, AAnormalized plaque area does not significantly correlate with cumulative total plasma cholesterol levels, r=0.41, P=0.10. D, COR normalizedplaque area does not significantly correlate with cumulative total plasma cholesterol levels, r=0.19, P=0.46. AA indicates abdominal aorta;DM/HC, diabetes/hypercholesterolemia; COR, coronary artery.
DOI: 10.1161/JAHA.114.001477 Journal of the American Heart Association 10
Site-Specific Plaque Development Fenning et alORIG
INALRESEARCH
by guest on May 4, 2018
http://jaha.ahajournals.org/D
ownloaded from

of major coronary events and total coronary events, whiledarapladib had no effect on stroke.8
These translational findings are relevant to several aspectsof atherosclerosis research. Because our findings predict thatnovel anti-inflammatory therapeutics targeting specific stepsin the inflammatory cascade32 may have differential site-specific efficacy, this work highlights the importance ofassessing drug responses at the vascular site of interest.Indeed, the use of surrogate end points such as carotidintima-media thickness33 to assess the efficacy of new drugsto prevent coronary events may not reflect the potentialtherapeutic effects at the targeted vascular site, againhighlighting the importance of assessing atherosclerosis inmultiple places.
There are potential limitations in this study. Several ofthese limitations relate to the gene expression comparisons.First, measuring gene expression of whole arteries preventsconclusions from being drawn about which specific celltypes are responsible for the findings. However, ourconclusions are based on the overall signal of inflammationwithin the arterial wall, which is ideally defined by geneexpression profiles. Unlike our previous publication assess-ing geneexpression in different vascular beds at differenttime points,3 this study looked at gene expression at asingle time point late in the development of advancedatherosclerosis and thus may miss the activation of genesimportant for earlier stages of lesion development. A furtherlimitation of the gene expression comparisons is the numberof separate genes evaluated. These multiple comparisonsmay result in a small number of unadjusted P-valueestimates occurring by chance rather than as an indicationof an unusual event. Additional limitations are associatedwith the translation of the study model to human disease.The type 1 diabetes mellitus model used in this study maynot be translatable to factors leading to atherosclerosisrelated to insulin resistance. Finally, a second phase IIIclinical trial testing darapladib in patients with a recentacute coronary syndrome did not find a benefit on reducingmajor coronary events,34 so these findings in pigs may nottranslate to humans.
In summary, despite the identical systemic exposure tohypercholesterolemia and hyperglycemia, the development ofatherosclerosis varies between vascular sites. By analyzingdifferences in plaque severity, gene expression profiles, andthe response to a targeted anti-inflammatory, there isevidence that inflammatory pathways using Lp-PLA2 may playa more significant role in COR atherosclerosis compared withAA atherosclerosis.
AcknowledgmentsWe acknowledge Harrilla Profka for his excellent animal husbandry.
Sources of FundingThese studies were funded by GlaxoSmithKline through anindustry-academic alliance via the Alternative Drug DiscoveryInitiative with the University of Pennsylvania School ofMedicine.
DisclosuresDrs Jucker, Lenhard, Burgert, and Macphee are employees ofGlaxoSmithKline. Drs Wilensky and Mohler have receivedfunding from GlaxoSmithKline. Drs Fenning, Peyster, Hama-mdzic, and Kangovi have no disclosures.
References1. DeBakey ME, Lawrie GM, Glaeser DH. Patterns of atherosclerosis and their
surgical significance. Ann Surg. 1985;201:115–131.
2. Criqui MH, Kamineni A, Allison MA, Ix JH, Carr JJ, Cushman M, Detrano R, PostW, Wong ND. Risk factor differences for aortic versus coronary calcifiedatherosclerosis: the multiethnic study of atherosclerosis. Arterioscler ThrombVasc Biol. 2010;30:2289–2296.
3. Mohler ER III, Sarov-Blat L, Shi Y, Hamamdzic D, Zalewski A, Macphee C, LlanoR, Pelchovitz D, Mainigi SK, Osman H, Hallman T, Steplewski K, Gertz Z, LuMM, Wilensky RL. Site-specific atherogenic gene expression correlates withsubsequent variable lesion development in coronary and peripheral vascula-ture. Arterioscler Thromb Vasc Biol. 2008;28:850–855.
4. Granada JF, Kaluza GL, Wilensky RL, Biedermann BC, Schwartz RS, Falk E.Porcine models of coronary atherosclerosis and vulnerable plaque for imagingand interventional research. EuroIntervention. 2009;5:140–148.
5. Macphee CH, Nelson JJ, Zalewski A. Lipoprotein-associated phospholipase A2as a target of therapy. Curr Opin Lipidol. 2005;16:442–446.
6. Shi Y, Zhang P, Zhang L, Osman H, Mohler ER III, Macphee C, Zalewski A,Postle A, Wilensky RL. Role of lipoprotein-associated phospholipase A2 inleukocyte activation and inflammatory responses. Atherosclerosis.2007;191:54–62.
7. Wilensky RL, Shi Y, Mohler ER III, Hamamdzic D, Burgert ME, Li J, Postle A,Fenning RS, Bollinger JG, Hoffman BE, Pelchovitz DJ, Yang J, Mirabile RC, WebbCL, Zhang L, Zhang P, Gelb MH, Walker MC, Zalewski A, Macphee CH.Inhibition of lipoprotein-associated phospholipase A2 reduces complexcoronary atherosclerotic plaque development. Nat Med. 2008;14:1059–1066.
8. The SI. Darapladib for preventing ischemic events in stable coronary heartdisease. N Engl J Med. 2014;370:1702–1711.
9. Virmani R, Kolodgie FD, Burke AP, Farb A, Schwartz SM. Lessons from suddencoronary death: a comprehensive morphological classification scheme foratherosclerotic lesions. Arterioscler Thromb Vasc Biol. 2000;20:1262–1275.
10. Papaspyridonos M, Smith A, Burnand KG, Taylor P, Padayachee S, Suckling KE,James CH, Greaves DR, Patel L. Novel candidate genes in unstable areas ofhuman atherosclerotic plaques. Arterioscler Thromb Vasc Biol. 2006;26:1837–1844.
11. Kwakkenbos MJ, Kop EN, Stacey M, Matmati M, Gordon S, Lin HH, Hamann J.The EGF-TM7 family: a postgenomic view. Immunogenetics. 2004;55:655–666.
12. Rathcke CN, Vestergaard H. YKL-40, a new inflammatory marker with relationto insulin resistance and with a role in endothelial dysfunction andatherosclerosis. Inflamm Res. 2006;55:221–227.
13. Zernecke A, Shagdarsuren E, Weber C. Chemokines in atherosclerosis: anupdate. Arterioscl Throm Vas. 2008;28:1897–1908.
14. Charo IF, Taubman MB. Chemokines in the pathogenesis of vascular disease.Circ Res. 2004;95:858–866.
15. Tanaka A, Shimada K, Sano T, Namba M, Sakamoto T, Nishida Y, Kawarabay-ashi T, Fukuda D, Yoshikawa J. Multiple plaque rupture and C-reactive proteinin acute myocardial infarction. J Am Coll Cardiol. 2005;45:1594–1599.
16. Okura H, Asawa K, Kubo T, Taguchi H, Toda I, Yoshiyama M, Yoshikawa J,Yoshida K. Incidence and predictors of plaque rupture in the peripheralarteries. Circ Cardiovasc Interv. 2010;3:63–70.
17. Chatzizisis YS, Jonas M, Coskun AU, Beigel R, Stone BV, Maynard C, GerrityRG, Daley W, Rogers C, Edelman ER, Feldman CL, Stone PH. Prediction of thelocalization of high-risk coronary atherosclerotic plaques on the basis of low
DOI: 10.1161/JAHA.114.001477 Journal of the American Heart Association 11
Site-Specific Plaque Development Fenning et alORIG
INALRESEARCH
by guest on May 4, 2018
http://jaha.ahajournals.org/D
ownloaded from

endothelial shear stress: an intravascular ultrasound and histopathologynatural history study. Circulation. 2008;117:993–1002.
18. Passerini AG, Polacek DC, Shi C, Francesco NM, Manduchi E, Grant GR,Pritchard WF, Powell S, Chang GY, Stoeckert CJ Jr, Davies PF. Coexistingproinflammatory and antioxidative endothelial transcription profiles in adisturbed flow region of the adult porcine aorta. Proc Natl Acad Sci USA.2004;101:2482–2487.
19. Cheng C, Helderman F, Tempel D, Segers D, Hierck B, Poelmann R, van Tol A,Duncker DJ, Robbers-Visser D, Ursem NT, van Haperen R, Wentzel JJ, Gijsen F,van der Steen AF, de Crom R, Krams R. Large variations in absolute wall shearstress levels within one species and between species. Atherosclerosis.2007;195:225–235.
20. Chatzizisis YS, Coskun AU, Jonas M, Edelman ER, Feldman CL, Stone PH. Roleof endothelial shear stress in the natural history of coronary atherosclerosisand vascular remodeling: molecular, cellular, and vascular behavior. J Am CollCardiol. 2007;49:2379–2393.
21. Haimovici H, Maier N. Fate of Aortic Homografts in Canine Atherosclerosis. 3.Study of Fresh Abdominal and Thoracic Aortic Implants into Thoracic Aorta:Role of Tissue Susceptibility in Atherogenesis. Arch Surg. 1964;89:961–969.
22. Bahls M, Bidwell CA, Hu J, Krueger CG, Reed JD, Tellez A, Kaluza GL, GranadaJF, Van Alstine WG, Newcomer SC. Gene expression differences in healthybrachial and femoral arteries of Rapacz familial hypercholesterolemic swine.Physiol Genomics. 2011;43:781–788.
23. Dalager S, Paaske WP, Kristensen IB, Laurberg JM, Falk E. Artery-relateddifferences in atherosclerosis expression: implications for atherogenesis anddynamics in intima-media thickness. Stroke. 2007;38:2698–2705.
24. Levula M, Oksala N, Airla N, Zeitlin R, Salenius JP, Jarvinen O, Venermo M, PartioT, Saarinen J, Somppi T, Suominen V, Virkkunen J, Hautalahti J, Laaksonen R,Kahonen M, Mennander A, Kytomaki L, Soini JT, Parkkinen J, Pelto-Huikko M,Lehtimaki T. Genes involved in systemic and arterial bed dependent athero-sclerosis–Tampere Vascular study. PLoS ONE. 2012;7:e33787.
25. Padilla J, Jenkins NT, Lee S, Zhang H, Cui J, Zuidema MY, Zhang C, Hill MA,Perfield JW II, Ibdah JA, Booth FW, Davis JW, Laughlin MH, Rector RS. Vasculartranscriptional alterations produced by juvenile obesity in Ossabaw swine.Physiol Genomics. 2013;45:434–446.
26. VanderLaan PA, Reardon CA, Getz GS. Site specificity of atherosclerosis: site-selective responses to atherosclerotic modulators. Arterioscler Thromb VascBiol. 2004;24:12–22.
27. Epps KC, Wilensky RL. Lp-PLA(2)- a novel risk factor for high-risk coronary andcarotid artery disease. J Intern Med. 2011;269:94–106.
28. Kardys I, Oei HH, van der Meer IM, Hofman A, Breteler MM, Witteman JC.Lipoprotein-associated phospholipase A2 and measures of extracoronaryatherosclerosis: the Rotterdam Study. Arterioscler Thromb Vasc Biol.2006;26:631–636.
29. Saremi A, Moritz TE, Anderson RJ, Abraira C, Duckworth WC, Reaven PD. Ratesand determinants of coronary and abdominal aortic artery calcium progressionin the Veterans Affairs Diabetes Trial (VADT). Diabetes Care. 2010;33:2642–2647.
30. Brilakis ES, Khera A, Saeed B, Banerjee S, McGuire DK, Murphy SA, de LemosJA. Association of lipoprotein-associated phospholipase A2 mass and activitywith coronary and aortic atherosclerosis: findings from the Dallas Heart Study.Clin Chem. 2008;54:1975–1981.
31. Tawakol A, Singh P, Rudd JH, Soffer J, Cai G, Vucic E, Brannan SP, Tarka EA,Shaddinger BC, Sarov-Blat L, Matthews P, Subramanian S, Farkouh M, FayadZA. Effect of Treatment for 12 weeks with Rilapladib, a Lipoprotein-associated Phospholipase A2 Inhibitor, on Arterial Inflammation as Assessedwith 18F-Fluorodeoxyglucose-PET Imaging. J Am Coll Cardiol. 2014;63:86–88.
32. Weber C, Noels H. Atherosclerosis: current pathogenesis and therapeuticoptions. Nat Med. 2011;17:1410–1422.
33. Crouse JR III, Raichlen JS, Riley WA, Evans GW, Palmer MK, O’Leary DH,Grobbee DE, Bots ML. Effect of rosuvastatin on progression of carotid intima-media thickness in low-risk individuals with subclinical atherosclerosis: theMETEOR Trial. JAMA. 2007;297:1344–1353.
34. O’Donoghue ML, Braunwald E, White HD, Steen DP, Lukas MA, Tarka E, StegPG, Hochman JS, Bode C, Maggioni AP, Im K, Shannon JB, Davies RY, MurphySA, Crugnale SE, Wiviott SD, Bonaca MP, Watson DF, Weaver WD, Serruys PW,Cannon CP; Investigators S-T. Effect of darapladib on major coronary eventsafter an acute coronary syndrome: the SOLID-TIMI 52 randomized clinical trial.JAMA. 2014;312:1006–1015.
DOI: 10.1161/JAHA.114.001477 Journal of the American Heart Association 12
Site-Specific Plaque Development Fenning et alORIG
INALRESEARCH
by guest on May 4, 2018
http://jaha.ahajournals.org/D
ownloaded from

SUPPLEMENTAL MATERIAL
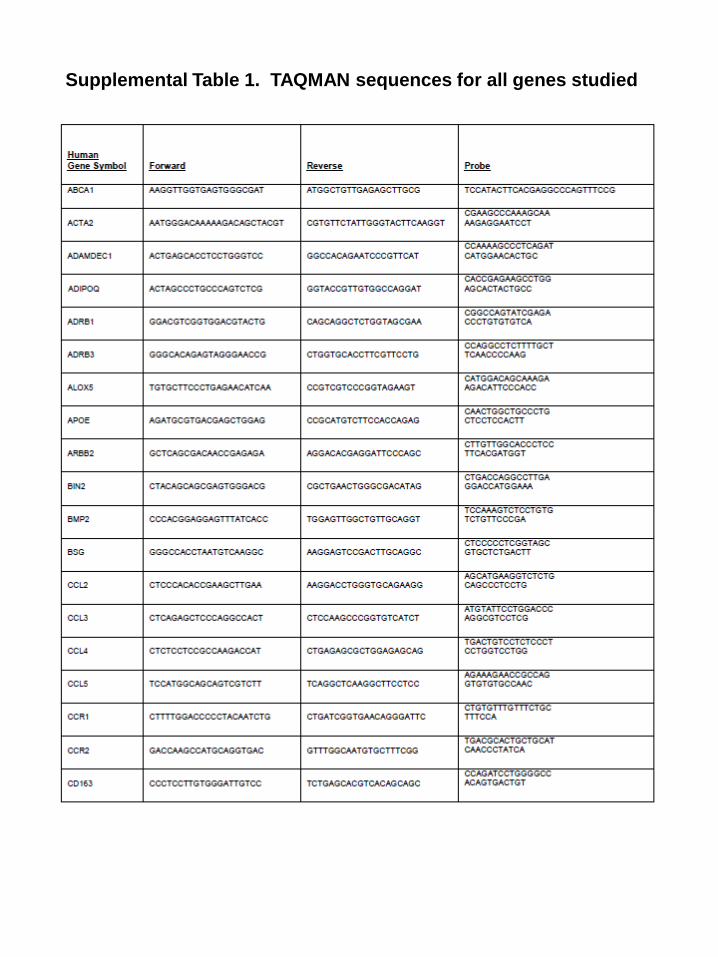
Supplemental Table 1. TAQMAN sequences for all genes studied


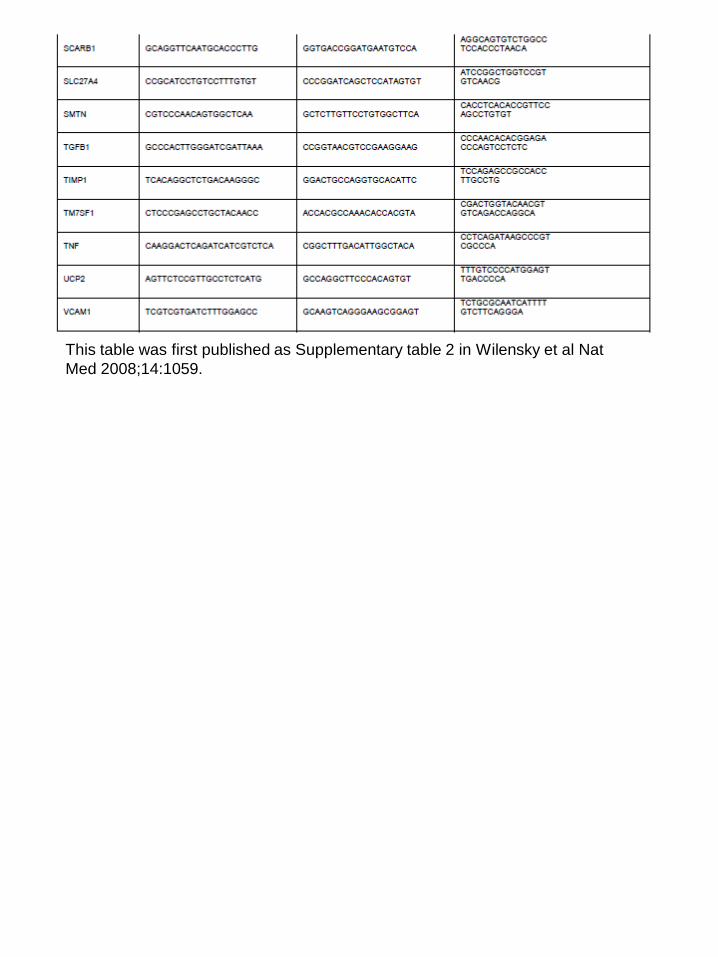
This table was first published as Supplementary table 2 in Wilensky et al Nat
Med 2008;14:1059.

Gene description
Human gene
symbol
Human
Entrez
GeneID
Vascular site
significantly
affected
Fold
change
COR
P value
COR
Fold
change
AA
P value
AA
Fold ratio
AA vs COR
P value AA
vs COR
ATP-binding cassette, subfamily A ,
member 1 ABCA1 19 Both 9.1 < 0.001 6.0 < 0.001 -1.5 0.249
Actin, alpha 2, smooth muscle, aorta ACTA2 59 AA -1.3 0.331 -2.0 0.008 -1.5 0.239
ADAM-like, decysin 1 ADAMDEC1 27299 COR 4.4 0.033 18.9 0.084 4.3 0.421
adiponectin, C1Q and collagen domain
containing ADIPOQ 9370 Neither 1.5 0.392 13.0 0.075 8.4 0.150
adrenergic, beta-1-, receptor ADRB1 153 Neither 1.3 0.641 1.3 0.558 1.0 0.957
adrenergic, beta-3-, receptor ADRB3 155 COR 6.8 0.003 4.3 0.091 -1.6 0.654
arachidonate 5- lipoxygenase ALOX5 240 Both 3.6 < 0.001 2.5 0.003 -1.5 0.248
apolipoprotein E APOE 348 Both 17.8 < 0.001 19.3 < 0.001 1.1 0.898
ß-arrestin 2 ARRB2 409 Both 3.0 < 0.001 2.0 0.011 -1.5 0.188
bridging integrator 2 BIN2 51411 Both 7.1 < 0.001 6.0 0.002 -1.2 0.758
bone morphogenetic protein 2 BMP2 650 Both 3.3 0.008 2.4 0.008 -1.4 0.540
basigin BSG 682 COR 1.7 0.024 1.1 0.463 -1.5 0.124
chemokine (C-C motif) ligand 2 CCL2 6347 COR 4.8 0.001 2.9 0.070 -1.7 0.280
chemokine (C-C motif) ligand 3 CCL3 6348 Both 2.5 0.014 4.6 0.003 1.9 0.205
chemokine (C-C motif) ligand 4 CCL4 6351 Both 3.1 0.002 2.4 0.038 -1.3 0.540
chemokine (C-C motif) ligand 5 CCL5 6352 Both 7.2 < 0.001 3.0 0.023 -2.4 0.051
chemokine (C-C motif) receptor 1 CCR1 1230 Both 11.2 0.004 10.0 0.003 -1.1 0.897
chemokine (C-C motif) receptor 2 CCR2 1231 Neither 2.0 0.066 1.2 0.634 -1.6 0.152
CD163 antigen CD163 9332 Both 4.8 < 0.001 3.2 0.009 -1.5 0.422
CD34 antigen CD34 947 Neither 1.1 0.812 -1.5 0.141 -1.6 0.182
CD36 antigen CD36 948 Both 4.5 < 0.001 11.8 < 0.001 2.6 0.081
CD4 antigen CD4 920 Both 25.1 < 0.001 10.3 < 0.001 -2.4 0.159
CD40 ligand CD40LG 959 COR 6.4 0.003 3.9 0.068 -1.6 0.589
CD48 antigen CD48 962 Both 19.7 < 0.001 15.5 < 0.001 -1.3 0.734
CD68 antigen CD68 968 Both 16.9 < 0.001 14.1 < 0.001 -1.2 0.798
CD83 antigen CD83 9308 Both 3.4 0.003 2.6 0.042 -1.3 0.586
CD97 antigen CD97 976 Differential 1.5 0.121 -1.5 0.025 -2.2 0.013
CCAAT/enhancer binding protein ,
alpha CEBPA 1050 Both 2.9 < 0.001 6.6 < 0.001 2.2 0.131
Complement factor D CFD 1675 Neither 1.1 0.665 1.5 0.156 1.4 0.314
chitinase 3-like 1 CHI3L1 1116 Differential 18.1 0.001 4.0 0.060 -4.5 0.042
cystatin A CSTA 1475 Neither 1.4 0.460 1.0 0.983 -1.4 0.668
cathepsin S CTSS 1520 Both 16.1 < 0.001 15.4 < 0.001 -1.0 0.949
chemokine (C-X3-C motif) receptor 1 CX3CR1 1524 Neither 2.6 0.062 1.7 0.272 -1.5 0.307
chemokine (C-X-C motif) ligand 12 CXCL12 6387 Neither 1.2 0.660 -1.0 0.984 -1.2 0.641
chemokine (C-X-C motif) ligand 16 CXCL16 58191 Both 3.3 < 0.001 1.8 0.050 -1.9 0.065
chemokine (C-X-C motif) receptor 3 CXCR3 2833 COR 4.1 0.010 3.2 0.082 -1.3 0.707
cytochrome b-245, beta polypeptide CYBB 1536 Both 19.8 < 0.001 13.9 < 0.001 -1.4 0.629
hypothetical protein FLJ22457 DENND2D 79961 Both 7.0 < 0.001 7.8 < 0.001 1.1 0.853
endothelin receptor type A EDNRA 1909 COR 2.2 0.033 1.4 0.155 -1.6 0.263
early growth response 1 EGR1 1958 Neither 1.6 0.321 -1.4 0.408 -2.1 0.215
ecotropic viral integration site 2A EVI2A 2123 Both 3.7 < 0.001 2.9 0.003 -1.3 0.535
ecotropic viral integration site 2B EVI2B 2124 Both 7.2 < 0.001 5.0 < 0.001 -1.4 0.479
Fas ligand FASLG 356 Both 7.2 < 0.001 3.1 0.019 -2.3 0.105
fatty acid synthase FASN 2194 COR 2.8 0.043 1.1 0.701 -2.5 0.067
GM2 ganglioside activator GM2A 2760 Both 5.4 < 0.001 3.0 0.021 -1.8 0.235
Major histocompatibility complex, class
II, DM alpha HLA-DMA 3108 Both 3.6 < 0.001 2.4 0.004 -1.5 0.195
heme oxygenase (decycling) 1 HMOX1 3162 Both 6.4 < 0.001 3.4 0.006 -1.9 0.196
heparan sulphate (glucosamine) 3-
Osulfotransferase 2 HS3ST2 9956 Both 9.5 0.013 5.4 0.007 -1.8 0.260
intercellular adhesion molecule 1 ICAM1 3383 COR 3.5 < 0.001 1.7 0.120 -2.1 0.052
insulin-like growth factor 1 receptor IGF1R 3480 AA 1.2 0.632 -1.7 0.014 -2.0 0.104
Supplemental Table 2. Influence of DM/HC induction on gene expression
for all genes in an analysis of the DM/HC control pigs (n=17)

Gene description
Human gene
symbol
Human
Entrez
GeneID
Vascular site
significantly
affected
Fold
change
COR
P value
COR
Fold
change
AA
P value
AA
Fold ratio
AA vs COR
P value AA
vs COR
interleukin 18 IL18 3606 Both 4.1 < 0.001 6.5 0.000 1.6 0.389
interleukin 1, beta IL1B 3553 COR 4.7 0.002 3.6 0.101 -1.3 0.691
Interleukin 1 receptor antagonist IL1RN 3557 Both 21.8 < 0.001 7.7 0.002 -2.8 0.084
interleukin 2 receptor, alpha IL2RA 3559 Both 6.0 0.005 2.6 0.012 -2.3 0.156
interleukin 6 IL6 3569 Both 2.5 0.007 3.9 0.006 1.5 0.276
interleukin 8 IL8 3576 Neither 3.9 0.055 3.1 0.105 -1.2 0.746
insulin receptor substrate 1 IRS1 3667 Differential 2.2 0.077 -1.2 0.358 -2.7 0.029
integrin, alpha M ITGAM 3684 Both 3.0 0.002 1.7 0.028 -1.8 0.128
integrin, beta 2 ITGB2 3689 Both 14.7 < 0.001 10.7 0.000 -1.4 0.631
leukocyte-associated Ig-like receptor 1 LAIR1 3903 Both 4.9 < 0.001 3.4 0.006 -1.4 0.380
leptin LEP 3952 AA 1.2 0.800 5.2 0.009 4.5 0.086
mesenchyme homeo box 2 MEOX2 4223 Neither 1.6 0.183 -1.1 0.750 -1.7 0.166
major facilitator superfamily domain
containing 1 MFSD1 64747 Differential 3.0 < 0.001 1.3 0.330 -2.3 0.021
matrix Gla protein MGP 4256 Neither -1.2 0.364 -1.2 0.470 1.0 0.927
Matrix metallopreteinase 9 MMP9 4318 Both 71.1 0.002 112.4 0.000 1.6 0.770
neutrophil cytosolic factor 1 (p47phox) NCF1 653361 Both 10.5 < 0.001 6.9 0.005 -1.5 0.544
N-acetylneuraminate pyruvate lyase NPL 80896 Both 10.7 < 0.001 12.2 0.000 1.1 0.837
plasminogen activator inhibitor type 1 PAI-1 5054 Neither -1.5 0.384 -1.8 0.278 -1.2 0.768
platelet/endothelial cell adhesion
molecule PECAM1 5175 COR 2.3 0.021 1.6 0.091 -1.5 0.268
phospholipase A2, group VII
PLA2G7 (Lp-
PLA2) 7941 Both 15.7 < 0.001 11.6 0.000 -1.4 0.619
plasminogen activator, urokinase
receptor PLAUR 5329 Both 6.7 < 0.001 3.2 0.001 -2.1 0.068
Peroxisome proliferative activated
receptor, alpha PPARA 5465 AA 1.1 0.878 -2.2 0.007 -2.4 0.052
Peroxisome proliferative activated
receptor, delta PPARD 5467 COR 2.8 0.002 1.4 0.221 -2.0 0.100
Peroxisome proliferative activated
receptor, gamma PPARG 5468 Differential 3.8 0.001 18.7 0.000 5.0 0.022
platelet-activating factor receptor PTAFR 5724 Both 5.8 < 0.001 3.8 0.003 -1.5 0.424
Prostaglandin-endoperoxide synthase 1 PTGS1 5742 Differential 2.4 0.050 -1.2 0.411 -3.0 0.015
Prostaglandin-endoperoxide synthase 2 PTGS2 5743 Neither 1.5 0.207 -1.2 0.717 -1.8 0.145
renal tumor antigen RAGE 5891 COR 3.2 0.036 1.3 0.355 -2.4 0.138
scavenger receptor class B, member 1 SCARB1 949 Both 7.3 < 0.001 3.6 0.003 -2.0 0.269
solute carrier family 27, member 4 SLC27A4 10999 Differential 3.2 < 0.001 1.4 0.154 -2.3 0.029
Smoothelin SMTN 6525 AA -1.2 0.638 -2.5 0.018 -2.1 0.109
transforming growth factor, beta 1 TGFB1 7040 Neither 1.6 0.096 1.0 0.911 -1.5 0.219
tissue inhibitor of metalloproteinase 1 TIMP1 7076 Differential 1.6 0.037 -1.1 0.586 -1.7 0.024
transmembrane 7 superfamily member 1 TM7SF1 7107 Both 3.5 0.006 2.3 0.002 -1.5 0.391
tumor necrosis factor TNF 7124 Both 2.1 0.005 2.7 0.005 1.3 0.443
uncoupling protein 2 UCP2 7351 Both 6.2 < 0.001 4.4 0.004 -1.4 0.520
vascular cell adhesion molecule 1 VCAM1 7412 Both 5.3 < 0.001 5.8 < 0.001 1.1 0.856

Gene description
Human gene
symbol
Human
Entrez
GeneID
Vascular site
significantly
affected
Fold
change
COR
P value
COR
Fold
change
AA
P value
AA
Fold ratio
AA vs COR
P value AA
vs COR
ATP-binding cassette, subfamily A
(ABC1), member 1 ABCA1 19 Neither -1.2 0.129 -1.2 0.340 1.1 0.696
Actin, alpha 2, smooth muscle, aorta ACTA2 59 AA 1.1 0.447 1.3 0.029 1.2 0.349
ADAM-like, decysin 1 ADAMDEC1 27299 Differential 1.2 0.622 -3.3 0.031 -3.9 0.040
adiponectin, C1Q and collagen domain
containing ADIPOQ 9370 Neither 1.2 0.509 -1.3 0.699 -1.6 0.543
adrenergic, beta-1-, receptor ADRB1 153 Neither 1.3 0.415 1.0 0.989 -1.3 0.480
adrenergic, beta-3-, receptor ADRB3 155 Neither -1.2 0.551 -1.0 0.999 1.2 0.655
arachidonate 5- lipoxygenase ALOX5 240 Neither -1.1 0.448 -1.2 0.333 -1.0 0.818
apolipoprotein E APOE 348 Neither -1.8 0.050 -1.3 0.363 1.4 0.353
ß-arrestin 2 ARRB2 409 COR -1.5 0.004 -1.3 0.080 1.1 0.454
bridging integrator 2 BIN2 51411 COR -1.8 0.008 -1.4 0.205 1.3 0.386
bone morphogenetic protein 2 BMP2 650 Neither 1.1 0.700 -1.2 0.222 -1.4 0.328
basigin BSG 682 Neither 1.0 0.774 -1.0 0.893 -1.0 0.740
chemokine (C-C motif) ligand 2 CCL2 6347 Neither -1.5 0.087 -1.6 0.139 -1.0 0.902
chemokine (C-C motif) ligand 3 CCL3 6348 Neither -1.3 0.192 -1.6 0.086 -1.2 0.459
chemokine (C-C motif) ligand 4 CCL4 6351 Neither -1.3 0.145 -1.2 0.442 1.1 0.619
chemokine (C-C motif) ligand 5 CCL5 6352 COR -1.5 0.037 -1.5 0.124 1.0 0.888
chemokine (C-C motif) receptor 1 CCR1 1230 Neither -1.7 0.216 -1.9 0.093 -1.1 0.795
chemokine (C-C motif) receptor 2 CCR2 1231 Differential -1.8 0.007 -1.2 0.479 1.5 0.032
CD163 antigen CD163 9332 Neither -1.4 0.143 -1.5 0.089 -1.1 0.761
CD34 antigen CD34 947 Neither 1.1 0.650 1.2 0.259 1.1 0.677
CD36 antigen CD36 948 AA -1.1 0.419 -1.6 0.039 -1.4 0.256
CD4 antigen CD4 920 Neither -1.4 0.101 -1.5 0.193 -1.0 0.886
CD40 ligand CD40LG 959 Neither -1.1 0.706 -1.1 0.742 1.0 0.988
CD48 antigen CD48 962 Neither -2.0 0.065 -1.8 0.076 1.1 0.785
CD68 antigen CD68 968 COR -1.8 0.037 -1.6 0.183 1.2 0.685
CD83 antigen CD83 9308 Neither -1.4 0.132 -1.3 0.305 1.1 0.788
CD97 antigen CD97 976 Neither -1.0 0.927 1.1 0.066 1.2 0.345
CCAAT/enhancer binding protein
(C/EBP), alpha CEBPA 1050 AA -1.2 0.202 -1.7 0.031 -1.4 0.252
Complement factor D CFD 1675 Neither 1.1 0.605 1.0 0.863 -1.0 0.826
chitinase 3-like 1 CHI3L1 1116 Neither -2.2 0.065 -1.8 0.115 1.2 0.644
cystatin A CSTA 1475 Neither 1.4 0.243 1.5 0.314 1.0 0.922
cathepsin S CTSS 1520 COR -2.0 0.019 -1.6 0.110 1.2 0.608
chemokine (C-X3-C motif) receptor 1 CX3CR1 1524 Neither -1.2 0.497 -1.0 0.871 1.2 0.541
chemokine (C-X-C motif) ligand 12 CXCL12 6387 Neither 1.1 0.777 1.2 0.222 1.1 0.540
chemokine (C-X-C motif) ligand 16 CXCL16 58191 COR -1.3 0.049 -1.3 0.113 -1.0 0.966
chemokine (C-X-C motif) receptor 3 CXCR3 2833 COR -2.1 0.014 -1.6 0.171 1.3 0.441
cytochrome b-245, beta polypeptide CYBB 1536 COR -2.1 0.020 -2.0 0.057 1.1 0.871
hypothetical protein FLJ22457 DENND2D 79961 COR -1.6 0.032 -1.6 0.092 1.0 0.994
endothelin receptor type A EDNRA 1909 Neither 1.1 0.657 -1.0 0.858 -1.1 0.645
early growth response 1 EGR1 1958 Neither -1.1 0.674 1.5 0.059 1.6 0.145
ecotropic viral integration site 2A EVI2A 2123 COR -1.4 0.037 -1.3 0.171 1.1 0.654
ecotropic viral integration site 2B EVI2B 2124 COR -1.6 0.040 -1.4 0.136 1.1 0.702
Fas ligand FASLG 356 Neither -1.5 0.062 -1.0 0.860 1.5 0.171
fatty acid synthase FASN 2194 Neither -1.5 0.145 -1.2 0.118 1.2 0.458
Supplemental Table 3. Influence of darapladib on gene expression for
all genes in an analysis comparing the DM/HC control pigs (n=17) with
the DM/HC darapladib pigs (n=20)

Gene description Human gene symbol
Human
Entrez
GeneID
Vascular site
significantly
affected
Fold
change
COR
P value
COR
Fold
change
AA
P value
AA
Fold ratio
AA vs COR
P value AA
vs COR
GM2 ganglioside activator GM2A 2760 COR -1.7 0.015 -1.4 0.212 1.2 0.422
Major histocompatibility complex,
class II, DM alpha HLA-DMA 3108 COR -1.4 0.007 -1.2 0.259 1.2 0.380
heme oxygenase (decycling) 1 HMOX1 3162 COR -1.6 0.032 -1.5 0.055 1.0 0.907
heparan sulphate (glucosamine) 3-
Osulfotransferase 2 HS3ST2 9956 Neither -1.7 0.231 -1.7 0.116 1.1 0.840
intercellular adhesion molecule 1 ICAM1 3383 Neither -1.2 0.122 -1.4 0.061 -1.1 0.495
insulin-like growth factor 1 receptor IGF1R 3480 Neither -1.0 0.840 1.2 0.174 1.2 0.417
interleukin 18 IL18 3606 AA -1.1 0.520 -1.6 0.032 -1.5 0.145
interleukin 1, beta IL1B 3553 Neither -1.4 0.184 -1.4 0.385 -1.0 0.972
Interleukin 1 receptor antagonist IL1RN 3557 COR -2.2 0.017 -1.6 0.144 1.3 0.355
interleukin 2 receptor, alpha IL2RA 3559 Neither -1.4 0.353 -1.2 0.434 1.2 0.626
interleukin 6 IL6 3569 Neither -1.2 0.280 -1.2 0.456 1.0 0.964
interleukin 8 IL8 3576 Neither -1.2 0.707 -1.8 0.105 -1.6 0.192
insulin receptor substrate 1 IRS1 3667 Neither 1.1 0.798 1.1 0.534 1.0 0.946
integrin, alpha M ITGAM 3684 Neither -1.3 0.171 -1.2 0.195 1.1 0.672
integrin, beta 2 ITGB2 3689 COR -2.0 0.025 -1.7 0.110 1.2 0.594
leukocyte-associated Ig-like
receptor 1 LAIR1 3903 COR -1.5 0.012 -1.3 0.235 1.2 0.490
leptin LEP 3952 Neither -1.0 0.966 -1.4 0.335 -1.3 0.524
mesenchyme homeo box 2 MEOX2 4223 AA 1.0 0.927 1.4 0.017 1.4 0.130
major facilitator superfamily
domain containing 1 MFSD1 64747 Neither -1.3 0.080 -1.3 0.092 -1.0 0.960
matrix Gla protein MGP 4256 Neither 1.1 0.426 1.1 0.281 1.0 0.741
Matrix metallopreteinase 9 MMP9 4318 Neither -3.3 0.102 -2.1 0.259 1.6 0.597
neutrophil cytosolic factor 1
(p47phox) NCF1 653361 COR -2.0 0.021 -1.6 0.166 1.2 0.593
N-acetylneuraminate pyruvate
lyase NPL 80896 COR -1.6 0.047 -1.7 0.061 -1.0 0.904
plasminogen activator inhibitor
type 1 PAI-1 5054 Neither 1.3 0.262 1.1 0.710 -1.1 0.674
platelet/endothelial cell adhesion
molecule PECAM1 5175 Neither 1.1 0.476 1.1 0.522 -1.1 0.796
phospholipase A2, group VII PLA2G7 (Lp-PLA2) 7941 COR -2.2 0.007 -1.8 0.065 1.2 0.600
plasminogen activator, urokinase
receptor PLAUR 5329 COR -1.5 0.026 -1.4 0.053 1.1 0.780
Peroxisome proliferative activated
receptor, alpha PPARA 5465 Neither 1.1 0.590 1.2 0.191 1.1 0.805
Peroxisome proliferative activated
receptor, delta PPARD 5467 Neither -1.3 0.123 -1.2 0.141 1.1 0.753
Peroxisome proliferative activated
receptor, gamma PPARG 5468 AA -1.2 0.359 -2.5 0.005 -2.0 0.060
platelet-activating factor receptor PTAFR 5724 COR -1.7 0.008 -1.3 0.290 1.3 0.306
Prostaglandin-endoperoxide
synthase 1 PTGS1 5742 AA -1.0 0.893 1.3 0.032 1.4 0.178
Prostaglandin-endoperoxide
synthase 2 PTGS2 5743 Neither 1.2 0.416 1.1 0.504 -1.0 0.954
renal tumor antigen RAGE 5891 Neither -1.1 0.647 1.1 0.739 1.2 0.552
scavenger receptor class B,
member 1 SCARB1 949 AA -1.4 0.150 -1.7 0.017 -1.2 0.579
solute carrier family 27, member 4 SLC27A4 10999 AA -1.4 0.051 -1.3 0.036 1.1 0.796

Gene description Human gene symbol
Human
Entrez
GeneID
Vascular site
significantly
affected
Fold
change
COR
P value
COR
Fold
change
AA
P value
AA
Fold ratio
AA vs COR
P value AA
vs COR
Smoothelin SMTN 6525 Neither 1.0 0.863 1.3 0.254 1.2 0.437
transforming growth factor, beta 1 TGFB1 7040 Neither -1.1 0.425 -1.1 0.242 -1.0 0.913
tissue inhibitor of metalloproteinase 1 TIMP1 7076 Neither -1.2 0.106 -1.0 0.753 1.2 0.193
transmembrane 7 superfamily
member 1 TM7SF1 7107 AA 1.0 0.888 -1.4 0.011 -1.5 0.081
tumor necrosis factor TNF 7124 -1.0 0.886 -1.3 0.161 -1.3 0.232
uncoupling protein 2 UCP2 7351 COR -1.8 0.025 -1.6 0.074 1.1 0.639
vascular cell adhesion molecule 1 VCAM1 7412 AA -1.1 0.692 -1.6 0.012 -1.5 0.094

Kangovi, Beat M. Jucker, Stephen C. Lenhard, Colin H. Macphee and Robert L. WilenskyRobert S. Fenning, Mark E. Burgert, Damir Hamamdzic, Eliot G. Peyster, Emile R. Mohler, Shreya
2Associated Phospholipase A−Response to Inhibition of Lipoprotein Atherosclerotic Plaque Inflammation Varies Between Vascular Sites and Correlates With
Online ISSN: 2047-9980 Dallas, TX 75231
is published by the American Heart Association, 7272 Greenville Avenue,Journal of the American Heart AssociationThe doi: 10.1161/JAHA.114.001477
2015;4:e001477; originally published February 11, 2015;J Am Heart Assoc.
http://jaha.ahajournals.org/content/4/2/e001477World Wide Web at:
The online version of this article, along with updated information and services, is located on the
http://jaha.ahajournals.org/content/suppl/2015/02/12/jah3843.DC1Data Supplement (unedited) at:
for more information. http://jaha.ahajournals.orgAccess publication. Visit the Journal at
is an online only OpenJournal of the American Heart AssociationSubscriptions, Permissions, and Reprints: The
by guest on May 4, 2018
http://jaha.ahajournals.org/D
ownloaded from

SUPPLEMENTAL MATERIAL

Supplemental Table 1. TAQMAN sequences for all genes studied


This table was first published as Supplementary table 2 in Wilensky et al Nat
Med 2008;14:1059.

Gene description
Human gene
symbol
Human
Entrez
GeneID
Vascular site
significantly
affected
Fold
change
COR
P value
COR
Fold
change
AA
P value
AA
Fold ratio
AA vs COR
P value AA
vs COR
ATP-binding cassette, subfamily A ,
member 1 ABCA1 19 Both 9.1 < 0.001 6.0 < 0.001 -1.5 0.249
Actin, alpha 2, smooth muscle, aorta ACTA2 59 AA -1.3 0.331 -2.0 0.008 -1.5 0.239
ADAM-like, decysin 1 ADAMDEC1 27299 COR 4.4 0.033 18.9 0.084 4.3 0.421
adiponectin, C1Q and collagen domain
containing ADIPOQ 9370 Neither 1.5 0.392 13.0 0.075 8.4 0.150
adrenergic, beta-1-, receptor ADRB1 153 Neither 1.3 0.641 1.3 0.558 1.0 0.957
adrenergic, beta-3-, receptor ADRB3 155 COR 6.8 0.003 4.3 0.091 -1.6 0.654
arachidonate 5- lipoxygenase ALOX5 240 Both 3.6 < 0.001 2.5 0.003 -1.5 0.248
apolipoprotein E APOE 348 Both 17.8 < 0.001 19.3 < 0.001 1.1 0.898
ß-arrestin 2 ARRB2 409 Both 3.0 < 0.001 2.0 0.011 -1.5 0.188
bridging integrator 2 BIN2 51411 Both 7.1 < 0.001 6.0 0.002 -1.2 0.758
bone morphogenetic protein 2 BMP2 650 Both 3.3 0.008 2.4 0.008 -1.4 0.540
basigin BSG 682 COR 1.7 0.024 1.1 0.463 -1.5 0.124
chemokine (C-C motif) ligand 2 CCL2 6347 COR 4.8 0.001 2.9 0.070 -1.7 0.280
chemokine (C-C motif) ligand 3 CCL3 6348 Both 2.5 0.014 4.6 0.003 1.9 0.205
chemokine (C-C motif) ligand 4 CCL4 6351 Both 3.1 0.002 2.4 0.038 -1.3 0.540
chemokine (C-C motif) ligand 5 CCL5 6352 Both 7.2 < 0.001 3.0 0.023 -2.4 0.051
chemokine (C-C motif) receptor 1 CCR1 1230 Both 11.2 0.004 10.0 0.003 -1.1 0.897
chemokine (C-C motif) receptor 2 CCR2 1231 Neither 2.0 0.066 1.2 0.634 -1.6 0.152
CD163 antigen CD163 9332 Both 4.8 < 0.001 3.2 0.009 -1.5 0.422
CD34 antigen CD34 947 Neither 1.1 0.812 -1.5 0.141 -1.6 0.182
CD36 antigen CD36 948 Both 4.5 < 0.001 11.8 < 0.001 2.6 0.081
CD4 antigen CD4 920 Both 25.1 < 0.001 10.3 < 0.001 -2.4 0.159
CD40 ligand CD40LG 959 COR 6.4 0.003 3.9 0.068 -1.6 0.589
CD48 antigen CD48 962 Both 19.7 < 0.001 15.5 < 0.001 -1.3 0.734
CD68 antigen CD68 968 Both 16.9 < 0.001 14.1 < 0.001 -1.2 0.798
CD83 antigen CD83 9308 Both 3.4 0.003 2.6 0.042 -1.3 0.586
CD97 antigen CD97 976 Differential 1.5 0.121 -1.5 0.025 -2.2 0.013
CCAAT/enhancer binding protein ,
alpha CEBPA 1050 Both 2.9 < 0.001 6.6 < 0.001 2.2 0.131
Complement factor D CFD 1675 Neither 1.1 0.665 1.5 0.156 1.4 0.314
chitinase 3-like 1 CHI3L1 1116 Differential 18.1 0.001 4.0 0.060 -4.5 0.042
cystatin A CSTA 1475 Neither 1.4 0.460 1.0 0.983 -1.4 0.668
cathepsin S CTSS 1520 Both 16.1 < 0.001 15.4 < 0.001 -1.0 0.949
chemokine (C-X3-C motif) receptor 1 CX3CR1 1524 Neither 2.6 0.062 1.7 0.272 -1.5 0.307
chemokine (C-X-C motif) ligand 12 CXCL12 6387 Neither 1.2 0.660 -1.0 0.984 -1.2 0.641
chemokine (C-X-C motif) ligand 16 CXCL16 58191 Both 3.3 < 0.001 1.8 0.050 -1.9 0.065
chemokine (C-X-C motif) receptor 3 CXCR3 2833 COR 4.1 0.010 3.2 0.082 -1.3 0.707
cytochrome b-245, beta polypeptide CYBB 1536 Both 19.8 < 0.001 13.9 < 0.001 -1.4 0.629
hypothetical protein FLJ22457 DENND2D 79961 Both 7.0 < 0.001 7.8 < 0.001 1.1 0.853
endothelin receptor type A EDNRA 1909 COR 2.2 0.033 1.4 0.155 -1.6 0.263
early growth response 1 EGR1 1958 Neither 1.6 0.321 -1.4 0.408 -2.1 0.215
ecotropic viral integration site 2A EVI2A 2123 Both 3.7 < 0.001 2.9 0.003 -1.3 0.535
ecotropic viral integration site 2B EVI2B 2124 Both 7.2 < 0.001 5.0 < 0.001 -1.4 0.479
Fas ligand FASLG 356 Both 7.2 < 0.001 3.1 0.019 -2.3 0.105
fatty acid synthase FASN 2194 COR 2.8 0.043 1.1 0.701 -2.5 0.067
GM2 ganglioside activator GM2A 2760 Both 5.4 < 0.001 3.0 0.021 -1.8 0.235
Major histocompatibility complex, class
II, DM alpha HLA-DMA 3108 Both 3.6 < 0.001 2.4 0.004 -1.5 0.195
heme oxygenase (decycling) 1 HMOX1 3162 Both 6.4 < 0.001 3.4 0.006 -1.9 0.196
heparan sulphate (glucosamine) 3-
Osulfotransferase 2 HS3ST2 9956 Both 9.5 0.013 5.4 0.007 -1.8 0.260
intercellular adhesion molecule 1 ICAM1 3383 COR 3.5 < 0.001 1.7 0.120 -2.1 0.052
insulin-like growth factor 1 receptor IGF1R 3480 AA 1.2 0.632 -1.7 0.014 -2.0 0.104
Supplemental Table 2. Influence of DM/HC induction on gene expression
for all genes in an analysis of the DM/HC control pigs (n=17)

Gene description
Human gene
symbol
Human
Entrez
GeneID
Vascular site
significantly
affected
Fold
change
COR
P value
COR
Fold
change
AA
P value
AA
Fold ratio
AA vs COR
P value AA
vs COR
interleukin 18 IL18 3606 Both 4.1 < 0.001 6.5 0.000 1.6 0.389
interleukin 1, beta IL1B 3553 COR 4.7 0.002 3.6 0.101 -1.3 0.691
Interleukin 1 receptor antagonist IL1RN 3557 Both 21.8 < 0.001 7.7 0.002 -2.8 0.084
interleukin 2 receptor, alpha IL2RA 3559 Both 6.0 0.005 2.6 0.012 -2.3 0.156
interleukin 6 IL6 3569 Both 2.5 0.007 3.9 0.006 1.5 0.276
interleukin 8 IL8 3576 Neither 3.9 0.055 3.1 0.105 -1.2 0.746
insulin receptor substrate 1 IRS1 3667 Differential 2.2 0.077 -1.2 0.358 -2.7 0.029
integrin, alpha M ITGAM 3684 Both 3.0 0.002 1.7 0.028 -1.8 0.128
integrin, beta 2 ITGB2 3689 Both 14.7 < 0.001 10.7 0.000 -1.4 0.631
leukocyte-associated Ig-like receptor 1 LAIR1 3903 Both 4.9 < 0.001 3.4 0.006 -1.4 0.380
leptin LEP 3952 AA 1.2 0.800 5.2 0.009 4.5 0.086
mesenchyme homeo box 2 MEOX2 4223 Neither 1.6 0.183 -1.1 0.750 -1.7 0.166
major facilitator superfamily domain
containing 1 MFSD1 64747 Differential 3.0 < 0.001 1.3 0.330 -2.3 0.021
matrix Gla protein MGP 4256 Neither -1.2 0.364 -1.2 0.470 1.0 0.927
Matrix metallopreteinase 9 MMP9 4318 Both 71.1 0.002 112.4 0.000 1.6 0.770
neutrophil cytosolic factor 1 (p47phox) NCF1 653361 Both 10.5 < 0.001 6.9 0.005 -1.5 0.544
N-acetylneuraminate pyruvate lyase NPL 80896 Both 10.7 < 0.001 12.2 0.000 1.1 0.837
plasminogen activator inhibitor type 1 PAI-1 5054 Neither -1.5 0.384 -1.8 0.278 -1.2 0.768
platelet/endothelial cell adhesion
molecule PECAM1 5175 COR 2.3 0.021 1.6 0.091 -1.5 0.268
phospholipase A2, group VII
PLA2G7 (Lp-
PLA2) 7941 Both 15.7 < 0.001 11.6 0.000 -1.4 0.619
plasminogen activator, urokinase
receptor PLAUR 5329 Both 6.7 < 0.001 3.2 0.001 -2.1 0.068
Peroxisome proliferative activated
receptor, alpha PPARA 5465 AA 1.1 0.878 -2.2 0.007 -2.4 0.052
Peroxisome proliferative activated
receptor, delta PPARD 5467 COR 2.8 0.002 1.4 0.221 -2.0 0.100
Peroxisome proliferative activated
receptor, gamma PPARG 5468 Differential 3.8 0.001 18.7 0.000 5.0 0.022
platelet-activating factor receptor PTAFR 5724 Both 5.8 < 0.001 3.8 0.003 -1.5 0.424
Prostaglandin-endoperoxide synthase 1 PTGS1 5742 Differential 2.4 0.050 -1.2 0.411 -3.0 0.015
Prostaglandin-endoperoxide synthase 2 PTGS2 5743 Neither 1.5 0.207 -1.2 0.717 -1.8 0.145
renal tumor antigen RAGE 5891 COR 3.2 0.036 1.3 0.355 -2.4 0.138
scavenger receptor class B, member 1 SCARB1 949 Both 7.3 < 0.001 3.6 0.003 -2.0 0.269
solute carrier family 27, member 4 SLC27A4 10999 Differential 3.2 < 0.001 1.4 0.154 -2.3 0.029
Smoothelin SMTN 6525 AA -1.2 0.638 -2.5 0.018 -2.1 0.109
transforming growth factor, beta 1 TGFB1 7040 Neither 1.6 0.096 1.0 0.911 -1.5 0.219
tissue inhibitor of metalloproteinase 1 TIMP1 7076 Differential 1.6 0.037 -1.1 0.586 -1.7 0.024
transmembrane 7 superfamily member 1 TM7SF1 7107 Both 3.5 0.006 2.3 0.002 -1.5 0.391
tumor necrosis factor TNF 7124 Both 2.1 0.005 2.7 0.005 1.3 0.443
uncoupling protein 2 UCP2 7351 Both 6.2 < 0.001 4.4 0.004 -1.4 0.520
vascular cell adhesion molecule 1 VCAM1 7412 Both 5.3 < 0.001 5.8 < 0.001 1.1 0.856

Gene description
Human gene
symbol
Human
Entrez
GeneID
Vascular site
significantly
affected
Fold
change
COR
P value
COR
Fold
change
AA
P value
AA
Fold ratio
AA vs COR
P value AA
vs COR
ATP-binding cassette, subfamily A
(ABC1), member 1 ABCA1 19 Neither -1.2 0.129 -1.2 0.340 1.1 0.696
Actin, alpha 2, smooth muscle, aorta ACTA2 59 AA 1.1 0.447 1.3 0.029 1.2 0.349
ADAM-like, decysin 1 ADAMDEC1 27299 Differential 1.2 0.622 -3.3 0.031 -3.9 0.040
adiponectin, C1Q and collagen domain
containing ADIPOQ 9370 Neither 1.2 0.509 -1.3 0.699 -1.6 0.543
adrenergic, beta-1-, receptor ADRB1 153 Neither 1.3 0.415 1.0 0.989 -1.3 0.480
adrenergic, beta-3-, receptor ADRB3 155 Neither -1.2 0.551 -1.0 0.999 1.2 0.655
arachidonate 5- lipoxygenase ALOX5 240 Neither -1.1 0.448 -1.2 0.333 -1.0 0.818
apolipoprotein E APOE 348 Neither -1.8 0.050 -1.3 0.363 1.4 0.353
ß-arrestin 2 ARRB2 409 COR -1.5 0.004 -1.3 0.080 1.1 0.454
bridging integrator 2 BIN2 51411 COR -1.8 0.008 -1.4 0.205 1.3 0.386
bone morphogenetic protein 2 BMP2 650 Neither 1.1 0.700 -1.2 0.222 -1.4 0.328
basigin BSG 682 Neither 1.0 0.774 -1.0 0.893 -1.0 0.740
chemokine (C-C motif) ligand 2 CCL2 6347 Neither -1.5 0.087 -1.6 0.139 -1.0 0.902
chemokine (C-C motif) ligand 3 CCL3 6348 Neither -1.3 0.192 -1.6 0.086 -1.2 0.459
chemokine (C-C motif) ligand 4 CCL4 6351 Neither -1.3 0.145 -1.2 0.442 1.1 0.619
chemokine (C-C motif) ligand 5 CCL5 6352 COR -1.5 0.037 -1.5 0.124 1.0 0.888
chemokine (C-C motif) receptor 1 CCR1 1230 Neither -1.7 0.216 -1.9 0.093 -1.1 0.795
chemokine (C-C motif) receptor 2 CCR2 1231 Differential -1.8 0.007 -1.2 0.479 1.5 0.032
CD163 antigen CD163 9332 Neither -1.4 0.143 -1.5 0.089 -1.1 0.761
CD34 antigen CD34 947 Neither 1.1 0.650 1.2 0.259 1.1 0.677
CD36 antigen CD36 948 AA -1.1 0.419 -1.6 0.039 -1.4 0.256
CD4 antigen CD4 920 Neither -1.4 0.101 -1.5 0.193 -1.0 0.886
CD40 ligand CD40LG 959 Neither -1.1 0.706 -1.1 0.742 1.0 0.988
CD48 antigen CD48 962 Neither -2.0 0.065 -1.8 0.076 1.1 0.785
CD68 antigen CD68 968 COR -1.8 0.037 -1.6 0.183 1.2 0.685
CD83 antigen CD83 9308 Neither -1.4 0.132 -1.3 0.305 1.1 0.788
CD97 antigen CD97 976 Neither -1.0 0.927 1.1 0.066 1.2 0.345
CCAAT/enhancer binding protein
(C/EBP), alpha CEBPA 1050 AA -1.2 0.202 -1.7 0.031 -1.4 0.252
Complement factor D CFD 1675 Neither 1.1 0.605 1.0 0.863 -1.0 0.826
chitinase 3-like 1 CHI3L1 1116 Neither -2.2 0.065 -1.8 0.115 1.2 0.644
cystatin A CSTA 1475 Neither 1.4 0.243 1.5 0.314 1.0 0.922
cathepsin S CTSS 1520 COR -2.0 0.019 -1.6 0.110 1.2 0.608
chemokine (C-X3-C motif) receptor 1 CX3CR1 1524 Neither -1.2 0.497 -1.0 0.871 1.2 0.541
chemokine (C-X-C motif) ligand 12 CXCL12 6387 Neither 1.1 0.777 1.2 0.222 1.1 0.540
chemokine (C-X-C motif) ligand 16 CXCL16 58191 COR -1.3 0.049 -1.3 0.113 -1.0 0.966
chemokine (C-X-C motif) receptor 3 CXCR3 2833 COR -2.1 0.014 -1.6 0.171 1.3 0.441
cytochrome b-245, beta polypeptide CYBB 1536 COR -2.1 0.020 -2.0 0.057 1.1 0.871
hypothetical protein FLJ22457 DENND2D 79961 COR -1.6 0.032 -1.6 0.092 1.0 0.994
endothelin receptor type A EDNRA 1909 Neither 1.1 0.657 -1.0 0.858 -1.1 0.645
early growth response 1 EGR1 1958 Neither -1.1 0.674 1.5 0.059 1.6 0.145
ecotropic viral integration site 2A EVI2A 2123 COR -1.4 0.037 -1.3 0.171 1.1 0.654
ecotropic viral integration site 2B EVI2B 2124 COR -1.6 0.040 -1.4 0.136 1.1 0.702
Fas ligand FASLG 356 Neither -1.5 0.062 -1.0 0.860 1.5 0.171
fatty acid synthase FASN 2194 Neither -1.5 0.145 -1.2 0.118 1.2 0.458
Supplemental Table 3. Influence of darapladib on gene expression for
all genes in an analysis comparing the DM/HC control pigs (n=17) with
the DM/HC darapladib pigs (n=20)

Gene description Human gene symbol
Human
Entrez
GeneID
Vascular site
significantly
affected
Fold
change
COR
P value
COR
Fold
change
AA
P value
AA
Fold ratio
AA vs COR
P value AA
vs COR
GM2 ganglioside activator GM2A 2760 COR -1.7 0.015 -1.4 0.212 1.2 0.422
Major histocompatibility complex,
class II, DM alpha HLA-DMA 3108 COR -1.4 0.007 -1.2 0.259 1.2 0.380
heme oxygenase (decycling) 1 HMOX1 3162 COR -1.6 0.032 -1.5 0.055 1.0 0.907
heparan sulphate (glucosamine) 3-
Osulfotransferase 2 HS3ST2 9956 Neither -1.7 0.231 -1.7 0.116 1.1 0.840
intercellular adhesion molecule 1 ICAM1 3383 Neither -1.2 0.122 -1.4 0.061 -1.1 0.495
insulin-like growth factor 1 receptor IGF1R 3480 Neither -1.0 0.840 1.2 0.174 1.2 0.417
interleukin 18 IL18 3606 AA -1.1 0.520 -1.6 0.032 -1.5 0.145
interleukin 1, beta IL1B 3553 Neither -1.4 0.184 -1.4 0.385 -1.0 0.972
Interleukin 1 receptor antagonist IL1RN 3557 COR -2.2 0.017 -1.6 0.144 1.3 0.355
interleukin 2 receptor, alpha IL2RA 3559 Neither -1.4 0.353 -1.2 0.434 1.2 0.626
interleukin 6 IL6 3569 Neither -1.2 0.280 -1.2 0.456 1.0 0.964
interleukin 8 IL8 3576 Neither -1.2 0.707 -1.8 0.105 -1.6 0.192
insulin receptor substrate 1 IRS1 3667 Neither 1.1 0.798 1.1 0.534 1.0 0.946
integrin, alpha M ITGAM 3684 Neither -1.3 0.171 -1.2 0.195 1.1 0.672
integrin, beta 2 ITGB2 3689 COR -2.0 0.025 -1.7 0.110 1.2 0.594
leukocyte-associated Ig-like
receptor 1 LAIR1 3903 COR -1.5 0.012 -1.3 0.235 1.2 0.490
leptin LEP 3952 Neither -1.0 0.966 -1.4 0.335 -1.3 0.524
mesenchyme homeo box 2 MEOX2 4223 AA 1.0 0.927 1.4 0.017 1.4 0.130
major facilitator superfamily
domain containing 1 MFSD1 64747 Neither -1.3 0.080 -1.3 0.092 -1.0 0.960
matrix Gla protein MGP 4256 Neither 1.1 0.426 1.1 0.281 1.0 0.741
Matrix metallopreteinase 9 MMP9 4318 Neither -3.3 0.102 -2.1 0.259 1.6 0.597
neutrophil cytosolic factor 1
(p47phox) NCF1 653361 COR -2.0 0.021 -1.6 0.166 1.2 0.593
N-acetylneuraminate pyruvate
lyase NPL 80896 COR -1.6 0.047 -1.7 0.061 -1.0 0.904
plasminogen activator inhibitor
type 1 PAI-1 5054 Neither 1.3 0.262 1.1 0.710 -1.1 0.674
platelet/endothelial cell adhesion
molecule PECAM1 5175 Neither 1.1 0.476 1.1 0.522 -1.1 0.796
phospholipase A2, group VII PLA2G7 (Lp-PLA2) 7941 COR -2.2 0.007 -1.8 0.065 1.2 0.600
plasminogen activator, urokinase
receptor PLAUR 5329 COR -1.5 0.026 -1.4 0.053 1.1 0.780
Peroxisome proliferative activated
receptor, alpha PPARA 5465 Neither 1.1 0.590 1.2 0.191 1.1 0.805
Peroxisome proliferative activated
receptor, delta PPARD 5467 Neither -1.3 0.123 -1.2 0.141 1.1 0.753
Peroxisome proliferative activated
receptor, gamma PPARG 5468 AA -1.2 0.359 -2.5 0.005 -2.0 0.060
platelet-activating factor receptor PTAFR 5724 COR -1.7 0.008 -1.3 0.290 1.3 0.306
Prostaglandin-endoperoxide
synthase 1 PTGS1 5742 AA -1.0 0.893 1.3 0.032 1.4 0.178
Prostaglandin-endoperoxide
synthase 2 PTGS2 5743 Neither 1.2 0.416 1.1 0.504 -1.0 0.954
renal tumor antigen RAGE 5891 Neither -1.1 0.647 1.1 0.739 1.2 0.552
scavenger receptor class B,
member 1 SCARB1 949 AA -1.4 0.150 -1.7 0.017 -1.2 0.579
solute carrier family 27, member 4 SLC27A4 10999 AA -1.4 0.051 -1.3 0.036 1.1 0.796

Gene description Human gene symbol
Human
Entrez
GeneID
Vascular site
significantly
affected
Fold
change
COR
P value
COR
Fold
change
AA
P value
AA
Fold ratio
AA vs COR
P value AA
vs COR
Smoothelin SMTN 6525 Neither 1.0 0.863 1.3 0.254 1.2 0.437
transforming growth factor, beta 1 TGFB1 7040 Neither -1.1 0.425 -1.1 0.242 -1.0 0.913
tissue inhibitor of metalloproteinase 1 TIMP1 7076 Neither -1.2 0.106 -1.0 0.753 1.2 0.193
transmembrane 7 superfamily
member 1 TM7SF1 7107 AA 1.0 0.888 -1.4 0.011 -1.5 0.081
tumor necrosis factor TNF 7124 -1.0 0.886 -1.3 0.161 -1.3 0.232
uncoupling protein 2 UCP2 7351 COR -1.8 0.025 -1.6 0.074 1.1 0.639
vascular cell adhesion molecule 1 VCAM1 7412 AA -1.1 0.692 -1.6 0.012 -1.5 0.094