full length research paper - international research journals · 2019-07-09 · confirmatory test...
TRANSCRIPT

Bacteriological quality and safety of green pepperand tomato irrigated with Abay River water in Bahir
Dar townDenekew Temesgen*, Mulugeta Kibret
Department of Biology, College of Science, Bahir Dar University, Ethiopia*Corresponding e-mail: [email protected]
ABSTRACT
The objective of this study was to determine the bacteriological quality and safety of green pepper (Capsicumannuum) and tomato (Lycopersicon esculentum) grown along Abay river of Bahir Dar town, Ethiopia. The meanaerobic mesophilic counts from tomato and green pepper were 4.72 and 5.01 respectively. The mean total coliformcounts from tomato was 234.9 MPN/g and green pepper 303.2 MPN/g. Similarly, the mean fecal coliform countsof tomato was 45.08 MPN/g and 58.1MPN/g from green pepper. The mean bacterial counts of green pepper werehigher than tomato vegetables. Moreover, 5 (8.3%) Salmonella, 3 (5%) Shigella spp. and 6 (10% ) E. coli spp.were isolated from tomato; and 6 (10%) Salmonella, 5 (8.3%) Shigella and 9 (15%) E. coli spp. were detectedfrom green pepper samples. The mean total coliform counts from Bezawit were 1040 MPN/100ml and711.67MPN/100ml Gudguad site. Similarly, the mean fecal coliform counts of Bezawit was 689.67MPN/100mland 390.00MPN/100ml from Gudguad. In both sites, lack of awareness and poor irrigation practice promote theprobability of vegetable contamination. Therefore, keeping the irrigation practice of irrigated vegetable andproviding regular training for farmers are some of the practices to improve bacteriological quality, safety and shelf-life of vegetables and their products.
Keywords: Tomato, green pepper, Abay river water, Irrigation practice, Bacterial quality
INTRODUCTION
Vegetables are important sources of vitamins, mineralsand antioxidants in human diets and also contributelarge quantities of vitamin C, but the vitamin’s highwater solubility and sensitivity to heat makes itsusceptible to loss during thermal preparation (Howardet al., 1999; Murcia et al., 2000). For this reason,consumption of minimally processed food or rawvegetables has been increased tremendously due totheir nutritive values in human dietary (Amoah, 2008).
Tomato (Lycopersicon esculentum) and Green pepper(Capsicum annuum) vegetables are largely consumedin raw, without further processing in most parts ofEthiopia. Although fresh produce can becomecontaminated at any time in the agri-food chain, pre-harvest contamination is considered the most likelyorigin. One important source of pathogens found onfresh produce is from faecally contaminated irrigationwater (De Roever, 1999). In many cases river water did
not meet international faecal guidelines for safeirrigation with Escherichia coli concentrationsexceeding 1000 cfu /100 ml. However many localgrowers resort to use this contaminated river water;due to lack of awareness of food safety, and lack ofpotable water used for irrigation of vegetables. Thus,the presence of these bacteria on these vegetables isdangerous for human consumption (Gemmell et al.,2013).
In Ethiopia, particularly in Bahir Dar town there is noinformation about the bacteriological quality of pre-harvest vegetables and irrigation water; and also nocontinuous assessment of vegetable safety has beendeveloped in the irrigated site along Abay river. Inaddition, farming practices of vegetables and Abay riverwater used for irrigation purpose are poor. Thesefactors may affect the bacteriological quality and safetyof vegetables which cause a serious health risks to theconsumers. Therefore, this study was undertaken to
Bacteriological quality and safety of green pepper and tomato irrigated with Abay River water inBahir Dar town Vol. 7(3) pp 14-24, December, 2018DOI: http:/dx.doi.org/10.14303/irjm.2018.029Available online http://www.interesjournals.org/IRJMCopyright ©2018 International Research Journals
Full Length Research Paper

evaluate the bacteriological quality and safety of greenpepper and tomato grown along Abay river.
MATERIALS AND METHODS
Sampling Techniques
Vegetables: A cross-sectional study was carried out ona total of 60 (30 tomato and 30 green pepper)vegetable samples were collected from eachpurposively selected farm sites (‘Bezawit’ and‘Gudguad’) of Bahir Dar town were taken fromDecember 2014 to April 2015 for bacteriologicalanalysis. From each selected sites, one kilogram ofvegetable samples; 500 g of tomato and green pepperwere purchased and collected aseptically beforeharvesting by using sterile surgical glove. The collectedsamples were then transported to MicrobiologyLaboratory in the icebox and then vegetable sampleswere analyzed within an hour of procurement. From thesamples, physically damaged and spoiled vegetableswere excluded in the study. Additional information onrisk factors of farming and sanitation practices ofvegetables were also taken from both sites by checklistat the same time.
Irrigation water: A total of 60 water samples, 30 fromeach (Bezawit and Gudguad) was collected frompurposively selected sites. 200 ml of water samplewere collected in sterile glass bottle from Abay riverfrom the source where the farmers drew and alsocollected according to the Germen standard (DIN,2010) between 7:00 am to 8:00 am. Water sampleswere kept in ice box and transported to the laboratorywithin an hour of collection to keep the normalconditions of the micro flora of samples. The analyseswere begun with in a maximum of four hours after thesample arrival at Microbiology Laboratory of Bahir DarUniversity.
Sample Preparation for Bacteriological Analysis
Bacteriological analysis of vegetable samples: Twentyfive gram of tomato and green pepper samples wereaseptically weighted from 500 g of each collectedsamples and homogenized in 225 ml of sterile 0.1%(w/v) buffered peptone water for 3 minutes. Ten-foldserial dilutions (10-2 to 10-4) were prepared fromhomogenized samples using 9ml sterile saline solutionblank as diluents. The homogenate was used toenumerate, isolate and characterize bacteria groupsfrom vegetable samples (Kiiyukia, 2003).
Enumeration of aerobic mesophilic bacteria: One ml ofhomogenized serial diluted sample from 10-2 to 10-4were pour plated on to plate count agar in triplicates,appropriately leveled Petri dishes. The plate wereallowed to solidify and incubated at 37°C for 24 hours.After incubation the petridishes containing 30 to 300
colonies were selected and counted using colonycounter and express as colony forming units per gram(FSSAI, 2012).
Enumeration of total and faecal coliforms
• Total coliforms: Three tube most-probable-number(MPN) method using lauryl tryptose broth was usedfor enumeration of total coliforms. One ml aliquotsfrom each dilution (102,103 and 10-4) wereaseptically transferred in to triplicate tubescontaining sterile lauryl tryptose broth (Oxoid Ltd,Basingstoke, Hampshire, England) with invertedDurham’s tubes. Incubation was done at 37°C for24 hours. Tubes showing gas and growth wereconsidered as presumptive positive for totalcoliforms. Then, a loop full of inoculum from allpresumptive-positive lauryl tryptose broth tubeswas inoculated into tubes which contained 10ml ofBrilliant Green Lactose Bile broth and incubated at
BGLB broth tubes were observed for gas formationin the Durham tubes. All positive BGLB broth tubeswere considered positive for coliform confirmation.The number of coliforms was estimated from MPNtable. For data analysis purposes, total coliformcounts that were less than the detection limit (<3.0MPN/g) were assigned 1.5 MPN/g, which is midwaybetween absence of colonies and the detection limit(FDA/CFSAN, 2001).
• Faecal coliforms: The same procedure as of totalcoliforms was carried out for fecal coliforms,triplicate tubes containing Lauryl Tryptose broth(Blulux Laboratorie Ltd, India) with inverted durhamtubes incubated at 44.5 for 24 hours. Then,confirmatory test for fecal coliforms was done usingMacConkey broth with inverted Durham tubes and
Confirmation was obtained by gas production. Theresult was reported as the most probable number(MPN) per gram of food (FDA/CFSAN, 2001).
Bacteriological analysis of Abay River water samples
• Enumeration of total and faecal coliforms: Fifteenculture tubes were used per sample; five tubescontained sterile 10 ml double strength and theremaining ten contained 10 ml single strengthLauryl tryptose broth (Blulux Laboratorie Ltd, India)with inverted Durham tubes. Each water samplewas shaken vigorously several times beforetransferring into broth to obtain a homogenousdispersion of microorganisms. With a sterile pipette,10 ml of the water sample was asepticallydispensed into each of the five culture tubescontaining the double strength Laurel tryptosebroth. One milliliter of the sample was theninoculated into each of the second five culturetubes and 0.1 ml inoculated into the remaining five
2 Int. Res. J. Microbiol.
37°C for 24 hours. Following incubation period,
°C
incubated at 44.5 for a maximu m of 24 hours.°C

tubes all containing sterile single strength Laureltryptose broth. The tubes were gently shock todistribute the sample uniformly throughout themedium and incubated at 37°C for 48 hours. After48 hours of incubation, the cultures were observedfor the presence of acid production (color changefrom reddish purple to yellow) or gas formation(displacement of medium from inverted Durhamtube). Tubes showing gas and growth will beconsidered as positive for total coliforms. Finallyresults reported as MPN/100 ml using MostProbable Number method.
The same procedure as total coliforms was also usedfor faecal coliforms with Laurel tryptose broth (BluluxLaboratorie Ltd, India) and inverted Durham tubes.Then the tubes were incubated at 44.5°C for 24 hours.Tubes showing growth and gases were considered aspositive for faecal coliforms. Finally results reported asMPN/100 ml using Most Probable Number method.
Isolation of pathogens from Green Pepper and Tomato
• Escherichia coli spp.: The procedure continued fromeach positive MacConkey broth used during faecalcoliforms detection, loop full of inoculum wasstreaked on Eosin Methylene Blue (EMB) agar usinga sterilized loop, and was incubated at 37°C for24hrs. Escherichia coli colonies were differentiatedby their characteristic green metallic sheen due tothe fermentation of lactose. Potential positiveplates were sub-cultured on nutrient agar platesand incubated at 37°C for 24 hrs. After incubationperiod, typical E. coli colony was streaked onTrypetic Soy Sgar (TSA) slant. The slant wasincubated at 37°C under aerobic atmosphere for 24hours. Finally the slant was maintained in 5°C forthe purpose of biochemical characterization.
• Salmonella and Shigella spp.: In the vegetablesamples, Salmonella and Shigella spp. may bepresent in low numbers in addition to othermicroorganisms, and they may be injured. Todiminish the risk of obtaining false negative results,pre-enrichment (peptone water) and selectiveenrichment (Selenite Cysteine broth) were used.The homogenized samples from surface of eachvegetables were incubated at 37°C for 24 hours forpre-enrichment. From each pre-enriched samples,one ml was transferred in to tubes containing 10 mlof Selenite Cysteine broth (HiMedia ltd, India) andthoroughly mixed for two minutes. Following mixingup, tubes were incubated at 37 for 24 hours
(FDA/CFSAN, 2001). A loop-full of inoculum wasaseptically taken from each incubated SeleniteCysteine broth and streaked onto Xylose Lysine
Deoxycholate agar (XLD) (Oxoid, England) forSalmonella and Shigella spp. MacConkey agar(Oxoid, England) was also used additionally forShigella, which were then incubated at 37°C for 24hours. Morphologically, pink colonies with orwithout black centers were assumed to bepresumptive Salmonella and red or pink colonieswere assumed to be presumptive Shigella on XLDagar but on MacConkey agar smooth colorless,opaque or transparent colonies were also assumedto be presumptive Shigella (FSSAI, 2012). Thepresumptive colonies from XLD agar wereaseptically picked and streaked on to nutrient agar(Don Whitley, India) for purification purpose andincubated at 37°C for 24 hours. Pure colonies werealso transferred aseptically in to Triptic Soya agar(TSA) (Don Whitley ltd, India) slants as stockcultures and stored in refrigerator at 4-5°C. Thepure cultures were then subjected to biochemicaltests like Citrate utilization test, Motility test, Indoletest, Lactose fermentation and H2S production test,Lysine Iron agar test and Urea hydrolysis test(Kiiyukia, 2003; FSSAI, 2012).
Data analysis: All the data were analyzed with SPSSversion 20.0 for Windows software. The significancebetween the values was evaluated at 95% confidencelevel. Statistical significance was set at P<0.05.Statistical analysis of the data from the two vegetableswas performed using T-test to test whether there is astatically significance difference between the twovegetables for microbial load. One way ANOVA was alsoused to compare mean bacterial count of vegetablesfrom different locations. The results obtained forcfu/gm of juices were transformed into log values.
RESULTS AND DISCUSSION
Aerobic Mesophilic Counts
In the present study, the mean value of tomato was4.72 log10 cfu/g and 5.01 log10 cfu/g wasdocumented in green pepper samples (Table1). Therewere statistically significant differences between themean AMC of Tomato fruit and green pepper surface(p=0.002). This could be due to tomato has a pH ofbelow 4 where most bacteria inhibited, which may havecontributed to the lower bacterial count. Hazardanalysis and critical control point total qualitymanagement (HACCP-TQM) technical guide line set themicrobial quality standard for raw foods where by thefood containing <4, 4.0-6.7, 6.7-7.7 and >7.7logcfu/gaerobic plate count rated as good, average, poor andspoiled food, respectively (Berger et al., 2010).
Temesgen et al. 3
°C

Vegetable type No. of samples Mean ± SD Minimum Maximum p- value
Tomato 60 4.72 ± 0.53 3.02 5.98 0.002
Green pepper 60 5.01 ± 0.47 3.5 6.37
SD= Standard deviation
Based on the above criteria, all the samples in thisstudy are categorized as good and average in itsmicrobial quality; however, there is need to safeguardthe health of the final consumers by proper washing ofthese products which are consumed in their raw forms.The finding of the result showed that, higher meancounts of aerobic mesophilic bacteria was recorded ingreen pepper (mean value of 5.14log10 cfu/g) and(mean value of 4.85 MPN/g), whereas, least value ofaerobic mesophilic counts was obtained in tomato(mean value of 4.74logcfu/g) and (mean value of4.64logcfu/g) in Bezawit and Gudguad sites,respectively.
Even though mean variation between sites, there wasno statistical significance difference of mean aerobicbacterial count in tomato (p=0.852). But statisticalsignificance difference of mean aerobic count wasobtained in green pepper (p=0.01) between sites(Figure 1).
Total Coliforms CountsThe present study demonstrated that total coliformcounts of tomato was a mean value of 234.9 MPN/gand green pepper was mean of 303.2 MPN/g (Table 1).Even though mean variation between vegetables, therewas no statistical significant deference in coliformcounts between vegetable types (p=0.252) (Table 2).
Table 2. Mean and range of total and faecal coliform bacteria (log10cfu/g) of irrigated tomato and green pepper with Abay river inBahir Dar town, 2015.
Vegetable type No. of samples Mean ± SD Minimum Maximum p- value
Tomato 60 234.9 ± 290.2 3 11000.25
Green pepper 60 303.2 ± 356.0 6.1 1100
SD= Standard deviation
The finding of the study also revealed that 38 (31.7%),69 (57.5 %) and 13 (10.8%) out of the total sampleshad level of coliform contamination categorized asgood, acceptable and unsatisfactory, respectively. Five(8.3%) of tomato and 8 (13.3%) of green peppersamples were above the accepted limit (≥ 1000MPN/g)(Table 3).
4 Int. Res. J. Microbiol.
Table 1. Mean and range of aerobic mesophillic bacteria (log10cfu/g) of irrigated tomato and green pepper with Abay river inBahir Dar town, 2015.
Figure 1. Aerobic mesophillic bacteria (log10 cfu/g) ofirrigated tomato and green pepper with Abay Riverbetween sites in Bahir Dar town, 2015.
Vegetable type Good Acceptable Unsatisfactory
Tomato 22 (36.7%) 33 (55%) 5 (8.3%)
Green pepper 16 (26.7%) 36 (60%) 8 (13.3%)
The mean values of total coliform counts of tomatosamples obtained from Bezawit and Gudguad sites
were 273.5 and 196.3 MPN/g, respectively whereasmean total coliforms in green pepper from the two siteswere 378.1 and 228.4 MPN/g, respectively
Figure 2. Total coliforms count (MPN/g) of irrigatedtomato and green pepper between the two sites in BahirDar town, Ethiopia, 2015.
Table 3. Level of Coliform contamination categorized as good,acceptable and unsatisfactory.

Faecal Coliforms Count
In the present study, the mean fecal coliforms count oftomato was 45.08 MPN/g and similarly green pepperwas 58.1MPN/g. Although mean variation betweenvegetable items, there was no statistical significantdifferences in mean fecal coliforms count betweenvegetables (p=0.097).
Table 4. Mean and range of fecal coliforms count (MPN/g) of irrigated tomato and green pepper in Bahir Dar town, 2015.
Vegetable type No. of samples Mean ± SD Minimum Maximum p- value
Tomato 60 45.08 ± 37.69 3 1600.1
Green pepper 60 58.10 ±47.35 3 240
NA= Not applicable
In which, the mean contamination of tomato by fecalcoliforms was obtained 56.6MPN/g and 38.7MPN/g inBezawit and Gudguad sites; whereas green pepper hadthe mean contamination of 70.87MPN/g and 51.76MPN/g in Bezawit and gudguad respectively (Figure 2).
Temesgen et al. 5
This study also revealed that the percentage of tomatoand green pepper contaminated by fecal coliformswere 13 (21.7%) and 7 (11.7%), categorized as goodand the remaining 47 (78.3%) tomato and 53 (88.3%)green pepper categorized as unsatisfactoryrespectively.
Table 5. The number and percentage of good and unsatisfactory level of fecal coliforms in irrigated tomato and green pepper inBahir Dar town, Ethiopia, 2015.
Vegetable type GoodNo (%)
AcceptableNo (%)
UnsatisfactoryNo (%)
Tomato 13 (21.7%) NA 47 (78.3%)
Green pepper 7 (11.7%) NA 53 (88.3%)
NA= Not applicable
Figure 3. Fecal coliforms count (MPN/g) of irrigatedtomato and green pepper between sites in Bahir Dar town,Ethiopia, 2015.
There were mean variation between study sites.However there was no statically significant differencein tomato (p=0.391) and green pepper (P=0.305)between sites (Table 4). Overall, the presence of faecalcoliforms in food particularly in irrigated tomato andgreen pepper is indicative of recent contamination andthere is a greater risk that pathogens may also bepresent (Table 5).
Pathogenic Bacteria in Tomato and Green Pepper
Total number of bacteria that were isolated from bothvegetable samples in Bezawit and Gudguad site wasdemonstrated below (Table 6). From each 60 vegetablesamples, Salmonella 5 (8.3%), Shigella 3 (5%) and E.coli 6 (10%); and Salmonella 6 (10%), Shigella 5 (8.3%)and E. coli 9 (15%) were detected from tomato andgreen pepper samples respectively.
Table 6. Frequency of occurrence of Salmonella, Shigella andE. coli isolates associated with irrigated tomato and greenpepper along Abay river in Bahir Dar town, 2015.
OrganismsVegetables
Tomato No (%) Green pepper No (%)
Salmonella spp. 5 (8.3) 6(10)
Shigella spp. 3 (5) 5(8.3)
Escherichia coli 6 (10) 9(15)
Total 14 (23.3) 20 (33.3)
Total number of bacteria that were isolated from bothvegetable samples in Bezawit and Gudguad site wasdemonstrated below (Figure 3).
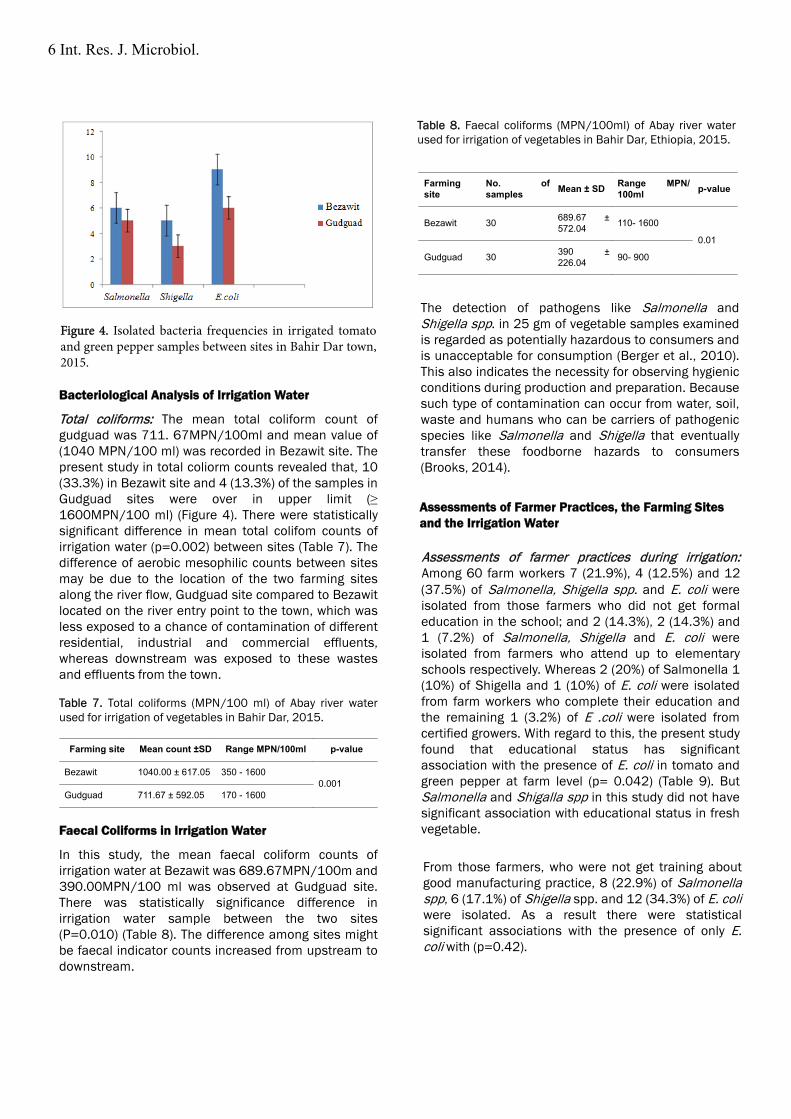
Figure 4. Isolated bacteria frequencies in irrigated tomatoand green pepper samples between sites in Bahir Dar town,2015.
Bacteriological Analysis of Irrigation Water
Total coliforms: The mean total coliform count ofgudguad was 711. 67MPN/100ml and mean value of(1040 MPN/100 ml) was recorded in Bezawit site. Thepresent study in total coliorm counts revealed that, 10(33.3%) in Bezawit site and 4 (13.3%) of the samples inGudguad sites were over in upper limit (≥1600MPN/100 ml) (Figure 4). There were statisticallysignificant difference in mean total colifom counts ofirrigation water (p=0.002) between sites (Table 7). Thedifference of aerobic mesophilic counts between sitesmay be due to the location of the two farming sitesalong the river flow, Gudguad site compared to Bezawitlocated on the river entry point to the town, which wasless exposed to a chance of contamination of differentresidential, industrial and commercial effluents,whereas downstream was exposed to these wastesand effluents from the town.
Table 7. Total coliforms (MPN/100 ml) of Abay river waterused for irrigation of vegetables in Bahir Dar, 2015.
Farming site Mean count ±SD Range MPN/100ml p-value
Bezawit 1040.00 ± 617.05 350 - 16000.001
Gudguad 711.67 ± 592.05 170 - 1600
Faecal Coliforms in Irrigation Water
In this study, the mean faecal coliform counts ofirrigation water at Bezawit was 689.67MPN/100m and390.00MPN/100 ml was observed at Gudguad site.There was statistically significance difference inirrigation water sample between the two sites(P=0.010) (Table 8). The difference among sites mightbe faecal indicator counts increased from upstream todownstream.
6 Int. Res. J. Microbiol.
Farmingsite
No. ofsamples Mean ± SD Range MPN/
100ml p-value
Bezawit 30 689.67 ±572.04 110- 1600
0.01
Gudguad 30 390 ±226.04 90- 900
The detection of pathogens like Salmonella andShigella spp. in 25 gm of vegetable samples examinedis regarded as potentially hazardous to consumers andis unacceptable for consumption (Berger et al., 2010).This also indicates the necessity for observing hygienicconditions during production and preparation. Becausesuch type of contamination can occur from water, soil,waste and humans who can be carriers of pathogenicspecies like Salmonella and Shigella that eventuallytransfer these foodborne hazards to consumers(Brooks, 2014).
Assessments of Farmer Practices, the Farming Sitesand the Irrigation Water
Assessments of farmer practices during irrigation:Among 60 farm workers 7 (21.9%), 4 (12.5%) and 12(37.5%) of Salmonella, Shigella spp. and E. coli wereisolated from those farmers who did not get formaleducation in the school; and 2 (14.3%), 2 (14.3%) and1 (7.2%) of Salmonella, Shigella and E. coli wereisolated from farmers who attend up to elementaryschools respectively. Whereas 2 (20%) of Salmonella 1(10%) of Shigella and 1 (10%) of E. coli were isolatedfrom farm workers who complete their education andthe remaining 1 (3.2%) of E .coli were isolated fromcertified growers. With regard to this, the present studyfound that educational status has significantassociation with the presence of E. coli in tomato andgreen pepper at farm level (p= 0.042) (Table 9). ButSalmonella and Shigalla spp in this study did not havesignificant association with educational status in freshvegetable.
From those farmers, who were not get training aboutgood manufacturing practice, 8 (22.9%) of Salmonellaspp, 6 (17.1%) of Shigella spp. and 12 (34.3%) of E. coliwere isolated. As a result there were statisticalsignificant associations with the presence of only E.coli with (p=0.42).
Table 8. Faecal coliforms (MPN/100ml) of Abay river waterused for irrigation of vegetables in Bahir Dar, Ethiopia, 2015.

Table 9. Association between farming practice with isolation of Salmonella, Shigella and E. coli from tomato and green pepperalong Abay river in Bahir Dar town, 2015.
Parameter Frequency (%)
Salmonella spp. Shigella spp. E. coli
PositiveNo (%)
NegativeNo (%)
PositiveNo (%)
NegativeNo (%)
PositiveNo (%)
NegativeNo (%)
Educational status
No schooling 32 (53.3) 7 (21.9) 25 (78.1) 4 (12.5) 28 (87.5) 12(37.5) 20 (62.5)
Elementary 14 (23.3) 2 (14.3) 12 (85.7) 2 (14.3) 12 (85.7) 1(7.2) 13(92.8)
High school 10(16.7) 2 (20) 8 (80) 1 (10) 9(90) 1 (10) 9 (90)
Graduated 4(6.7) 0 4 (100) 0 4 (100) 1 3 (75)
Special clothing
Yes 9 (15) 3 (33.3) 6 (67.7) 2 (22) 7 (78) 3 (33.3) 6 (67.7)
No 51 (85) 8 (15.6) 43 (84.4) 6 (11.8) 45 (88.2) 12 (23.5) 39 (76.5)
Farming experience
Yes 44(73.3) 7(15.9) 37(84.1) 5(11.4) 39(88.6) 10(22.7) 34(77.3)
No 16(26.7) 4(25) 12(75) 3(18.8) 13(81.2) 6(37.5) 10(62.5)
Training on irrigation
Yes 25(41.7) 3 (12) 22 ( 88) 2 (8) 23 (92) 3 (12) 22 (88)
No 35(58.3) 8 (22.9) 27 (77.1) 6 (17.1) 29 (82.9) 12 (34.3) 23 (65.7)
Means to control contamination
Yes 7 (11.7) 2 (28.6) 5 (71.4) 1 (14.2) 6 (85.8) 2 (28.6) 5 (71.4)
No 53(88.3) 9 (17) 44 (83) 7 (13.2) 46 (86.8) 14 (26.4) 39 (73.6)
Temesgen et al. 7
Table 10. Association between sanitation practice of farms with isolation of Salmonella, Shigella and E. coli from tomato andgreen pepper along Abay river in Bahir Dar town, 2015.
Parameter Frequency (%)
Salmonella spp. Shigella spp. E. coli
Positive Negative Positive Negative Positive Negative
No (%) No (%) No (%) No (%) No (%) No (%)
Manure application
Yes 32(53.3) 9 (28.1) 23(71.9) 4 (12.5) 28 (87.5) 12 (37.5) 20 (62.5)
No 28(46.7) 2 (7.1) 26(92.9) 5 (17.8) 23 (86.2) 3 (10.7) 25 (89.3)
Time of irrigation
Morning 56(93.3) 11 (19.7) 45 (80.3) 7 (12.5) 49 (87.5) 13 (23.2) 43 (71.7)
Afternoon 4(6.7) 0 4 (100) 1 (25) 3 (75) 2(50) 2(50)
Type of irrigationproduction system
Sole cropping 11(18.3) 2 (18.2) 7 (81.8) 2 (18.2) 9 (81.9) 4 (36.4) 7 (63.6)
Mixing 49(81.7) 9(18.4) 40(81.6) 6(12.2) 43 (87.8) 11 (22.4) 38 (77.6)
Hand contact with fresh produce
Yes 60(100%) 11 (18.3) 49(81.7%) 8 (13.7%) 52 (86.3%) 15 (25%) 45 (75%)
No 000 000 000 000 000 000 000

Assessment of the sanitation practice of farms that isused for irrigation purpose: In the present study 9(28.1%) of Salmonella spp. 3 (10.8%) of Shigella and12 (37.5%) of E. coli were isolated from those farmersused manure as a fertilizer and the remaining 2 (7.1%)of Salmonella 5 (17.3%) of Shigella and 3 (10.3%) of
and E. coli were isolated from farmers that were notused manure as a fertilizer. As a result, Manureapplication had statistically significant association withthe presence of Salmonella and E. coli in tomato andgreen pepper samples grown along Abay river with (P=0.036) and (p= 0.017), respectively (Table 10).
General characteristics of attributes for the quality ofirrigation water: In this study, 8 (29.7.6%) ofSalmonella, 7 (26%) of Shigella and 14 (51.8%) of E.coli were isolated from tomato and green pepperirrigated with water sources had a chance ofcontamination of feces and urine. With regarded to thisthe present study found that contamination of fecesand urine with irrigation water has statisticallysignificant association with the presence of Salmonella(p=0.04), Shigella (p=0.02) and E. coli (p= 0.001) intomato and green pepper samples grown along Abayriver (Table 11).
Regarding to the system of irrigation, 7 (36%) ofShigella and 11 (57.9%) of E. coli were isolated fromthose vegetable grown with surface irrigation system,whereas 1 (4.3%) of Shigella spp. and 2 (8.6%) of E. coliwere isolated from those used other than surfaceirrigation system (Table 10). There was significantassociation between the presences of Shigella spp.(p=(0.03) and E. coli (p=0.00) with the system ofirrigation of tomato and green pepper grown along Abayriver (Table 11).
8 Int. Res. J. Microbiol.
Table 11. Association between sanitation of irrigation water with isolation of Salmonella, Shigella and E. coli from tomato andgreen pepper along Abay river in Bahir Dar town, 2015.
Parameter Frequency (%)
Salmonella spp. Shigella spp. E. coli
Positive Negative Positive Negative Positive Negative
No (%) No (%) No (%) No (%) No (%) No (%)
Conatmination with feces
Yes 27 (71.7) 8 (17.6) 18 (82.4) 7 (13.7) 20 (86.3) 13 (25.5) 14 (74.5)
No 33 (28.3) 3 (22) 30 (88) 1 (11) 21 (89) 2 (22.2) 29 (77.8)
Waste disposal to river sites
Yes 38 (63.3) 6 (15.8) 32 (84.2) 5 (13.2) 33 (86.8) 9 (23.7) 29(76.3)
No 22 (36.7) 5 (22.7) 16 (81.3) 3 (13.6) 19 (86.4) 6 (27.3) 16 (72.7)
System of irrigation
Surface 19 (31.6) 5 (26.3) 13 (74.7) 7 (36.8) 12 (63.2) 11 (57.9) 8 (42.1)
On the Soil 41 (68.4) 6 (14.6) 35 (85.4) 1 (2.4) 39 (97.6) 4 (21.1) 37(88.9)
Access of animal Irrigation water
Yes 14 (23.3) 4 (28.6) 10 (72.4) 3 (21.4) 11 (78.6) 6 (42.9) 8 (57.1)
No 46 (68.3) 7 (15.2) 39 (84.8) 5 (10.9) 41 (89.1) 10 (21.7) 36 (78.3)
CONCLUSION
The finding revealed that all the samples werecontaminated with one or more indicator bacteria(aerobic mesophilic bacteria, total and faecalcoliforms). The majority of tomato and green peppersamples were at satisfactory level in case of aerobicmesophilic bacteria and total coliforms, but almost alltomato and green pepper samples were contaminatedwith faecal coliforms exceeded level for the maximumrang allowable. The use of polluted irrigation water andfresh animal manure may account for the high levels of
fecal coliform contamination recorded in most of theanalysed vegetable samples. In addition to this, E. coli,Salmonella and Shigella were also isolated fromirrigated samples. So, farm owners that producevegetables should be aware that preventativemeasures through food safety control strategies isimportant. Education level may not have relationshipsfor the level of pathogens in the produce. Further studyshould be recommended after harvest at market leveltogether with isolation of other pathogens.

REFERENCES
Howard LA, Wong AD, Perry AK, Klein BP (1999).Beta-carotene and ascorbic acid retention in fresh andprocessed vegetables. J Food Sci. 64(5):929-936.Murcia MA, Lo´pez-Ayerra B, Martinez-Tome M,Vera AM, Garcı´a-Carmona F (2000). Evolution ofascorbic acid and peroxidase during industrialprocessing of broccoli. J Agri Food Sys.80:1882-1886.Amoah P (2008). Wastewater Irrigated VegetableProduction. PhD thesis Contamination pathway forhealth risk reduction in Accra, Kumasi, Ghana.De Roever C (1999). Microbiological safetyevaluations and recommendations on fresh produce. JFood Control 9:321-347.Gemmell ME, Schmidt S (2013). Is themicrobiological quality of the Msunduzi River(KwaZulu-Natal, South Africa) suitable for domestic,recreational, and agricultural purposes? J Environ SciPollution Res. 20:6551–6562.DIN (2010). German standard methods for theexamination of water, waste water and sludge -General information (group A) - Part 15: Samplingfrom running waters (A 15), Germany.FDA/CFSAN (2001). Production practices as riskfactors in microbial food safety of fresh andfreshcutproduce,(accessed on April 15, 2007).
Kiiyukia C (2003). Laboratory Manual of FoodMicrobiology for Ethiopian Health and NutritionResearch Institute. UNIDO Project, Ethiopia.
FSSAI (2012). Manual of Methods of Analysis ofFoods. Microbiological Testing. New Delhi, India.
Public Health Laboratory Service (2000). Guidelinesfor the bacteriological quality of ready to eat foodsMicrobial Quality of Ready-to-Eat Foods Available tosample at the point of sale, Communicable Diseasesand Public Health 3(3):163-167.
World Health Organisation (2006). WHO guidelinesfor the safe use of wastewater, excreta and greywater:Volume II, Wastewater use in agriculture, pp1–176,Geneva, Switzerland.
Berger CN, Sodha SV, Shaw RK, Griffin PM, DavidPink D, Hand P, Frankel G (2010). Fresh Fruit andVegetables as Vehicles for the Transmission of HumanPathogens. Environmental Microbiology 12(9):2385-2397.
Brooks AA (2014). Evaluation of MicrobialContamination of Street-Vended Fruit Salad inCalabar, Nigeria. International Journal of CurrentMicrobiology and Applied Sciences 3(7):1040-1046.
Temesgen et al. 9