full legal disclaimer - sprucepointcap.com · 3 about spruce point capital management absent...
TRANSCRIPT

1
2
Full Legal Disclaimer
This research presentation expresses our research opinions. You should assume that as of the publication date of any presentation, report or letter, Spruce Point Capital Management LLC (possibly along with or through our members, partners, affiliates, employees, and/or consultants) along with our subscribers and clients has a short position in all stocks (and are long/short combinations of puts and calls on the stock) covered herein, including without limitation Mercury Systems, Inc. (“MRCY”), and therefore stand to realize significant gains in the event that the price of its stock declines. Following publication of any presentation, report or letter, we intend to continue transacting in the securities covered therein, and we may be long, short, or neutral at any time hereafter regardless of our initial recommendation. All expressions of opinion are subject to change without notice, and Spruce Point Capital Management does not undertake to update this report or any information contained herein. Spruce Point Capital Management, subscribers and/or consultants shall have no obligation to inform any investor or viewer of this report about their historical, current, and future trading activities.
This research presentation expresses our research opinions, which we have based upon interpretation of certain facts and observations, all of which are based upon publicly available information, and all of which are set out in this research presentation. Any investment involves substantial risks, including complete loss of capital. Any forecasts or estimates are for illustrative purpose only and should not be taken as limitations of the maximum possible loss or gain. Any information contained in this report may include forward looking statements, expectations, pro forma analyses, estimates, and projections. You should assume these types of statements, expectations, pro forma analyses, estimates, and projections may turn out to be incorrect for reasons beyond Spruce Point Capital Management LLC’s control. This is not investment or accounting advice nor should it be construed as such. Use of Spruce Point Capital Management LLC’s research is at your own risk. You should do your own research and due diligence, with assistance from professional financial, legal and tax experts, before making any investment decision with respect to securities covered herein. All figures assumed to be in US Dollars, unless specified otherwise.
To the best of our ability and belief, as of the date hereof, all information contained herein is accurate and reliable and does not omit to state material facts necessary to make the statements herein not misleading, and all information has been obtained from public sources we believe to be accurate and reliable, and who are not insiders or connected persons of the stock covered herein or who may otherwise owe any fiduciary duty or duty of confidentiality to the issuer, or to any other person or entity that was breached by the transmission of information to Spruce Point Capital Management LLC. However, Spruce Point Capital Management LLC recognizes that there may be non-public information in the possession of MRCY or other insiders of MRCY that has not been publicly disclosed by MRCY. Therefore, such information contained herein is presented “as is,” without warranty of any kind – whether express or implied. Spruce Point Capital Management LLC makes no other representations, express or implied, as to the accuracy, timeliness, or completeness of any such information or with regard to the results to be obtained from its use.
This report’s estimated fundamental value only represents a best efforts estimate of the potential fundamental valuation of a specific security, and is not expressed as, or implied as, assessments of the quality of a security, a summary of past performance, or an actionable investment strategy for an investor. This is not an offer to sell or a solicitation of an offer to buy any security, nor shall any security be offered or sold to any person, in any jurisdiction in which such offer would be unlawful under the securities laws of such jurisdiction. Spruce Point Capital Management LLC is not registered as an investment advisor, broker/dealer, or accounting firm.
All rights reserved. This document may not be reproduced or disseminated in whole or in part without the prior written consent of Spruce Point Capital Management LLC.

3
About Spruce Point Capital Management
Absent sufficient explanations from Mercury’s CEO about its connection to the SEWIP cost overrun allegations, and its inability to generate free cash flow growth in the past three years while claiming 112% Adj. EBITDA growth, we believe the
CEO of Mercury should resign, just like its CFO, Chief Accounting Officer and Treasurer did in Sept 2017 and Feb 2018.
Report Date Company / Ticker Enterprise Value At Report Date ($ billions) CEO Departure / Date
7/13/17 Gentex / GNTX $4.7 Fred Bauer / Jan 2018
4/13/16 Sabre Corp / SABR $11.2 Tom Klein / June 2016
12/17/15 Intertain / IT.TO $1.5 John FitzGerald / Feb 2016
8/19/15 Caesarstone / CSTE $1.7 Yos Shiran / May 2016
2/10/15 Greif / GEF $3.2 David Fischer / Oct 2015
11/13/14 AMETEK / AME $14.0 Frank Hermance / May 2016
1/15/14 LKQ Corp / LKQ $11.8 Robert Wagman / March 2017
3/5/13 Boulder Brands / BDBD $1.0 Stephen Hughes / June 2015
6/14/12 Bazaarvoice / BV $1.2 Bret Hurt / Nov 2012
CEO Departures Post Recent Spruce Point Research Activism
Spruce Point Capital Is An Industry Recognized Research Activist Investment Firm Founded In 2009• Founded by Ben Axler, a former investment banker with 17 years experience on Wall Street• Ranked the #1 Short-Seller in the world by Sumzero after a comprehensive study of 12,000 analyst
recommendations dating back to 2008 (March 2015)• Ranked the #13 Most Influential FinTweeter on Twitter according to Sentieo analysis (Dec 2016)

Executive Summary

5
Spruce Point Believes Mercury Systems (Nasdaq: MRCY) Is A “Strong Sell”
Newly Declassified DoD Inspector General Report Validates Problems At SEWIP Block 3, Mercury’s Material Business Program: • Three of seven allegations against SEWIP 3 prime Northrop Grumman related to cost overruns have been validated by investigators,
and two other allegations have been partially validated. Material cost overruns may suggest sales overstatement at Mercury• Mercury talked about SEWIP Block 3 adding >$140m of revenues and that it is a material driver of its results. Mercury has warned that
the loss of SEWIP would have a Material Adverse Effect on its business. We find material inconsistencies between management statements and SEC disclosures on recent SEWIP revenue contributions
• Management enacted a 10b5-1 stock sale program in August 2017 (not disclosed until Oct 2017), ahead of the Inspector General audit report in Nov 2017
Mercury appears to be caught in the perfect storm of slowing growth, rising costs and debt. There are multiple material adverse changes currently facing Mercury which suggest 50% to 85% downside risk ($7 to $23 per share).
Numerous High Level Signs That Mercury Is Under Extreme Financial Pressures:
• Mercury’s Adj. EBITDA margins of 23.4% are extremely high for a government subcontractor, and have grown 450bps in the last three fiscal years, allowing Adj. EBITDA to balloon 112% while its free cash flow grew zero over the same period. Free cash flow is now trending down over the last 12 months. Days inventory and its cash collection cycle are near all-time highs; accounts receivables recently started to exceed sales
• Management’s annual cash bonuses are based solely on Adj. EBITDA, providing material incentive to inflate this financial metric• Historically, radar systems is Mercury’s largest business, but now appears to be declining, while “Other Revenues” is the fastest
growing segment. Mercury changed its financial presentation to bolster gross margins, while guidance for gross margins has quietly been talked down. For the first time in Q2’18, Mercury missed its gross margin (and EPS) target
• Mercury uses three different accounting methods for sales, but appears to be moving towards greater use of complex, subjective methods tied to percentage of completion accounting, an area notorious for accounting issues in the Aerospace & Defense industry
• Mercury sells itself as growing revenues organically 9.5% (double its end markets), yet we find evidence these results are not sustainable and growth may slow to 6.5% in CY 2018. Mercury announced the purchase of Themis Computer on Dec 21, 2017 (four days ahead of Christmas). It paid a rich 13.7x EBITDA multiple, and borrowed $189m on its line of credit. In our opinion, the deal appears motivated to avoid missing Wall Street’s expectations. Consistent with prior practice, we expect Mercury to issue stock to pay down its line of credit, which at the current share price, amounts to 4m new shares
• Mercury added one sentence to its latest 10-K to disclose it expects to lose its Small Business status in FY 2018, a factor that will cause a Material Adverse Effect by disqualifying it from certain business opportunities and increasing costs of compliance

6
Spruce Point Believes Sees 50% To 85% Downside Risk To Mercury’s Shares
Mercury’s Fmr. CFO Was EVP Strategic Affairs, Chief Legal Officer, and Secretary At Cabletron/Enterasys Networks A Business Fraud
• Mercury recently moved its headquarters into the exact same office where the Cabletron/Enterasys fraud unfolded
• Mercury’s long-time CFO Gerald Haines omits from his biography that he was the Chief Legal Officer and Secretary at Cabletron, making him a named executive and Board member. He abruptly resigned from Mercury in Feb 2018 after the closing of the Themis deal. Four of his colleagues at Cabletron were sentenced to prison, but Haines was not implicated
• In Sept 2017, Mercury’s Chief Accounting Officer and Treasurer also abruptly resigned. Shortly before, and for the first time, Mercury’s proxy statement revealed a new anonymous hotline, email and website for reporting accounting concerns
• In Aug 2017, subtle changes to executive severance agreements were made to define conditions for termination for “Cause” and called out “Fraud” and “Dishonesty”
• Mercury’s audit fees per $ of sales and employee are the highest in the Aerospace & Defense industry, adding to our concerns of potential issues. The Audit Committee is chaired by William O’Brien, a colleague of the CEO dating back to 2003
Analysts See 25% Upside In Mercury, But Miss Key Material Risks, And Take Results At Face Value. We See 50% - 85% Downside:
• Mercury lacks meaningful institutional support from fundamental owners. Many have been decreasing ownership over time, while passive index buyers accumulate Mercury for its exposure to the Aerospace & Defense industry
• Mercury’s 2018E valuation of 4.7x, 19.3x and 31.5x sales, Adj. EBITDA and Adj. EPS is the highest in the Aerospace & Defense industry for peers over $1.5bn in value, and its multiple is stretched near all-time highs. Analysts assume its financials are fairly stated, and that it can achieve 16% and 10% sales and EPS growth in CY 2018. However, with issues at SEWIP, loss of its SmallBusiness status, and the recent acquisition of Themis, we estimate actual organic growth is set to decline significantly in CY 2018
• Mercury’s leverage should come into focus for investors. Having borrowed nearly $190m on its line of credit, and expanded itsoperations to materially increase its operating leases, we estimate Net Debt / Adj EBITDAR of 1.5x. However, investors are better served looking at its debt load relative to its thin free cash flow. We estimate Net Debt / Free cash flow of 7.7x
• Given our accounting concerns that Adj. EBITDA is not reflecting Mercury’s underlying economics, we believe Mercury should bevalued on its stagnant free cash flow, which at a 20x-25x multiple, justifies 75% - 85% downside. Alternatively, taking sales at face value and applying a normal multiple to reflect its reduced organic growth, we arrive at 50% - 75% downside

7
$0.00
$10.00
$20.00
$30.00
$40.00
$50.00
$60.00
1/2/2015 7/2/2015 1/2/2016 7/2/2016 1/2/2017 7/2/2017 1/2/2018
Mercury’s Share Price Appreciation Merits Significant Scrutiny
Sept 2017: Proxy statement includes new reference for methods of reporting anonymous accounting concernsSept 2017: Chief Accounting Officer And Treasurer Charles Speicher resigns
Aug 18, 2017: 10-K filed adds sentence suggesting small business status to be lost in FY 2018
Aug 8, 2017: Later disclosed in October Form 4, the CEO entered into a 10b5-1 stock sale program
Aug 31, 2017: Later disclosed in October that the CFO entered into a 10b5-1 stock sale program
FY14: Adopts clawback policy for financial misstatement before aggressive acquisition spree
Feb 2018: Closes acquisition of Themis, borrows $195m and CFO Gerald Haines abruptly resigns
Jan 2017: Raises FY17 guidance againJan 2017: Receives first in series of SEC comment lettersFeb 2017: Issues 6.9m shares @ $31.34/shApril 2017: Acquires Delta Microwave for $40.5m
April 2016: Issues 5.2m shares @ $18.24/sh
May 2016: Acquires Microsemi business for $300m. Lifts tgt. EBITDA margin 400bps
Oct 2016: Raises FY17 guidanceNov 2016: Acquires CES for $38mNov 2016: Discloses first COGS to R&D cost reclassification
Aug 2016: Q4 realigns reporting, stops disclosing Mercury Commercial Electronics and Defense Systems segments
Nov 2017: DoD Office of Inspector General releases report responding to anonymous allegations of cost overruns on SEWIP 3, a major Mercury program
Aug 14, 2017: 10-K notes changes to severance terms for the CEO and other executives (ITEM 9B)
Spruce Point has identified too many red flags as it relates to Mercury’s meteoric 230%+ share price appreciation since 2015. Its significant EBITDA
growth without corresponding cash flow growth should be evaluated relative to abrupt executive departures, insider selling, and a federal gov’t investigation of SEWIP, a material program to Mercury’s financial results
June 2017: Amends Credit Agreement, Inc. to $400m

8
Capital Structure and Valuation
Mercury is currently borrowing on its credit facility to fund the acquisition of Themis Computer, which closed on February 1, 2018. Consistent with prior deal funding practices, we expect the Company to issue equity, which would dilute investors with
4 million new shares. Our report will illustrate that Mercury’s valuation is the highest in the Aerospace & Defense industry on the belief that its industry leading Adjusted EBITDA margins are fairly stated, and its organic growth can continue at high single, low double digits per management’s comments. Our critical forensic analysis will suggest otherwise. We think investors should focus
on its free cash flow, which is trending down, while its leverage is rising meaningfully.
$ in mm, except per share figures
Source: Company financials and Wall St. Research EstimatesNote: Figures Calendarized for Dec 31st year end. Mercury FY ends June 30th
1) Pro forma for Themis Computer acquisition (source)2) Estimated below long-term trend of 9.5%3) Mercury significantly increased its reported operating leases from $43.3m to $70.2m between June 30th and Dec 31, 2017, which we discount at
3%. We estimate incremental rent expense $1.8m (including $0.8m for Themis)
Street Valuation (CY) 2017A 2018E 2019EEV / Sales 5.3x 4.7x 4.1x
Stock Price $46.00 EV / Adj. EBITDA 22.6x 19.4x 16.8xShares Outstanding 48.2 Price / Adj. EPS 36.4x 31.5x 28.6xMarket Capitalization $2,219.2 Price / Book 3.0x --$400m Credit Facility due 2022 (1) $188.9 Growth and Margins 2017A 2018E 2019ETotal Debt Outstanding $188.9 Sales Growth 31.7% 12.1% 16.2%Less: Cash and Equivalents (1) $40.9 SP Est. Organic Growth (2) N/A 6.5% --Enterprise Value $2,367.1 Adj. EBITDA Margin 23.4% 24.4% 24.2%
Free Cash Flow Margin 5.5% 5.5% --Adj. EPS Growth 19.9% 15.4% 10.3%
Operating Leases (3) Credit Metrics 2017A 2018E 2019EAdd: PV of Operating Leases $61.2 Net Debt / Adj. EBITDA -- 1.2x 1.1xAdjusted Debt $250.1 Adj Net Debt / Adj. EBITDAR 1.5x 1.5x
Net Debt / SP Est. Free Cash Flow -- 5.4x 5.4xAdj. Net Debt / SP Est. Free Cash Flow -- 7.7x 7.7x
9
Mercury’s Now $190m In Debt And Beholden To Its Creditors
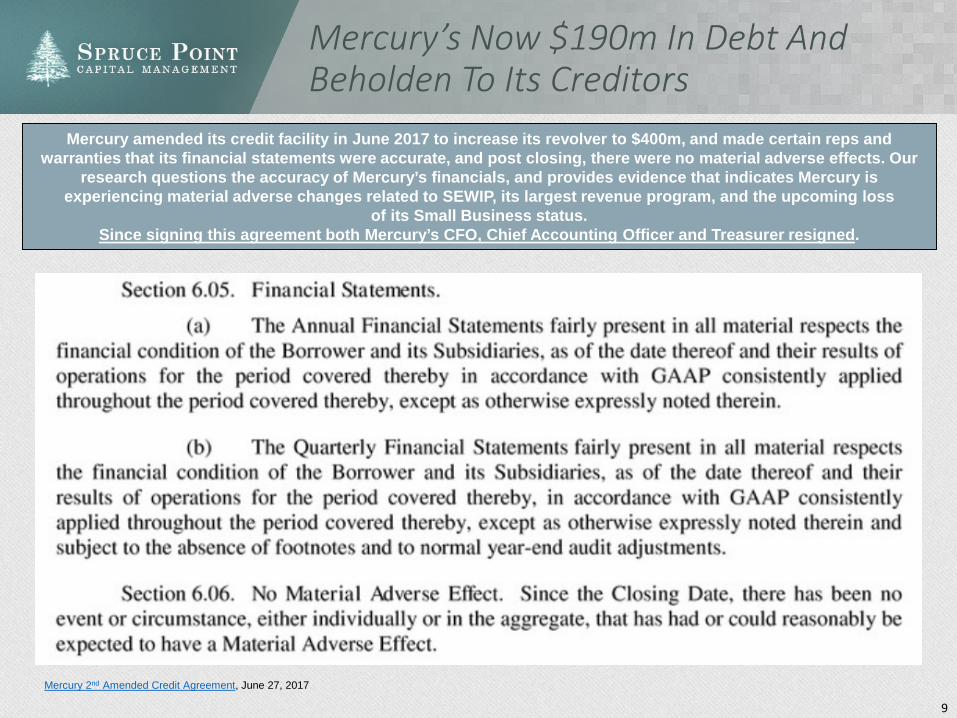
Mercury amended its credit facility in June 2017 to increase its revolver to $400m, and made certain reps and warranties that its financial statements were accurate, and post closing, there were no material adverse effects. Our
research questions the accuracy of Mercury’s financials, and provides evidence that indicates Mercury is experiencing material adverse changes related to SEWIP, its largest revenue program, and the upcoming loss
of its Small Business status. Since signing this agreement both Mercury’s CFO, Chief Accounting Officer and Treasurer resigned.
Mercury 2nd Amended Credit Agreement, June 27, 2017

10
Mercury Systems Connection To Enterasys Networks, A Former Fraud
Three key members of Mercury came from Enterasys Networks (formerly Cabletron), where they were credited with turning around the troubled company and selling it to Gores in 2006 (source). Many Enterasys executives went to jail
and others settled with the SEC. Mercury’s recently resigned CFO, Gerald Haines, worked at Enterasys prior to the scandal unfolding as its Chief Legal Officer and Secretary, which he omits from his biography.
It is unusual that Mercury management recently decided to move offices back into the site of Enterasys (source)
Source
Source
Current Mercury Executive
Tenure at EnterasysNotes
Appointed Ending
Gerald HainesRecent Former CFO 2000 2006
• Haines’ bio discloses he worked at Cabletron and Enterasys Networks, while his Linkedin bio omits the Cabletron reference or that he was Chief Legal Officer (a named executive) and Secretary
• He was EVP and General Counsel (Chief Legal Officer) of Enterasys/Cabletron from 2000-2001during the early part of the Enterasys scandal unwinding
• Haines resigned from Mercury abruptly after closing Themis (Feb 2018)• Note: Haines, a lawyer by background, had always served as General Counsel at prior jobs
(Verenium, Enterasys, Applied Extrusion Tech), never as the appointed CFO
Mark Aslett CEO April 2003 2006 • Joined Enterasys as President, and was COO and CEO from 2003-2006• Was on the Board from 2004 – 2006 (source)
William K O’BrienAudit Committee Chair April 2002 2004 • Spent over 30yrs as an accountant at PWC
• Was appointed CEO of Enterasys in 2002 and later Executive Chairman from 2003-2006 (source)
• Many executives from Cabletron and Enterasys went to prison for fraud and received SEC complaints
• None of Mercury’s executives who came from Enterasys were implicated
• CEO Aslett and Director O’Brien joined after the scandal unfolded
• However, Mercury’s former CFO Haines was the Chief Legal Officer, working along side convicted felons Fiallio and Gagalis

11
Spruce Point Calls To The Board For A Fresh Review of Mercury’s Financials
Mercury’s Board needs fresh independent eyes. Mercury’s auditor KPMG has been at the helm for 10yrs and being paid abnormally high fees. The Audit Committee chair Mr. O’Brien is a long-time colleague of CEO Aslett. We are
asking Mercury’s newest Board member, Under Secretary of the Air Force, Ms. Lisa Disbrow for her objective review.

Evidence of Financial Struggles

13
Recent Deal Activity Picking Up
Deal Close Quarter Target Business Segment Deal
Value Form Est. Sales
Est. EBITDA
EBITDAMargin
EV/ Sales
EV/EBITDA Synergies
2/1/18 Q3’18 Themis Computer
Designer, manufacturer and integrator of commercial, SWaP-optimized rugged servers, computers and storage systems for U.S. and international defense programs
$180.0 Cash $57.0 $13.1 23.0% 3.2x 13.7x $1m of cost synergies
7/3/17 Q1’18 Richland Tech
Safety-critical and high integrity systems, software, and hardware development as well as safety-certification services for mission-critical applications
NA Cash NA NA NA NA NA NA
4/3/17 Q4’17 Delta Microwave
Designer and manufacturer of high-value radio frequency (RF), microwave and millimeter wave subassemblies and components for military and space markets
$40.5 Cash $12.8 NA NA 3.2x NA $2.5 cost synergies
11/4/16 Q2’17 Creative Electronic Systems
Provider of embedded solutions for military and aerospace mission-critical computing applications
$38.0 Cash $23.0 NA NA 1.7x NA NA
5/2/16 Q3’16 Microsemi Carve-Out
Embedded security, RF and microwave, and custom microelectronics businesses from Microsemi
$300.0 Debt/New Equity $100.0 $28.0 28% 3.0x 10.7x
$10m costsynergies by
2020
12/16/15 Q2’16 Lewis Innovative Technologies
Technologies and services focused on secure embedded processing for defense and commercial applications
$9.7 Cash NA NA NA NA NA NA
Total Acquisitions and Blended Average $568.2 -- $192.8 $41.1 21.3% 2.9x 13.8x $10m
$ in millions
Mercury has been growing though the acquisitions of small companies and does not often disclose EBITDA contributions. The most recent acquisition of Themis caught our attention because of the large valuation multiple, and sudden resignation of the CFO
just after the deal closing. The Themis deal was also announced on Dec 21, 2017 right near Christmas, which may indicate the urgency with which Mercury needed an acquisition to cover its increasingly apparent financial shortfalls.
Mercury Key Acquisitions
14
On The Surface, Reported Organic Revenue Growth Looks Good
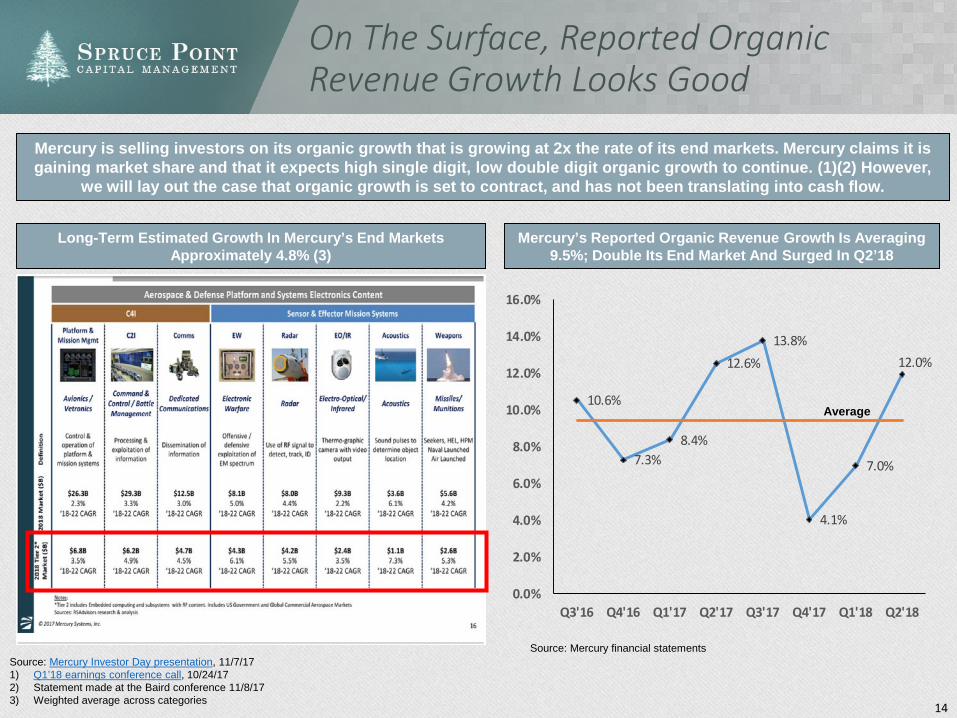
Mercury is selling investors on its organic growth that is growing at 2x the rate of its end markets. Mercury claims it is gaining market share and that it expects high single digit, low double digit organic growth to continue. (1)(2) However,
we will lay out the case that organic growth is set to contract, and has not been translating into cash flow.
Mercury’s Reported Organic Revenue Growth Is Averaging 9.5%; Double Its End Market And Surged In Q2’18
Long-Term Estimated Growth In Mercury’s End Markets Approximately 4.8% (3)
Source: Mercury Investor Day presentation, 11/7/171) Q1’18 earnings conference call, 10/24/172) Statement made at the Baird conference 11/8/17 3) Weighted average across categories
Source: Mercury financial statements
10.6%
7.3%8.4%
12.6%13.8%
4.1%
7.0%
12.0%
0.0%
2.0%
4.0%
6.0%
8.0%
10.0%
12.0%
14.0%
16.0%
Q3'16 Q4'16 Q1'17 Q2'17 Q3'17 Q4'17 Q1'18 Q2'18
Average

15
Evidence To Suggest Mercury’s Reduced Market Visibility, Slowing Growth
Mercury recently omitted a key slide about long-term end market growth it expects in key verticals (bottom left). Instead, it prefers to show where it is acquiring businesses. We believe that by excluding the recent acquisition of Themis and Delta Microwave, Mercury’s organic growth will decline in CY 18 below trend to approximately 6.5% (1)
Notice Now How Mercury Excludes Slide To Left In March 2018, Favoring Acquisitions and Obscures Market Growth
Notice That Mercury Recently Gave Long-Term End Market Guidance To Investors As of Nov 2017
Source: Mercury Investor Day presentation, 11/7/17 Source: Mercury Investor Presentation, 3/1/18
1) Mercury’s CY 2017 reported revenues of $446.9m are reduced by $28.5m [Delta Microwave ($9.5m, closed on 4/3/17) and Creative ($19m, closed 11/2/16)]. Pro forma CY 2017 revenues excluding acquisitions are $418.4m Themis CY 2017 revenues estimated at $57m by Mercury and the deal closed 2/1/18. Wall St CY 2018 estimates for MRCY are $501m. Removing $52m of Themis revenue contribution and $3.2m of Delta contribution equals $445.7m of CY 2018 revenues. Therefore, pro forma organic revenue growth is estimated as ($445.8/$418.4/)-1 = 6.5%. Note: Analysis conservatively assumes no growth in Themis CY 2018 sales and excludes the small Richland acquisition which Mercury has not disclosed sales.

16
0.0%
2.0%
4.0%
6.0%
8.0%
10.0%
12.0%
14.0%
16.0%
0.0%
5.0%
10.0%
15.0%
20.0%
25.0%
Highly Improbable Financial Model
Mercury acts as an outsourced Tier 2 provider of solutions for prime defense contractors (subcontractor). 96% of its business is to the federal government. Mercury reports the highest EBITDA margins in the
aerospace and defense universe, well above its own customers. However, this does not correspond to the highest free cash flow margin. In fact, despite reporting a fairly low capex business model, Mercury's free
cash flow margins are no better than the industry average. (1)
LTM EBITDA Margin LTM Free Cash Flow Margin
Average
Average
Source: Company filings1) CFO comment on Q2’18 conference call says Mercury target “5% or less capex to sales”2) We include FLIR in our analysis solely because some analysts reference them as a peer to MRCY. However, only 26% of FLIR’s revenues are derived from federal gov’t agencies and end markets vs. 96% for Mercury. Therefore, we do not believe FLIR to be a suitable comp due to its different economic characteristics
(2)(2)

17
Significant And Growing Divergence: Adjusted EBITDA vs. Free Cash Flow
Investors should be worried that in three years from FY15 – FY17, Mercury’s EBITDA grew 112%, but its Free Cash Flow grew 0%. The growing delta (red bar in graph below) is accelerating, while in the LTM Dec 2017 period, Free Cash Flow is now declining. Management has made references to inventory build as the culprit on recent conference calls.
$9.9
$23.5
$44.4
$57.3
$93.9
$104.7
($5.8)
$7.5
$26.2 $29.0 $26.3 $24.7
($20.0)
$0.0
$20.0
$40.0
$60.0
$80.0
$100.0
$120.0
2013 2014 2015 2016 2017 LTM 12/2017
Adj EBITDA Free Cash Flow Delta
Free Cash Flow Is Trending
Down In the Last 12m, Even As Capex Declines YoY In
FY18
Adj. EBITDA Continues
To Rise
Three Years: No Free Cash Flow Growth
$ in mm
1) Q2’18 earnings conference call: “Our cash flow reflects the buildup of inventory associated with our expanded in-house manufacturing capabilities offset in part by a 9 day decrease in day sales outstanding in Q2 compared”

18
Warning: Management Paid Only On Adjusted EBITDA Margin
It should be no surprise that Mercury’s Adjusted EBITDA is rising rapidly. Management is solely incentivized by its compensation program to hit Adjusted EBITDA margin targets.
It also has a very unusual compensation structure whereby targets are semiannual. Based on changes to the executive program in FY 2018, expect even more aggressive EBITDA expansion!
Source: Proxy statement
Executive Bonus Program for Fiscal 2018
In establishing the executive bonus program for fiscal 2018, the Compensation Committee reviewed our multi-year performance and noted that our annual financial goals have been very aggressive relative to the financial performance of our peer group, with achievement of our strategic operating plan consistently positioning us in the top quartile. In order to provide incentives for continued top quartile performance going forward, the Committee increased the potential cash bonus payout for fiscal 2018, thereby putting an even larger percentage of an executive's overall potential compensation at risk based on performance. For fiscal 2018, the target bonus as a percentage of base salary for the Chief Executive Officer under the executive bonus program is 150%; for the Executive Vice President, Chief Operating Officer is 110%; for each of the Executive Vice President, General Counsel and the Executive Vice President, Chief Financial Officer is 90%; and for the Vice President, Controller, and Chief Accounting Officer is 50%. For fiscal 2018, the performance targets are based on the amount of our actual adjusted EBITDA measured in dollars compared to budgeted adjusted EBITDA as set forth in our strategic operating plan for fiscal 2018, with targets again relating to the first and second halves of the fiscal year.

19
Financials Showing Strain
Post the acquisition of Microsemi’s carve out business in Q4’16, revenues grew faster than receivables. In light of Mercury’s difficulty generating cash flow growth (days inventory and cash conversion cycle at
highs), and that receivables are now greater than revenues in Q1 and Q2 2018, we worry that the Company was aggressively booking revenues.
-20%
-10%
0%
10%
20%
30%
40%
50%
$0.0
$20.0
$40.0
$60.0
$80.0
$100.0
$120.0
$140.0
Q4'16 Q1'17 Q2'17 Q3'17 Q4'17 Q1'18 Q2'18
Total Revenues Total Receivables Sales Growth Total Receivables Growth
Note: Includes accounts receivables and unbilled receivables and costs in excess of billings
Source: Company financials, Bloomberg
114
105108
96
117123
135
150
133 132
120
143 145
156
80
90
100
110
120
130
140
150
160
170
Q4'16 Q1'17 Q2'17 Q3'17 Q4'17 Q1'18 Q2'18
Sales Growing Faster Than Receivables Days Inventory and Cash Collection Cycle
Cash Conversion CycleDays Inventory
Receivables > SalesMicrosemi Deal Close
Microsemi Deal Close

20
Warning: Reclassification To Boost Gross Margins Suggest Pressures
Mercury first disclosed a reclassification of costs from COGS to R&D expense in the Q1’2017 10-Q. This tactic served to increaseits gross margin reporting, and bolsters our argument that Mercury is covering up financial strains. We also observe that Mercury
provided backward looking reclassification information, but not enough to determine the magnitude of the benefit it received in FY2017 when it first disclosed the reclassification.
Source: Mercury financial statements
FY 2016 FY 2017 FY 2018
FY2015
Sept 15Q1’16
Dec 15Q2’16
March 16Q3’16
June 16Q4’16
FY2016
Sept 16Q1’17
Dec 17Q2’17
March 17Q3’17
June 17Q4’17
FY2017
Sept 17Q1’18
Dec 17Q2’18
Gross Profit $110.2 $27.5 $28.6 $30.5 $38.2 $124.8 -- -- -- -- -- -- --
% margin 46.9% 47.1% 47.3% 46.3% 44.7% 46.2% -- -- -- -- -- -- --
Reclassified to R&D Expense $4.0 $0.8 $1.2 $0.9 $0.0 $2.8 -- -- -- -- -- -- --
Gross Profit (adjusted) $114.2 $28.3 $29.7 $31.4 $38.2 $127.6 $39.4 $47.4 $50.8 $53.9 $191.5 $55.4 $54.2
% margin (adjusted) 48.6% 48.5% 49.2% 47.7% 44.7% 47.2% 45.0% 48.4% 47.3% 46.6% 46.9% 47.8% 45.9%
Margin Boost +1.7% +1.4% +1.9% +1.4% +0.0% +1.0% -- -- -- -- -- -- --
Reclassification: “The Company included costs related to the sustainment of its product portfolio as research and development expense, which was previously included as costs of revenues on the Consolidated Statements of Operations and Comprehensive Income. For comparative purposes, for the fiscal years ended June 30, 2016 and 2015, the Company has reclassified $2,845 and $3,981, respectively, from costs of revenues to research and development expense.” Source: FY17 10-K, p.52

21
Pay Attention To Gross Margin Estimate Misses and Contraction
Quarter Guidance
Was Given:Q1’17 Q2’17 Q3’17 Q4’17 Q1’18 Q2’18
Next Quarter Gross Margin Guidance
vs. Actual Result(Delta at mid)
46.0% -- 47.0%vs.
48.4%+1.9%
47.0%vs.
47.3%+0.3%
45% -- 46%vs.
46.6%+1.1%
46% -- 47%vs.
47.8%+1.3%
46.1% -- 46.7%vs.
45.9%-0.5%
46.6% – 47.0%vs.??
FY 2018Gross Margin Estimate By CFO Haines Continue To
Contract
“We estimate that it's going to be
somewhere in the neighborhood of the middle of our target range, which is the target range being
45% to 50% gross margin.”
“Currently gross margins for the year are expected to be
between 46.8% and 47.3%”
“Currently gross margins for the year are expected to be
between 46.5% and 46.8%”
Notice that Mercury’s Gross Margins are slowly contracting (Q2’17: 48.8% vs Q2’18: 45.9%)Mercury’s first miss on its gross margin guidance came in Sept 2017 (Q2’18). This is the same month that: 1) Mercury first disclosed in its proxy filing how to submit anonymous tips for accounting concerns;2) Its Chief Accounting Officer resigned, and3) The month before in August 2017, insiders quietly entered a 10b5-1 stock sale program
First Guidance Miss
Note: Mercury gives gross margin guidance on its conference calls

22
Major Risk Factors Being Realized
Mercury’s traditional top three customers are becoming a smaller part of its business, while its historical business strength in radar becomes less relevant.
Investors should be concerned that “Other” revenues are Mercury’s fastest growing segment.
Key Disclosures From Mercury’s FY 2017 Annual Report: • “As part of our strategy, we are focusing on being a commercial outsourcing partner to the large defense prime contractors as they seek the more
rapid design, development and delivery of affordable, commercially developed, specialized processing solutions within the markets we serve”
• “We are dependent on a small number of customers for a large portion of our revenues. A significant decrease in the sales to or loss of any of our major customers would have a material adverse effect on our business and results of operations.”
• “We are dependent on sales for radar applications for a large portion of our revenues. While our radar sales relate to multiple different platforms and defense programs, our revenues are largely dependent upon our customers incorporating our products into radar applications.”
Source: Mercury FY 2017 10-KTop Three Customers (% of Total Mercury Net Revenues)
Not Encouraging That “Other Revenues” Is Mercury’s Fastest Growing Category
$ in mmFiscal Year Net Sales Percentage of Total
2015 2016 2017 2015 2016 2017
Radar% growth
$143.529.7%
$140.3-2.2%
$150.47.2% 61% 52% 37%
Electronic Warfare% growth
$51.4N/A
$72.140.3%
$106.447.6% 22% 27% 26%
Other% growth
$39.9N/A
$57.744.5%
$151.7162.7% 17% 21% 37%
Total $234.8 $270.2 $408.6 100% 100% 100%
Note: Mercury just started disclosing net revenue by end market application in FY 2017 10-K, Note P.
20% 23% 20%
37%
20%16%
4%
8%
8%
0%
10%
20%
30%
40%
50%
60%
70%
2015 2016 2017
Lockheed Raytheon Northrop Grumman
61%
51%44%
Note: Total revenues to the top 3 declined from $143m to $137m between 2015-16, but increased to $179m from 2016-17 after three acquisitions, so it is difficult to determine how much of the growth is acquired revenues (the acquired Microsemi business had all three primes as customers per the deal presentation)

23
Major Risk Factors Being Realized (Cont’d)
In the Q2’18 10-Q filing, Mercury started breaking out “Other Revenue” in slightly more detail, and the results are not encouraging. Two of its three largest segments are declining, including Radar, its largest market. Mercury now makes
reference to “Effector” without any elaboration or prior mention on earnings conference calls. Not surprisingly, management is calling out the growth in C4I on its last conference call, while downplaying Radar’s decline (a)
(1) Radar includes end-use applications where radio frequency signals are utilized to detect, track, and identify objects.(2) Electronic Warfare includes end-use applications comprising the offensive and defensive use of the electromagnetic spectrum.(3) Other Sensor & Effector products include all Sensor & Effector end markets other than Radar and Electronic Warfare.(4) C4I includes rugged secure rackmount servers that are designed to drive the most powerful military processing applications.(5) Other products include all component and other sales where the end use is not specified.
Two of the larger segments are now declining, including Radar, its
historical strength
What is Effector? It has never been mentioned before by Mercury. The
dictionary meaning relates to biology
Source: Q2’18 10-Q(a) Q2’18: conference call, Mercury highlighted upfront the C4I growth “Mercury C4I revenues have grown 290% over the past 12 months compared with the prior period and now represent 12% of total company's revenue. In Q2 our C4I revenues grew 105% year-over-year.”

24
Major Risk Factor Being Realized (Cont’d)
Mercury slipped in one sentence in its last Annual Report that has gone almost unnoticed by analysts and investors that represents a looming Material Adverse Effect on its business. We believe the major implications
are that Mercury will lose out on business opportunities and increase its costs of doing business.
We face other risks and uncertainties associated with defense-related contracts, which may have a material adverse effect on our business.
We qualify as a “small business” for government contracts purposes under the definition of that term in an applicable NAICS code because we have fewer than 1,250 employees. As we grow and potentially have a rolling 12-month average of over 1,250 employees in the future, we would no longer qualify as a small business. Loss of our small business status could negatively impact us, including our customers purchases from us would not qualify as purchases from a small business, customers may flow down additional Federal Acquisition Regulation, or FAR, clauses in their contracts with us that are less favorable than our existing contract terms and conditions. We expect to lose our status as a small business during fiscal 2018.
Source: 2017 Annual Report 10-K, p. 14
Mercury reported 1,159 employees as of June 30, 2017 in its 10-K Annual Report. We estimate Richland (acquired July 2017) contributed approximately 12 employees and Themis Computer (acquired Feb 2018)
has between 50 to 200 employees.(1) Therefore, we believe Mercury is likely to be very close to the 1,250 employee limit.
1) Richland Technologies (Source: SBIR) and Themis Computer (Source: Glassdoor)

Mercury's Promotion of the SEWIP Program and Undisclosed Cost Overrun Allegations

26
Mercury Promotes Its SEWIP Program, Expected To Be Material To Future Revenues
Key CEO Quotes on SEWIP (Surface Electronic Warfare Improvement Program) – Notably Block 3
CEO Aslett – Jefferies Conf (Aug 17): “Three to four years ago, SEWIP was an emerging program. This past fiscal year, SEWIP was actually our largest bookings and revenue program, and that is really largely only SEWIP Block 2 today. As you probably know and as we've talked about, we're also now a part of the SEWIP Block 3 team with Northrop Grumman, and that's still in the engineering phase. So we do expect additional growth from that program. So the program has gone from zero to being our largest program in a relatively short space of time.”
CEO Aslett – Q3’2017 (April 2017) Earnings Call: “Mercury is a very innovative company and we’ve seen that on existing programs, such as Patriot where we continuing to chip away and win more business on the program, likewise on SEWIP, where again, we’re continuing to win more content on both Block 2, as well as Block 3.”
CEO Aslett – Q1’2017 (Oct 2016) Earnings Call: “Lockheed Martin just received their five year production contract on SEWIP Block 2 and we continue to do important work with Northrop Grumman and SEWIP Block 3.”
CEO Aslett Q2’2016 (Jan 2016) Earnings Call: “We've had a longstanding relationship with Northrop and I would characterize it's been a strategic relationship. We weren't part of that team prior to the award mainly because I think we were working extremely closely with both Lockheed and Raytheon who were competing against Northrop for the SEWIP Block 3 business. However since they were awarded thebusiness, we've engaged or reengaged with them and we obviously know the SEWIP program well and we've got multiple sets of technologies and capabilities that are applicable for Block 3. And so I think its result of our capabilities, our relationships, our knowledge of the program that allowed us to basically win a pretty significant piece of the business on the program going forward.”
Diverse Mix of Stable, Growth Programs Aligned with DoD Funding Priorities. Our products and solutions have been deployed on more than 300 different programs and over 25 different defense prime contractors. We serve high priority markets for the DoD and foreign militaries, such as UAVs, ballistic missile defense, guided missiles and precision munitions, airborne reconnaissance, EW, and have secured positions on mission-critical programs including Aegis, Predator and Reaper UAVs, F-35 Joint Strike Fighter, Patriot missile, SEWIP, and Paveway
For the fiscal year ended June 30, 2016, the Surface Electronic Warfare Improvement Program ("SEWIP") program individually comprised 12% of our revenues.
Going forward, we believe the SEWIP, AEGIS, F-35, F-16 and the Patriot missile defense programs could be a large portion of our future revenues in the coming years, and the loss or cancellation of these programs could adversely affect our future results.
Key FY 2017 Annual Report Disclosures on SEWIP (Source)

27
So Much “Potential” For Billions In Deals…
No surprise to us that Mercury no longer presents this slide in any of its investor presentations. The slide was marketed heavily in 2016 while Mercury was out promoting the Microsemi transaction and raising equity.
Source: Gabelli Conference, September 2016; last appeared

28
Inspector General Report on SEWIP: Allegations of Substantial Cost Overruns
On November 9, 2017 the Inspector General of the US DoD reported seven defense hotline allegations on Northrop Grumman’s SEWIP Block 3 program. Three allegations were substantiated, two were partially substantiated, and two were dismissed. While the exact amount of cost overruns have been redacted, the amount must have been material enough to merit of full investigation. Mercury has said it expects SEWIP to be material driver of its future revenues.
The Company should explain to investors the materiality of the issues presented here.
Source: Defense.gov

29
More Evidence To Suggest A Cover-Up By Mercury of SEWIP Problems
As of Mercury’s last quarterly report, SEWIP mysteriously disappeared from a discussion of material programs despite the CEO claiming on the conference call it was the second largest revenue program. Recall from the previous slide, just months earlier in
August 2017 the CEO said in reference to SEWIP “So we do expect additional growth from that program. So the program has gone from zero to being our largest program in a relatively short space of time.” Therefore, it appears something went horribly
wrong; from Sept 30th to Dec 31st SEWIP declined and was no longer reported as material.
Source:Q1’2018 10-Q filed 11/2/17
Source: Q2’2018 10-Q, Filed 2/2/18
CEO Aslett Q2’18 Conference Call (1/21/18):
“Our largest revenue programs in the quarter were Aegis, SEWIP, F-35, E2D Hawkeye and Filthy Buzzard.”
CEO Aslett Q1’18 Conference Call (10/24/17):
“Our largest revenue programs in the quarter was SEWIP, F-35, Aegis, F-16 SABR and Filthy Buzzard.”
F-35 Not Included In 10-Q Despite CEO Claiming It’s The Second Largest Program Q’18
SEWIP Excluded From 10-Q Despite CEO Saying It’s The Second Largest Revenue Program In Q2’18
Note: * Denotes less than 10% of revenues

Accounting and Financial Presentation Concerns

31
Background on Mercury’s Accounting Methods
Contract accounting is often abused by companies, because revenues can be prematurely recognized, and costs can be underestimated, leading to gross margin inflation. When problems emerge, gross margins typically contract
Anticipated contract losses are typically accrued and reported in the financial footnotes
Moreover, best financial disclosure practices suggest a detailed accounting of favorable, unfavorable and the “net” impact of contract changes or estimate revisions
Accounting MethodSpruce Point
Assessment of Accounting Method
FY2014 FY2015 FY2016 FY2017 LTM Dec 2017
Ship and Bill Simple 35% 47% 35% 44% 15% (1)
Multiple Deliverable Arrangements
Complex, Significant Management
Judgement Required37% 24% 37% 33%
Contract Accounting(POC, Completed
Contracts, and Time and Materials Method)
Complex, Significant Management
Judgement Required28% 29% 28% 23%
1) CEO on Q2’18 call “So we've obviously worked extremely diligently since fiscal 2013 to reduce our dependency on what we would describe as book ship revenue...If you look on an LTM basis, the amount of book ship revenue that we have is around about 15% of total revenue”
Mercury reports using three different revenue accounting methods: Ship and Bill, Multiple Deliverable Arrangements and Contract Accounting. Ship and Bill is fairly straight forward, and mirrors standard revenue recognition criteria such as
persuasive evidence of a sale arrangement (fixed price and collection assured), with title and risk passing to the customer. Theother two methods used are more complex and leave significant judgement in the hands of management.
Mercury appears to be moving towards more complex accounting methods
Percentage of Mercury Revenues By Accounting Method
We observe that Mercury does not disclose its net adjustments. The next slide shows Mercury’s customers abide by this best practice. How much of Mercury’s EBITDA is being juiced by favorable contract accounting changes?
We observe that Mercury reports a de minimis $0.50m of loss accrual costs in accrued expenses. Hard to believe it is so low given $447m of sales
We observe that Mercury’s gross margins are contracting and it missed its Q2’18 guidance (the first miss in many quarters)

32
Mercury’s Defense Prime Customers Report Impact From Contract Adjustments
Prime Contractor Favorable Adjustment % of Operating Income Disclosure
Raytheon 13%
Lockheed Martin 29%
“Our consolidated net adjustments not related to volume, including net profit booking rate adjustments and other matters, net of state income taxes, increased segment operating profit by approximately $1.5 billion in both 2017 and 2016 and $1.7 billion in 2015…. The consolidated net adjustments for 2017 are inclusive of approximately $790 million in unfavorable items, which include reserves for performance matters on the EADGE-T contract, Vertical Launching System (VLS) program and other programs at RMS and on commercial satellite programs at Space.”
Northrop Grumman 11%
SAIC 15%
Why doesn’t Mercury disclose net favorable accounting adjustments in accordance with defense industry best practices?

33
Percentage-of-Completion Schemes Common In Aerospace and Defense And A Current SEC Focus
SEC Enforcement Director Speech (2013): “Revenue recognition issues will remain a staple of our financial fraud caseload – this fraud often takes many forms, whether by recognizing revenue through sham transactions, prematurely recognizing revenue, distorting percentage of completion accounting, using schemes to inflate sales numbers, or billing for uncompleted products through a “pre-booking” scheme.”
Company / Industry Year Note
Orbital ATK / Aerospace 2016 The Restatement is primarily a result of a non-cash error in the application of purchase accounting with respect to a limited number of long-term contracts, which are accounted for under the percentage-of-completion method
Toshiba / Diversified 2015
Toshiba Corp. must correct at least 152 billion yen ($1.2 billion) of pretax earnings over a six year period after an internal accounting probe revealed the company overstated profits. The company initially uncovered irregularities related to “percentage of completion” estimates used on infrastructure projects, including nuclear, hydroelectric, wind-power equipment, air-traffic control and railway systems
L-3 Communications / Aerospace 2014
Receives SEC subpoena and DOJ investigation and pays fine of $1.6m and $4.6m, respectively to each agency (source). The cases relate to improper revenue accounting at L3’s aerospace systems segment that resulted in the contractor’s correcting financial results over a roughly four-year period starting in 2011 and firing at least four employees.
Cubic Corp / Aerospace2012 and
2014Changes will result in an increase in revenues and net income cumulatively over the period
Computer Sciences/ IT Services 2011 The anticipated result of the restatement is to reduce net income by ~$50 in FY 2010 and ~$3.69 billion in FY 2011
and to increase net income in FY 2012 by ~$3.90 billion. Settled with the SEC for $190m
Recent Accounting Restatements and SEC Investigations of Percentage-of-Completion Accounting Cases
Former Mercury CFO Haines (Oct 2017): “And then often some of those large subsystems are actually scoring revenue on a percentage of completion basis. And there can be timing issues around when we are recognizing the revenue as we are working through it and when we actually convert that revenue into cash over time.”

Troubling Insider Behavior and Governance Concerns

35
Troubling Signs Suggesting An Accounting Scandal Cover-Up
Is it more than a coincidence that Mercury’s Chief Accounting Officer resigned right after the Company started to highlight it has methods for reporting accounting problems anonymously? The CFO, a lawyer by background and not a
seasoned financial professional, also resigned.
2017 Proxy Adds New Discussion of Reporting Anonymous Accounting Concerns
Source: 2017 Mercury Proxy – Filed September 5, 2017Note: Prior 2016 Proxy excludes the above statement
Does Mercury have a method for the anonymous reporting of accounting concerns?
Yes. Our Code of Business Conduct and Ethics includes a means for the anonymous reporting of any concerns about accounting, internal accounting controls, or auditing matters. Any employee, supplier, customer, shareholder, or other interested party can submit a report via the following anonymous methods:
• by telephone voicemail at 866-277-5739;• by emailing directly to [email protected]; or• by submitting a complaint via the internet at
www.openboard.info/mrcy/websubmit.cfm.
Executive Appointed Resigns Concerns
Gerald HainesCFO Sept 2014 Feb 2018
• Haines’ bio discloses he worked at Cabletron and Enterasys Networks, while his Linkedin bio omits the Cabletron reference or that he was Chief Legal Officer and named executive
• He was SVP and General Counsel (Chief Legal Officer) of Enterasys/Cabletron from 2000-2001 during the early part of the Enterasys financial scandal unwinding
• Haines resigned from Mercury abruptly after closing Themis (Feb 2018)
• Note: Haines, a lawyer by background, had always served as General Counsel at prior jobs (Verenium, Enterasys, AppliedExtrusion Tech), never as a CFO
Charles Speicher
Chief Accounting
Officer
Sept 2010 Sept 26,2017
• Speicher’s resignation came approximately 3 weeks after the proxy filing disclosure about reporting of accounting concerns

36
Troubling Insider Behavior
CEO Aslett Stock Sales
Date Shares Price Proceeds
8/17/2017 14,256 $45.63 $650,501
8/17/2017 7,128 $45.63 $325,251
9/11/2017 4,800 $47.42 $227,616
9/12/2017 4,800 $47.22 $226,656
10/30/2017 4,800 $49.92 $239,606
10/31/2017 4,800 $50.57 $242,750
11/15/2017 4,800 $49.64 $238,267
11/16/2017 4,800 $50.58 $242,765
11/29/2017 4,800 $52.11 $250,140
11/30/2017 4,800 $52.22 $250,670
12/11/2017 4,800 $49.77 $238,911
12/12/2017 4,800 $48.29 $231,784
1/30/2018 4,800 $48.14 $231,060
1/31/2018 4,800 $48.07 $230,714
2/14/2018 4,800 $44.33 $212,777
3/14/2018 5,600 $48.35 $464,199
Total: 98,184 $48.05 $4,717,515
Insiders (CEO, CFO and COO) have been net sellers of Mercury’s shares. What’s most disturbing is that the CEO and CFO starteda 10b5-1 stock sale program and discarded shares before the FY 2017 10-K filing on Aug 18, 2017 and the Inspector General
Report on SEWIP 3 in November 2017. The 10b5-1 program was not disclosed until an October 2017 Form 4 footnote.
CFO Haines Stock Sales
Date Shares Price Proceeds
8/17/2017 4,277 $45.63 $195,160
8/17/2017 2,139 $45.63 $97,603
9/3/2017 2,745 $48.36 $132,748
9/3/2017 2,745 $48.36 $132,748
10/2/2017 2,500 $51.93 $129,825
11/1/2017 2,500 $50.41 $126,016
12/1/2017 2,500 $51.62 $129,050
1/2/2018 2,500 $51.07 $127,675
2/1/2018 2,500 $47.69 $119,225
Total: 24,406 $48.76 $1,190,049
5.3%
6.7%7.0%
6.7%
5.7%
4.3%
3.5%
0.0%
1.0%
2.0%
3.0%
4.0%
5.0%
6.0%
7.0%
8.0%
2011 2012 2013 2014 2015 2016 2017
Total Insider Beneficial Ownership
Source: Mercury proxy statements Source: Form 4 filings10b5-1 program first disclosure (CEO and CFO)

37
Other Hints Management Wants More Perks On Its Way Out The Door
Paying close attention to Mercury’s recent 10-K, we find at the very end of the document it discloses that the Compensation Committee approved beneficial changes to executive departure terms. Also, Mercury explicitly defined
what the condition for termination for “Cause” would be, calling out “Fraud” and “Dishonesty”
Source: Mercury FY 2017 10-K ITEM 9B
On August 14, 2017, the Compensation Committee approved (and with respect to matters for the Company’s Chief Executive Officer, the independent directors on the Company’s Board of Directors approved) the following executive compensation matters:
• an increase for the annual perquisite for the Company’s executive officers from up to $2,000 annually for personal tax and financial planning to a $4,000 annual allowance for personal tax and financial planning;
• an amendment to Mr. Aslett's employment agreement to provide that he is entitled to continue to participate in the Company’s group health, dental, and vision programs for 24 months following a termination of his employment by the Company without “cause” or by him for “good reason” (as defined in his employment agreement); and
• an agreement for each of the Company’s non-CEO named executive officers that provides for termination and severance benefits in the case of a termination of the executive's employment by the Company without “cause” or by the executive for “good reason.”
For the agreements for the Company’s non-CEO named executive officers, the following terms and conditions apply.
“Cause” is defined in the agreement to include: (1) the willful and continued failure by the executive to perform substantially the duties and responsibilities of his position with the Company after written demand; (2) the conviction of the executive by a court of competent jurisdiction for felony criminal conduct or a plea of nolo contendere to a felony; or (3) the willful engaging by the executive in fraud, dishonesty, or other misconduct which is demonstrably and materially injurious to the Company or its reputation, monetarily, or otherwise. No act, or failure to act, on the executive’s part will be deemed “willful” unless committed or omitted by the executive in bad faith and without reasonable belief that his act or failure to act was in, or not opposed to, the best interest of the Company.
“Good Reason” is defined in the agreement to include: (1) a material diminution in the executive's responsibilities, authority, or duties as in effect on the date of the agreement; (2) a material diminution in the executive's annual base salary, except for across-the-board salary reductions based on the Company’s financial performance similarly affecting all or substantially all senior management employees of the Company; or (3) a material change in the geographic location at which the executive provides services to the Company.
Under the agreement, if the Company terminates the executive's employment without “cause” or the executive his employment for “good reason,” then the Company will pay the executive a severance amount equal to one times his annual base salary. In such event, the Company also will pay for certain insurance benefits and outplacement services

38
Highest Audit Fees In The Industry
Company / Ticker FY Sales Last FY Audit Fee Employees Audit Fee /
EmployeeAudit Fee /
Sales Auditor
Mercury (MRCY) $409 $1.70 1,159 $1,467 0.42% KPMG
AeroVironment (AVAV) $265 $0.97 661 $1,467 0.37% E&Y
VSE Corp (VSEC) $691 $1.92 2,523 $761 0.28% E&Y
Kratos (KTOS) $669 $2.02 2,900 $698 0.30% Deloitte
Cubic (CUB) $1,486 $5.07 8,700 $583 0.34% E&Y
AAR Corp (AIR) $1,768 $1.62 4,600 $352 0.09% KPMG
Triumph Group (TGI) $3,533 $4.20 14,309 $294 0.12% E&Y
SAIC (SAI) $4,450 $3.75 15,000 $250 0.08% Deloitte
ManTech (MANT) $1,602 $1.68 7,000 $240 0.10% Deloitte
CSRA (CSRA) $4,993 $3.70 18,500 $200 0.07% Deloitte
CACI Int'l (CACI) $4,354 $2.20 18,600 $118 0.05% E&Y
Booz Allen (BAH) $5,804 $3.90 24,700 $158 0.07% E&Y
Average $2,502 $2.73 9,888 $549 0.19%
$ in millions, except audit fee per employee
Mercury has the highest audit fees among midcap aerospace, defense, and gov’t contractors. We observe that its audit fee per employee matches only Aerovironment (AVAV), a company we profiled last year in a detailed report. Our report noted a
whistleblower complaint filed by a senior AVAV executive charging the Company with fraud.
Source: Company proxy and financial statements

Valuation and Downside Risk

40
Institutional Support Declining
Ownership of Mercury’s stock by long-term fundamental owners has been on the decline. The only real buyers of the stock are Vanguard and Blackrock’s index funds, neither of which have any regard for valuation or fundamentals.
Investor: Blackrock Vanguard Royce & Associates
Barrow,Hanley,
Mewhinney and Strauss
Invesco TrigranInvestments Baron Capital
Investment Style: Index, ETF Index, ETF
Fundamental Growth
Mutual Fund
Fundamental Value
Fundamental Growth Mutual Hedge Fund
Fundamental Growth
Mutual Fund
Ownership Trend:
2011 6.3% -- 9.6% 5.0% -- -- --
2012 7.3% -- -- 5.3% -- -- 5.4%
2013 7.3% -- -- 5.3% -- -- 5.4%
2014 8.9% 5.5% 6.1% 8.3% 5.6% -- 0.3%
2015 8.9% 6.1% 7.5% 7.3% -- 6.3% 0.3%
2016 8.0% 6.0% 5.3% 6.1% -- -- 1.6%
2017 10.8% 6.7% -- -- -- -- 2.5%
Source: Mercury Proxy Statements, >5% beneficial owners
41
Terrible Risk/Reward Owning MRCY: Analysts See 25% Upside
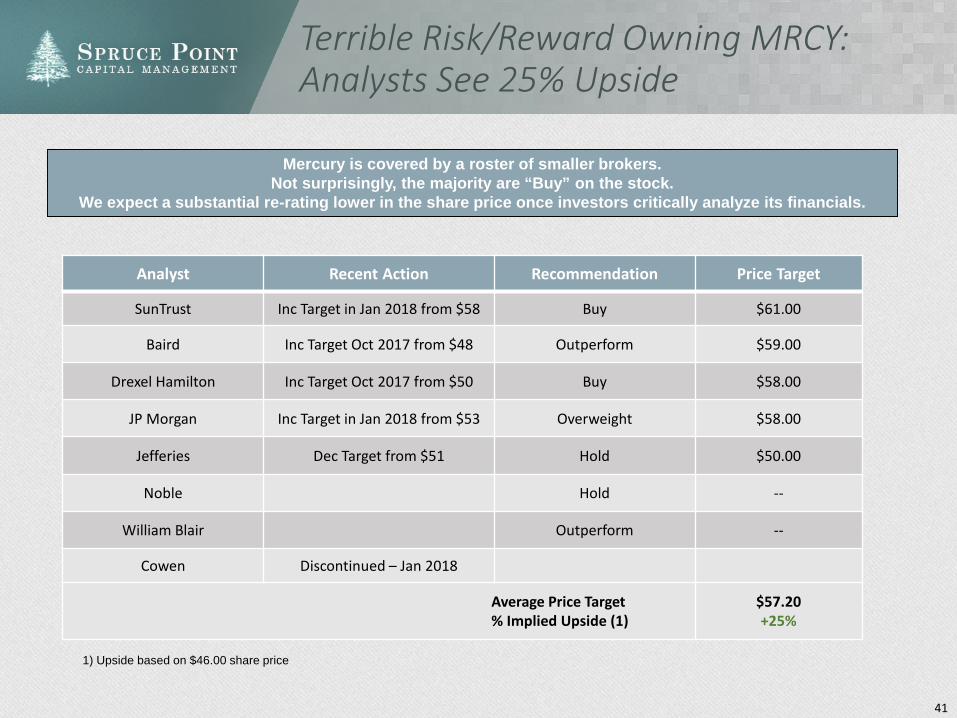
Analyst Recent Action Recommendation Price Target
SunTrust Inc Target in Jan 2018 from $58 Buy $61.00
Baird Inc Target Oct 2017 from $48 Outperform $59.00
Drexel Hamilton Inc Target Oct 2017 from $50 Buy $58.00
JP Morgan Inc Target in Jan 2018 from $53 Overweight $58.00
Jefferies Dec Target from $51 Hold $50.00
Noble Hold --
William Blair Outperform --
Cowen Discontinued – Jan 2018
Average Price Target% Implied Upside (1)
$57.20+25%
Mercury is covered by a roster of smaller brokers. Not surprisingly, the majority are “Buy” on the stock.
We expect a substantial re-rating lower in the share price once investors critically analyze its financials.
1) Upside based on $46.00 share price

42
0.0x
1.0x
2.0x
3.0x
4.0x
5.0x
6.0x
Dec
-13
Mar
-14
Jun-
14
Sep-
14
Dec
-14
Mar
-15
Jun-
15
Sep-
15
Dec
-15
Mar
-16
Jun-
16
Sep-
16
Dec
-16
Mar
-17
Jun-
17
Sep-
17
Dec
-17
Curr
ent 0.0x
5.0x
10.0x
15.0x
20.0x
25.0x
Dec
-13
Mar
-14
Jun-
14
Sep-
14
Dec
-14
Mar
-15
Jun-
15
Sep-
15
Dec
-15
Mar
-16
Jun-
16
Sep-
16
Dec
-16
Mar
-17
Jun-
17
Sep-
17
Dec
-17
Curr
ent 0.0x
0.5x
1.0x
1.5x
2.0x
2.5x
3.0x
3.5x
4.0x
Dec
-13
Mar
-14
Jun-
14
Sep-
14
Dec
-14
Mar
-15
Jun-
15
Sep-
15
Dec
-15
Mar
-16
Jun-
16
Sep-
16
Dec
-16
Mar
-17
Jun-
17
Sep-
17
Dec
-17
Curr
ent
Irrational Valuation Expansion
Source: MRCY Financial Statements, CapitaIIQ
Enterprise Value / NTM Revenues Enterprise Value / NTM EBITDA Price / Book Value
Current investors are paying a significant premium to the Company’s historical valuation.Spruce Point finds it difficult to explain its valuation expansion in light of the Company’s signs of financial strain, pending loss of its small business designation, allegations of cost overruns at its biggest revenue
program, abrupt management departures and insider selling.
AverageAverage
Average

43
Mercury Trading At An Unjustified Premium To Its Peers
Mercury’s valuation is by far the highest in the aerospace and defense industry. We believe the valuation is being driven by the belief its EBITDA margins and revenue growth rate are superior to peers. However, we have detailed our concerns about margin overstatement, and believe most of the revenue growth is acquired (inorganic), which should
not be valued at the same rate as pure organic growth.
$ in millions except per share figures
Source: Company filings, Wall St and Spruce Point estimates
Stock % of '18E-'19E LTM 2018E Enterprise Value NetPrice 52-wk Ent. Sales EPS Free Cash EBITDA P/E EBITDA Sales FCF Price/ Debt/ Dividend
Tier Name (Ticker) 4/18/2018 High Value Growth Growth Flow Margin Margin 2018E 2019E 2018E 2019E 2018E 2019E LTM Book 18E EBITDA Yield
Tier 1 Lockheed Martin (LMT) $349.14 97% $110,556 4.7% 16.0% 10.4% 15.6% 22.4x 19.3x 13.9x 12.8x 2.2x 2.1x 20.9x NM 1.4x 2.3%Tier 1 General Dynamics (GD) $221.40 96% $66,734 9.1% 12.0% 11.1% 14.4% 19.8x 17.6x 13.7x 12.5x 2.0x 1.8x 19.3x 5.8x 0.2x 1.7%Tier 1 Northrop Grumman (NOC) $355.04 98% $65,859 10.1% 14.8% 6.5% 15.0% 22.6x 19.7x 15.6x 13.9x 2.3x 2.1x 39.1x 8.8x 1.0x 1.2%Tier 1 Harris Corp (HRS) $166.96 100% $23,316 6.7% 17.0% 5.0% 23.9% 23.4x 20.0x 15.4x 14.1x 3.7x 3.5x 43.7x 6.6x 2.3x 1.4%Tier 1 L-3 Technologies (LLL) $213.92 98% $19,384 5.9% 13.8% 8.3% 13.4% 22.3x 19.6x 14.4x 13.2x 1.9x 1.8x 22.1x 3.3x 2.0x 1.5%Tier 1 Orbital ATK (OA) $132.73 99% $8,950 6.2% 10.9% 5.8% 15.9% 19.5x 17.6x 11.4x 10.9x 1.8x 1.7x 32.5x 3.7x 1.6x 1.0%Tier 2 Flir Systems (FLIR) $52.95 99% $7,321 5.1% 10.4% 14.8% 25.1% 25.3x 23.0x 16.6x 15.4x 4.2x 4.0x 27.5x 3.9x 0.0x 1.2%Tier 1 SAIC (SAIC) $84.12 94% $4,503 3.6% 9.1% 4.4% 7.3% 19.6x 18.0x 13.5x 12.7x 1.0x 1.0x 23.1x 11.2x 2.7x 1.5%Tier 2 CACI Int'l (CACI) $157.45 99% $4,967 3.4% 12.2% 5.9% 8.8% 19.3x 17.2x 12.4x 11.9x 1.1x 1.1x 19.2x 2.0x 2.7x 0.0%Tier 2 Esterline (ESL) $75.60 74% $2,690 2.2% 20.1% 6.7% 14.6% 19.2x 16.0x 8.9x 8.2x 1.3x 1.3x 19.9x 1.3x 1.5x 0.0%Tier 2 AAR Corp (AIR) $44.72 98% $1,688 9.1% 22.5% 2.3% 8.2% 19.0x 15.5x 10.2x 8.9x 0.8x 0.8x 40.3x 1.7x 1.0x 0.7%Tier 2 Ultra Electronics (ULE LN) $19.67 70% $1,580 4.0% 8.5% 9.1% 17.0% 12.0x 11.0x 8.3x 7.9x 1.4x 1.4x 17.3x 2.1x 0.5x 3.6%Tier 2 ManTech (MANT) $60.53 97% $1,413 7.2% 10.6% 7.1% 8.4% 30.0x 27.2x 8.8x 8.3x 0.7x 0.7x 11.6x 1.9x -0.9x 1.7%
Max 10.1% 22.5% 14.8% 25.1% 30.0x 27.2x 16.6x 15.4x 4.2x 4.0x 43.7x 11.2x 2.7x 3.6%Average 6.0% 13.7% 7.5% 14.4% 21.1x 18.6x 12.6x 11.6x 1.9x 1.8x 25.9x 4.3x 1.2x 1.4%Min 2.2% 8.5% 2.3% 7.3% 12.0x 11.0x 8.3x 7.9x 0.7x 0.7x 11.6x 1.3x -0.9x 0.0%
Tier 2 Mercury Systems (MRCY) $46.00 84% $2,367 16.2% 10.3% 5.5% 24.4% 31.5x 28.6x 19.4x 16.8x 4.7x 4.1x 39.2x 3.0x 1.2x 0.0%

44
0.0%2.0%4.0%6.0%8.0%
10.0%12.0%14.0%16.0%18.0%
0.0%
2.0%
4.0%
6.0%
8.0%
10.0%
12.0%
14.0%
16.0%
Mercury Trading At An Unjustified Premium To Its Peers (Cont’d)
2018E Revenue Growth LTM Free Cash Flow Margin
EV / 2018E EBITDA EV / 2018E Sales
MRCY’s valuation premium relative to its average organic revenue growth, and low free cash flow margin, make little sense
Excluding Themis + Delta
Contribution
0.0x
5.0x
10.0x
15.0x
20.0x
25.0x
0.0x0.5x1.0x1.5x2.0x2.5x3.0x3.5x4.0x4.5x5.0x
Average
Average
AverageAverage

45
Spruce Point Estimates 50% – 85% Downside
Valuation Low Price High Price Note
Sales MultipleCY 2018E Sales
Enterprise ValuePlus: CashLess: DebtDil. Shares
Price Target% Downside
1.5x$495.0$705.0$40.9
($188.9)48.2
$12.32/sh-73%
2.5x$505.0
$1,225.0$40.9
($188.9)48.2
$23.10/sh-50%
Mercury’s current EV/2018E sales multiple of 4.7x is astronomically high relative to peers on the belief that its ~16% revenue growth is the fastest in the
industry. However, a majority of the growth in 2018 is coming from the acquisition of Themis. In our
opinion, Mercury overpaid for Themis to cover-up financial problems. Excluding contributions from
Themis (and to a lesser extent Delta Microwave), we estimate just 6.5% underlying organic growth in CY
2018, below the long-term average of 9.5% (1)
Multiple of Free Cash FlowCY 2018E Free Cash Flow
Enterprise ValuePlus: CashLess: DebtDil. Shares
Price Target% Downside
20.0x$26.0
$520.0$40.9
($188.9)48.2
$7.71/sh-83%
25.0x$28.0
$700.0$40.9
($188.9)48.2
$11.44/sh-75%
We estimate Themis contributes net $2.7m of free cash flow ($7.2m of free cash flow, reduced by
$4.5m of incremental interest expense) per Mercury’s pro forma disclosures. We also adjust for incremental rent expense of $1.7m. Peers trade at
an average of 25x EV/FCF, but MRCY should trade at a discount given its inability to increase free cash
flow for three years
$ in millions, except per share amounts
Given our concerns about the reliability of Mercury’s Adjusted EBITDA, we believe the most conservative way to value the Company is on its stagnant free cash flow.
1) Mercury’s CY 2017 reported revenues of $446.9m are reduced by $28.5m [Delta Microwave ($9.5m, closed on 4/3/17) and Creative ($19m, closed 11/2/16)]. Pro forma CY 2017 revenues excluding acquisitions are $418.4m Themis CY 2017 revenues estimated at $57m by Mercury and the deal closed 2/1/18. Wall St CY 2018 estimates for MRCY are $501m. Removing $52m of Themis revenue contribution and $3.2m of Delta contribution equals $445.7m of CY 2018 revenues. Therefore, pro forma organic revenue growth is estimated as ($445.8/$418.4/)-1 = 6.5%. Note: Analysis conservatively assumes no growth in Themis CY 2018 sales and excludes the small Richland acquisition which Mercury has not disclosed sales.
Note: Downside Based on $46/share