full file at ... · 146 chapter 2 functions section 2.1 functions 146 2 1 a 1 1 41. g t 1 t 2 , so...
TRANSCRIPT

x 1 .
6
11. f x 2x 3: Multiply by 2, then add 3. 12. g x
13. h x 5 x 1 : Add 1, then multiply by 5. 14. k x
: Add 2, then divide by 3. 3
x 2 4 : Square, then subtract 4, then divide by 3.
3 141
Full file at https://testbank123.eu/Solutions-Manual-for-Precalculus-Mathematics-for-Calculus-7th-Edition-Stewart
Full file at https://testbank123.eu/Solutions-Manual-for-Precalculus-Mathematics-for-Calculus-7th-Edition-Stewart

142 CHAPTER 2 Functions SECTION 2.1 Functions 142
x g x
3
2
0
1
3
2 3 3 3
2 2 3 1
2 0 3 3
2 1 3 5
2 3 3 9
2 6 6
5
.
15. Machine diagram for f x x 1.
subtract 1,
16. Machine diagram for f x 3
. x 2
1 then take 0 square root
subtract 2, 3 take reciprocal, 3
multiply by 3
subtract 1,
2 then take 1 square root
subtract 1,
5 then take 2 square root
subtract 2,
_1 take reciprocal, _1 multiply by 3
subtract 2,
1 take reciprocal, _3 multiply by 3
17. f x 2 x 1 2 18. g x 2x 3
x f x
1
0
1
2
3
2 1 1 2 8
2 1 2 2
2 1 1 2 0
2 2 1 2 2
2 3 1 2 8
19. f x x 2 6; f 3 3 2 6 9 6 3; f 3 32 6 9 6 3; f 0 02 6 6;
f 1
1
1 23
2 2 4 4
20. f x x 3 2x ; f 2 2 3 2 2 8 4 2; f 1 1 3 2 1 1 2 3;
3f 0 03 2 0 0; f
1
1
2 1
1 1 9 .
2 2 2 8 8
1 2x 1 2 2
1 2 2
5 1
1 2 1 2
1 2a
21. f x ; f 2 3 3
; f 2 3
3
; f 2 3
0; f a 3
;
f a 1 2 a
3
1 2a ; f a 1
3
1 2 a 1
3
3 2a .
3
x 2 4 22 4 8 2 2 4 8 a2 4 x 2 4 x 2 4
22. h x ; h 2 5 5
5
; h 2 5
5
; h a
2
; h x 5 5
;
a 2 2 4
a2 4a 8 x
4 x 4
h a 2 ; h 5 5
x
5 5
.
23. f x x 2 2x ; f 0 02 2 0 0; f 3 32 2 3 9 6 15; f 3 3 2 2 3 9 6 3;
f a a2 2 a a2 2a; f x x 2 2 x x 2 2x ; f
1
a
1 2
a
1
1
2 a
a2
2 a
.
1 1 1
5 1 1 1 1 5
24. h x x x
; h 1 1 1
1 1 2; h 2 2 2
2
; h 2
2
1
2
Full file at https://testbank123.eu/Solutions-Manual-for-Precalculus-Mathematics-for-Calculus-7th-Edition-Stewart
Full file at https://testbank123.eu/Solutions-Manual-for-Precalculus-Mathematics-for-Calculus-7th-Edition-Stewart

143 CHAPTER 2 Functions SECTION 2.1 Functions 143
2
2 2
;
h x 1 x 1 x 1
1
; h 1 x
1 1
x 1
x
1 x
x .
Full file at https://testbank123.eu/Solutions-Manual-for-Precalculus-Mathematics-for-Calculus-7th-Edition-Stewart
Full file at https://testbank123.eu/Solutions-Manual-for-Precalculus-Mathematics-for-Calculus-7th-Edition-Stewart

144 CHAPTER 2 Functions SECTION 2.1 Functions 144
2
3
2
1
1; f x 2
2
9
1
1
2
.
2
2
3
2 1
.
3
1 x
1 2 1 1
1 1
1
1
1
2 2 1
25. g x
; g 2 x 1 2
3
3
; g 1
1 1 , which is undefined; g
2 1 1
2
3 2
3
;
1 a 1 a 1 a 1 1 a 1 2 a 2 1 x 1 2 x 2
g a 1 a
1 a ; g a 1
1 a 1 1 a 1
; g x 1 a
1 x 2 1
x 2
t 2 2 2 2 2 0 2 a 2
26. g t t
; g 2
2 2 0; g 2
2 2 , which is undefined; g 0
0 2 1; g a ;
a 2
g a2 2
a2 2 2
a2 2 2
a2
a2 4
; g a 1 a 1 2
a 1 2
a 3 .
a 1
27. k x x 2 2x 3; k 0 02 2 0 3 3; k 2 2 2 2 3 ; k 2 2 2 2 2 3 3;
k 2 2
2 2 2
3 1 2 2; k a 2 a 2 2 2 a 2 3 a2 6a 5;
k x x 2 2 x 3 x 2 2x 3; k x 2
x 2 2 x 2
3 x 4 2x 2 3.
28. k x 2x 3 3x 2 ; k 0 2 0 3 0 2 0; k 3 2 3 3 3 2 27; k 3 2 3 3 3 2 81;
k 1
2
1
3 1
; k
a a 3
a 2
a3 3a2
; k x 2 x 3 3 x 2 2x 3 3x 2 ;
2 2 2 2 2 2 2 4 3 2
k x 3
2 x 3 3 x 3 2x 9 3x 6.
29. f x 2 x 1 ; f 2 2 2 1 2 3 6; f 0 2 0 1 2 1 2;
f 1
2
1
1
2
1
1; f 2 2 2 1 2 1 2; f x 1 2 x 1 1 2 x ;
2 2 2
f x 2 2
2 x 2 2
1
2 x 2 1
2x 2 2 (since x 2 1 0 ).
x 2 2
1 1
30. f x x
; f 2
2
1; f 1
1
1; f x is not defined at x 0;
2
f 5 5 5
5 x x 2
5 x 2
x 2
1 since x 2 0, x 0; f
1
x
1 x
1 x
x
x
31. Since 2 0, we have f 2 2 2 4. Since 1 0, we have f 1 1 2 1. Since 0 0, we have
f 0 0 1 1. Since 1 0, we have f 1 1 1 2. Since 2 0, we have f 2 2 1 3.
32. Since 3 2, we have f 3 5. Since 0 2, we have f 0 5. Since 2 2, we have f 2 5. Since 3 2, we
have f 3 2 3 3 3. Since 5 2, we have f 5 2 5 3 7.
33. Since 4 1, we have f 4 4 2 2 4 16 8 8. Since 3 1, we have
f 3
3
2 3 2
2
2 2 3 . Since 1 , we have f 1 1 2 1 1 2 1. Since
2 4 4
1 0 1, we have f 0 0. Since 25 1, we have f 25 1.
34. Since 5 0, we have f 5 3 5 5. Since 0 0 2, we have f 0 0 1 1. Since 0 1 2, we have
Full file at https://testbank123.eu/Solutions-Manual-for-Precalculus-Mathematics-for-Calculus-7th-Edition-Stewart
Full file at https://testbank123.eu/Solutions-Manual-for-Precalculus-Mathematics-for-Calculus-7th-Edition-Stewart

145 CHAPTER 2 Functions SECTION 2.1 Functions 145
f 1 1 1 2. Since 0 2 2, we have f 2 2 1 3. Since 5 2, we have f 5 5 2 2 9.
35. f x 2 x 2 2 1 x 2 4x 4 1 x 2 4x 5; f x f 2 x 2 1 2 2 1 x 2 1 4 1 x 2 6.
36. f 2x 3 2x 1 6x 1; 2 f x 2 3x 1 6x 2.
37. f x 2
x 2 4; f x
2 [x 4]2 x 2 8x 16.
38. f x 3
6 x 3
18
2x
f x 18;
3
6x 18
3
3 2x 6
3 2x 6
39. f x 3x 2, so f 1 3 1 2 1 and f 5 3 5 2 13. Thus, the net change is f 5 f 1 13 1 12.
40. f x 4 5x , so f 3 4 5 3 11 and f 5 4 5 5 21. Thus, the net change is
f 5 f 3 21 11 10.
Full file at https://testbank123.eu/Solutions-Manual-for-Precalculus-Mathematics-for-Calculus-7th-Edition-Stewart
Full file at https://testbank123.eu/Solutions-Manual-for-Precalculus-Mathematics-for-Calculus-7th-Edition-Stewart

146 CHAPTER 2 Functions SECTION 2.1 Functions 146
1
1
1
41. g t 1 t 2 , so g 2 1 2 2 1 4 3 and g 5 1 52 24. Thus, the net change is
g 5 g 2 24 3 21.
42. h t t 2 5, so h 3 3 2 5 14 and h 6 62 5 41. Thus, the net change is h 6 h 3 41 14 27.
43. f a 5 2a; f a h 5 2 a h 5 2a 2h;
f a h f a
h
5 2a 2h 5 2a
h
5 2a 2h 5 2a
h
2h
h 2.
44. f a 3a2 2; f a h 3 a h 2 2 3a2 6ah 3h2 2;
3a2 6ah 3h2 2
3a2 2
2f a h f a
h
6ah 3h
h h
6a 3h
45. f a 5; f a h 5;
1
f a h f a
h
1
5 5
h 0.
46. f a a
; f a h
; a h 1
1 1 a 1 a h 1
f a h f a
h a h 1
a 1
h h
a 1 a h 1
a 1 a h 1
h
a 1 a h 1 1 .
47. f a a
a ; f a h
h
a 1 a h 1
a h ;
a h 1
a h a a h a 1 a a h 1
f a h f a
h a h 1
a 1
h
a h 1 a 1
a h 1 a 1
h
a h a 1 a a h 1
a h 1 a 1
a2 a ah h a2 ah a
h
1
h a h 1 a 1
a h 1 a 1
2a 2 a h48. f a
a ; f a h
;
a h 1
2 a h 2a 2a 2h a 1 2a a h 1
f a h f a
h a h 1
a 1
h
a h 1 a 1
a h 1 a 1
h
2 a h a 1 2a a h 1
a h 1 a 1 h
2a2 2ah 2a 2h 2a2 2ah 2a
h a h 1 a 1
2h 2 h a h 1 a 1
a h 1 a 1
49. f a 3 5a 4a2;
f a h 3 5 a h 4 a h 2 3 5a 5h 4 a2 2ah h2
3 5a 5h 4a2 8ah 4h2 ;
Full file at https://testbank123.eu/Solutions-Manual-for-Precalculus-Mathematics-for-Calculus-7th-Edition-Stewart
Full file at https://testbank123.eu/Solutions-Manual-for-Precalculus-Mathematics-for-Calculus-7th-Edition-Stewart

147 CHAPTER 2 Functions SECTION 2.1 Functions 147
3 5a 5h 4a2 8ah 4h2
3 5a 4a2f a h f a
h
h
3 5a 5h 4a2 8ah 4h2 3 5a 4a2
h h 5 8a 4h
h 5 8a 4h.
5h 8ah 4h2
h
Full file at https://testbank123.eu/Solutions-Manual-for-Precalculus-Mathematics-for-Calculus-7th-Edition-Stewart
Full file at https://testbank123.eu/Solutions-Manual-for-Precalculus-Mathematics-for-Calculus-7th-Edition-Stewart

148 CHAPTER 2 Functions SECTION 2.1 Functions 148
2
3
3
6
3
7
x
2
.
3
50. f a a3 ; f a h a h 3 a3 3a2 h 3ah2 h3;
a3 3a2 h 3ah2 h3
a3 2 2 3f a h f a
h
h
h 3a2 3ah h2
3a h 3ah h
h
h
3a
3ah h .
51. f x 3x . Since there is no restriction, the domain is all real numbers, . Since every real number y is three
times the real number 1 y, the range is all real numbers .
52. f x 5x 2 4. Since there is no restriction, the domain is all real numbers, . Since 5x 2 0 for all x ,
5x 2 4 4 for all x , so the range is [4 .
53. f x 3x , 2 x 6. The domain is [ 2 6], f 2 3 2 6, and f 6 3 6 18, so the range is [ 6 18].
54. f x 5x 2 4, 0 x 2. The domain is [0 2], f 0 5 0 2 4 4, and f 2 5 2 2 4 24, so the range is
[4 24].
55. f x
x 1
. Since the denominator cannot equal 0 we have x 3 0 x 3. Thus the domain is x x 3 . In
interval notation, the domain is 3 3 .
156. f x
3x . Since the denominator cannot equal 0, we have 3x 6 0 3x 6 x 2. In interval notation, the
domain is 2 2 .
x 2 2 257. f x x 2
. Since the denominator cannot equal 0 we have x 1
1 0 x 1 x 1. Thus the domain is
x x 1 . In interval notation, the domain is 1 1 1 1 .
58. f x
x 2
x 4
x 6
. Since the denominator cannot equal 0, x 2
x 6 0 x 3 x 2 0 x 3 or x 2.
In interval notation, the domain is 3 3 2 2 .
59. f x x 1. We must have x 1 0 x 1. Thus, the domain is [ 1 .
60. g x x 2 9. The argument of the square root is positive for all x , so the domain is .
61. f t 3 t 1. Since the odd root is defined for all real numbers, the domain is the set of real numbers, .
62. g x 7 3x . For the square root to be defined, we must have 7 3x 0 7 3x 7 x . Thus the domain is
3
63. f x 1 2x . Since the square root is defined as a real number only for nonnegative numbers, we require that
1 2x 0 x 1 . So the domain is x x 1 . In interval notation, the domain is
1 .
2 2
2
64. g x x 2 4. We must have x 2 4 0 x 2 x 2 0. We make a table:
2 2 2 2
Sign of x 2
Sign of x 2
Sign of x 2 x 2
Thus the domain is ] [2 .
2 x65. g x . We require 2 x 0, and the denominator cannot equal 0. Now 2 x 0 x 2, and 3 x 0
x 3. Thus the domain is x x 2 and x 3 , which can be expressed in interval notation as [ 2 3 3 .
Full file at https://testbank123.eu/Solutions-Manual-for-Precalculus-Mathematics-for-Calculus-7th-Edition-Stewart
Full file at https://testbank123.eu/Solutions-Manual-for-Precalculus-Mathematics-for-Calculus-7th-Edition-Stewart

149 CHAPTER 2 Functions SECTION 2.1 Functions 149
x
6
4
9
66. g x
2x 2
x
x 1
. We must have x 0 for the numerator and 2x 2
x 1 0 for the denominator. So 2x 2
x 1 0
2x 1 x 1 0 2x 1 0 or x 1 0 x 1 or x 1. Thus the domain is 0 1
1 .
2 2 2
67. g x
a table:
x 2 6x . Since the input to an even root must be nonnegative, we have x 2 6x 0 x x 6 0. We make
0 0 6 6
Sign of x
Sign of x 6
Sign of x x 6
Thus the domain is 0] 6 .
68. g x x 2 2x 8. We must have x 2 2x 8 0 x 4 x 2 0. We make a table:
2 2 4 4
Sign of x 4
Sign of x 2
Sign of x 4 x 2
Thus the domain is ] [4 .
3 69. f x
. Since the input to an even root must be nonnegative and the denominator cannot equal 0, we have 4
x 4 0 x 4. Thus the domain is 4 .
x 2 70. f x
. Since the input to an even root must be nonnegative and the denominator cannot equal 0, we have
x
6 x 0 6 x . Thus the domain is 6 .
x 1 2
71. f x 2x
. Since the input to an even root must be nonnegative and the denominator cannot equal 0, we have 1
2x 1 0 x 1 . Thus the domain is 1 .
2 2
x 72. f x
4
. Since the input to an even root must be nonnegative and the denominator cannot equal 0, we have x 2
9 x 2 0 3 x 3 x 0. We make a table:
Interval 3 3 3 3
Sign of 3 x
Sign of 3 x
Sign of x 4 x 2
Thus the domain is 3 3 .
Full file at https://testbank123.eu/Solutions-Manual-for-Precalculus-Mathematics-for-Calculus-7th-Edition-Stewart
Full file at https://testbank123.eu/Solutions-Manual-for-Precalculus-Mathematics-for-Calculus-7th-Edition-Stewart

150 CHAPTER 2 Functions SECTION 2.1 Functions 150
x f x
4
6
8
3
2
8 3 10 3
x g x
4
6
8
2
0
3 2
3
2
4
6
8
0 16
0 32
0 48
0 64
x f x
2
4
6
8
4 3
4 2 32
3 33 5
36 113
256
3 268
3
4
6
73. To evaluate f x , divide the input by 3 and add 2 to the result.
x 2 y(a) f x 3
3
(b)
(c)
1
1 x
74. To evaluate g x , subtract 4 from the input and multiply the result by 3 .
(a) g x x 4 3 3 x 4
(c) y
4 4
(b)
1
1 x
75. Let T x be the amount of sales tax charged in Lemon County on a purchase of x dollars. To find the tax, take 8% of the
purchase price.
(a) T x 0 08x
(b)
(c) y
1
1 x
76. Let V d be the volume of a sphere of diameter d . To find the volume, take the cube of the diameter, then multiply b
and divide by 6.
(a) V d d 3 6 d 3 (c) y
(b)
10
1 x
Full file at https://testbank123.eu/Solutions-Manual-for-Precalculus-Mathematics-for-Calculus-7th-Edition-Stewart
Full file at https://testbank123.eu/Solutions-Manual-for-Precalculus-Mathematics-for-Calculus-7th-Edition-Stewart

151 CHAPTER 2 Functions SECTION 2.1 Functions 151
x V x
0 50
5 28 125
10 12 5
15 3 125
20 0
x R x
1 2
10 1 66
100 1 48
200 1 44
500 1 41
1000 1 39
r r
0
0 1
0 2
0 3
0 4
0 5
4625
4440
3885
2960
1665
0
79. (a) V 0 50 1 0 50 and V 20 50 1 20
77. f x
1 if x is rational
5 if x is irrational
The domain of f is all real numbers, since every real number is either rational or
irrational; and the range of f is 1 5 . 1 if x is rational
78. f x 5x if x is irrational
The domain of f is all real numbers, since every real number is either rational or
irrational. If x is irrational, then 5x is also irrational, and so the range of f is x x 1 or x is irrational .
2 2
20 20
0.
(c)
(b) V 0 50 represents the volume of the full tank at time t 0, and
V 20 0 represents the volume of the empty tank twenty minutes
later.
(d) The net change in V as t changes from 0 minutes to 20 minutes is
V 20 V 0 0 50 0 gallons.
80. (a) S 2 4 2 2 16 50 27, S 3 4 3 2 36 113 10.
(b) S 2 represents the surface area of a sphere of radius 2, and S 3 represents the surface area of a sphere of radius 3.
81. (a) L 0 5c 10 1 0 5c 2
c2 8 66 m, L 0 75c 10 1
0 75c 2
c2 6 61 m, and
L 0 9c 10 1
0 9c 2
c2 4 36 m.
(b) It will appear to get shorter. 13 7 1 0 4
20
82. (a) R 1 1 4 1 0 4 5
2 mm,
(b)
13 7 10 0 4
R 10 1 4 10 0 4
1 66 mm, and
13 7 100 0 4
R 100 1 4 100 0 4
1 48 mm.
(c) The net change in R as x changes from 10 to 100 is
R 100 R 10 1 48 1 66 0 18 mm.
83. (a) 0 1 18500 0 25 0 12
4440,
0 4 18500 0 25 0 42
1665.
(b) They tell us that the blood flows much faster (about 2 75 times faster)
0 1 cm from the center than 0 1 cm from the edge.
(d) The net change in V as r changes from 0 1 cm to 0 5 cm is
V 0 5 V 0 1 0 4440 4440 cm s.
(c)
84. (a) D 0 1
D 0 2
2 3960 0 1 0 1 2 792 01 28 1 miles
2 3960 0 2 0 2 2 1584 04 39 8 miles
Full file at https://testbank123.eu/Solutions-Manual-for-Precalculus-Mathematics-for-Calculus-7th-Edition-Stewart
Full file at https://testbank123.eu/Solutions-Manual-for-Precalculus-Mathematics-for-Calculus-7th-Edition-Stewart

152 CHAPTER 2 Functions SECTION 2.1 Functions 152
5280
(b) 1135 feet 1135 miles 0 215 miles. D 0 215
2 3960 0 215 0 215 2 1702 846 41 3 miles
(c) D 7 2 3960 7 7 2 55489 235 6 miles
(d) The net change in D as h changes from 1135 ft (or 0 215 mi) to 7 mi is D 7 D 0 215 235 6 41 3 194 3 miles.
85. (a) Since 0 5,000 10,000 we have T 5,000 0. Since 10,000 12,000 20,000 we have
T 12,000 0 08 12,000 960. Since 20,000 25,000 we have T 25,000 1600 0 15 25,000 5350.
(b) There is no tax on $5000, a tax of $960 on $12,000 income, and a tax of $5350 on $25,000.
86. (a) C 75 75 15 $90; C 90 90 15 $105; C 100 $100; and C 105 $105.
(b) The total price of the books purchased, including shipping.
87. (a) T x
75x if 0 x 2
150 50 x 2 if x 2
(b) T 2 75 2 150; T 3 150 50 3 2 200; and T 5 150 50 5 2 300.
(c) The total cost of the lodgings.
15 40 x if 0 x 40
88. (a) F x 0 if 40 x 65
15 x 65 if x 65
(b) F 30 15 40 10 15 10 $150; F 50 $0; and F 75 15 75 65 15 10 $150.
(c) The fines for violating the speed limits on the freeway.
89. We assume the grass grows linearly.
h
0 W W W W t
90. T
0 t
91. T
60
50
0 5 10 t
Full file at https://testbank123.eu/Solutions-Manual-for-Precalculus-Mathematics-for-Calculus-7th-Edition-Stewart
Full file at https://testbank123.eu/Solutions-Manual-for-Precalculus-Mathematics-for-Calculus-7th-Edition-Stewart

150 CHAPTER 2 Functions SECTION 2.2 Graphs of Functions 150
x f x x y
2
1
0
1
2
2
1
2
1
2
2 2
1 1
0 2
1 1
2 2
x f x x 2
6
4
2
0
2
4
6
4
2
0
2
4
6
8
x f x 4 2x
2
1
0
1
2
3
4
8
6
4
2
0
2
4
92. Population
(×1000)
P
1000 900
800
700
600
0 1980 1990 2000 2010 t
Year
93. Answers will vary.
94. Answers will vary.
95. Answers will vary.
2.2 GRAPHS OF FUNCTIONS
1. To graph the function f we plot the points x f x in a
coordinate plane. To graph f x x 2 2, we plot the
points x x 2 2 . So, the point 3 32 2
3 7 is
on the graph of f . The height of the graph of f above the
x -axis when x 3 is 7.
y
1
0 1 x
2. If f 4 10 then the point 4 10 is on the graph of f .
3. If the point 3 7 is on the graph of f , then f 3 7.
4. (a) f x x 2 is a power function with an even exponent. It has graph IV.
(b) f x x 3 is a power function with an odd exponent. It has graph II.
(c) f x x is a root function. It has graph I.
(d) f x x is an absolute value function. It has graph III.
y y
1 1
1 x 1 x
Full file at https://testbank123.eu/Solutions-Manual-for-Precalculus-Mathematics-for-Calculus-7th-Edition-Stewart
Full file at https://testbank123.eu/Solutions-Manual-for-Precalculus-Mathematics-for-Calculus-7th-Edition-Stewart

151 CHAPTER 2 Functions SECTION 2.2 Graphs of Functions 151
x f x x 3,
3 x 3
3
2
0
1
2
3
6
5
3
2
1
0
x
f x x 3
, 2
0 x 5
0
1
2
3
4
5
1 5
1
0 5
0
0 5
1
x f x x 2
4
3
2
1
0
16
9
4
1
0
x f x x 2 4
5
4
3
2
1
0
21
12
5
0
3
4
y
1
1
y
1
1
x g x x 1 2
5
3
2
1
0
1
3
16
4
1
0
1
4
16
x g x x 2 2x 1
5
3
2
1
0
1
3
16
4
1
0
1
4
16
y
10
_1 0 1 x
x r x 3x 4
3
2
1
0
1
2
3
243
48
3
0
3
48
243
x r x 1 x 4
3
2
1
0
1
2
3
80
15
0
1
0
15
80
100
0
y
10
1 x
y y
1
1
1 x 1
9. 10.
x x
11. y
5
_1 0
1
_5
12.
x
13. y 14.
_1 0
_10
1 x
Full file at https://testbank123.eu/Solutions-Manual-for-Precalculus-Mathematics-for-Calculus-7th-Edition-Stewart
Full file at https://testbank123.eu/Solutions-Manual-for-Precalculus-Mathematics-for-Calculus-7th-Edition-Stewart

152 CHAPTER 2 Functions SECTION 2.2 Graphs of Functions 152
x g x x 3 8
3
2
1
0
1
2
3
35
16
9
8
7
0
19
x g x x 1 3
2
1
0
1
2
3
4
27
8
1
0
1
8
27
y
10
0
1 x
y
5
1
x k x 3 x
27
8
1
0
1
8
27
3
2
1
0
1
2
3
x k x x 3
27
8
1
0
1
8
27
3
2
1
0
1
2
3
y
1
10 x
y
1
10 x
x f x 1 x
0
1
4
9
16
25
1
2
3
4
5
6
x f x x 2
2
3
6
11
18
27
38
0
1
2
3
4
5
6
x 1
C t t 2
2
1
1 2 1 4
0
1 4 1 2
1
2
1 4
1
4
16
16
4
1
1 4
y
2
2
t
2
3
1
2 1
15. 16.
x
17. 18.
0 0
_1 _1
y
1
10 20 x
1
0 2 10 x
21. y 22.
1 x C t
t 1
3 1
2 1 0
2
2
_1 0 1 t
2
2
0 1
1 1
2 3
Full file at https://testbank123.eu/Solutions-Manual-for-Precalculus-Mathematics-for-Calculus-7th-Edition-Stewart
Full file at https://testbank123.eu/Solutions-Manual-for-Precalculus-Mathematics-for-Calculus-7th-Edition-Stewart

153 CHAPTER 2 Functions SECTION 2.2 Graphs of Functions 153
x H x 2x
5
4
3
2
1
0
10
8
6
4
2
0
x H x x 1
5
4
3
2
1
0
1
4
3
2
1
0
1
2
y
1
1
y
1
1
x G x x x
5
2
0
1
2
5
0
0
0
2
4
10
x G x x x
5
2
1
0
1
3
10
4
2
0
0
0
y
1
1
y
1
1
x f x 2x 2
5
2
0
1
2
5
12
8
2
0
2
8
x f x x x
3
2
1
0
1
2
3
1
1
1
undefined
1
1
1
23. 24.
x x
25. 26.
x x
y y
1 1
1 x 1 x
29. f x 8x x 2
(a) [ 5 5] by [ 5 5]
(b) [ 10 10] by [ 10 10]
4 10
2
-4 -2 2 4 -2
-4
-10 -5 5 10
-10
Full file at https://testbank123.eu/Solutions-Manual-for-Precalculus-Mathematics-for-Calculus-7th-Edition-Stewart
Full file at https://testbank123.eu/Solutions-Manual-for-Precalculus-Mathematics-for-Calculus-7th-Edition-Stewart

154 CHAPTER 2 Functions SECTION 2.2 Graphs of Functions 154
(c) [ 2 10] by [ 5 20] (d) [ 10 10] by [ 100 100]
20 100
10
-10 -5 5 10
-2 2 4 6 8 10 -100
The viewing rectangle in part (c) produces the most appropriate graph of the equation.
30. g x x 2 x 20
(a) [ 2 2] by [ 5 5] (b) [ 10 10] by [ 10 10]
4 10
2
-2 -1 1 2 -2
-4
-10 -5 5 10
-10
(c) [ 7 7] by [ 25 20] (d) [ 10 10] by [ 100 100]
20 100
10
-6 -4 -2 2 4 6 -10
-20
-10 -5 5 10
-100
The viewing rectangle in part (c) produces the most appropriate graph of the equation.
31. h x x 3 5x 4
(a) [ 2 2] by [ 2 2] (b) [ 3 3] by [ 10 10]
2 10
1
-2 -1 1 2 -1
-2
-3 -2 -1 1 2 3
-10
(c) [ 3 3] by [ 10 5] (d) [ 10 10] by [ 10 10]
5 10
-3 -2 -1 1 2 3
-5
-10 -5 5 10
-10 -10
The viewing rectangle in part (c) produces the most appropriate graph of the equation.
Full file at https://testbank123.eu/Solutions-Manual-for-Precalculus-Mathematics-for-Calculus-7th-Edition-Stewart
Full file at https://testbank123.eu/Solutions-Manual-for-Precalculus-Mathematics-for-Calculus-7th-Edition-Stewart

155 CHAPTER 2 Functions SECTION 2.2 Graphs of Functions 155
32 32. k x 1 x 4 x 2 2
(a) [ 1 1] by [ 1 1]
(b) [ 2 2] by [ 2 2]
1 2
1
-1.0 -0.5 0.5 1.0
-1
-2 -1 1 2 -1
-2
(c) [ 5 5] by [ 5 5] (d) [ 10 10] by [ 10 10]
4 10
2
-4 -2 -2
2 4
-4
-10 -5 5 10
-10
The viewing rectangle in part (d) produces the most appropriate graph of the equation.
33. f x
0 if x 2
1 if x 2
y
34. f x
1 if x 1
x 1 if x 1
y
1
2
1 x 1 x
35. f x
3 if x 2
x 1 if x 2
y
36. f x
1 x if x 2
5 if x 2
y
1 1
1 x 1 x
Full file at https://testbank123.eu/Solutions-Manual-for-Precalculus-Mathematics-for-Calculus-7th-Edition-Stewart
Full file at https://testbank123.eu/Solutions-Manual-for-Precalculus-Mathematics-for-Calculus-7th-Edition-Stewart

156 CHAPTER 2 Functions SECTION 2.2 Graphs of Functions 156
37. f x
x if x 0
x 1 if x 0
y
38. f x
2x 3 if x 1
3 x if x 1
y
1 1
1 x 1 x
39. f x
1 if x 1
1 if 1 x 1
1 if x 1
40. f x
1 if x 1
x if 1 x 1
1 if x 1
y y
2
2 1
x 1 x
41. f x
2 if x 1
x 2 if x 1
42. f x
1 x 2 if x 2
x if x 2
y y
1 1
1 x 1 x
43. f x
0 if x 2
3 if x 2
44. f x
x 2 if x 1
1 if x 1
y y
1 1
1 x 1 x
Full file at https://testbank123.eu/Solutions-Manual-for-Precalculus-Mathematics-for-Calculus-7th-Edition-Stewart
Full file at https://testbank123.eu/Solutions-Manual-for-Precalculus-Mathematics-for-Calculus-7th-Edition-Stewart

157 CHAPTER 2 Functions SECTION 2.2 Graphs of Functions 157
45. f x
4 if x 2
x 2 if 2 x 2
x 6 if x 2
46. f x
x if x 0
9 x 2 if 0 x 3
x 3 if x 3
y y
1
1 x
1
1 x
47. f x
x 2 if x 1
x 2 if x 1 5
-6 -4 -2 2 4 6
-5
48. f x
2x x 2 if x 1
x 1 3 if x 1
The first graph shows the output of a typical graphing device. However, the actual graph
of this function is also shown, and its difference from the graphing device’s version should be noted.
y
2 1
1 x
-3 -2 -1 1 2 3
-2
49. f x
2 if x 2
x if 2 x 2
2 if x 2
50. f x
1 if x 1
1 x if 1 x 2
2 if x 2
51. The curves in parts (a) and (c) are graphs of a function of x , by the Vertical Line Test.
52. The curves in parts (b) and (c) are graphs of functions of x , by the Vertical Line Test.
53. The given curve is the graph of a function of x , by the Vertical Line Test. Domain: [ 3 2]. Range: [ 2 2].
54. No, the given curve is not the graph of a function of x , by the Vertical Line Test.
55. No, the given curve is not the graph of a function of x , by the Vertical Line Test.
56. The given curve is the graph of a function of x , by the Vertical Line Test. Domain: [ 3 2]. Range: 2 0 3].
57. Solving for y in terms of x gives 3x 5 y 7 y 3 x 7 . This defines y as a function of x . 5 5
58. Solving for y in terms of x gives 3x 2 y 5 y 3x 2 5. This defines y as a function of x .
59. Solving for y in terms of x gives x y2 y
this equation does not define y as a function of x .
x . The last equation gives two values of y for a given value of x . Thus,
Full file at https://testbank123.eu/Solutions-Manual-for-Precalculus-Mathematics-for-Calculus-7th-Edition-Stewart
Full file at https://testbank123.eu/Solutions-Manual-for-Precalculus-Mathematics-for-Calculus-7th-Edition-Stewart

158 CHAPTER 2 Functions SECTION 2.2 Graphs of Functions 158
c=4 c=2
8
6
4
2
c=6
c=0
0 -4 -2
-2
-4
-6
-8
-10
2 4
c=0 c=1 c=2
c=3
10
8
6
4
2
0 -4 -2
-2
-4
-6
-8
-10
2 4
1
1
60. Solving for y in terms of x gives x 2 y 1 2 4 y 1 2 4 x 2 y 1 4 x 2 y 1 4 x 2.
The last equation gives two values of y for a given value of x . Thus, this equation does not define y as a function of x .
61. Solving for y in terms of x gives 2x 4y2 3 4y2 2x 3 y 2
2x 3. The last equation gives two values
of y for a given value of x . Thus, this equation does not define y as a function of x .
62. Solving for y in terms of x gives 2x 2 4y2 3 4y2 2x 2 3 y 2
2x 2 3. The last equation gives two
values of y for a given value of x . Thus, this equation does not define y as a function of x .
63. Solving for y in terms of x using the Quadratic Formula gives 2xy 5y2 4 5y2 2xy 4 0
y 2x 2x 2 4 5 4
2 5
2x
4x 2
10
80 x x 2
5
20 . The last equation gives two values of y for a
given value of x . Thus, this equation does not define y as a function of x .
64. Solving for y in terms of x gives y 5 x y x 5 2. This defines y as a function of x .
65. Solving for y in terms of x gives 2 x y 0 y 2 x . This defines y as a function of x .
66. Solving for y in terms of x gives 2x y 0 y 2x . Since a a , the last equation gives two values of y for a
given value of x . Thus, this equation does not define y as a function of x .
67. Solving for y in terms of x gives x y3 y 3 x . This defines y as a function of x .
468. Solving for y in terms of x gives x y4 y x . The last equation gives two values of y for any positive value of x .
Thus, this equation does not define y as a function of x .
69. (a) f x x 2 c, for c 0, 2, 4, and 6.
(b) f x x 2 c, for c 0, , 4 , and 6.
10 10
8
6
4
2
c=_2
c=0
c=_4
c=_6
-4 -2
0
-2 2 4
-4
-6
-8
-10
(c) The graphs in part (a) are obtained by shifting the graph of f x x 2 upward c units, c 0. The graphs in part (b)
are obtained by shifting the graph of f x x 2 downward c units.
70. (a) f x x c 2, for c 0, 1, 2, and 3.
(b) f x x c 2, for c 0, 1, 2, and 3.
c=_1
c=_2
c=_3
c=0 10
8
6
4
2
0-4 -2
-2 2 4
-4
-6
-8
-10
(c) The graphs in part (a) are obtained by shifting the graph of y x 2 to the right 1, 2, and 3 units, while the graphs in
part (b) are obtained by shifting the graph of y x 2 to the left 1, 2, and 3 units.
Full file at https://testbank123.eu/Solutions-Manual-for-Precalculus-Mathematics-for-Calculus-7th-Edition-Stewart
Full file at https://testbank123.eu/Solutions-Manual-for-Precalculus-Mathematics-for-Calculus-7th-Edition-Stewart

159 CHAPTER 2 Functions SECTION 2.2 Graphs of Functions 159
10 c=2 c=6
8
6
4
2
-8 -4 -2
-4
-6
-8
4 8
c=0 c=4
c=1 c=4 c=2
8
6
4
2
c=
1 _ 2
0 -4 -2
-2
-4
-6
-8
-10
2 4
10
8
c=1 6
4
2
0 -4 -2
-2
-4
-6
-8
2 4
1
c=__ 2
c=_4 c=_2
3
2
1
1
c=_ 2
c
c= 1 _ 6
1 =_
4
4 -1 0
-1
1 2 3
3
2
1
n=4
n=2
-3 -2 -1 0
-1
-2
-3
1 2 3
2 2
71. (a) f x x c 3, for c 0, 2, 4, and 6. (b) f x x c 3, for c 0, 2, 4, and 6.
c=_4
8
6
4
2
c=0
-8 -4
0
-2 4 8
-4
-6
-8
-10c=_6 c=_2
(c) The graphs in part (a) are obtained by shifting the graph of f x x 3 to the right c units, c 0. The graphs in part (b)
are obtained by shifting the graph of f x x 3 to the left c units, c 0.
72. (a) f x cx 2 , for c 1, 1 , 2, and 4. (b) f x cx 2 , for c 1, , 1 , and 2.
10
-10
(c) As c increases, the graph of f x cx 2 is stretched vertically. As c decreases, the graph of f is flattened. When
c 0, the graph is reflected about the x -axis.
73. (a) f x x c , for c 1 , 1 , and 1 . (b) f x x c , for c 1, 1 , and 1 .2 4 6 3 5
2 c=1
1 1
c= _ 5
1 c=_
3
-1
-2
(c) Graphs of even roots are similar to y x , graphs of odd roots are similar to y 3 x . As c increases, the graph of
y c x becomes steeper near x 0 and flatter when x 1.
1 74. (a) f x
x n , for n 1 and 3.
1 (b) f x
x n , for n 2 and 4.
3
2
1
n=3
n=1
-3 -2 -1 0
-1
-2
-3
1 2 3
Full file at https://testbank123.eu/Solutions-Manual-for-Precalculus-Mathematics-for-Calculus-7th-Edition-Stewart
Full file at https://testbank123.eu/Solutions-Manual-for-Precalculus-Mathematics-for-Calculus-7th-Edition-Stewart

160 CHAPTER 2 Functions SECTION 2.2 Graphs of Functions 160
(b) E
60
50
40
30
20
10
0 100 200 300 400 500 600 x
7
5
5
(c) As n increases, the graphs of y 1 x n go to zero faster for x large. Also, as n increases and x goes to 0, the graphs of
y 1 x n go to infinity faster. The graphs of y 1 x n for n odd are similar to each other. Likewise, the graphs for n
even are similar to each other.
75. The slope of the line segment joining the points 2 1 and 4 6 is m 6 1
4 2
6
. Using the point-slope form,
7 7 7 7 4 7 4
we have y 1 6
x 2 y 6
x 3
1 y 6
x 3
. Thus the function is f x 6
x 3
for
2 x 4.
76. The slope of the line containing the points 3 2 and 6 3 is m 2 3 3 6
5
9
9
. Using the point-slope equation
of the line, we have y 3 5 x 6 y 5 x 10 3 x 1 . Thus the function is f x 5 x 1 , for9
3 x 6.
9 3 9 3 9 3
77. First solve the circle for y: x 2 y2 9 y2 9 x 2 y 9 x 2. Since we seek the top half of the circle, we
choose y 9 x 2. So the function is f x 9 x 2, 3 x 3.
78. First solve the circle for y: x 2 y2 9 y2 9 x 2 y 9 x 2. Since we seek the bottom half of the circle,
we choose y 9 x 2 . So the function is f x 9 x 2, 3 x 3.
79. We graph T r 0 5
for 10 r 100. As the balloon r 2
80. We graph P 14 1 3
for 1 10. As wind speed
is inflated, the skin gets thinner, as we would expect.
0.004
increases, so does power output, as expected.
P
20,000
0.003
0.002
10,000
0.001
0 50 r 0 5 10
81. (a) E x
36 00 0 06 x 300 if 300 x
Full file at https://testbank123.eu/Solutions-Manual-for-Precalculus-Mathematics-for-Calculus-7th-Edition-Stewart
Full file at https://testbank123.eu/Solutions-Manual-for-Precalculus-Mathematics-for-Calculus-7th-Edition-Stewart

161 CHAPTER 2 Functions SECTION 2.2 Graphs of Functions 161
P
1.00
0.80
0.60
0.40
0.20
0
1
2
3
4
x
82. C x
2 00 if 0 x 1
2 20 if 1 x 1 1
2 40 if 1 1 x 1 2
4 00 if 1 9 x 2
C
4.00
3.00
2.00
0 1 2 x
83. P x
0 49 if 0 x 1
0 70 if 1 x 2
0 91 if 2 x 3
1 12 if 3 x 3 5
84. The graph of x y2 is not the graph of a function because both 1 1 and 1 1 satisfy the equation x y2. The graph
of x y3 is the graph of a function because x y3 x 1 3 y. If n is even, then both 1 1 and 1 1 satisfies the
equation x yn , so the graph of x yn is not the graph of a function. When n is odd, y x 1 n is defined for all real
numbers, and since y x 1 n x yn , the graph of x yn is the graph of a function.
85. Answers will vary. Some examples are almost anything we purchase based on weight, volume, length, or time, for example
gasoline. Although the amount delivered by the pump is continuous, the amount we pay is rounded to the penny. An
example involving time would be the cost of a telephone call.
86. y y y
1 1 1
1 x 1 x 1 x
f x [[x ]] g x [[2x ]]
1 h x [[3x ]]
The graph of k x [[nx ]] is a step function whose steps are each n
wide.
Full file at https://testbank123.eu/Solutions-Manual-for-Precalculus-Mathematics-for-Calculus-7th-Edition-Stewart
Full file at https://testbank123.eu/Solutions-Manual-for-Precalculus-Mathematics-for-Calculus-7th-Edition-Stewart

162 CHAPTER 2 Functions SECTION 2.2 Graphs of Functions 162
87. (a) The graphs of f x x 2 x and g x x 2 x 6 are shown in the viewing rectangle [ 10 10] by
[ 10 10].
10 10
-10 -5 5 10 -10 -5 5 10
-10 -10
For those values of x where f x 0 , the graphs of f and g coincide, and for those values of x where f x 0, the
graph of g is obtained from that of f by reflecting the part below the x -axis about the x -axis.
(b) The graphs of f x x 4 6x 2 and g x x 4 6x 2
are shown in the viewing rectangle [ 5 5] by [ 10 15].
10 10
-4 -2 2 4 -4 -2 2 4
-10 -10
For those values of x where f x 0 , the graphs of f and g coincide, and for those values of x where f x 0, the
graph of g is obtained from that of f by reflecting the part below the x -axis above the x -axis.
(c) In general, if g x f x , then for those values of x where f x 0, the graphs of f and g coincide, and for those
values of x where f x 0, the graph of g is obtained from that of f by reflecting the part below the x -axis above the
x -axis.
y y
x x
y f x y g x
2.3 GETTING INFORMATION FROM THE GRAPH OF A FUNCTION
1. To find a function value f a from the graph of f we find the height of the graph above the x -axis at x a. From the graph
of f we see that f 3 4 and f 1 0. The net change in f between x 1 and x 3 is f 3 f 1 4 0 4.
2. The domain of the function f is all the x -values of the points on the graph, and the range is all the corresponding y-values.
From the graph of f we see that the domain of f is the interval and the range of f is the interval 7].
3. (a) If f is increasing on an interval, then the y-values of the points on the graph rise as the x -values increase. From the
graph of f we see that f is increasing on the intervals 2 and 4 5 .
(b) If f is decreasing on an interval, then y-values of the points on the graph fall as the x -values increase. From the graph
of f we see that f is decreasing on the intervals 2 4 and 5 .
Full file at https://testbank123.eu/Solutions-Manual-for-Precalculus-Mathematics-for-Calculus-7th-Edition-Stewart
Full file at https://testbank123.eu/Solutions-Manual-for-Precalculus-Mathematics-for-Calculus-7th-Edition-Stewart

SECTION 2.3 Getting Information from the Graph of a Function 163 163 CHAPTER 2 Functions
2
4. (a) A function value f a is a local maximum value of f if f a is the largest value of f on some interval containing
a. From the graph of f we see that there are two local maximum values of f : one maximum is 7, and it occurs
when x 2; the other maximum is 6, and it occurs when x 5.
(b) A function value f a is a local minimum value of f if f a is the smallest value of f on some interval containing a.
From the graph of f we see that there is one local minimum value of f . The minimum value is 2, and it occurs when
x 4.
5. The solutions of the equation f x 0 are the x -intercepts of the graph of f . The solution of the inequality f x 0 is
the set of x -values at which the graph of f is on or above the x -axis. From the graph of f we find that the solutions of the
equation f x 0 are x 1 and x 7, and the solution of the inequality f x 0 is the interval [1 7].
6. (a) To solve the equation 2x 1 x 4 graphically we graph the
functions f x 2x 1 and g x x 4 on the same set of axes
and determine the values of x at which the graphs of f and g
y
1
0 1 x
(b) To solve the inequality 2x 1 x 4 graphically we graph the functions f x 2x 1 and g x x 4 on
the same set of axes and find the values of x at which the graph of g is higher than the graph of f . From the graphs in
part (a) we see that the solution of the inequality is 1 .
7. (a) h 2 1, h 0 1, h 2 3, and h 3 4.
(b) Domain: [ 3 4]. Range: [ 1 4].
(c) h 3 3, h 2 3, and h 4 3, so h x 3 when x , x 2, or x 4.
(d) The graph of h lies below or on the horizontal line y 3 when 3 x 2 or x 4, so h x 3 for those values of x .
(e) The net change in h between x 3 and x 3 is h 3 h 3 4 3 1.
8. (a) g 4 3, g 2 2, g 0 2, g 2 1, and g 4 0.
(b) Domain: [ 4 4]. Range: [ 2 3].
(c) g 4 3. [Note that g 2 1 not 3.]
(d) It appears that g x 0 for 1 x 1 8 and for x 4; that is, for x 1 x 1 8 4 .
(e) g 1 0 and g 2 1, so the net change between x 1 and x 2 is 1 0 1.
9. (a) f 0 3 1 g 0 . So f 0 is larger.
(b) f 3 1 2 5 g 3 . So g 3 is larger.
(c) f x g x for x 2 and x 2.
(d) f x g x for 4 x 2 and 2 x 3; that is, on the intervals [ 4 2] and [2 3].
(e) f x g x for 2 x 2; that is, on the interval 2 2 .
10. (a) The graph of g is higher than the graph of f at x 6, so g 6 is larger.
(b) The graph of f is higher than the graph of g at x 3, so f 3 is larger.
(c) The graphs of f and g intersect at x 2, x 5, and x 7, so f x g x for these values of x .
(d) f x g x for 1 x 2 and approximately 5 x 7; that is, on [1 2] and [5 7].
(e) f x g x for 2 x 5 and approximately 7 x 8; that is, on [2 5 and 7 8].
Full file at https://testbank123.eu/Solutions-Manual-for-Precalculus-Mathematics-for-Calculus-7th-Edition-Stewart
Full file at https://testbank123.eu/Solutions-Manual-for-Precalculus-Mathematics-for-Calculus-7th-Edition-Stewart

SECTION 2.3 Getting Information from the Graph of a Function 164 164 CHAPTER 2 Functions
y 2
1 x
y
2
1 x
y
1
1 x
y
1
1 x
y
2
1 x
y
2
1 x
11. (a) 12. (a)
0
0
(b) Domain: ; Range: (b) Domain: ; Range
13. (a) 14. (a)
0
0
(b) Domain: [ 2 5]; Range [ 4 3]
(b) Domain: 1 4 ; Range 4 2
15. (a) 16. (a)
0
0
(b) Domain: [ 3 3]; Range: [ 1 8]
(b) Domain: [ 3 3]; Range [ 6 3]
17. (a) 18. (a)
10
5
-2 2 4
-5
-6 -4 -2 2 -10
(b) Domain: ; Range: [ 1 (b) Domain: ; Range: 2]
Full file at https://testbank123.eu/Solutions-Manual-for-Precalculus-Mathematics-for-Calculus-7th-Edition-Stewart
Full file at https://testbank123.eu/Solutions-Manual-for-Precalculus-Mathematics-for-Calculus-7th-Edition-Stewart

SECTION 2.3 Getting Information from the Graph of a Function 165 165 CHAPTER 2 Functions
19. (a)
2
20. (a)
2
1 1
2 4 6
-1
-3 -2 -1 1 2 3
-1
(b) Domain: [1 ; Range: [0 (b) Domain: [ 2 ; Range: [0
21. (a) 5
22. (a) 5
-8 -6 -4 -2 2 4 6 8 -8 -6 -4 -2 2 4 6 8
-5
-5
(b) Domain: [ 4 4]; Range: [0 4] (b) Domain: [ 5 5]; Range: [ 5 0]
23. y 24. y
y=4-x
1
1
y=x-2
x
_2x+3
1
1
3x-7
x
(a) From the graph, we see that x 2 4 x when
x 3.
(b) From the graph, we see x 2 4 x when x 3.
(a) From the graph, we see that 2x 3 3x 7 when
x 2.
(b) From the graph, we see that 2x 3 3x 7 when
x 2.
Full file at https://testbank123.eu/Solutions-Manual-for-Precalculus-Mathematics-for-Calculus-7th-Edition-Stewart
Full file at https://testbank123.eu/Solutions-Manual-for-Precalculus-Mathematics-for-Calculus-7th-Edition-Stewart

SECTION 2.3 Getting Information from the Graph of a Function 166 166 CHAPTER 2 Functions
4 4
25. y 26. y
1 1
x
y=x@
y=3-4x
y=_x@l
1
y=2-x
1 x
(a) From the graph, we see that x 2 2 x when
x 2 or x 1.
(b) From the graph, we see that x 2 2 x when
2 x 1.
(a) From the graph, we see that x 2 3 4x when
x 1 or x 3.
(b) From the graph, we see that x 2 3 4x when
1 x 3.
27. 10
-4 -2 2
-10
-20
-30
28. 20
10
-10
-20
2 4 6
(a) We graph y x 3 3x 2 (black) and
y x 2 3x 7 (gray). From the graph, we see
that the graphs intersect at x 4 32, x 1 12,
and x 1 44.
(b) From the graph, we see that
x 3 3x 2 x 2 3x 7 on approximately
[ 4 32 1 12] and [1 44 .
(a) We graph y 5x 2 x 3 (black) and
y x 2 3x 4 (gray). From the graph, we see
that the graphs intersect at x 0 58, x 1 29, and
x 5 29.
(b) From the graph, we see that
5x 2 x 3 x 2 3x 4 on approximately
[ 0 58 1 29] and [5 29 .
29.
2
-2 -1 1
-2
(a) We graph y 16x 3 16x 2 (black) and y x 1
(gray). From the graph, we see that the graphs
30. 4
3
2
1
-1 0 1 2 3 4 5
(a) We graph y 1 x (black) and y x 2 1
(gray). From the graph, we see that the solutions are
1 1 x 0 and x 2 31.intersect at x 1, x 4
, and x 4
.
2
(b) From the graph, we see that 16x 3 16x 2 x 1 on (b) From the graph, we see that 1 x x 1 on
1 1
and 1 .
approximately 0 2 31 .
Full file at https://testbank123.eu/Solutions-Manual-for-Precalculus-Mathematics-for-Calculus-7th-Edition-Stewart
Full file at https://testbank123.eu/Solutions-Manual-for-Precalculus-Mathematics-for-Calculus-7th-Edition-Stewart

SECTION 2.3 Getting Information from the Graph of a Function 167 167 CHAPTER 2 Functions
31. (a) The domain is [ 1 4] and the range is [ 1 3].
(b) The function is increasing on 1 1 and 2 4 and decreasing on 1 2 .
32. (a) The domain is [ 2 3] and the range is [ 2 3].
(b) The function is increasing on 0 1 and decreasing on 2 0 and 1 3 .
33. (a) The domain is [ 3 3] and the range is [ 2 2].
(b) The function is increasing on 2 1 and 1 2 and decreasing on 3 2 , 1 1 , and 2 3 .
34. (a) The domain is [ 2 2] and the range is [ 2 2].
(b) The function is increasing on 1 1 and decreasing on 2 1 and 1 2 .
35. (a) f x x 2 5x is graphed in the viewing rectangle
[ 2 7] by [ 10 10].
36. (a) f x x 3 4x is graphed in the viewing rectangle
[ 10 10] by [ 10 10].
10 10
-2 2 4 6 -10 -5 5 10
-10 -10
(b) The domain is and the range is
[ 6 25 .
(c) The function is increasing on 2 5 . It is
decreasing on 2 5 .
(b) The domain and range are .
(c) The function is increasing on 1 15 and
1 15 . It is decreasing on 1 15 1 15 .
37. (a) f x 2x 3 3x 2 12x is graphed in the viewing
rectangle [ 3 5] by [ 25 20].
38. (a) f x x 4 16x 2 is graphed in the viewing
rectangle [ 10 10] by [ 70 10].
20
10
-2 2 4
-10
-20
-10 -5 5 10
-20
-40
-60
(b) The domain and range are .
(c) The function is increasing on 1 and 2 .
It is decreasing on 1 2 .
(b) The domain is and the range is [ 64 .
(c) The function is increasing on 2 83 0 and
2 83 . It is decreasing on 2 83 and
0 2 83 .
Full file at https://testbank123.eu/Solutions-Manual-for-Precalculus-Mathematics-for-Calculus-7th-Edition-Stewart
Full file at https://testbank123.eu/Solutions-Manual-for-Precalculus-Mathematics-for-Calculus-7th-Edition-Stewart

SECTION 2.3 Getting Information from the Graph of a Function 168 168 CHAPTER 2 Functions
39. (a) f x x 3 2x 2 x 2 is graphed in the viewing
rectangle [ 5 5] by [ 3 3].
2
40. (a) f x x 4 4x 3 2x 2 4x 3 is graphed in the
viewing rectangle [ 3 5] by [ 5 5].
4
2
-4 -2 2 4
-2
-2 2 4 -2
-4
(b) The domain and range are .
(c) The function is increasing on 1 55 and
0 22 . It is decreasing on 1 55 0 22 .
41. (a) f x x 2 5 is graphed in the viewing rectangle
[ 10 10] by [ 5 5].
(b) The domain is and the range is [ 4 .
(c) The function is increasing on 0 4 1 and 2 4 .
It is decreasing on 0 4 and 1 2 4 .
42. (a) f x 4 x 2 3 is graphed in the viewing rectangle
[ 10 10] by [ 10 10].
4 10
2
-10 -5 5 10 -2
-4
-10 -5 5 10
-10
(b) The domain is and the range is [0 .
(c) The function is increasing on 0 . It is decreasing
on 0 .
(b) The domain is and the range is 4].
(c) The function is increasing on 0 . It is
decreasing on 0 .
43. (a) Local maximum: 2 at x 0. Local minimum: 1 at x 2 and 0 at x 2.
(b) The function is increasing on 2 0 and 2 and decreasing on 2 and 0 2 .
44. (a) Local maximum: 2 at x 2 and 1 at x 2. Local minimum: 1 at x 0.
(b) The function is increasing on 2 and 0 2 and decreasing on 2 0 and 2 .
45. (a) Local maximum: 0 at x 0 and 1 at x 3. Local minimum: 2 at x 2 and 1 at x 1.
(b) The function is increasing on 2 0 and 1 3 and decreasing on 2 , 0 1 , and 3 .
46. (a) Local maximum: 3 at x 2 and 2 at x 1. Local minimum: 0 at x 1 and 1 at x 2.
(b) The function is increasing on 2 , 1 1 , and 2 and decreasing on 2 1 and 1 2 .
47. (a) In the first graph, we see that f x x 3 x has a local minimum and a local maximum. Smaller x - and y-ranges show
that f x has a local maximum of about 0 38 when x 0 58 and a local minimum of about 0 38 when x 0 58.
5 0.5 0.50 0.55 0.60
-0.3
-5 5
-5
0.4
0.3
-0.60 -0.55 -0.50
-0.4
-0.5
(b) The function is increasing on 0 58 and 0 58 and decreasing on 0 58 0 58 .
Full file at https://testbank123.eu/Solutions-Manual-for-Precalculus-Mathematics-for-Calculus-7th-Edition-Stewart
Full file at https://testbank123.eu/Solutions-Manual-for-Precalculus-Mathematics-for-Calculus-7th-Edition-Stewart

SECTION 2.3 Getting Information from the Graph of a Function 169 169 CHAPTER 2 Functions
48. (a) In the first graph, we see that f x 3 x x 2 x 3 has a local minimum and a local maximum. Smaller x - and
y-ranges show that f x has a local maximum of about 4 00 when x 1 00 and a local minimum of about 2 81 when
x 0 33.
2.9 4
4.1
2 2.8 4.0
-2 0 2
2.7 -0.40 -0.35 -0.30
3.9 0.9 1.0 1.1
(b) The function is increasing on 0 33 1 00 and decreasing on 0 33 and 1 00 .
49. (a) In the first graph, we see that g x x 4 2x 3 11x 2 has two local minimums and a local maximum. The local
maximum is g x 0 when x 0. Smaller x - and y-ranges show that local minima are g x 13 61 when
x 1 71 and g x 73 32 when x 3 21.
-5 5 -1.75 -1.70 -1.65
-13.4
-73.0
3.1 3.2 3.3
-50 -13.6 -73.5
-100 -13.8 -74.0
(b) The function is increasing on 1 71 0 and 3 21 and decreasing on 1 71 and 0 3 21 .
50. (a) In the first graph, we see that g x x 5 8x 3 20x has two local minimums and two local maximums. The local
maximums are g x 7 87 when x 1 93 and g x 13 02 when x 1 04. Smaller x - and y-ranges show that
local minimums are g x 13 02 when x 1 04 and g x 7 87 when x 1 93. Notice that since g x is odd,
the local maxima and minima are related.
20 -2.0 -1.8
-7.8
13.1
-5 5
-20
-7.9
-8.0
13.0
12.9
1.0 1.2
-1.2 -1.0 -12.8
7.90
-13.0
-13.2
7.85
7.80
1.90 1.95 2.00
(b) The function is increasing on 1 93 , 1 04 1 04 , and 1 93 and decreasing on 1 93 1 04 and
1 04 1 93 .
Full file at https://testbank123.eu/Solutions-Manual-for-Precalculus-Mathematics-for-Calculus-7th-Edition-Stewart
Full file at https://testbank123.eu/Solutions-Manual-for-Precalculus-Mathematics-for-Calculus-7th-Edition-Stewart

170 CHAPTER 2 Functions SECTION 2.3 Getting Information from the Graph of a Function 170
51. (a) In the first graph, we see that U x x 6 x has only a local maximum. Smaller x - and y-ranges show that U x
has a local maximum of about 5 66 when x 4 00.
10 5.70
5 5.65
5
(b) The function is increasing on 4 00 and decreasing on 4 00 6 .
5.60 3.9 4.0 4.1
52. (a) In the first viewing rectangle below, we see that U x x x x 2 has only a local maximum. Smaller x - and
y-ranges show that U x has a local maximum of about 0 32 when x 0 75.
1.0 0.40
0.5 0.35
0.0 0.0 0.5 1.0
0.30 0.7 0.8 0.9
(b) The function is increasing on 0 0 75 and decreasing on 0 75 1 .
1 x 253. (a) In the first graph, we see that V x
x 3 has a local minimum and a local maximum. Smaller x - and y-ranges
show that V x has a local maximum of about 0 38 when x 1 73 and a local minimum of about 0 38 when
x 1 73.
2 0.40 1.6 1.7 1.8
-0.30
-5 5
-2
0.35
0.30
-1.8 -1.7 -1.6
-0.35
-0.40
(b) The function is increasing on 1 73 and 1 73 and decreasing on 1 73 0 and 0 1 73 .
154. (a) In the first viewing rectangle below, we see that V x
x 2
x 1 has only a local maximum. Smaller x - and
y-ranges show that V x has a local maximum of about 1 33 when x 0 50.
2 1.40
1.35
-5 5 1.30 -0.6 -0.5 -0.4
(b) The function is increasing on 0 50 and decreasing on 0 50 .
55. (a) At 6 A.M . the graph shows that the power consumption is about 500 megawatts. Since t 18 represents 6 P.M., the
graph shows that the power consumption at 6 P.M . is about 725 megawatts.
(b) The power consumption is lowest between 3 A.M . and 4 A .M ..
Full file at https://testbank123.eu/Solutions-Manual-for-Precalculus-Mathematics-for-Calculus-7th-Edition-Stewart
Full file at https://testbank123.eu/Solutions-Manual-for-Precalculus-Mathematics-for-Calculus-7th-Edition-Stewart

171 CHAPTER 2 Functions SECTION 2.3 Getting Information from the Graph of a Function 171
F
80
70
60
50
40
30
20
10
0 1 2 3 4 5 6 7 8 9 10 x
(c) The power consumption is highest just before 12 noon.
(d) The net change in power consumption from 9 A.M . to 7 P.M. is P 19 P 9 690 790 00 megawatts.
56. (a) The first noticeable movements occurred at time t 5 seconds.
(b) It seemed to end at time t 30 seconds.
(c) Maximum intensity was reached at t 17 seconds.
57. (a) This person appears to be gaining weight steadily until the age of 21 when this person’s weight gain slows down. The
person continues to gain weight until the age of 30, at which point this person experiences a sudden weight loss. Weight
gain resumes around the age of 32, and the person dies at about age 68. Thus, the person’s weight W is increasing on
0 30 and 32 68 and decreasing on 30 32 .
(b) The sudden weight loss could be due to a number of reasons, among them major illness, a weight loss program, etc.
(c) The net change in the person’s weight from age 10 to age 20 is W 20 W 10 150 50 100 lb.
58. (a) Measuring in hours since midnight, the salesman’s distance from home D is increasing on 8 9 , 10 12 , and 15 17 ,
constant on 9 10 , 12 13 , and 17 18 , and decreasing on 13 15 and 18 19 .
(b) The salesman travels away from home and stops to make a sales call between 9 A .M. and 10 A .M ., and then travels
further from home for a sales call between 12 noon and 1 P.M . Next he travels along a route that takes him closer to
home before taking him further away from home. He then makes a final sales call between 5 P.M . and 6 P.M . and then
returns home.
(c) The net change in the distance D from noon to 1 P.M. is D 1 P.M. D noon 0.
59. (a) The function W is increasing on 0 150 and 300 and decreasing on 150 300 .
(b) W has a local maximum at x 150 and a local minimum at x 300.
(c) The net change in the depth W from 100 days to 300 days is W 300 W 100 25 75 50 ft.
60. (a) The function P is increasing on 0 25 and decreasing on 25 50 .
(b) The maximum population was 50,000, and it was attained at x 25 years, which represents the year 1975.
(c) The net change in the population P from 1970 to 1990 is P 40 P 20 40 40 0.
61. Runner A won the race. All runners finished the race. Runner B fell, but got up and finished the race.
62. (a) 63. (a) E
400
300
200
100
(b) As the distance x increases, the gravitational
attraction F decreases. The rate of decrease is rapid
at first, and slows as the distance increases.
(b) As the temperature T increases, the energy E
increases. The rate of increase gets larger as the
temperature increases.
Full file at https://testbank123.eu/Solutions-Manual-for-Precalculus-Mathematics-for-Calculus-7th-Edition-Stewart
Full file at https://testbank123.eu/Solutions-Manual-for-Precalculus-Mathematics-for-Calculus-7th-Edition-Stewart

172 CHAPTER 2 Functions SECTION 2.3 Getting Information from the Graph of a Function 172
64. In the first graph, we see the general location of the minimum of V 999 87 0 06426T 0 0085043T 2 0 0000679T 3
is around T 4. In the second graph, we isolate the minimum, and from this graph, we see that the minimum volume of
1 kg of water occurs at T 3 96 C.
1005 999.76
1000 999.75
995 0 20
999.74 3.5 4.0 4.5
65. In the first graph, we see the general location of the minimum of E 2 73 3 10
5
. In the second graph, we isolate the
minimum, and from this graph, we see that energy is minimized when 7 5 mi/h.
10000 4700
4650
5000
6 8 10
4600
7.4 7.5 7.6
66. In the first graph, we see the general location of the maximum of r 3 2 1 r r 2 is around r 0 7 cm. In the second
graph, we isolate the maximum, and from this graph we see that at the maximum velocity is approximately 0 47 when
r 0 67 cm.
1.0
0.5
0.0
0.6 0.8 1.0
0.50
0.48
0.46
0.60 0.65 0.70
67. (a) f x is always increasing, and f x 0 for all x . (b) f x is always decreasing, and f x 0 for all x .
y y
0 x 0 x
Full file at https://testbank123.eu/Solutions-Manual-for-Precalculus-Mathematics-for-Calculus-7th-Edition-Stewart
Full file at https://testbank123.eu/Solutions-Manual-for-Precalculus-Mathematics-for-Calculus-7th-Edition-Stewart

SECTION 2.4 Average Rate of Change of a Function 173 173 CHAPTER 2 Functions
2
2
0 2
.
(c) f x is always increasing, and f x 0 for all x . (d) f x is always decreasing, and f x 0 for all x .
y y
x
0 0 x
68. Numerous answers are possible.
69. (a) If x a is a local maximum of f x then
f a f x 0 for all x around x a. So
g a2
g x 2
and thus g a g x .
(c) Let f x x 4 x 2 6x 9. From the graph, we
see that f x has a minimum at x 1. Thus g x
also has a minimum at x 1 and this minimum
Similarly, if x b is a local minimum of f x , then
f x f b 0 for all x around x b. So
g x 2
g b2
and thus g x g b .
(b) Using the distance formula,
value is g 1
10
5
14 1 6 1 9 5.
g x
x 3 2 x 2 0
0
x 4 x 2 6x 9
2.4 AVERAGE RATE OF CHANGE OF A FUNCTION
1. If you travel 100 miles in two hours then your average speed for the trip is average speed 100 miles
2 hours 50 mi/h.
f b f a2. The average rate of change of a function f between x a and x b is average rate of change
3. The average rate of change of the function f x x 2 between x 1 and x 5 is
. b a
average rate of change f 5 f 1
1
52 12
4
25 1 24 4
4
6.
4. (a) The average rate of change of a function f between x a and x b is the slope of the secant line between a f a
and b f b .
(b) The average rate of change of the linear function f x 3x 5 between any two points is 3.
5. (a) Yes, the average rate of change of a function between x a and x b is the slope of the secant line through a f a
f b f aand b f b ; that is, .
b a
(b) Yes, the average rate of change of a linear function y mx b is the same (namely m) for all intervals.
6. (a) No, the average rate of change of an increasing function is positive over any interval.
(b) No, just because the average rate of change of a function between x a and x b is negative, it does not follow
that the function is decreasing on that interval. For example, f x x 2 has negative average rate of change between
x 2 and x 1, but f is increasing for 0 x 1.
7. (a) The net change is f 4 f 1 5 3 2.
5 3 2(b) We use the points 1 3 and 4 5 , so the average rate of change is
4 1 3
Full file at https://testbank123.eu/Solutions-Manual-for-Precalculus-Mathematics-for-Calculus-7th-Edition-Stewart
Full file at https://testbank123.eu/Solutions-Manual-for-Precalculus-Mathematics-for-Calculus-7th-Edition-Stewart

SECTION 2.4 Average Rate of Change of a Function 174 174 CHAPTER 2 Functions
2
.
5
5
10
8. (a) The net change is f 5 f 1 2 4 2. 2 4 2 1
(b) We use the points 1 4 and 5 2 , so the average rate of change is 5
9. (a) The net change is f 5 f 0 2 6 4.
1
4
2 .
2 6 4(b) We use the points 0 6 and 5 2 , so the average rate of change is
5
10. (a) The net change is f 5 f 1 4 0 4.
0 5
4 0 4 2
(b) We use the points 1 0 and 5 4 , so the average rate of change is 5
1 .
6 3
11. (a) The net change is f 3 f 2 [3 3 2] [3 2 2] 7 4 3.
(b) The average rate of change is f 3 f 2
3 2
3 1
3.
12. (a) The net change is r 6 r 3 3 1 6
3 1 3
1 2 1.
3 3
r 6 r 3 1(b) The average rate of change is
6 3
3 .
13. (a) The net change is h 1 h 4
1 3
4 3
1 11 5.
2 2 2 2
(b) The average rate of change is
h 1 h 4
1 4
1.
14. (a) The net change is g 2 g 3 2 2 2
2 2 3
4 .
10
3 3 3 3
g 2 g 3 3 2(b) The average rate of change is
2 3 5
3
.
15. (a) The net change is h 6 h 3 2 6 2 6
2 3 2 3
66 15 51.
(b) The average rate of change is
h 6 h 3 51
6 3
3
17.
16. (a) The net change is f 0 f 2 1 3 0 2
1 3 2 2
1 11 12.
(b) The average rate of change is
f 0 f 2 12
0 2
2
6.
17. (a) The net change is f 10 f 0 103 4 102
03 4 02
600 0 600.
(b) The average rate of change is
f 10 f 0
10 0
600 10
60.
18. (a) The net change is g 2 g 2 24 23 22
2 4 2 3 2 2
12 28 16.
(b) The average rate of change is
g 2 g 2
2 2
16 4
4.
Full file at https://testbank123.eu/Solutions-Manual-for-Precalculus-Mathematics-for-Calculus-7th-Edition-Stewart
Full file at https://testbank123.eu/Solutions-Manual-for-Precalculus-Mathematics-for-Calculus-7th-Edition-Stewart

SECTION 2.4 Average Rate of Change of a Function 175 175 CHAPTER 2 Functions
19. (a) The net change is f 3 h f 3 5 3 h 2
5 3 2
45 30h 5h2 45 5h2 30h.
(b) The average rate of change is
f 3 h f 3
3 h 3
5h2 30h h
5h 30.
20. (a) The net change is f 2 h f 2 1 3 2 h 2
1 3 2 2
3h2 12h 11
11 h2 12h.
(b) The average rate of change is
f 2 h f 2
2 h 2
h2 12h
h
h 12.
Full file at https://testbank123.eu/Solutions-Manual-for-Precalculus-Mathematics-for-Calculus-7th-Edition-Stewart
Full file at https://testbank123.eu/Solutions-Manual-for-Precalculus-Mathematics-for-Calculus-7th-Edition-Stewart

SECTION 2.4 Average Rate of Change of a Function 176 176 CHAPTER 2 Functions
.
1 1 1 a21. (a) The net change is g a g 1
a 1
(b) The average rate of change is g a g 1
a 1
2
. a 1 a
a
a 1 2
1 a a a 1
2h
1
a .
22. (a) The net change is g h g 0 h 1
0 1
h 1
2h
(b) The average rate of change is g h g 0
h 1
2h 2
.
h 0
23. (a) The net change is f a h f a
a
h 2 2
h
h h 1 2h
.
h 1
(b) The average rate of change is
2h
a a a h
f a h f a a a h 2h 2
.
a h a h
ah a h
a a h
24. (a) The net change is f a h f a a h a.
(b) The average rate of change is
f a h f a a h a a h a a h a h 1 .
a h a h
a h a h a h a
h a h a
a h a
25. (a) The average rate of change is 1
1
f a h f a
2 a h 3
2
a 3 1 1 1 1 1
a h a
2 a
2 h 3
2 a 3
h h
2 h
h 2
.
(b) The slope of the line f x 1 x 3 is 1 , which is also the average rate of change. 2 2
26. (a) The average rate of change is
g a h g a [ 4 a h 2] [ 4a 2] a 4h 2 4a 2 h 4.
a h a h h h
(b) The slope of the line g x 4x 2 is , which is also the average rate of change.
27. The function f has a greater average rate of change between x 0 and x 1. The function g has a greater average rate of
change between x 1 and x 2. The functions f and g have the same average rate of change between x 0 and x 1 5.
28. The average rate of change of f is constant, that of g increases, and that of h decreases.
29. The average rate of change is
W 200 W 100
200 100
50 75 200 100
25 100
1
4
ft/day.
30. (a) The average rate of change is
P 40 P 20
40 20
40 40 40 20
0 20
0.
(b) The population increased and decreased the same amount during the 20 years. 31. (a) The average rate of change of population is
Full file at https://testbank123.eu/Solutions-Manual-for-Precalculus-Mathematics-for-Calculus-7th-Edition-Stewart
Full file at https://testbank123.eu/Solutions-Manual-for-Precalculus-Mathematics-for-Calculus-7th-Edition-Stewart

SECTION 2.4 Average Rate of Change of a Function 177 177 CHAPTER 2 Functions
1,591 856
2001 1998
735 3
245
person
s/yr.
(b) The average rate of change of population is 826 1 483
2004 2002
657 2
328 5 persons/yr.
(c) The population was increasing from 1997 to 2001.
(d) The population was decreasing from 2001 to 2006.
Full file at https://testbank123.eu/Solutions-Manual-for-Precalculus-Mathematics-for-Calculus-7th-Edition-Stewart
Full file at https://testbank123.eu/Solutions-Manual-for-Precalculus-Mathematics-for-Calculus-7th-Edition-Stewart

SECTION 2.4 Average Rate of Change of a Function 178 178 CHAPTER 2 Functions
Lap Length of time to run lap Average speed of lap.
1
2
3
4
5
6
7
8
32
36
40
44
51
60
72
77
6 25 m/s
5 56 m/s
5 00 m/s
4 55 m/s
3 92 m/s
3 33 m/s
2 78 m/s
2 60 m/s
Year DVD players sold Change in sales from previous year
2003
2004
2005
2006
2007
2008
2009
2010
2011
2012
2013
495
513
410
402
520
580
631
719
624
582
635
—
18
103
8
118
60
51
88
95
42
53
32. (a) The average speed is
800 400
152 68
400 84
100 21
4 76 m/s.
(b) The average speed is
(c)
1,600 1,200
412 263
400 149
2 68 m/s.
The man is slowing down throughout the run.
33. (a) The average rate of change of sales is 635 495
2013 2003
513 495
140 10
18
14 players/yr.
(b) The average rate of change of sales is 2004 2003 1
18 players/yr.
(c) The average rate of change of sales is
(d)
410 513
2005 2004
103 1
03 players/yr.
Sales increased most quickly between 2006 and 2007, and decreased most quickly between 2004 and 2005.
Full file at https://testbank123.eu/Solutions-Manual-for-Precalculus-Mathematics-for-Calculus-7th-Edition-Stewart
Full file at https://testbank123.eu/Solutions-Manual-for-Precalculus-Mathematics-for-Calculus-7th-Edition-Stewart

SECTION 2.4 Average Rate of Change of a Function 179 179 CHAPTER 2 Functions
Year Number of books
1980 420
1981 460
1982 500
1985 620
1990 820
1992 900
1995 1020
1997 1100
1998 1140
1999 1180
2000 1220
34.
35. The average rate of change of the temperature of the soup over the first 20 minutes is
T 20 T 0 119 200 81
4 05 F/min. Over the next 20 minutes, it is
20 0
T 40 T 20
20 0
89 119
20
30 1 5 F/min. The first 20 minutes had a higher average rate of change of
40 20 40 20
20
temperature (in absolute value).
36. (a) (i) Between 1860 and 1890, the average rate of change was
about 84 farms per year.
(ii) Between 1950 and 1970, the average rate of change was
about 131 farms per year.
y 1890 y 1860
1890 1860
y 1970 y 1950
1970 1950
4570 2040 30
2780 5390
20
84, a gain of
131, a loss of
(b) From the graph, it appears that the steepest rate of decline was during the period from 1950 to 1960.
37. (a) For all three skiers, the average rate of change is d 10 d 0
10 0
100 10
10.
(b) Skier A gets a great start, but slows at the end of the race. Skier B maintains a steady pace. Runner C is slow at the
beginning, but accelerates down the hill.
38. (a) Skater B won the race, because he travels 500 meters before Skater A.
(b) Skater A’s average speed during the first 10 seconds is A 10 A 0
10 0
Skater B’s average speed during the first 10 seconds is B 10 B 0
10 0
200 0
10
100 0 10
20 m s.
10 m s.
(c) Skater A’s average speed during his last 15 seconds is
Skater B’s average speed during his last 15 seconds is
A 40 A 25
40 25
B 35 B 20
35 20
500 395 15
500 200 15
7 m s.
20 m s.
Full file at https://testbank123.eu/Solutions-Manual-for-Precalculus-Mathematics-for-Calculus-7th-Edition-Stewart
Full file at https://testbank123.eu/Solutions-Manual-for-Precalculus-Mathematics-for-Calculus-7th-Edition-Stewart

SECTION 2.4 Average Rate of Change of a Function 180 180 CHAPTER 2 Functions
t a t b Average Speed f b f a
b a
3
3
3
3
3
3 5
3 1
3 01
3 001
3 0001
16 3 5 2 16 3 2
3 5 3 104
16 3 1 2 16 3 2
3 1 3 97 6
16 3 01 2 16 3 2
3 01 3 96 16
16 3 001 2 16 3 2
3 001 3 96 016
16 3 0001 2 16 3 2
3 0001 3 96 0016
39.
From the table it appears that the average speed approaches 96 ft s as the time intervals get smaller and smaller. It seems
reasonable to say that the speed of the object is 96 ft s at the instant t 3.
2.5 LINEAR FUNCTIONS AND MODELS
1. If f is a function with constant rate of change, then
(a) f is a linear function of the form f x ax b.
(b) The graph of f is a line.
2. If f x 5x 7, then
(a) The rate of change of f is 5.
(b) The graph of f is a line with slope 5 and y-intercept 7.
3. From the graph, we see that y 2 50 and y 0 20, so the slope of the graph is
y 2 y 0 50 20
m 2 0
2
15 gal min.
4. From Exercise 3, we see that the pool is being filled at the rate of 15 gallons per minute.
5. If a linear function has positive rate of change, its graph slopes upward.
6. f x 3 is a linear function because it is of the form f x ax b, with a 0 and b 3. Its slope (and hence its rate
of change) is 0.
7. f x 3 1 x 1 x 3 is linear with a 1 and b 3. 3 3 3
8. f x 2 4x 4x 2 is linear with a 4 and b 2.
9. f x x 4 x 4x x 2 is not of the form f x ax b for constants a and b, so it is not linear.
10. f x x 1 is not linear.
x 1 1 1 1 111. f x 5
5
x 5
is linear with a 5
and b 5
.
2x 3 312. f x
x 2
x is not linear.
13. f x x 1 2 x 2 2x 1 is not of the form f x ax b for constants a and b, so it is not linear.
14. f x 1 3x 1 3 x 1 is linear with a 3 and b 1 . 2 2 2 2 2
Full file at https://testbank123.eu/Solutions-Manual-for-Precalculus-Mathematics-for-Calculus-7th-Edition-Stewart
Full file at https://testbank123.eu/Solutions-Manual-for-Precalculus-Mathematics-for-Calculus-7th-Edition-Stewart

SECTION 2.5 Linear Functions and Models 179 179 CHAPTER 2 Functions
x f x 2x 5
1
0
1
2
3
4
7
5
3
1
1
3
y
2
1 x
x g x 4 2x
1
0
1
2
3
4
6
4
2
0
2
4
y
2
1 x
t r t 2
t 2 3
1
0
1
2
3
4
2 67
2
1 33
0 67
0
0 67
y
2
2 t
t h t 1 3 t 2 4
2
1
0
1
2
3
2
1 25
0 5
0 25
1
1 75
y
1
1
t
15.
0
The slope of the graph of f x 2x 5 is 2.
16.
0
The slope of the graph of g x 4 2x 2x 4 is 2.
17.
0
2 2
The slope of the graph of r t 3
t 2 is 3
.
18.
0
The slope of the graph of h t 1 3 t is 3 . 2 4 4
Full file at https://testbank123.eu/Solutions-Manual-for-Precalculus-Mathematics-for-Calculus-7th-Edition-Stewart
Full file at https://testbank123.eu/Solutions-Manual-for-Precalculus-Mathematics-for-Calculus-7th-Edition-Stewart
SECTION 2.5 Linear Functions and Models 180 180 CHAPTER 2 Functions
f
1
1 x
h
1
1 t
s
1
10 w
v
10
2 t
A
1
_1
1 r
_1
19. (a) 20. (a) g
1
_1 0 1 z
0
_10
(b) The graph of f x 2x 6 has slope 2.
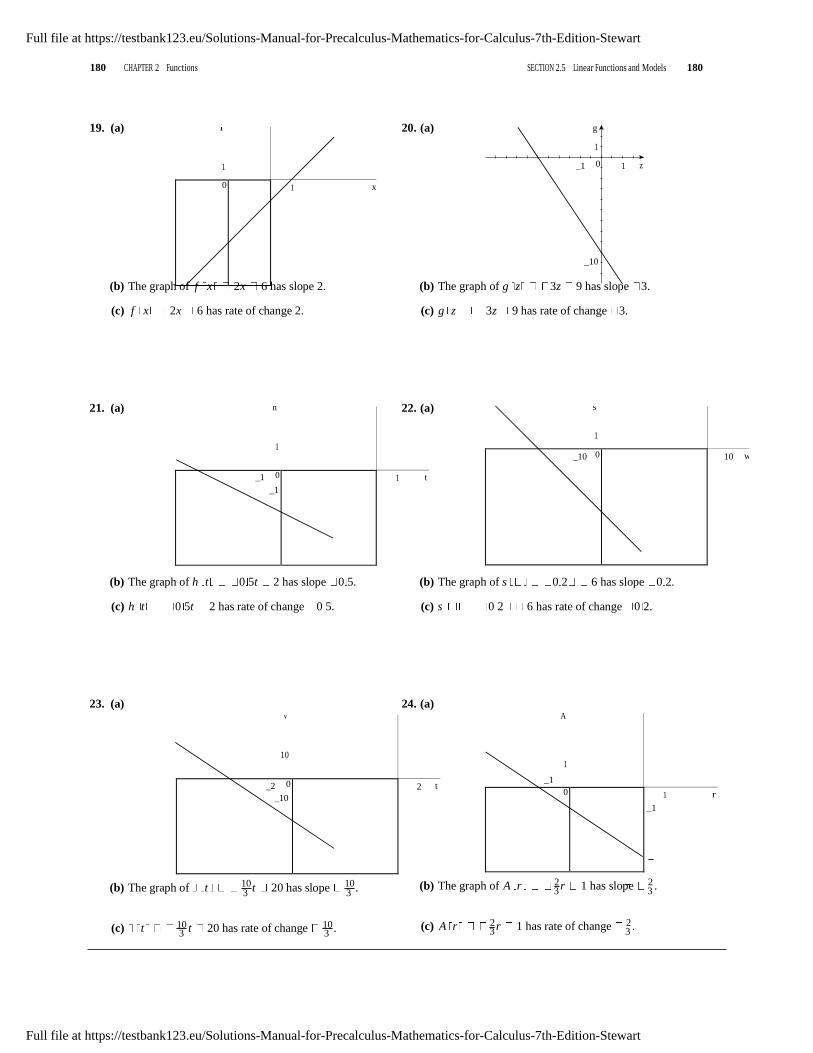
(c) f x 2x 6 has rate of change 2.
(b) The graph of g z 3z 9 has slope 3.
(c) g z 3z 9 has rate of change 3.
21. (a) 22. (a)
_1 0
_1
_10 0
(b) The graph of h t 0 5t 2 has slope 0 5.
(c) h t 0 5t 2 has rate of change 0 5.
(b) The graph of s 0 2 6 has slope 0 2.
(c) s 0 2 6 has rate of change 0 2.
23. (a) 24. (a)
_2 0
_10 0
10 10 2 2
(b) The graph of t 3
t 20 has slope 3
. (b) The graph of A r 3
r 1 has slope 3
.
10 10 2 2(c) t
3 t 20 has rate of change
3 . (c) A r
3 r 1 has rate of change
3 .
Full file at https://testbank123.eu/Solutions-Manual-for-Precalculus-Mathematics-for-Calculus-7th-Edition-Stewart
Full file at https://testbank123.eu/Solutions-Manual-for-Precalculus-Mathematics-for-Calculus-7th-Edition-Stewart

SECTION 2.5 Linear Functions and Models 181 181 CHAPTER 2 Functions
f
1
_1
1 t
_1
g
1
1 x
f
1
a=2
a=1
a= 1
2
0 1 t
2
0
0
.
25. (a) 26. (a)
0
0
3 3 5 5
(b) The graph of f t 2
t 2 has slope 2
. (b) The graph of g x 4
x 10 has slope 4
.
3 3 5 5(c) f t
2 t 2 has rate of change
2 . (c) g x
4 x 10 has rate of change
4 .
27. The linear function f with rate of change 3 and initial value 1 has equation f x 3x 1.
28. The linear function g with rate of change 12 and initial value 100 has equation g x 12x 100.
29. The linear function h with slope 1 and y-intercept 3 has equation h x 1 x 3. 2 2
4
30. The linear function k with slope 4 and y-intercept 2 has equation k x x 2. 5 5
31. (a) From the table, we see that for every increase of 2 in the value of x , f x increases by 3. Thus, the rate of change of f
is 3 .
(b) When x 0, f x 7, so b 7. From part (a), a 3 , and so f x 3 x 7. 2 2
32. (a) From the table, we see that f 3 11 and f 0 2. Thus, when x increases by 3, f x decreases by 9, and so the
rate of change of f is 3.
(b) When x 0, f x 2, so b 2. From part (a), a 3, and so f x 3x 2.
4 333. (a) From the graph, we see that f 0 3 and f 1 4, so the rate of change of f is
1
(b) From part (a), a 1, and f 0 b 3, so f x x 3.
1.
0 434. (a) From the graph, we see that f 0 4 and f 2 0, so the rate of change of f is
2
(b) From part (a), a 2, and f 0 b 4, so f x 2x 4.
2.
0 2 135. (a) From the graph, we see that f 0 2 and f 4 0, so the rate of change of f is
4 0
2 .
1 1(b) From part (a), a 2
, and f 0 b 2, so f x 2
x 2.
36. (a) From the graph, we see that f 0 1 and f 2 0, so the rate of change of f is
(b) From part (a), a 1 , and f 0 b , so f x 1 x 1.
0 1 1
2 0 2
37.
2 2
Increasing the value of a makes the graph of f steeper. In other words, it
increases the rate of change of f .
Full file at https://testbank123.eu/Solutions-Manual-for-Precalculus-Mathematics-for-Calculus-7th-Edition-Stewart
Full file at https://testbank123.eu/Solutions-Manual-for-Precalculus-Mathematics-for-Calculus-7th-Edition-Stewart

SECTION 2.5 Linear Functions and Models 182 182 CHAPTER 2 Functions f
1
b=2
b=1
b= 1
2
1 t
12
12
12
38. Increasing the value of b moves the graph of f upward, but does not affect
the rate of change of f .
0
39. (a) T (b) The slope of T x 150x 32,000 is the value of a, 150. 38,000
36,000
(c) The amount of trash is changing at a rate equal to the slope of the graph,
150 thousand tons per year.
34,000
32,000
40. (a)
0 10 20 30 x
f (b) The slope of the graph of f x 200 32x is 32.
900
800
700
600
500
400
300
200
100
0
5 10 15 20 25 x
(c) Ore is being produced at a rate equal to the slope of the graph, 32 thousand
tons per year.
41. (a) Let V t at b represent the volume of hydrogen. The balloon is being filled at the rate of 0 5 ft3 s, so a 0 5,
and initially it contains 2 ft3, so b 2. Thus, V t 0 5t 2.
(b) We solve V t 15 0 5t 2 15 0 5t 13 t 26. Thus, it takes 26 seconds to fill the balloon.
42. (a) Let V t at b represent the volume of water. The pool is being filled at the rate of 10 gal min, so a 10, and
initially it contains 300 gal, so b 300. Thus, V t 10t 300.
(b) We solve V t 1300 10t 300 1300 10t 1000 t 100. Thus, it takes 100 minutes to fill the pool.
43. (a) Let H x ax b represent the height of the ramp. The maximum rise is 1 inch per 12 inches, so a 1 . The ramp
starts on the ground, so b 0. Thus, H x 1 x .
(b) We find H 150 1 150 12 5. Thus, the ramp reaches a height of 12 5 inches.
44. Meilin descends 1200 vertical feet over 15,000 feet, so the grade of her road is 1200
0 075, or
7 5%.
15,000
Brianna descends 500 vertical feet over 10,000 feet, so the grade of her road is 500
0 05, or
5%.
10,000
45. (a) From the graph, we see that the slope of Jari’s trip is steeper than that of Jade. Thus, Jari is traveling faster.
Full file at https://testbank123.eu/Solutions-Manual-for-Precalculus-Mathematics-for-Calculus-7th-Edition-Stewart
Full file at https://testbank123.eu/Solutions-Manual-for-Precalculus-Mathematics-for-Calculus-7th-Edition-Stewart
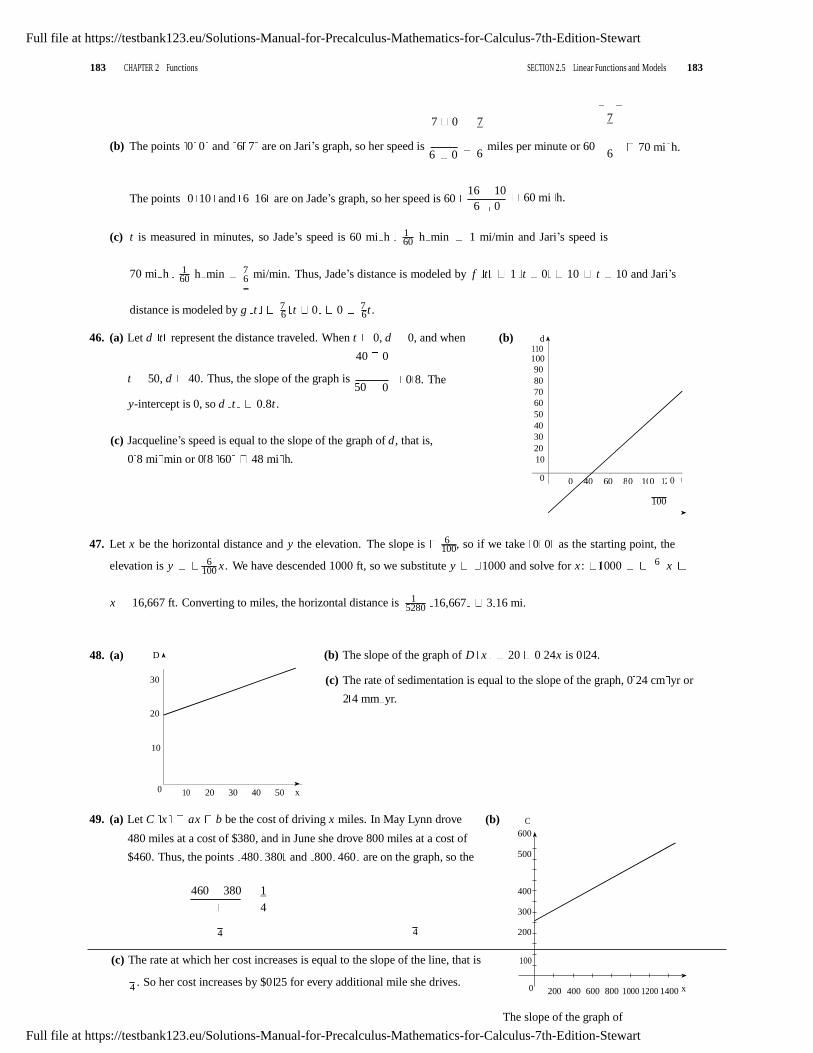
SECTION 2.5 Linear Functions and Models 183 183 CHAPTER 2 Functions
110 100
90
80
70
60
50
40
30
20
10
0 2 0 4 0 6 0 8 0 10 0 12 0 t
48. (a)
D
30
20
10
0 10 20 30 40 50 x
60
60 6
100
100
100
5280
0
7 0 7
7
(b) The points 0 0 and 6 7 are on Jari’s graph, so her speed is 6 0
miles per minute or 60 6 6
70 mi h.
16 10The points 0 10 and 6 16 are on Jade’s graph, so her speed is 60
6 0 60 mi h.
(c) t is measured in minutes, so Jade’s speed is 60 mi h 1 h min 1 mi/min and Jari’s speed is
70 mi h 1 h min 7 mi/min. Thus, Jade’s distance is modeled by f t 1 t 0 10 t 10 and Jari’s
distance is modeled by g t 7 t 0 0 7 t . 6 6
46. (a) Let d t represent the distance traveled. When t 0, d 0, and when
40 0
(b) d
t 50, d 40. Thus, the slope of the graph is 50
y-intercept is 0, so d t 0 8t .
0 8. The
(c) Jacqueline’s speed is equal to the slope of the graph of d , that is,
0 8 mi min or 0 8 60 48 mi h.
47. Let x be the horizontal distance and y the elevation. The slope is 6 , so if we take 0 0 as the starting point, the
elevation is y 6 x . We have descended 1000 ft, so we substitute y 1000 and solve for x : 000 6 x
x 16,667 ft. Converting to miles, the horizontal distance is 1
16,667 3 16 mi.
(b) The slope of the graph of D x 20 0 24x is 0 24.
(c) The rate of sedimentation is equal to the slope of the graph, 0 24 cm yr or
2 4 mm yr.
49. (a) Let C x ax b be the cost of driving x miles. In May Lynn drove
480 miles at a cost of $380, and in June she drove 800 miles at a cost of
$460. Thus, the points 480 380 and 800 460 are on the graph, so the
(b) C
600 500
460 380 1
4
4
400
300 4 200
(c) The rate at which her cost increases is equal to the slope of the line, that is
4 . So her cost increases by $0 25 for every additional mile she drives.
100
0
200 400 600 800 1000 1200 1400 x
The slope of the graph of
Full file at https://testbank123.eu/Solutions-Manual-for-Precalculus-Mathematics-for-Calculus-7th-Edition-Stewart
Full file at https://testbank123.eu/Solutions-Manual-for-Precalculus-Mathematics-for-Calculus-7th-Edition-Stewart

SECTION 2.5 Linear Functions and Models 184 184 CHAPTER 2 Functions
C x 1 x 260 is the value of a, 1 . 4 4
Full file at https://testbank123.eu/Solutions-Manual-for-Precalculus-Mathematics-for-Calculus-7th-Edition-Stewart
Full file at https://testbank123.eu/Solutions-Manual-for-Precalculus-Mathematics-for-Calculus-7th-Edition-Stewart

SECTION 2.5 Linear Functions and Models 185 185 CHAPTER 2 Functions
.
50. (a) Let C x ax b be the cost of producing x chairs in one day. The first (b)
day, it cost $2200 to produce 100 chairs, and the other day it cost $4800 to
produce 300 chairs.. Thus, the points 100 2200 and 300 4800 are on
4800 2200
C
10,000
9000
8000
7000
the graph, so the slope is a
300 100 13. We use the point
6000
5000
100 2200 to find the value of b: 2200 13 100 b b 900. Thus,
C x 13x 900.
(c) The rate at which the factory’s cost increases is equal to the slope of the
line, that is $13 chair.
4000
3000
2000
1000
0
100 200 300 400 500 600 x
The slope of the graph of
C x 13x 900 is the value of a, 13.
f x2 f x1
ax2 b ax1 b
ax2 ax1
51. (a) By definition, the average rate of change between x1 and x2 is x2 x1
x2 x1 x2 x1
(b) Factoring the numerator and cancelling, the average rate of change is ax2 ax1
x2 x1
a x2 x1 x2 x1
a.
f x f a
52. (a) The rate of change between any two points is c. In particular, between a and x , the rate of change is
x a c.
(b) Multiplying the equation in part (a) by x a, we obtain f x f a c x a . Rearranging and adding f a to
both sides, we have f x cx f a ca , as desired. Because this equation is of the form f x Ax B with
constants A c and B f a ca, it represents a linear function with slope c and y-intercept f a ca.
2.6 TRANSFORMATIONS OF FUNCTIONS
1. (a) The graph of y f x 3 is obtained from the graph of y f x by shifting upward 3 units.
(b) The graph of y f x 3 is obtained from the graph of y f x by shifting left 3 units.
2. (a) The graph of y f x 3 is obtained from the graph of y f x by shifting downward 3 units.
(b) The graph of y f x 3 is obtained from the graph of y f x by shifting right 3 units.
3. (a) The graph of y f x is obtained from the graph of y f x by reflecting in the x-axis.
(b) The graph of y f x is obtained from the graph of y f x by reflecting in the y-axis.
4. (a) The graph of f x 2 is obtained from that of y f x by shifting upward 2 units, so it has graph II.
(b) The graph of f x 3 is obtained from that of y f x by shifting to the left 3 units, so it has graph I.
(c) The graph of f x 2 is obtained from that of y f x by shifting to the right 2 units, so it has graph III.
(d) The graph of f x 4 is obtained from that of y f x by shifting downward 4 units, so it has graph IV.
5. If f is an even function, then f x f x and the graph of f is symmetric about the y-axis.
6. If f is an odd function, then f x f x and the graph of f is symmetric about the origin.
7. (a) The graph of y f x 1 can be obtained by shifting the graph of y f x downward 1 unit.
(b) The graph of y f x 2 can be obtained by shifting the graph of y f x to the right 2 units.
8. (a) The graph of y f x 4 can be obtained by shifting the graph of y f x to the left 5 units.
(b) The graph of y f x 4 can be obtained by shifting the graph of y f x upward 4 units.
9. (a) The graph of y f x can be obtained by reflecting the graph of y f x in the y-axis.
(b) The graph of y 3 f x can be obtained by stretching the graph of y f x vertically by a factor of 3.
Full file at https://testbank123.eu/Solutions-Manual-for-Precalculus-Mathematics-for-Calculus-7th-Edition-Stewart
Full file at https://testbank123.eu/Solutions-Manual-for-Precalculus-Mathematics-for-Calculus-7th-Edition-Stewart

SECTION 2.6 Transformations of Functions 185 185 CHAPTER 2 Functions
4
4
3
3
4
4
2
2
10. (a) The graph of y f x can be obtained by reflecting the graph of y f x about the x -axis.
(b) The graph of y 1 f x can be obtained by shrinking the graph of y f x vertically by a factor of 1 . 3 3
11. (a) The graph of y f x 5 2 can be obtained by shifting the graph of y f x to the right 5 units and upward
2 units.
(b) The graph of y f x 1 1 can be obtained by shifting the graph of y f x to the left 1 unit and downward
1 unit.
12. (a) The graph of y f x 3 2 can be obtained by shifting the graph of y f x to the left 3 units and upward
2 units.
(b) The graph of y f x 7 3 can be obtained by shifting the graph of y f x to the right 7 units and downward
3 units.
13. (a) The graph of y f x 5 can be obtained by reflecting the graph of y f x in the x -axis, then shifting the
resulting graph upward 5 units.
(b) The graph of y 3 f x 5 can be obtained by stretching the graph of y f x vertically by a factor of 3, then
shifting the resulting graph downward 5 units.
14. (a) The graph of y 1 f x can be obtained by reflect the graph of y f x about the x -axis, then reflecting about
the y-axis, then shifting upward 1 unit.
(b) The graph of y 2 1 f x can be obtained by shrinking the graph of y f x vertically by a factor of 1 , then 5 5
reflecting about the x -axis, then shifting upward 2 units.
15. (a) The graph of y 2 f x 5 1 can be obtained by shifting the graph of y f x to the left 5 units, stretching
vertically by a factor of 2, then shifting downward 1 unit.
(b) The graph of y 1 f x 3 5 can be obtained by shifting the graph of y f x to the right 3 units, shrinking
vertically by a factor of 1 , then shifting upward 5 units.
16. (a) The graph of y 1 f x 2 5 can be obtained by shifting the graph of y f x to the right 2 units, shrinking
vertically by a factor of 1 , then shifting upward 5 units.
(b) The graph of y 4 f x 1 3 can be obtained by shifting the graph of y f x to the left 1 unit, stretching
vertically by a factor of 4, then shifting upward 3 units.
17. (a) The graph of y f 4x can be obtained by shrinking the graph of y f x horizontally by a factor of 1 .
(b) The graph of y f 1 x
can be obtained by stretching the graph of y f x horizontally by a factor of 4.
18. (a) The graph of y f 2x 1 can be obtained by shrinking the graph of y f x horizontally by a factor of 1 , then
shifting it downward 1 unit.
(b) The graph of y 2 f 1 x
can be obtained by stretching the graph of y f x horizontally by a factor of 2 and
stretching it vertically by a factor of 2.
19. (a) The graph of g x x 2 2 is obtained by shifting the graph of f x to the left 2 units.
(b) The graph of g x x 2 2 is obtained by shifting the graph of f x upward 2 units.
20. (a) The graph of g x x 4 3 is obtained by shifting the graph of f x to the right 4 units.
(b) The graph of g x x 3 4 is obtained by shifting the graph of f x downward 4 units.
21. (a) The graph of g x x 2 2 is obtained by shifting the graph of f x to the left 2 units and downward 2 units.
(b) The graph of g x g x x 2 2 is obtained from by shifting the graph of f x to the right 2 units and upward
2 units.
Full file at https://testbank123.eu/Solutions-Manual-for-Precalculus-Mathematics-for-Calculus-7th-Edition-Stewart
Full file at https://testbank123.eu/Solutions-Manual-for-Precalculus-Mathematics-for-Calculus-7th-Edition-Stewart

SECTION 2.6 Transformations of Functions 186 186 CHAPTER 2 Functions
y
1
y=x@+1
y=x@
1 x
y
1
y=x@
y=(x
1 x
y
1
y=x@
1 x
y=_x@
y
y=x@
1
y=(x
1 x
y
1
y=Ïx
y=Ïx
1 x
y
1
y=Ïx+1
y=Ïx
1 x
y
1
y=Ïx+2+2
y=Ïx
1 x
y
1
y=Ïx
1 x
y=_Ïx+1
22. (a) The graph of g x
graph upward 1 unit.
(b) The graph of g x
x 1 is obtained by reflecting the graph of f x in the x -axis, then shifting the resulting
x 1 is obtained by reflecting the graph of f x in the y-axis, then shifting the resulting
23. (a)
graph upward 1 unit. (b)
-1)@
(c) (d)
-1)@+3
24. (a) (b)
-2
(c) (d)
25. The graph of y x 1 is obtained from that of y x by shifting to the left 1 unit, so it has graph II.
26. y x 1 is obtained from that of y x by shifting to the right 1 unit, so it has graph IV.
27. The graph of y x 1 is obtained from that of y x by shifting downward 1 unit, so it has graph I.
Full file at https://testbank123.eu/Solutions-Manual-for-Precalculus-Mathematics-for-Calculus-7th-Edition-Stewart
Full file at https://testbank123.eu/Solutions-Manual-for-Precalculus-Mathematics-for-Calculus-7th-Edition-Stewart

SECTION 2.6 Transformations of Functions 187 187 CHAPTER 2 Functions
y
1
y=x@+3
y=x@
1 x
y
1
y=Ïx+1
y=Ïx
1 x
y
1
y=| x |
y=| x |-
1 x
y
+1)@
1
y=x@
1 x
y
5
y=x@
y=(x
1 x
28. The graph of y x is obtained from that of y x by reflecting in the x -axis, so it has graph III.
29. f x x 2 3. Shift the graph of y x 2 upward 3 units. 30. f x x 2 4. Shift the graph of y x 2 downward
4 units.
y
y=x@
1
0 1 x
0 y=x@-4
31. f x x 1. Shift the graph of y x downward
1 unit.
32. f x x 1. Shift the graph of y x upward 1 unit.
1
33. f x x 5 2. Shift the graph of y x 2 to the right
5 units.
34. f x x 1 2. Shift the graph of y x 2 to the left
1 unit.
-5)@ y=(x
Full file at https://testbank123.eu/Solutions-Manual-for-Precalculus-Mathematics-for-Calculus-7th-Edition-Stewart
Full file at https://testbank123.eu/Solutions-Manual-for-Precalculus-Mathematics-for-Calculus-7th-Edition-Stewart

SECTION 2.6 Transformations of Functions 188 188 CHAPTER 2 Functions
y
1
y=Ïx
y=Ïx-4
1 x
y
1
y=| x |
1 x
y=_| x |
y
2
y=Îx
2 x
y=Î_x
35. f x x 2 . Shift the graph of y x to the left
2 units.
36. f x x 4. Shift the graph of y x to the right
4 units.
y
1
y=| x+2 |
y=| x |
1 x
37. f x x 3 . Reflect the graph of y x 3 in the x -axis. 38. f x x . Reflect the graph of y x in the x -axis.
y
2
y=x#
1 x
y=_x#
39. y 4 x . Reflect the graph of y 4 x in the y-axis. 40. y 3 x . Reflect the graph of y 3 x in the y-axis.
y
y=Ï4 _x
1
y=Ï4 x
10 x
Full file at https://testbank123.eu/Solutions-Manual-for-Precalculus-Mathematics-for-Calculus-7th-Edition-Stewart
Full file at https://testbank123.eu/Solutions-Manual-for-Precalculus-Mathematics-for-Calculus-7th-Edition-Stewart

SECTION 2.6 Transformations of Functions 189 189 CHAPTER 2 Functions
y
2
y=Ïx
1 x
y=_5Ïx
y
1
y=| x |
y=1 | x |
2
1 x
y
5
y=x@
y=(x-3)@+
1 x
y
1
y=Ïx
1 x
y=Ïx+4-3
4
4
2
2
41. y 1 x 2. Shrink the graph of y x 2 vertically by a
factor of 1 .
42. y 5 x . Stretch the graph of y x vertically by a
factor of 5, then reflect it in the x -axis.
y
1
y=x@
y=1 x@ 4
1 x
43. y 3 x . Stretch the graph of y x vertically by a
factor of 3.
44. y 1 x . Shrink the graph of y x vertically by a
factor of 1 .
y
1
y=3 | x |
y=| x |
1 x
45. y x 3 2 5. Shift the graph of y x 2 to the right
3 units and upward 5 units.
46. y x 4 3. Shift the graph of y x to the left
4 units and downward 3 units.
5
Full file at https://testbank123.eu/Solutions-Manual-for-Precalculus-Mathematics-for-Calculus-7th-Edition-Stewart
Full file at https://testbank123.eu/Solutions-Manual-for-Precalculus-Mathematics-for-Calculus-7th-Edition-Stewart

190 CHAPTER 2 Functions SECTION 2.6 Transformations of Functions 190
y
1
y=Ïx
1 x
y=2-Ïx+1
y
2
y=x@
1 x
y
y=| x |
1
y=| x+2 |+
1 x
y
1
y=| x |
1 x
y=2-| x |
y
1
y=x@
1 x
y
1
y=Ïx
4 x
y=1 Ïx+4-3
2
2
2
2
2
2
47. y 3 1 x 1 2. Shift the graph of y x 2 to the right
one unit, shrink vertically by a factor of 1 , reflect in the
x -axis, then shift upward 3 units.
48. y 2 x 1. Shift the graph of y x to the left
1 unit, reflect the result in the x -axis, then shift upward
2 units.
y=3- 1 (x-1)@
49. y x 2 2. Shift the graph of y x to the left
2 units and upward 2 units.
50. y 2 x . Reflect the graph of y x in the x -axis,
then shift upward 2 units.
2
51. y 1 x 4 3. Shrink the graph of y x vertically
by a factor of 1 , then shift the result to the left 4 units and
downward 3 units.
52. y 3 2 x 1 2 . Stretch the graph of y x 2 vertically
by a factor of 2, reflect the result in the x -axis, then shift
the result to the right 1 unit and upward 3 units.
y=3-2(x-1)@
53. y f x 3. When f x x 2 , y x 2 3. 54. y f x 5. When f x x 3 , y x 3 5.
55. y f x 2 . When f x x , y x 2. 56. y f x 1 . When f x 3 x , y 3 x 1.
57. y f x 2 5. When f x x , y x 2 5. 58. y f x 4 3. When f x x ,
y x 4 3.
Full file at https://testbank123.eu/Solutions-Manual-for-Precalculus-Mathematics-for-Calculus-7th-Edition-Stewart
Full file at https://testbank123.eu/Solutions-Manual-for-Precalculus-Mathematics-for-Calculus-7th-Edition-Stewart

191 CHAPTER 2 Functions SECTION 2.6 Transformations of Functions 191
2
1
3
2
59. y f x 1. When f x 4 x , y 4
61. y 2 f x 3 2. When f x x 2,
y 2 x 3 2 2.
x 1. 60. y f x 2 . When f x x 2, y x 2 2 .
62. y 1 f x 1 3. When f x x ,
y 2
x 1 3.
63. g x f x 2 x 2 2 x 2 4x 4 64. g x f x 3 x 3 3
65. g x f x 1 2 x 1 2 66. g x 2 f x 2 x
67. g x f x 2 x 2 68. g x f x 2 1 x 2 2 1 x 2 4x 3
69. (a) y f x 4 is graph #3.
(b) y f x 3 is graph #1.
(c) y 2 f x 6 is graph #2.
(d) y f 2x is graph #4.
71. (a) y f x 2
y
(b) y f x 2
70. (a) y 1 f x is graph #2.
(b) y f x 4 is graph #3.
(c) y f x 5 3 is graph #1.
(d) y f x is graph #4.
(c) y 2 f x
y y
1 1 1
1 x 1 x 1 x
(d) y f x 3
y
(e) y f x
y
(f) y 1 f x 1
y
1 1 1
1 x 1 x 1 x
72. (a) y g x 1
y
(b) y g x
y
(c) y g x 2
y
1 1 1
1 x 1 x 1 x
Full file at https://testbank123.eu/Solutions-Manual-for-Precalculus-Mathematics-for-Calculus-7th-Edition-Stewart
Full file at https://testbank123.eu/Solutions-Manual-for-Precalculus-Mathematics-for-Calculus-7th-Edition-Stewart

192 CHAPTER 2 Functions SECTION 2.6 Transformations of Functions 192
2
3
3
4
(d) y g x 2
y
(e) y g x
y
(f) y 2g x
y
1 1 1
1 x 1 x 1 x
73. (a) y g 2x
y
(b) y g 1 x
y
1
1
1 x 1 x
74. (a) y h 3x
y
(b) y h 1 x
y
y=h(x)
1 x
y=h(x)
3
y=h(_1
x)
x
75. y [[2x ]] y 76. y 1 x
y
1 1
1 x 2 x
77. 8
4
-8 -6 -4 -2 0
(d)
(c)
(b)
(a)
2 4 6 8
For part (b), shift the graph in (a) to the left 5 units; for part (c), shift the graph
the graph in (a) to the left 5 units, stretch it vertically by a factor of 2, and then shift
it upward 4 units.
Full file at https://testbank123.eu/Solutions-Manual-for-Precalculus-Mathematics-for-Calculus-7th-Edition-Stewart
Full file at https://testbank123.eu/Solutions-Manual-for-Precalculus-Mathematics-for-Calculus-7th-Edition-Stewart

193 CHAPTER 2 Functions SECTION 2.6 Transformations of Functions 193
3
2
2
78. 6
(a) 4
2
For (b), reflect the graph in (a) in the x -axis; for (c), stretch the graph in (a)
vertically by a factor of 3 and reflect in the x -axis; for (d), shift the graph in (a) to
the right 5 units, stretch it vertically by a factor of 3, and reflect it in the x -axis. The
-8 -6 -4 -2 2 4 6 8
-2
obtain the graphs in part (c) and (d).
79.
(b) (c)
4
-4
-6 (c) (d)
For part (b), shrink the graph in (a) vertically by a factor of 1 ; for part (c), shrink
(a)
2
(b) 3
the graph in (a) vertically by a factor of 1 , and reflect it in the x -axis; for part (d),
shift the graph in (a) to the right 4 units, shrink vertically by a factor of 1 , and then-4 -2 2 4 6
(c) (d)
reflect it in the x -axis.
-2
-4
80.
(b)
4
2 (a)
For (b), shift the graph in (a) to the left 3 units; for (c), shift the graph in (a) to the
left 3 units and shrink it vertically by a factor of 2
; for (d), shift the graph in (a) to
(c) -6 -4 2 4 6
-2
2
3 units. The order in which each operation is applied to the graph in (a) is not
important to sketch (c), while it is important in (d).
(d)
-4
2
81. (a) y f x 2x x 2
(b) y f 2x 2 2x 2x 2 (c) y f
1 x
2 1 x
1 x
4x 4x 2
2 2 2
1
x 4
x 2
4
4
4
2 2 2
-4 -2 -2
2 4 -4 -2 -2
2 4 -4 -2 -2
2 4
-4 -4 -4
The graph in part (b) is obtained by horizontally shrinking the graph in part (a) by a factor of 1 (so the graph is half as
wide). The graph in part (c) is obtained by horizontally stretching the graph in part (a) by a factor of 2 (so the graph is twice
as wide).
82. (a) y f x 2x x 2
(b) y f x
2 x x 2 (c) y f x
x x 2
2x x 2
2x x 2
4
4
4
2 2 2
-4 -2 -2
2 4 -4 -2 -2
2 4 -4 -2 -2
2 4
-4 -4 -4
Full file at https://testbank123.eu/Solutions-Manual-for-Precalculus-Mathematics-for-Calculus-7th-Edition-Stewart
Full file at https://testbank123.eu/Solutions-Manual-for-Precalculus-Mathematics-for-Calculus-7th-Edition-Stewart

194 CHAPTER 2 Functions SECTION 2.6 Transformations of Functions 194
y
2
1 x
2
(d) y f 2x
2 2x 2x 2 (e) y f
1 x
2 1 x
1 x 2
2x x 2
4x 4x 2
2
2
2
1
x 4
x 2
4
4
2 2
-4 -2
-2 2 4
-4
-4 -2
-2 2 4
-4
The graph in part (b) is obtained by reflecting the graph in part (a) in the y-axis. The graph in part (c) is obtained by rotating
the graph in part (a) through 180 about the origin [or by reflecting the graph in part (a) first in the x -axis and then in the
y-axis]. The graph in part (d) is obtained by reflecting the graph in part (a) in the y-axis and then horizontally shrinking the
graph by a factor of 1 (so the graph is half as wide). The graph in part (e) is obtained by reflecting the graph in part (a) in
the y-axis and then horizontally stretching the graph by a factor of 2 (so the graph is twice as wide).
83. f x x 4. f x x 4 x 4 f x . Thus f x
is even.
84. f x x 3. f x x 3 x 3 f x . Thus
f x is odd.
y
2
1 x
85. f x x 2 x . f x x 2 x x 2 x . Thus
f x f x . Also, f x f x , so f x is
neither odd nor even.
y
86. f x x 4 4x 2.
f x x 4 4 x 2 x 4 4x 2 f x . Thus
f x is even.
y
1 1
1 x 1 x
Full file at https://testbank123.eu/Solutions-Manual-for-Precalculus-Mathematics-for-Calculus-7th-Edition-Stewart
Full file at https://testbank123.eu/Solutions-Manual-for-Precalculus-Mathematics-for-Calculus-7th-Edition-Stewart

195 CHAPTER 2 Functions SECTION 2.6 Transformations of Functions 195
87. f x x 3 x . 88. f x 3x 3 2x 2 1.
3 2 3 2
f x x 3 x x 3 x f x 3 x 2 x 1 3x 2x 1.
x 3 x f x . Thus f x f x . Also f x f x , so f x is
neither odd nor even.
y
y
1
1 1 x
1 x
89. f x 1 3 x . f x 1 3 x 1 3 x . Thus
f x f x . Also f x f x , so f x is
neither odd nor even.
90. f x x 1 x .
f x x 1 x x 1 x
y Thus f x is odd.
y
1
1 x
1
1 x
91. (a) Even
y
(b) Odd
y
1 1
1 x 1 x
Full file at https://testbank123.eu/Solutions-Manual-for-Precalculus-Mathematics-for-Calculus-7th-Edition-Stewart
Full file at https://testbank123.eu/Solutions-Manual-for-Precalculus-Mathematics-for-Calculus-7th-Edition-Stewart

196 CHAPTER 2 Functions SECTION 2.6 Transformations of Functions 196
4
2
g
_ 1 3
2
3
4
92. (a) Even
y
(b) Odd
y
1 1
1 x 1 x
93. Since f x x 2 4 0, for 2 x 2, the graph of
94. g x x 4 4x 2
y g x is found by sketching the graph of y f x for y
x 2 and x 2, then reflecting in the x -axis the part of
the graph of y f x for 2 x 2.
3 _1 x
95. (a) f x 4x x 2
(b) f x x x
y y
1 1
1 x 1 x
96. (a) f x x 3
(b) g x x
y y
1 1
1 x 1 x
Full file at https://testbank123.eu/Solutions-Manual-for-Precalculus-Mathematics-for-Calculus-7th-Edition-Stewart
Full file at https://testbank123.eu/Solutions-Manual-for-Precalculus-Mathematics-for-Calculus-7th-Edition-Stewart

197 CHAPTER 2 Functions SECTION 2.6 Transformations of Functions 197
4 t (
50
60
10
97. (a) Luisa drops to a height of 200 feet, bounces up and down, then settles at
350 feet.
(c) To obtain the graph of H from that of h, we shift downward 100 feet.
Thus, H t h t 100.
(b) y (ft)
500
0 s)
98. (a) Miyuki swims two and a half laps, slowing down with each successive lap.
In the first 30 seconds she swims 50 meters, so her average speed is
30 1 67 m s.
(c) Here Miyuki swims 60 meters in 30 seconds, so her average speed is
30 2 m s.
(b)
80
60
40
20
0 100 200 t
This graph is obtained by
stretching the original graph
vertically by a factor of 1 2.
99. (a) The trip to the park corresponds to the first piece of the graph. The class travels 800 feet in 10 minutes, so their average
speed is 800 80 ft min. The second (horizontal) piece of the graph stretches from t 10 to t 30, so the class
spends 20 minutes at the park. The park is 800 feet from the school.
(b)
y
600
400
200
(c)
y
1000
800
600
400
200
0 20 40 60 t
The new graph is obtained by shrinking the original
graph vertically by a factor of 0 50. The new average
speed is 40 ft min, and the new park is 400 ft from
the school.
0 20 40 60 t
This graph is obtained by shifting the original graph
to the right 10 minutes. The class leaves ten minutes
later than it did in the original scenario.
100. To obtain the graph of g x x 2 2 5 from that of f x x 2 2, we shift to the right 4 units and upward 5 units.
101. To obtain the graph of g x from that of f x , we reflect the graph about the y-axis, then reflect about the x -axis, then shift
upward 6 units.
102. f even implies f x f x g even implies g x g x ; f odd implies f x f x and g odd implies
g x g x
If f and g are both even, then f g x f x g x f x g x f g x and f g is even.
If f and g are both odd, then f g x f x g x f x g x f g x and f g is odd.
If f odd and g even, then f g x f x g x f x g x , which is neither odd nor even.
103. f even implies f x f x ; g even implies g x g x ; f odd implies f x f x ; and g odd implies
g x g x .
If f and g are both even, then f g x f x g x f x g x f g x . Thus f g is even.
If f and g are both odd, then f g x f x g x f x g x f x g x f g x . Thus f g is
even
If f if odd and g is even, then f g x f x g x f x g x f x g x f g x . Thus f g is
odd.
Full file at https://testbank123.eu/Solutions-Manual-for-Precalculus-Mathematics-for-Calculus-7th-Edition-Stewart
Full file at https://testbank123.eu/Solutions-Manual-for-Precalculus-Mathematics-for-Calculus-7th-Edition-Stewart

198 CHAPTER 2 Functions SECTION 2.6 Transformations of Functions 198
,
104. f x x n is even when n is an even integer and f x x n is odd when n is an odd integer.
These names were chosen because polynomials with only terms with odd powers are odd functions, and polynomials with
only terms with even powers are even functions.
2.7 COMBINING FUNCTIONS
1. From the graphs of f and g in the figure, we find f g 2 f 2 g 2 3 5 8,
f f 2 3
f g 2 f 2 g 2 3 5 , f g 2 f 2 g 2 3 5 15, and g
2 g 2
5
.
2. By definition, f g x f g x . So, if g 2 5 and f 5 12, then f g 2 f g 2 f 5 12.
3. If the rule of the function f is “add one” and the rule of the function g is “multiply by 2” then the rule of f g is “multiply
by 2, then add one” and the rule of g f is “add one, then multiply by 2.”
4. We can express the functions in Exercise 3 algebraically as f x x 1, g x 2x , f g x 2x 1, and
g f x 2 x 1 .
5. (a) The function f g x is defined for all values of x that are in the domains of both f and g.
(b) The function f g x is defined for all values of x that are in the domains of both f and g.
(c) The function f g x is defined for all values of x that are in the domains of both f and g, and g x is not equal to 0.
6. The composition f g x is defined for all values of x for which x is in the domain of g and g x is in the domain of f .
7. f x x has domain . g x 2x has domain . The intersection of the domains of f and g is
.
f g x x 2x 3x , and the domain is . f g x x 2x x , and the domain is .
f g x x 2x 2x 2 , and the domain is .
f
g
x x
2x
1 2
, and the domain is 0 0 .
8. f x x has domain . g x x has domain [0 . The intersection of the domains of f and g is [0 .
f g x x x , and the domain is [0 . f g x x x , and the domain is [0 .
f g x x x x 3 2 , and the domain is [0 .
f
g
x x
x x , and the domain is 0 .
9. f x x 2 x and g x x 2 each have domain . The intersection of the domains of f and g is .
f g x 2x 2 x , and the domain is . f g x x , and the domain is .
f g x x 4 x 3, and the domain is .
f
g
x
x 2 x
x 2
1
1
x , and the domain is 0 0 .
10. f x 3 x 2 and g x x 2 4 each have domain . The intersection of the domains of f and g is .
f g x 1, and the domain is . f g x 2x 2 7, and the domain is .
f g x 3 x 2
x 2 4
x 4 7x 2 12, and the domain is .
and the domain is 2 2 2 2 .
f
g
x
3 x 2
x 2 4
3 x 2
x 2 x 2
11. f x 5 x and g x x 2 3x each have domain . The intersection of the domains of f and g is .
f g x 5 x x 2 3x
x 2 4x 5, and the domain is .
f g x 5 x x 2 3x
x 2 2x 5, and the domain is .
f g x 5 x x 2 3x
x 3 8x 2 15x , and the domain is . f
g
x 5 x
x 2 3x
5 x x x 3
, and the domain is 0 0 3 3 .
Full file at https://testbank123.eu/Solutions-Manual-for-Precalculus-Mathematics-for-Calculus-7th-Edition-Stewart
Full file at https://testbank123.eu/Solutions-Manual-for-Precalculus-Mathematics-for-Calculus-7th-Edition-Stewart
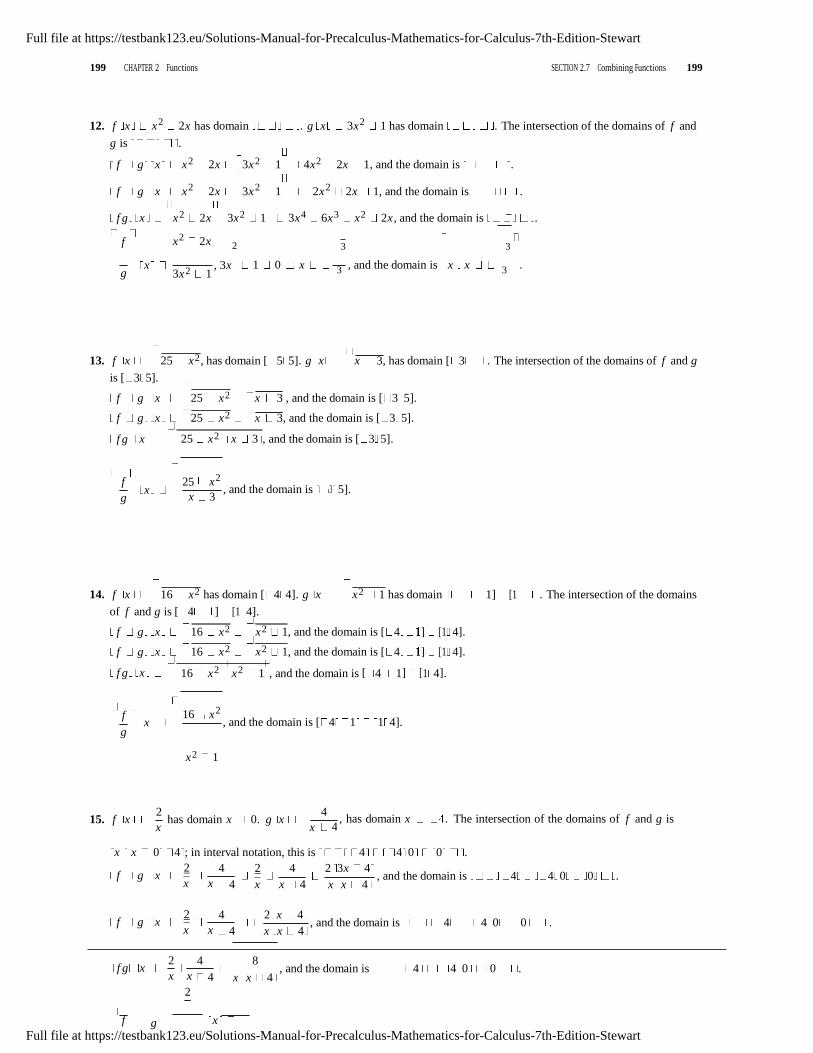
SECTION 2.7 Combining Functions 199 199 CHAPTER 2 Functions
4
12. f x x 2 2x has domain . g x 3x 2 1 has domain . The intersection of the domains of f and
g is .
f g x x 2 2x 3x 2 1
4x 2 2x 1, and the domain is .
f g x x 2 2x 3x 2 1
2x 2 2x 1, and the domain is .
f g x x 2 2x
3x 2 1
3x 4 6x 3 x 2 2x , and the domain is .
f
x 2 2x 2
3
3
g x
3x 2 , 3x
1 1 0 x
3 , and the domain is x x
3 .
13. f x 25 x 2 , has domain [ 5 5]. g x x 3, has domain [ 3 . The intersection of the domains of f and g
is [ 3 5].
f g x 25 x 2 x 3 , and the domain is [ 3 5].
f g x 25 x 2 x 3, and the domain is [ 3 5].
f g x 25 x 2
x 3 , and the domain is [ 3 5].
f
g x
25 x 2 , and the domain is 3 5].
x 3
14. f x 16 x 2 has domain [ 4 4]. g x x 2 1 has domain 1] [1 . The intersection of the domains
of f and g is [ 4 ] [1 4].
f g x 16 x 2 x 2 1, and the domain is [ 4 ] [1 4].
f g x 16 x 2 x 2 1, and the domain is [ 4 ] [1 4].
f g x 16 x 2
x 2 1 , and the domain is [ 4 1] [1 4].
f
g
x
16
x 2 , and the domain is [ 4 1 1 4].
x 2 1
2 15. f x
x has domain x 0. g x
x
4 , has domain x . The intersection of the domains of f and g is
x x 0 4 ; in interval notation, this is 4 4 0 0 .
2 f g x
x x
4
4
2 4
x x 4
2 3x 4 x x 4
, and the domain is 4 4 0 0 .
2 f g x
x x
4 2 x 4
4
x x 4
, and the domain is 4 4 0 0 .
2 f g x
x x
2
4
4
8
x x 4
, and the domain is 4 4 0 0 .
f g
x
Full file at https://testbank123.eu/Solutions-Manual-for-Precalculus-Mathematics-for-Calculus-7th-Edition-Stewart
Full file at https://testbank123.eu/Solutions-Manual-for-Precalculus-Mathematics-for-Calculus-7th-Edition-Stewart

SECTION 2.7 Combining Functions 200 200 CHAPTER 2 Functions
x 4
x 4
x
4 ,
an
d
th
e
do
m
ai
n
is
4
4
0
0
.
2x
Full file at https://testbank123.eu/Solutions-Manual-for-Precalculus-Mathematics-for-Calculus-7th-Edition-Stewart
Full file at https://testbank123.eu/Solutions-Manual-for-Precalculus-Mathematics-for-Calculus-7th-Edition-Stewart

SECTION 2.7 Combining Functions 201 201 CHAPTER 2 Functions
4
2 f
f+g
g
-4 -2 0 2 4
g
f+g 0 f
40
20
f+g g
f
-4 -2
-20
-40
2 4
1
16. f x
x
2
has domain x 1. g x
x
x 1
has domain x 1 The intersection of the domains of f and g is
x x 1 ; in interval notation, this is 1 1 .
f g x x
f g x x
2
1
2
1
x
x 1
x
x 1
x 2 x 1
2 x x 1
, and the domain is 1 1 .
, and the domain is 1 1 .
f g x x 2
1
x
x 1
2x
x 1 2
, and the domain is 1 1 .
f
g
x
2
x x
1
x 1
2
x
, so x 0 as well. Thus the domain is 1 1 0 0 .
17. f x x 3 x . The domain of x is [0 , and the domain of 3 x is 3]. Thus, the domain of f is
3] 0 [0 3].
18. f x x 4 1 x
x
. The domain of
x 4 is [ 4 , and the domain of 1 x
x
is 0 0 1]. Thus, the
domain of f is [ 4 0 0 1] [ 4 0 0 1].
119. h x x 3 4
x 3 1 4 . Since 1 4 is an even root and the denominator can not equal 0, x 3 0 x 3
So the domain is 3 .
x 3 120. k x . The domain of
x 1 x 3 is [ 3 , and the domain of
x 1 is x 1. Since x 1 is 1 1 ,
the domain is [ 3 1 1 [ 3 1 1 .
21. y 22. y
f+g
f
23.
0 g x
x
24. 5
4
3
2
1
f+g
f
g
25. 26.
f
3
f+g
2
1
g
0 1 2 -4 -2 0 2 4
27. f x 2x 3 and g x 4 x 2.
(a) f g 0 f 4 0 2
f 4 2 4 3 5
(b) g f 0 g 2 0 3 g 3 4 3 2 5
28. (a) f f 2 f 2 2 3 f 1 2 1 3 1
(b) g g 3 g 4 32
g 5 4 5 2 21
Full file at https://testbank123.eu/Solutions-Manual-for-Precalculus-Mathematics-for-Calculus-7th-Edition-Stewart
Full file at https://testbank123.eu/Solutions-Manual-for-Precalculus-Mathematics-for-Calculus-7th-Edition-Stewart

SECTION 2.7 Combining Functions 201 201 CHAPTER 2 Functions
29. (a) f g 2 f g 2 f 4 2 2
f 0 2 0 3 3
(b) g f 2 g f 2 g 2 2 3 g 7 4 7 2 45
30. (a) f f 1 f f 1 f 2 1 3 f 5 2 5 3 13
(b) g g 1 g g 1 g 4 1 2
g 3 4 32 5
31. (a) f g x f g x f 4 x 2
2 4 x 2
3 8 2x 2 3 5 2x 2
(b) g f x g f x g 2x 3 4 2x 3 2 4 4x 2 12x 9
4x 2 12x 5
32. (a) f f x f f x f 3x 5 3 3x 5 5 9x 15 5 9x 20
2(b) g g x g g x g 2 x 2
2 2 x 2 2 4 4x 2 x 4
x 4 4x 2 2
33. f g 2 f 5 4 34. f 0 0, so g f 0 g 0 3.
35. g f 4 g f 4 g 2 5 36. g 0 3, so f g 0 f 3 0.
37. g g 2 g g 2 g 1 4 38. f 4 2, so f f 4 f 2 2.
39. From the table, g 2 5 and f 5 6, so f g 2 6.
40. From the table, f 2 3 and g 3 6, so g f 2 6.
41. From the table, f 1 2 and f 2 3, so f f 1 3.
42. From the table, g 2 5 and g 5 1, so g g 2 1.
43. From the table, g 6 4 and f 4 1, so f g 6 1.
44. From the table, f 2 3 and g 3 6, so g f 2 6.
45. From the table, f 5 6 and f 6 3, so f f 5 3.
46. From the table, g 2 5 and g 5 1, so g g 5 1.
47. f x 2x 3, has domain ; g x 4x 1, has domain .
f g x f 4x 1 2 4x 1 3 8x 1, and the domain is .
g f x g 2x 3 4 2x 3 1 8x 11, and the domain is .
f f x f 2x 3 2 2x 3 3 4x 9, and the domain is .
g g x g 4x 1 4 4x 1 1 16x 5, and the domain is .
x 48. f x 6x 5 has domain . g x
2 has domain .
x x
f g x f
6
5 3x 5, and the domain is . 2 2
6x 5 5g f x g 6x 5 2
3x 2
, and the domain is .
f f x f 6x 5 6 6x 5 5 36x 35, and the domain is . x
x g g x g
2 2 x
2 4
, and the domain is .
49. f x x 2, has domain ; g x x 1, has domain .
f g x f x 1 x 1 2 x 2 2x 1, and the domain is .
g f x g x 2
x 2
1 x 2 1, and the domain is .
2 f f x f x 2
x 2 x 4, and the domain is .
g g x g x 1 x 1 1 x 2, and the domain is .
Full file at https://testbank123.eu/Solutions-Manual-for-Precalculus-Mathematics-for-Calculus-7th-Edition-Stewart
Full file at https://testbank123.eu/Solutions-Manual-for-Precalculus-Mathematics-for-Calculus-7th-Edition-Stewart

SECTION 2.7 Combining Functions 202 202 CHAPTER 2 Functions
3
4
3
50. f x x 3 2 has domain . g x 3 x has domain .
f g x f 3 x
3 x 3
2 x 2, and the domain is .
g f x g x 3 2
x 3 2 and the domain is .
f f x f x 3 2
x 3 2
.
2 x 9 6x 6 12x 3 8 2 x 9 6x 6 12x 3 10, and the domain is
1 3g g x g 3 x
3 3 x x 1 3 x 1 9, and the domain is .
1 51. f x
x , has domain x x 0 ; g x 2x 4, has domain .
1 f g x f 2x 4
2x . f g x is defined for 2x 4 0 x . So the domain is
x x 2 2 2 .
g f x g
1
x
1
2 x
2 4
x 4, the domain is x x 0 0 0 .
f f x f
1
x
1
1 x . f f x is defined whenever both f x and f f x are defined; that is,
x
whenever x x 0 0 0 .
g g x g 2x 4 2 2x 4 4 4x 8 4 4x 12, and the domain is .
52. f x x 2 has domain . g x x 3 has domain [3 .
2 f g x f x 3
x 3 x 3, and the domain is [3 .
g f x g x 2
x 2 3. For the domain we must have x 2 3 x 3 or x 3. Thus the domain is
3 3 .
2 f f x f x 2
x 2 x 4, and the domain is .
g g x g x 3
x 3 3. For the domain we must have x 3 3 x 3 9 x 12, so the
domain is [12 .
53. f x x , has domain ; g x 2x 3, has domain
f g x f 2x 4 2x 3 , and the domain is .
g f x g x 2 x 3, and the domain is .
f f x f x x x , and the domain is .
g g x g 2x 3 2 2x 3 3 4x 6 3 4x 9. Domain is .
54. f x x 4 has domain . g x x 4 has domain .
f g x f x 4 x 4 4, and the domain is .
g f x g x 4 x 4 4 x , and the domain is .
Full file at https://testbank123.eu/Solutions-Manual-for-Precalculus-Mathematics-for-Calculus-7th-Edition-Stewart
Full file at https://testbank123.eu/Solutions-Manual-for-Precalculus-Mathematics-for-Calculus-7th-Edition-Stewart

SECTION 2.7 Combining Functions 203 203 CHAPTER 2 Functions
f f x f x 4 x 4 4 x 8, and the domain is .
g g x g x 4 x 4 4 x 4 4 ( x 4 4 is always positive). The domain is .
Full file at https://testbank123.eu/Solutions-Manual-for-Precalculus-Mathematics-for-Calculus-7th-Edition-Stewart
Full file at https://testbank123.eu/Solutions-Manual-for-Precalculus-Mathematics-for-Calculus-7th-Edition-Stewart

SECTION 2.7 Combining Functions 204 204 CHAPTER 2 Functions
1
2 1
1
x 1
x 1 2
x
x
x 1
55. f x
x
x
, has domain x x 1 ; g x 2x 1, has domain
2x 1 2x 1
f g x f 2x 1 2x
1 1 2x , and the domain is x x 0 0 0 .
x
g f x g
x
x 1
x
1 2x
x 1
1, and the domain is x x 1 1 1
x x 1 x 1 x x
f f x f
x 1 x
x 1 1
x 1
x
x 1 2x
. f f x is defined whenever both f x and 1
1
f f x are defined; that is, whenever x 1 and 2x 1 0 x 2
, which is 1 1 1 2
.
g g x g 2x 1 2 2x 1 1 4x 2 1 4x 3, and the domain is .
1 2 56. f x
x has domain x x 0 g x x
1
4x has domain .
f g x f x 2 4x
x 2 4x
. f g x is defined whenever 0 x 2 4x x x 4 . The product of two
numbers is positive either when both numbers are negative or when both numbers are positive. So the domain of f g is
x x 0 and x 4 x x 0 and x 4 which is 0 4 . 1
1 2 1
1 4
g f x g x
x
4 x
x
x
. g f x is defined whenever both f x and g f x are
defined, that is, whenever x 0. So the domain of g f is 0 .
f f x f
1
x
1
1
x
1 4
. f f x is defined whenever both f x and f f x are defined, that is,
whenever x 0. So the domain of f f is 0 .
2g g x g x 2 4x
x 2 4x
and the domain is .
4 x 2 4x
x 4 8x 3 16x 2 4x 2 16x x 4 8x 3 12x 2 16x ,
57. f x x x
, has domain x x 1 ; g x
1
x has domain x x 0 .
f g x f
1
1
x 1
1
1
x 1
. f g x is defined whenever both g x and f g x are 1
x 1 x x 1
defined, so the domain is x x 1 0 . x
g f x g
1 x
x 1
x 1 . g f x is defined whenever both f x and g f x are defined, so the
x
domain is x x 1 0 .
f f x f
x
x 1
x x 1
x 1 1
x
x x 1
x
x
2x 1
. f f x is defined whenever both f x and
1
Full file at https://testbank123.eu/Solutions-Manual-for-Precalculus-Mathematics-for-Calculus-7th-Edition-Stewart
Full file at https://testbank123.eu/Solutions-Manual-for-Precalculus-Mathematics-for-Calculus-7th-Edition-Stewart

SECTION 2.7 Combining Functions 205 205 CHAPTER 2 Functions
2
f f x are defined, so the domain is x x 1 1 .
g g x g
x x 0 .
1
1
x 1 x
x . g g x is defined whenever both g x and g g x are defined, so the domain is
Full file at https://testbank123.eu/Solutions-Manual-for-Precalculus-Mathematics-for-Calculus-7th-Edition-Stewart
Full file at https://testbank123.eu/Solutions-Manual-for-Precalculus-Mathematics-for-Calculus-7th-Edition-Stewart

SECTION 2.7 Combining Functions 206 206 CHAPTER 2 Functions
2
2
3 3
3 x 1
4
x 2
.
2
58. f x x
has domain x x 0 ; g x x
x
has domain x x 2 .
f g x f
x
x 2
2 x
x 2
2x 4 . f g x is defined whenever both g x and f g x are defined; that
x
is, whenever x 0 and x . So the domain is x x 0 2 .
2
g f x g
2
x
x 2
2 2 2x
1 1
. g f x is defined whenever both f x and g f x are defined; x
x 2
that is, whenever x 0 and x 1. So the domain is x x 0 1 .
f f x f
2
2
x 2
x
x . f f x is defined whenever both f x and f f x are defined; that is, whenever
x 0. So the domain is x x 0 . x
x g g x g
x 2 x
2 x
x
x
2 x
x
2 3x
. g g x is defined whenever both g x and 4
g g x are defined; that is whenever x 2 and x 4 . So the domain is
59. f g h x f g h x f g x 1 f x 1
x 1 1
3
x x 2 4 .
60. g h x g x 2 2
x 2 2 x 6 6x 4 12x 2 8.
1 f g h x f x 6 6x 4 12x 2 8
.
x 6 6x 4 12x 2 8
61. f g h x f g h x f g x
f x 5
x 54
1
3 x
3 x
3 x
62. g h x g 3 x
. f g h x f 3
x 1
3
x 1
For Exercises 63–72, many answers are possible.
63. F x x 9 5. Let f x x 5 and g x x 9, then F x f g x .
64. F x x 1. If f x x 1 and g x x , then F x f g x .
x 2 65. G x
x 2
1
. Let f x
1
x
x 4
and g x x
2, then G x f g x .
66. G x x
. If f x 3 x
and g x x 3, then G x f g x .
67. H x 1 x 3 . Let f x x and g x 1 x 3, then H x f g x .
68. H x 1 x . If f x 1 x and g x x , then H x f g x .
69. F x x 2
1
. Let f x 1
1
x , g x x 1, and h x x
2, then F x f g h x .
70. F x 3 x 1. If g x x 1 and h x x , then g h x x 1, and if f x 3 x , then
F x f g h x .
71. G x 4 3 x 9. Let f x x 9 , g x 4 x , and h x 3 x , then G x f g h x .
Full file at https://testbank123.eu/Solutions-Manual-for-Precalculus-Mathematics-for-Calculus-7th-Edition-Stewart
Full file at https://testbank123.eu/Solutions-Manual-for-Precalculus-Mathematics-for-Calculus-7th-Edition-Stewart

SECTION 2.7 Combining Functions 207 207 CHAPTER 2 Functions
72. G x
3
2
x
2
. If g x 3 x and h x
x , then g h x 3
x , and if f x
2 , then
x 2
G x f g h x .
Full file at https://testbank123.eu/Solutions-Manual-for-Precalculus-Mathematics-for-Calculus-7th-Edition-Stewart
Full file at https://testbank123.eu/Solutions-Manual-for-Precalculus-Mathematics-for-Calculus-7th-Edition-Stewart

SECTION 2.7 Combining Functions 208 208 CHAPTER 2 Functions
3
73. Yes. If f x m1 x b1 and g x m2 x b2 , then
f g x f m2 x b2 m1 m2 x b2 b1 m1 m2 x m1 b2 b1, which is a linear function, because it is of the
form y mx b. The slope is m1 m2 .
74. g x 2x 1 and h x 4x 2 4x 7.
Method 1: Notice that 2x 1 2 4x 2 4x 1. We see that adding 6 to this quantity gives
2x 1 2 6 4x 2 4x 1 6 4x 2 4x 7, which is h x . So let f x x 2 6, and we have
f g x 2x 1 2 6 h x .
Method 2: Since g x is linear and h x is a second degree polynomial, f x must be a second degree polynomial,
that is, f x ax 2 bx c for some a, b, and c. Thus f g x f 2x 1 a 2x 1 2 b 2x 1 c
4ax 2 4ax a 2bx b c 4ax 2 4a 2b x a b c 4x 2 4x 7. Comparing this with f g x , we
have 4a 4 (the x 2 coefficients), 4a 2b 4 (the x coefficients), and a b c 7 (the constant terms) a 1 and
2a b 2 and a b c 7 a 1, b 0 c 6. Thus f x x 2 6.
f x 3x 5 and h x 3x 2 3x 2.
Note since f x is linear and h x is quadratic, g x must also be quadratic. We can then use trial and error to find g x .
Another method is the following: We wish to find g so that f g x h x . Thus f g x 3x 2 3x 2
3 g x 5 3x 2 3x 2 3 g x 3x 2 3x 3 g x x 2 x 1.
75. The price per sticker is 0 15 0 000002x and the number sold is x , so the revenue is
R x 0 15 0 000002x x 0 15x 0 000002x 2.
76. As found in Exercise 75, the revenue is R x 0 15x 0 000002x 2 , and the cost is 0 095x 0 0000005x 2, so the profit
is P x 0 15x 0 000002x 2 0 095x 0 0000005x 2
0 055x 0 0000015x 2.
77. (a) Because the ripple travels at a speed of 60 cm/s, the distance traveled in t seconds is the radius, so g t 60t .
(b) The area of a circle is r 2, so f r r 2 .
(c) f g g t 2 60t 2 3600 t 2 cm2. This function represents the area of the ripple as a function of time.
78. (a) Let f t be the radius of the spherical balloon in centimeters. Since the radius is increasing at a rate of 1 cm/s, the
radius is f t t after t seconds.
(b) The volume of the balloon can be written as g r 4 r 3 .
(c) g f 4 t 3 4 t 3. g f represents the volume as a function of time. 3 3
79. Let r be the radius of the spherical balloon in centimeters. Since the radius is increasing at a rate of 2 cm/s, the radius is r 2t
after t seconds. Therefore, the surface area of the balloon can be written as S 4 r 2 4 2t 2 4 4t 2
16 t 2 .
80. (a) f x 0 80x
(b) g x x 50
(c) f g x f x 50 0 80 x 50 0 80x 40. f g represents applying the $50 coupon, then the
20% discount. g f x g 0 80x 0 80x 50. g f represents applying the 20% discount, then the $50
coupon. So applying the 20% discount, then the $50 coupon gives the lower price.
81. (a) f x 0 90x
(b) g x x 100
(c) f g x f x 100 0 90 x 100 0 90x 90. f g represents applying the $100 coupon, then the
10% discount. g f x g 0 90x 0 90x 100. g f represents applying the 10% discount, then the
$100 coupon. So applying the 10% discount, then the $100 coupon gives the lower price.
82. Let t be the time since the plane flew over the radar station.
(a) Let s be the distance in miles between the plane and the radar station, and let d be the horizontal distance that the plane
has flown. Using the Pythagorean theorem, s f d 1 d 2.
Full file at https://testbank123.eu/Solutions-Manual-for-Precalculus-Mathematics-for-Calculus-7th-Edition-Stewart
Full file at https://testbank123.eu/Solutions-Manual-for-Precalculus-Mathematics-for-Calculus-7th-Edition-Stewart

SECTION 2.7 Combining Functions 209 209 CHAPTER 2 Functions
(b) Since distance rate time, we have d g t 350t .
(c) s t f g t f 350t 1 350t 2 1 122,500t 2.
83. A x 1 05x A A x A A x A 1 05x 1 05 1 05x 1 05 2 x .
A A A x A A A x A 1 05 2 x
1 05
1 05 2 x
1 05 3 x .
A A A A x A A A A x A 1 05 3 x
1 05
1 05 3 x
1 05 4 x . A represents the amount in
the account after 1 year; A A represents the amount in the account after 2 years; A A A represents the amount in the
account after 3 years; and A A A A represents the amount in the account after 4 years. We can see that if we compose
n copies of A, we get 1 05 n x .
84. If g x is even, then h x f g x f g x h x . So yes, h is always an even function.
If g x is odd, then h is not necessarily an odd function. For example, if we let f x x 1 and g x x 3, g is an odd
function, but h x f g x f x 3
x 3 1 is not an odd function.
If g x is odd and f is also odd, then
h x f g x f g x f g x f g x f g x h x . So in this case, h is also an
odd function.
If g x is odd and f is even, then h x f g x f g x f g x f g x f g x h x ,
so in this case, h is an even function.
2.8 ONE-TO-ONE FUNCTIONS AND THEIR INVERSES
1. A function f is one-to-one if different inputs produce different outputs. You can tell from the graph that a function is
one-to-one by using the Horizontal Line Test.
2. (a) For a function to have an inverse, it must be one-to-one. f x x 2 is not one-to-one, so it does not have an inverse.
However g x x 3 is one-to-one, so it has an inverse.
(b) The inverse of g x x 3 is g 1 x 3 x .
3. (a) Proceeding backward through the description of f , we can describe f 1 as follows: “Take the third root, subtract 5,
then divide by 3.”
(b) f x 3x 5 3 and f x 3 x 5
. 3
4. Yes, the graph of f is one-to-one, so f has an inverse. Because f 4 1, f 1 1 4, and because f 5 3,
f 1 3 5.
5. If the point 3 4 is on the graph of f , then the point 4 3 is on the graph of f 1. [This is another way of saying that
f 3 4 f 4 3.]
6. (a) False. For instance, if f x x , then f 1 x x , but
(b) This is true, by definition.
1 1
f x x
f x .
7. By the Horizontal Line Test, f is not one-to-one. 8. By the Horizontal Line Test, f is one-to-one.
9. By the Horizontal Line Test, f is one-to-one. 10. By the Horizontal Line Test, f is not one-to-one.
11. By the Horizontal Line Test, f is not one-to-one. 12. By the Horizontal Line Test, f is one-to-one.
13. f x 2x 4. If x1 x2, then 2x1 2x2 and 2x1 4 2x2 4. So f is a one-to-one function.
14. f x 3x 2. If x1 x2 , then 3x1 3x2 and 3x1 2 3x2 2. So f is a one-to-one function.
Full file at https://testbank123.eu/Solutions-Manual-for-Precalculus-Mathematics-for-Calculus-7th-Edition-Stewart
Full file at https://testbank123.eu/Solutions-Manual-for-Precalculus-Mathematics-for-Calculus-7th-Edition-Stewart

SECTION 2.8 One-to-One Functions and Their Inverses 207 207 CHAPTER 2 Functions
1
15. g x x . If x1 x2, then x1 x2 because two different numbers cannot have the same square root. Therefore, g is
a one-to-one function.
16. g x x . Because every number and its negative have the same absolute value (for example, 1 1 1 ), g is not a
one-to-one function.
17. h x x 2 2x . Because h 0 0 and h 2 2 2 2 0 we have h 0 h 2 . So f is not a one-to-one function.
18. h x x 3 8. If x1 x2, then x 3 x 3 and x 3 8 x 3 8. So f is a one-to-one function. 1 2 1 2
19. f x x 4 5. Every nonzero number and its negative have the same fourth power. For example, 1 4 1 1 4, so
f 1 f 1 . Thus f is not a one-to-one function.
20. f x x 4 5, 0 x 2. If x1 x2 , then x 4 x 4 because two different positive numbers cannot have the same fourth 1 2
power. Thus, x 4 5 x 4 5. So f is a one-to-one function. 1 2
21. r t t 6 3, 0 t 5. If t1 t2, then t 6 t 6 because two different positive numbers cannot have the same sixth power. 1 2
Thus, t 6 3 t 6 3. So r is a one-to-one function. 1 2
22. r t t 4 1. Every nonzero number and its negative have the same fourth power. For example, 1 4 1 1 4 , so
r 1 r 1 . Thus r is not a one-to-one function.
1 23. f x
x 2 . Every nonzero number and its negative have the same square. For example, 1
1 2 1 1
, so
f 1 f 1 . Thus f is not a one-to-one function.
1 2
1 1 124. f x
x . If x1 x2 , then
x x2
. So f is a one-to-one function.
25. (a) f 2 7. Since f is one-to-one, f 1 7 2.
(b) f 1 3 1. Since f is one-to-one, f 1 3.
26. (a) f 5 18. Since f is one-to-one, f 18 5.
(b) f 1 4 2. Since f is one-to-one, f 2 4.
27. f x 5 2x . Since f is one-to-one and f 1 5 1 3, then f 1 3 1. (Find 1 by solving the equation
5 2x 3.)
28. To find g 5 , we find the x value such that g x 5; that is, we solve the equation g x x 2 4x 5. Now
x 2 4x 5 x 2 4x 5 0 x 1 x 5 0 x 1 or x 5. Since the domain of g is [ 2 , x 1 is
the only value where g x 5. Therefore, g 5 1.
29. (a) Because f 6 2, f 1 2 6. (b) Because f 2 5, f 1 5 2. (c) Because f 0 6, f 1 6 0.
30. (a) Because g 4 2, g 1 2 4. (b) Because g 7 5, g 5 7. (c) Because g 8 6, g 1 6 8.
31. From the table, f 4 5, so f 1 5 4. 32. From the table, f 5 0, so f 1 0 5.
33. f 1 f 1 1 34. f f 6 6
35. From the table, f 6 1, so f 1 1 6. Also, f 2 6, so f 6 1. Thus, f f 1 1
36. From the table, f 5 0, so f 1 0 5. Also, f 4 5, so f 5 4. Thus, f f 1 0
f 6 1.
f 5 4.
37. f g x f x 6 x 6 6 x for all x .
g f x g x 6 x 6 6 x for all x . Thus f and g are inverses of each other.
x x
38. f g x f
3
x for all x . 3 3
3xg f x g 3x
3 x for all x . Thus f and g are inverses of each other.
Full file at https://testbank123.eu/Solutions-Manual-for-Precalculus-Mathematics-for-Calculus-7th-Edition-Stewart
Full file at https://testbank123.eu/Solutions-Manual-for-Precalculus-Mathematics-for-Calculus-7th-Edition-Stewart
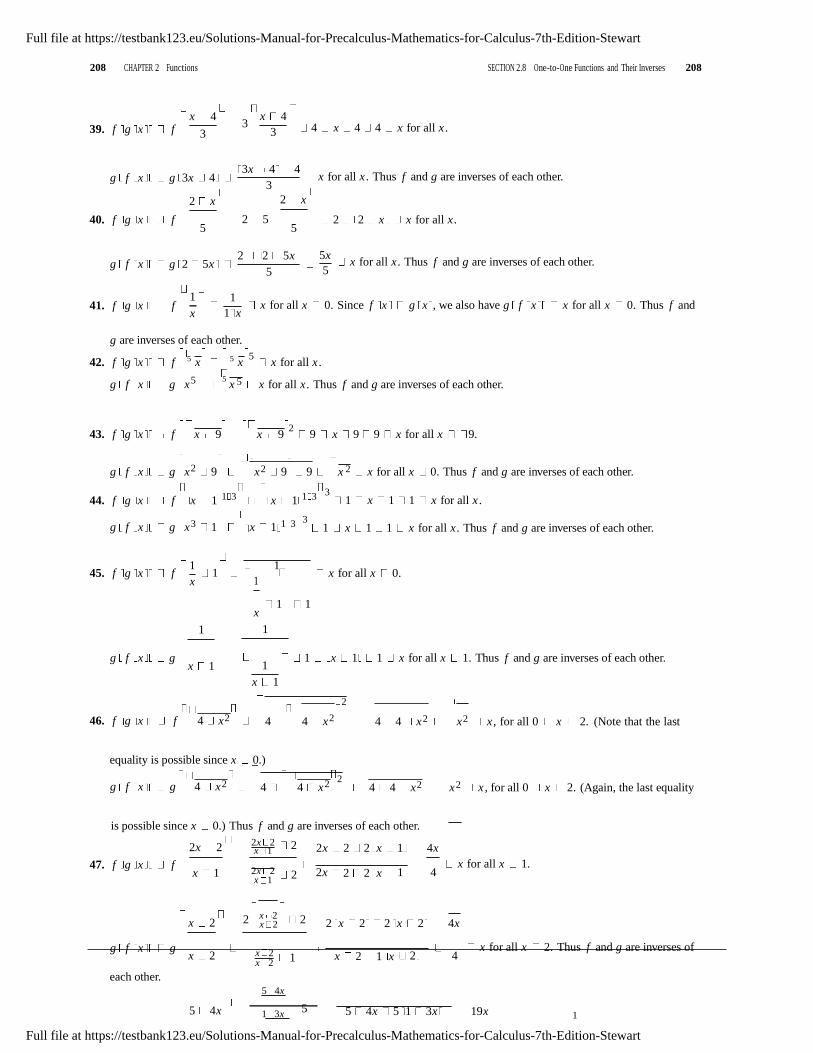
SECTION 2.8 One-to-One Functions and Their Inverses 208 208 CHAPTER 2 Functions
x 1 2
x 2
5
39. f g x f
x 4
3
x 4
3 3
4 x 4 4 x for all x .
g f x g 3x 4
2 x
3x 4 4
3 x for all x . Thus f and g are inverses of each other.
2 x
40. f g x f 5
2 5 5
2 2 x x for all x .
g f x g 2 5x 2 2 5x
5
5x
5 x for all x . Thus f and g are inverses of each other.
41. f g x f
1
x
1 1 x
x for all x 0. Since f x g x , we also have g f x x for all x 0. Thus f and
g are inverses of each other.
42. f g x f 5 x
5 x 5
x for all x .
g f x g x 5
x 5 x for all x . Thus f and g are inverses of each other.
43. f g x f x 9
x 92
9 x 9 9 x for all x 9.
g f x g x 2 9
x 2 9
9 x 2 x for all x 0. Thus f and g are inverses of each other.
344. f g x f
x 1 1 3
x 1 1 3
1 x 1 1 x for all x .
3g f x g x 3 1
x 1 1 3 1 x 1 1 x for all x . Thus f and g are inverses of each other.
1
1
45. f g x f x
1 1 x for all x 0.
1
x 1 1
1
g f x g
x 1
1
x 1
1 x 1 1 x for all x 1. Thus f and g are inverses of each other.
2
46. f g x f 4 x 2
4 4 x 2 4 4 x 2 x 2 x , for all 0 x 2. (Note that the last
equality is possible since x 0.)
2g f x g 4 x 2
4 4 x 2 4 4 x 2 x 2 x , for all 0 x 2. (Again, the last equality
is possible since x 0.) Thus f and g are inverses of each other.
2x 2 2x 2
x 1 2 2x 2 2 x 1 4x
47. f g x f
x 1 2x 2
2x
2
2 x 1 4 x for all x 1.
x 2 2
x 2
2
x 2
2 x 2 2 x 2 4x
g f x g
each other.
x 2
x 2 1
5 4x
x 2
1 x 2 4 x for all x 2. Thus f and g are inverses of
5 4x
1 3x 5 5 4x 5 1 3x 19x 1
Full file at https://testbank123.eu/Solutions-Manual-for-Precalculus-Mathematics-for-Calculus-7th-Edition-Stewart
Full file at https://testbank123.eu/Solutions-Manual-for-Precalculus-Mathematics-for-Calculus-7th-Edition-Stewart

SECTION 2.8 One-to-One Functions and Their Inverses 209 209 CHAPTER 2 Functions
48. f g x f
1 3x 3 5 4x
4
3x
3 5 4x 4 1 3x
19
x for all x 3
.
x 5
5 4 x 5
3x 5 3x 4 4 x 5
19x 4
g f x g 3x 4
x 5
3x
4 3 x
5 for all x
3 . Thus f and g are inverses
of each other.
1 3 3x
4
19
49. f x 3x 5. y 3x 5 3x y 5 x 1 y 5 1 y 5 . So f x 1 x 5 .3 3 3
1 7 3 3
1 1 7
50. f x 7 5x . y 7 5x 5x 7 y x 1 7 y y . So f x x .5 5 5 5 5
Full file at https://testbank123.eu/Solutions-Manual-for-Precalculus-Mathematics-for-Calculus-7th-Edition-Stewart
Full file at https://testbank123.eu/Solutions-Manual-for-Precalculus-Mathematics-for-Calculus-7th-Edition-Stewart

SECTION 2.8 One-to-One Functions and Their Inverses 210 210 CHAPTER 2 Functions
1 1
x 1
x
x
y
x
1
1
1
1
51. f x 5 4x 3 . y 5 4x 3 4x 3 5 y x 3 1 5 y x 3 1 5 y . So f 1 x 3 1 5 x . 4 4 4
52. f x 3x 3 8. y 3x 3 8 3x 3 y 8 x 3 1 y 8 x 3 1 y 8 . So f x 3 1 x 8 .
1 1 1 3 3 3 3 3
1 1 1
53. f x . y 2
x 2 x 2
y x
y 2. So f
x
x 2.
x 2 x 2
54. f x . y 2
x 2 y x 2 x 2 xy 2 y x 2 xy x 2 2y x y 1 2 y 1
2 y 1
1 2 x 1
x
x
. So f 1
x
x . x 1
4y
55. f x . y 4
4x f x .
x 4 y x 4 x xy 4y x x xy 4 y x 1 y 4y x
1 y . So
56. f x
x
1 x
3x . y
2
2x
3x
x 2
y x 2 3x xy 2y 3x xy 3x 2 y x y 3 2y x
2y
y 3
. So
f 1 x . x 3
2x 5 2x 5
57. f x . y x 7
x 7 y x 7 2x 5 xy 7y 2x 5 xy 2x 7y 5 x y 2 7 y 5
7 y 5 1 7x 5
x . So f y 2
x . x 2
4x 2 4x 2
58. f x 3x
. y
3x 1 y 3x 1 4x 2 3xy y 4x 2 4x 3xy y 2 x 4 3 y y 2
y 2 1 x 2
x 4
. So f 3y
x . 4 3x
2x 3 2x 3
59. f x . y 5x
1 5x y 1 5x 2x 3 y 5xy 2x 3 2x 5xy y 3 x 2 5 y y 3
y 3 1 x 3
x 5 y
. So f 2
x . 5x 2
3 4x 3 4x y 3
60. f x 8x
. y
8x 1 y 8x 1 3 4x 8xy y 3 4x 4x 2 y 1 y 3 x .
4 2 y 1
So f 1 x x 3
. 4 2x 1
61. f x 4 x 2 , x 0. y 4 x 2 x 2 4 y x 4 y. So f x 4 x , x 4. [Note that x 0
f x 4.]
2 1 2 262. f x x 2 x x 2 x 1
1 x 1
, x . y x 1
y 1
4 4 2 4 2 1 1
2 4 2 4
1 1
x 1 y 1 x y 1 1 , y . So f x x 1 1 , x . (Note that x , so that
2 4 4 2 4
2
4 2 4 2
1 2
1
Full file at https://testbank123.eu/Solutions-Manual-for-Precalculus-Mathematics-for-Calculus-7th-Edition-Stewart
Full file at https://testbank123.eu/Solutions-Manual-for-Precalculus-Mathematics-for-Calculus-7th-Edition-Stewart

SECTION 2.8 One-to-One Functions and Their Inverses 211 211 CHAPTER 2 Functions
4 4
. y 3
x 1 0, and hence x 1 y 1 x 1 y 1 . Also, since x , y x 1 1
so that
2 2 4 2 4
2 2 4 4
y 1 0, and hence y 1 is defined.)
63. f x x 6, x 0. y x 6 x 6 y for x 0. The range of f is y y 0 , so f 1 x 6 x , x 0.
1 1 2 1 1 1 164. f x x 2
, x 0. y x 2
x
y
x y
. The range of f is y y 0 , so f
x x
, x 0.
65. f x
2 x 3
5 7
2 x 3 3
5 5y 2 x x
7
2 5y x
3 2 5 y. Thus, f 1
7
x 3 2 5x .
7
66. f x x 5 6 . y x 5 6 7 y x 5 6 x 5 7 y 6 x 5 y 6. Thus, f 1 x 5
x 6.
Full file at https://testbank123.eu/Solutions-Manual-for-Precalculus-Mathematics-for-Calculus-7th-Edition-Stewart
Full file at https://testbank123.eu/Solutions-Manual-for-Precalculus-Mathematics-for-Calculus-7th-Edition-Stewart

210 CHAPTER 2 Functions SECTION 2.8 One-to-One Functions and Their Inverses 210
y
2
f
f Ð!
2 x
67. f x 5 8x . Note that the range of f (and thus the domain of f 1 ) is [0 . y 5 8x y2 5 8x
8x y2 5 x y2 5
8
. Thus, f x x 2 5
8
, x 0.
68. f x 2 3 x . The range of f is [2 . y 2 3 x y 2 3 x y 2 2 3 x
x y 2 2 3. Thus, f x x 2 2 3, x 2.
69. f x 2 3 x . y 2 3 x y 2 3 x x y 2 3 . Thus, f x x 2 3.
70. f x 4 x 2, 0 x 2. The range of f is [0 2]. y 4 x 2 y2 4 x 2 x 2 4 y2 x 4 y2.
Thus, f x 4 x 2, 0 x 2.
71. (a), (b) f x 3x 6
y
f
72. (a), (b) f x 16 x 2, x 0
f Ð!
1
1 x
(c) f x 3x 6. y 3x 6 3x y 6
x 1 y 6 . So f 1 x 1 x 6 .
(c) f x 16 x 2, x 0. y 16 x 2
x 2
3 3 16 y x 16 y. So
f 1 x 16 x , x 16. (Note: x 0
f x 16 x 2 16.)
73. (a), (b) f x x 1
y
74. (a), (b) f x x 3 1
y
f
1
1 x f
1
1 x
(c) f x x 1, x 1. y x 1, y 0
y2 x 1 x y2 1 and y 0. So
f 1 x x 2 1, x 0.
(c) f x x 3 1 y x 3 1 x 3 y 1
x 3 y 1. So f x 3 x 1.
Full file at https://testbank123.eu/Solutions-Manual-for-Precalculus-Mathematics-for-Calculus-7th-Edition-Stewart
Full file at https://testbank123.eu/Solutions-Manual-for-Precalculus-Mathematics-for-Calculus-7th-Edition-Stewart

211 CHAPTER 2 Functions SECTION 2.8 One-to-One Functions and Their Inverses 211
75. f x x 3 x . Using a graphing device and the
Horizontal Line Test, we see that f is not a one-to-one
function. For example, f 0 0 f 1 .
76. f x x 3 x . Using a graphing device and the
Horizontal Line Test, we see that f is a one-to-one
function.
-2 2 -2 2
x 12
377. f x x . Using a graphing device and the
6 78. f x x 4x 1. Using a graphing device and the
Horizontal Line Test, we see that f is a one-to-one
function.
Horizontal Line Test, we see that f is not a one-to-one
function. For example, f 0 1 f 2 .
10
2
-20 20
-10
-2 0 2
79. f x x x 6 . Using a graphing device and the
Horizontal Line Test, we see that f is not a one-to-one
function. For example f 0 6 f 2 .
10
80. f x x x . Using a graphing device and the
Horizontal Line Test, we see that f is a one-to-one
function.
20
-10 10 -5 5
-10 -20
81. (a) y f x 2 x x y 2. So 82. (a) y f x 2 1 x 1 x 2 y x 4 2y.
(b)
f 1 x x 2.
5
(b)
So f 1 x
2 2
4 2x .
10
-5 5 -10 10
-5
-10
Full file at https://testbank123.eu/Solutions-Manual-for-Precalculus-Mathematics-for-Calculus-7th-Edition-Stewart
Full file at https://testbank123.eu/Solutions-Manual-for-Precalculus-Mathematics-for-Calculus-7th-Edition-Stewart

212 CHAPTER 2 Functions SECTION 2.8 One-to-One Functions and Their Inverses 212
f Ð 1
83. (a) y g x x 3, y 0 x 3 y2, y 0
x y2 3, y 0. So g x x 2 3, x 0.
(b) 10
84. (a) y g x x 2 1, x 0 x 2 y 1, x 0
x y 1. So g 1 x x 1.
(b) 10
5
5
5 10
5 10
85. If we restrict the domain of f x to [0 , then y 4 x 2 x 2 4 y x 4 y (since x 0, we take the
positive square root). So f 1 x 4 x .
If we restrict the domain of f x to 0], then y 4 x 2 x 2 4 y x
negative square root). So f 1 x 4 x .
4 y (since x 0, we take the
86. If we restrict the domain of g x to [1 , then y x 1 2 x 1 y (since x 1 we take the positive square
root) x 1 y. So g 1 x 1 x .
If we restrict the domain of g x to 1], then y x 1 2 x 1 y (since x 1 we take the negative square
root) x 1 y. So g 1 x 1 x .
87. If we restrict the domain of h x to [ 2 , then y x 2 2 x 2 y (since x 2, we take the positive square
root) x 2 y. So h 1 x 2 x .
If we restrict the domain of h x to ], then y x 2 2 x 2 y (since x , we take the negative
square root) x 2 y. So h x 2 x .
88. k x x 3
x 3 if x 3 0 x 3
x 3 if x 3 0 x 3
If we restrict the domain of k x to [3 , then y x 3 x 3 y. So k x 3 x .
If we restrict the domain of k x to 3], then y x 3 y x 3 x 3 y. So k 1 x 3 x .
89. y 90. y
!
1 f
f f Ð!
1
1 x
Full file at https://testbank123.eu/Solutions-Manual-for-Precalculus-Mathematics-for-Calculus-7th-Edition-Stewart
Full file at https://testbank123.eu/Solutions-Manual-for-Precalculus-Mathematics-for-Calculus-7th-Edition-Stewart

213 CHAPTER 2 Functions SECTION 2.8 One-to-One Functions and Their Inverses 213
y
1
1 x
y
1
1 x
1
91. (a) 92. (a)
0
(b) Yes, the graph is unchanged upon reflection about
the line y x .
0
(b) Yes, the graph is unchanged upon reflection about
the line y x .
1 1 1 1 x 3
(c) y x
x y
, so f
x x
. (c) y
x y x 1 x 3
y 3x y 1 y 3 x
y
x 3
. Thus, 1
f 1 x . x 1
93. (a) The price of a pizza with no toppings (corresponding to the y-intercept) is $16, and the cost of each additional topping
(the rate of change of cost with respect to number of toppings) is $1 50. Thus, f n 16 1 5n.
(b) p f n 16 1 5n p 16 1 5n n 2 p 16 . Thus, n f 1 p 2 p 16 . This function 3 3
represents the number of toppings on a pizza that costs x dollars.
(c) f 1 25 2 25 16 2 9 6. Thus, a $25 pizza has 6 toppings. 3 3
94. (a) f x 500 80x . p 500
1 p 500 1
(b) p f x 500 80x . p 500 80x 80x p 500 x . So x f 80
p . f 80
represents the number of hours the investigator spends on a case for x dollars.
(c) f 1 1220 1220 500
80
720 80
9. If the investigator charges $1220, he spent 9 hours investigating the case.
t 2
t 2 V t 2 t V
95. (a) V f t 100 1 40
, 0 t 40. V 100 1 40
100
1 40
1 40
100
t V 1
1
40 1
10 t 40 4
V . Since t 40, we must have t f V 40 4 V . f represents time that
has elapsed since the tank started to leak.
(b) f 1 15 40 4 15 24 5 minutes. In 24 5 minutes the tank has drained to just 15 gallons of water.
96. (a) g r 18,500 0 25 r 2 . 18,500 0 25 r 2
4625 18,500r 2 18,500r 2 4625
r 2
4625
18,500
4625
r 18,500
. Since r represents a distance, r 0, so g
4625
18,500
. g 1
represents the radial distance from the center of the vein at which the blood has velocity .
Full file at https://testbank123.eu/Solutions-Manual-for-Precalculus-Mathematics-for-Calculus-7th-Edition-Stewart
Full file at https://testbank123.eu/Solutions-Manual-for-Precalculus-Mathematics-for-Calculus-7th-Edition-Stewart

214 CHAPTER 2 Functions SECTION 2.8 One-to-One Functions and Their Inverses 214
4625 30
(b) g 1 30
or vein.
18,500 0 498 cm. The velocity is 30 cm s at a distance of 0 498 cm from the center of the artery
Full file at https://testbank123.eu/Solutions-Manual-for-Precalculus-Mathematics-for-Calculus-7th-Edition-Stewart
Full file at https://testbank123.eu/Solutions-Manual-for-Precalculus-Mathematics-for-Calculus-7th-Edition-Stewart

215 CHAPTER 2 Functions SECTION 2.8 One-to-One Functions and Their Inverses 215
3
1
f 1
x
97. (a) D f p 3 p 150. D 3 p 150 3 p 150 D p 50 1 D. So f 1 D 50 1 D. f 1 D
3 3
represents the price that is associated with demand D.
(b) f 1 30 50 1 30 40. So when the demand is 30 units, the price per unit is $40.
98. (a) F g C 9 C 32. F 9 C 32 9 C F 32 C 5 F 32 . So g F 5 F 32 . g F 5 5 5 9 9
represents the Celsius temperature that corresponds to the Fahrenheit temperature of F .
(b) F 86 5 86 32 5 54 30. So 86 Fahrenheit is the same as 30 Celsius. 9 9
99. (a) f 1 U 1 02396U .
(b) U f x 0 9766x . U 0 9766x x 1 0240U . So f U 1 0240U . f 1 U represents the value of
U US dollars in Canadian dollars.
(c) f 1 12,250 1 0240 12,250 12,543 52. So $12,250 in US currency is worth $12,543 52 in Canadian currency.
0 1x , if 0 x 20,000
100. (a) f x 2000 0 2 x 20,000 if x 20,000
(b) We will find the inverse of each piece of the function f .
f1 x 0 1x . T 0 1x x 10T . So f 1 T 10T .
f2 x 2000 0 2 x 20,000 0 2x 2000. T 0 2x 2000 0 2x T 2000 x 5T 10,000. So
2 T 5T 10,000.
Since f 0 0 and f 20,000 2000 we have f 1 T
10T , if 0 T 2000 This represents the
taxpayer’s income.
5T 10,000 if T 2000
(c) f 1 10,000 5 10,000 10,000 60,000. The required income is 60,000.
101. (a) f x 0 85x .
(b) g x x 1000.
(c) H x f g x f x 1000 0 85 x 1000 0 85x 850.
(d) P H x 0 85x 850. P 0 85x 850 0 85x P 850 x 1 176 P 1000. So
H 1 P 1 176 P 1000. The function H represents the original sticker price for a given discounted price P .
(e) H 1 13,000 1 176 13,000 1000 16,288. So the original price of the car is $16,288 when the discounted
price ($1000 rebate, then 15% off) is $13,000.
102. f x mx b. Notice that f x1 f x2 mx1 b mx2 b mx1 mx2. We can conclude that x1 x2 if and
only if m 0. Therefore f is one-to-one if and only if m 0. If m 0, f x mx b y mx b mx y b
y b 1 x b
x . So, f m
2x 1
x m
.
103. (a) f x is “multiply by 2, add 1, and then divide by 5 ”. So the reverse is “multiply by 5, subtract 1, and then 5
5x 1
divide by 2 ” or f 1 x 5x 1
2
. Check: f f 1 x f
2x 1
2 5x 1
2
2 1
5
5x 1 1 5x 5
5
and f 1 f x f
5 2x 1
5
5 1
2
2x 1 1 2x 2
2
x .
Full file at https://testbank123.eu/Solutions-Manual-for-Precalculus-Mathematics-for-Calculus-7th-Edition-Stewart
Full file at https://testbank123.eu/Solutions-Manual-for-Precalculus-Mathematics-for-Calculus-7th-Edition-Stewart
CHAPTER 2 Review 215 215 CHAPTER 2 Functions
f 1 x
3
2
1 1 1
1
x
3
3
3
3 3 3
2
2
4 2 4 2
1
(b) f x 3 x
1
x is “take the negative reciprocal and add 3 ”. Since the reverse of “take the negative
reciprocal” is “take the negative reciprocal ”, f 1 x is “subtract 3 and take the negative reciprocal ”, that is,
1
x 3
. Check: f f 1 x f
1
x 3
3 1
1
x 3
3 1 x 3
1
3 x 3 x and
f 1 f x f 3
1
x .
x 3
1 1 x
3 x
(c) f x x 3 2 is “cube, add 2, and then take the square root”. So the reverse is “square, subtract 2, then take
the cube root ” or f x x 2 2. Domain for f x is
2 ; domain for f 1 x is [0 . Check:
f f 1 x f x 2 2
3
x 2 2
2
2
x 2 2 2
x 2 x (on the appropriate domain) and
f 1 f x f x 3 2
x 3 2 2 x 3 2 2 x 3 x (on the appropriate domain).
(d) f x 2x 5 3 is “double, subtract 5, and then cube”. So the reverse is “take the cube root, add 3 x 5
5, and divide by 2” or f 1 x Domain for both f x and f 1 x is . Check:
3 x 5
3 x 5
3
3
f f 1 x f 2 2
x
5 3 x 5 53
3 x 3 x 3 x and
f 1 f x f 2x 5 3
2x 5 3 5 2x
5 5 2x
x .
2 2 2
In a function like f x 3x 2, the variable occurs only once and it easy to see how to reverse the operations step by
step. But in f x x 3 2x 6, you apply two different operations to the variable x (cubing and multiplying by 2)
and then add 6, so it is not possible to reverse the operations step by step.
104. f I x f x ; therefore f I f . I f x f x ; therefore I f f .
By definition, f f x x I x ; therefore f f 1 I . Similarly, f 1 f x x I x ; therefore
f 1 f I .
105. (a) We find g 1 x : y 2x 1 2x y 1 x 1 y 1 . So g x 1 x 1 . Thus
f x h g x h 1 x 1
1
2
x 1 2
1 x 1
2
7 x 2 2x 1 2x 2 7 x 2 6.
(b) f g h f 1 f g f h I g f h g f h. Note that we compose with f 1 on the left
on each side of the equation. We find f 1: y 3x 5 3x y 5 x 1 y 5 . So f 1 x 1 x 5 . 3 3
Thus g x f h x f 1 3x 2 3x 2
1 3x 2 3x 2
5
1 3x 2 3x 3
x 2 x 1.
3 3
CHAPTER 2 REVIEW
1. “Square, then subtract 5” can be represented by the function f x x 2 5.
x 2. “Divide by 2, then add 9” can be represented by the function g x
2 9.
Full file at https://testbank123.eu/Solutions-Manual-for-Precalculus-Mathematics-for-Calculus-7th-Edition-Stewart
Full file at https://testbank123.eu/Solutions-Manual-for-Precalculus-Mathematics-for-Calculus-7th-Edition-Stewart

CHAPTER 2 Review 216 216 CHAPTER 2 Functions
3. f x 3 x 10 : “Add 10, then multiply by 3.”
4. f x 6x 10: “Multiply by 6, then subtract 10, then take the square root.”
Full file at https://testbank123.eu/Solutions-Manual-for-Precalculus-Mathematics-for-Calculus-7th-Edition-Stewart
Full file at https://testbank123.eu/Solutions-Manual-for-Precalculus-Mathematics-for-Calculus-7th-Edition-Stewart

CHAPTER 2 Review 217 217 CHAPTER 2 Functions
x h x
2
1
0
1
2
3
4
5
0
11
5. g x x 2 4x 6. h x 3x 2 2x 5
x g x
1
0
1
2
3
5
0
3
4
3
7. C x 5000 30x 0 001x 2
(a) C 1000 5000 30 1000 0 001 1000 2 $34,000 and
C 10,000 5000 30 10,000 0 001 10,000 2 $205,000.
(b) From part (a), we see that the total cost of printing 1000 copies of the book is $34,000 and the total cost of printing
10,000 copies is $205,000.
(c) C 0 5000 30 0 0 001 0 2 $5000. This represents the fixed costs associated with getting the print run ready.
(d) The net change in C as x changes from 1000 to 10,000 is C 10,000 C 1000 205,000 34,000 $171,000, and
the average rate of change is
8. E x 400 0 03x
C 10,000 C 1000
10,000 1000
171,000 9000
$19 copy.
(a) E 2000 400 0 03 2000 $460 and E 15 000 400 0 03 15,000 $850.
(b) From part (a), we see that if Reynalda sells $2000 worth of goods, she makes $460, and if she sells $15,000 worth of
goods, she makes $850.
(c) E 0 400 0 03 0 $400 is Reynalda’s base weekly salary.
(d) The net change in E as x changes from 2000 to 15,000 is E 15,000 E 2000 850 460 $390, and the average
rate of change is E 15,000 E 2000
15,000 2000
390 13,000
$0 03 per dollar.
(e) Because the value of goods sold x is multiplied by 0 03 or 3%, we see that Reynalda earns a percentage of 3% on the
goods that she sells.
9. f x x 2 4x 6; f 0 0 2 4 0 6 6; f 2 2 2 4 2 6 2;
f 2 2 2 4 2 6 18; f a a 2 4 a 6 a2 4a 6; f a a 2 4 a 6 a2 4a 6;
f x 1 x 1 2 4 x 1 6 x 2 2x 1 4x 4 6 x 2 2x 3; f 2x 2x 2 4 2x 6 4x 2 8x 6.
10. f x 4 3x 6; f 5 4 15 6 1; f 9 4 27 6 4 21;
f a 2 4 3a 6 6 4 3a; f x 4 3 x 6 4
3x 6; f x 2
4 3x 2 6.
11. By the Vertical Line Test, figures (b) and (c) are graphs of functions. By the Horizontal Line Test, figure (c) is the graph of a
one-to-one function.
12. (a) f 2 1 and f 2 2.
(b) The net change in f from 2 to 2 is f 2 f 2 2 1 3, and the average rate of change is
f 2 f 2 3 .
2 2 4
(c) The domain of f is [ 4 5] and the range of f is [ 4 4].
(d) f is increasing on 4 2 and 1 4 ; f is decreasing on 2 1 and 4 5 .
(e) f has local maximum values of 1 (at x ) and 4 (at x 4).
(f) f is not a one-to-one, for example, f 2 1 f 0 . There are many more examples.
13. Domain: We must have x 3 0 x . In interval notation, the domain is [ 3 .
Range: For x in the domain of f , we have x 3 x 3 0 x 3 0 f x 0. So the range is [0 .
Full file at https://testbank123.eu/Solutions-Manual-for-Precalculus-Mathematics-for-Calculus-7th-Edition-Stewart
Full file at https://testbank123.eu/Solutions-Manual-for-Precalculus-Mathematics-for-Calculus-7th-Edition-Stewart
CHAPTER 2 Review 218 218 CHAPTER 2 Functions
1
x 1
2x 2
1 2
3
14. F t t 2 2t 5 t 2 2t 1
5 1 t 1 2 4. Therefore F t 4 for all t . Since there are no restrictions
on t , the domain of F is , and the range is [4 .
15. f x 7x 15. The domain is all real numbers, .
2x 1 1
1
16. f x 2x
. Then 2x 1 0 x 2
. So the domain of f is
x x 2
.
17. f x x 4. We require x 4 0 x 4. Thus the domain is [ 4 .
2 18. f x 3x
. The domain of f is the set of x where x 1 0 x . So the domain is 1 .
1 19. f x
x x
1
1
1
x 2
. The denominators cannot equal 0, therefore the domain is x x 0 1 2 .
2x 2 5x 3 20. g x
5x 3
2x 2 5x 3
2x 1 x 3
. The domain of g is the set of all x where the denominator is not 0. So the
domain is x 2x 1 0 and x 3 0 x x and x 3 .
21. h x 4 x x 2 1. We require the expression inside the radicals be nonnegative. So 4 x 0 4 x ; also
x 2 1 0 x 1 x 1 0. We make a table:
Interval 1 1 1 1
Sign of x 1
Sign of x 1
Sign of x 1 x 1
Thus the domain is 4] 1] 1 1] 1 4].
3 2x 122. f x 3
2x . Since we have an odd root, the domain is the set of all x where the denominator is not 0. Now
2
3 2x 2 0 3 2x 2 2x 8 x 4. Thus the domain of f is x x 4 .
23. f x 1 2x
y
24. f x 1 x 5 , 2 x 8
y
1
1 x 1 x
Full file at https://testbank123.eu/Solutions-Manual-for-Precalculus-Mathematics-for-Calculus-7th-Edition-Stewart
Full file at https://testbank123.eu/Solutions-Manual-for-Precalculus-Mathematics-for-Calculus-7th-Edition-Stewart

CHAPTER 2 Review 219 219 CHAPTER 2 Functions
y
5
1 x
y
1
1
x
y
1
1 x
y 5
0
1 x
y
1
1 x
y
1
0 2 x
y
2
1 x
y
1
2 x
4
2
25. f x 3x 2 26. f x 1 x 2
0
0
27. f x 2x 2 1 28. f x x 1 4
0
29. f x 1 x 30. f x 1 x 2
0
31. f x 1 x 3 32. f x 3 x
0 0
Full file at https://testbank123.eu/Solutions-Manual-for-Precalculus-Mathematics-for-Calculus-7th-Edition-Stewart
Full file at https://testbank123.eu/Solutions-Manual-for-Precalculus-Mathematics-for-Calculus-7th-Edition-Stewart

CHAPTER 2 Review 220 220 CHAPTER 2 Functions
y
1
1 x
y
1
1 x
y
1
1 x
y
5
1 x
1 3
33. f x x 34. f x x 1
0
0
1 35. f x
x 2
36. f x x
1
1 3
0
0
1 x if x 0
x if x 0
37. f x
1 if x 0 38. f x
x 2 if 0 x 2
1 if x 2
y y
1
1
1 x
39. x y2 14 y2 14 x y 14 x , so the original equation does not define y as a function of x .
40. 3x y 8 y 3x 8 y 3x 8 2, so the original equation defines y as a function of x .
41. x 3 y3 27 y3 x 3 27 y x 3 27
root function is one-to-one).
, so the original equation defines y as a function of x (since the cube
42. 2x y4 16 y4 2x 16 y 4 2x 16, so the original equation does not define y as a function of x .
Full file at https://testbank123.eu/Solutions-Manual-for-Precalculus-Mathematics-for-Calculus-7th-Edition-Stewart
Full file at https://testbank123.eu/Solutions-Manual-for-Precalculus-Mathematics-for-Calculus-7th-Edition-Stewart

220 CHAPTER 2 Functions CHAPTER 2 Review 220
43. f x 6x 3 15x 2 4x 1
(i) [ 2 2] by [ 2 2]
(ii) [ 8 8] by [ 8 8]
2
5
-2 2
-2
-5 5
-5
(iii) [ 4 4] by [ 12 12] (iv) [ 100 100] by [ 100 100]
10 100
-4 -2 2 4 -100 100
-10 -100
From the graphs, we see that the viewing rectangle in (iii) produces the most appropriate graph.
44. f x 100 x 3
(i) [ 4 4] by [ 4 4]
(ii) [ 10 10] by [ 10 10]
10
-4 -2 2 4 -10 10
-10
(iii) [ 10 10] by [ 10 40] (iv) [ 100 100] by [ 100 100]
40 100
20
-100
100
-10 10 -100
From the graphs, we see that the viewing rectangle in (iii) produces the most appropriate graph of f .
Full file at https://testbank123.eu/Solutions-Manual-for-Precalculus-Mathematics-for-Calculus-7th-Edition-Stewart
Full file at https://testbank123.eu/Solutions-Manual-for-Precalculus-Mathematics-for-Calculus-7th-Edition-Stewart

221 CHAPTER 2 Functions CHAPTER 2 Review 221
4
45. (a) We graph f x 9 x 2 in the viewing rectangle
46. (a) We graph f x x 2 3 in the viewing
[ 4 4] by [ 1 4]. rectangle [ 5 5] by [ 6 1].
4
-5 5
2
-4 -2 2 4 -5
(b) From the graph, the domain of f is [ 3 3] and the
range of f is [0 3].
47. (a) We graph f x x 3 4x 1 in the viewing
rectangle [ 5 5] by [ 1 5].
(b) From the graph, the domain of f is
1 73] 1 73 and the range of f is
0].
48. (a) We graph f x x 4 x 3 x 2 3x 6 in the
viewing rectangle [ 3 4] by [ 20 100].
100 4
2 50
-5 5 -2 2 4
(b) From the graph, the domain of f is approximately
[ 2 11 0 25] [1 86 and the range of f is
[0 .
49. f x x 3 4x 2 is graphed in the viewing rectangle
(b) From the graph, the domain of f is and
the range of f is approximately [ 7 10 .
50. f x x 16 is graphed in the viewing rectangle
[ 5 5] by [ 20 10]. f x is increasing on 0 and
2 67 . It is decreasing on 0 2 67 .
[ 5 5] by [ 5 20]. f x is increasing on 2 0 and
2 . It is decreasing on 2 and 0 2 .
20
-5 5
10
-20 -5 5
f 8 f 4 4
51. The net change is f 8 f 4 8 12 4 and the average rate of change is 8 4
4
1.
g 30 g 10 35 752. The net change is g 30 g 10 30 5 35 and the average rate of change is
30 10 20
4
.
f 2 f 1 453. The net change is f 2 f 1 6 2 4 and the average rate of change is
2 1 .
3
f 3 f 1 654. The net change is f 3 f 1 1 5 6 and the average rate of change is
3 1
2 3.
Full file at https://testbank123.eu/Solutions-Manual-for-Precalculus-Mathematics-for-Calculus-7th-Edition-Stewart
Full file at https://testbank123.eu/Solutions-Manual-for-Precalculus-Mathematics-for-Calculus-7th-Edition-Stewart

222 CHAPTER 2 Functions CHAPTER 2 Review 222
y
1
1 x
y
1
1 x
4
2
55. The net change is f 4 f 1 42 2 4 12 2 1
8 1 9 and the average rate of change is
f 4 f 1 9 3.
4 1 3
56. The net change is g a h g a a h 1 2 a 1 2 2ah 2h h2 and the average rate of change is
g a h g a
a h a
2ah 2h h2
h
2a 2 h.
57. f x 2 3x 2 9x 2 12x 4 is not linear. It cannot be expressed in the form f x ax b with constant a and b.
x 3 1 3 1 358. g x
59. (a)
5 5
x 5
is linear with a 5
and b 5
.
60. (a)
0
0
(b) The slope of the graph is the value of a in the
equation f x ax b 3x 2; that is, 3.
(c) The rate of change is the slope of the graph, 3.
(b) The slope of the graph is the value of a in the
1 1 equation f x ax b
2 x 3; that is,
2 .
(c) The rate of change is the slope of the graph, 1
2 .
61. The linear function with rate of change 2 and initial value 3 has a 2 and b 3, so f x 2x 3.
62. The linear function whose graph has slope 1 and y-intercept 1 has a 1 and b , so f x 1 x 1.2
f 1 f 0
2 2
5 3
63. Between x 0 and x 1, the rate of change is
f x 2x 3.
1 0
1 2. At x 0, f x 3. Thus, an equation is
f 2 f 0
5 5 6 164. Between x 0 and x 2, the rate of change is
is f x 1 x 6.
2 0
2
0 4
4
. At x 0, f x 6. Thus, an equation
1
65. The points 0 4 and 8 0 lie on the graph, so the rate of change is 8
y 1 x 4.
0
2 . At x 0, y 4. Thus, an equation is
0 466. The points 0 4 and 2 0 lie on the graph, so the rate of change is
is y 2x 4.
67. P t 3000 200t 0 1t 2
2 0 2. At x 0, y . Thus, an equation
(a) P 10 3000 200 10 0 1 10 2 5010 represents the population in its 10th year (that is, in 1995), and
P 20 3000 200 20 0 1 20 2 7040 represents its population in its 20th year (in 2005).
(b) The average rate of change is P 20 P 10 20 10 7040 5010
Full file at https://testbank123.eu/Solutions-Manual-for-Precalculus-Mathematics-for-Calculus-7th-Edition-Stewart
Full file at https://testbank123.eu/Solutions-Manual-for-Precalculus-Mathematics-for-Calculus-7th-Edition-Stewart

223 CHAPTER 2 Functions CHAPTER 2 Review 223
10 2030
10
203
people year.
This represents
the
average yearly change in population between 1995 and 2005.
Full file at https://testbank123.eu/Solutions-Manual-for-Precalculus-Mathematics-for-Calculus-7th-Edition-Stewart
Full file at https://testbank123.eu/Solutions-Manual-for-Precalculus-Mathematics-for-Calculus-7th-Edition-Stewart

224 CHAPTER 2 Functions CHAPTER 2 Review 224
2
2
2
68. D t 3500 15t 2
(a) D 0 3500 15 0 2 $3500 represents the amount deposited in 1995 and D 15 3500 15 15 2 $6875
represents the amount deposited in 2010.
(b) Solving the equation D t 17,000, we get 17,000 3500 15t 2 15t 2 13,500 t 2
t 30, so thirty years after 1995 (that is, in the year 2025) she will deposit $17,000.
13500
15
900
(c) The average rate of change is D 15 D 0
15 0
6875 3500
15
$225 year. This represents the average annual
increase in contributions between 1995 and 2010.
69. f x 1 x 6
(a) The average rate of change of f between x 0 and x 2 is 1
1
f 2 f 0 2 2 6 2
0 6 5 6 1 , and the average rate of change of f between x 15
2 0
and x 50 is 2
2
2
1
1
f 50 f 15 2 50 6 2
15 6 19 3 1
.
50 15
(b) The rates of change are the same.
35 35
2
(c) Yes, f is a linear function with rate of change 1 .
70. f x 8 3x f 2 f 0
[8 3 2 ] [8 3 0 ]
2 8
(a) The average rate of change of f between x 0 and x 2 is 2 0
2
2
3,
and the average rate of change of f between x 15 and x 50 is
f 50 f 15 [8 3 50 ] [8 3 15 ] 142 37 3.
50 15 35 35
(b) The rates of change are the same.
(c) Yes, f is a linear function with rate of change 3.
71. (a) y f x 8. Shift the graph of f x upward 8 units.
(b) y f x 8 . Shift the graph of f x to the left 8 units.
(c) y 1 2 f x . Stretch the graph of f x vertically by a factor of 2, then shift it upward 1 unit.
(d) y f x 2 2. Shift the graph of f x to the right 2 units, then downward 2 units.
(e) y f x . Reflect the graph of f x about the y-axis.
(f) y f x . Reflect the graph of f x first about the y-axis, then reflect about the x -axis.
(g) y f x . Reflect the graph of f x about the x -axis.
(h) y f 1 x . Reflect the graph of f x about the line y x .
72. (a) y f x 2
y
(b) y f x
y
(c) y 3 f x
y
1 1 1
1 x 1 x 1 x
Full file at https://testbank123.eu/Solutions-Manual-for-Precalculus-Mathematics-for-Calculus-7th-Edition-Stewart
Full file at https://testbank123.eu/Solutions-Manual-for-Precalculus-Mathematics-for-Calculus-7th-Edition-Stewart

225 CHAPTER 2 Functions CHAPTER 2 Review 225
2
2
5 5
2
1
2
(d) y 1 f x 1 (e) y f x (f) y f x
y y y
1 1 1
1 x 1 x 1 x
73. (a) f x 2x 5 3x 2 2. f x 2 x 5 3 x 2 2 2x 5 3x 2 2. Since f x f x , f is not even.
f x 2x 5 3x 2 2. Since f x f x , f is not odd.
(b) f x x 3 x 7. f x x 3 x 7 x 3 x 7
f x , hence f is odd.
1 x 2
1 x 2
1 x 2
(c) f x
1 x 2
. f x 1 x 2
1
1 x 2
1
f x . Since f x f x , f is even.
1
(d) f x x
. f x
x 2 2 x
. f x x 2
. Since f x f x , f is not even, and since
f x f x , f is not odd.
74. (a) This function is odd.
(b) This function is neither even nor odd.
(c) This function is even.
(d) This function is neither even nor odd.
75. g x 2x 2 4x 5 2 x 2 2x
5 2 x 2 2x 1
5 2 2 x 1 2 7. So the local minimum value 7
when x 1.
76. f x 1 x x 2 x 2 x
1 x 2 x 1 1 1 x 1
. So the local maximum value is
when x 1 .
4 4 2 4 4
77. f x 3 3 1 6x 2 5x 3 . In the first viewing rectangle, [ 2 2] by [ 4 8], we see that f x has a local maximum
and a local minimum. In the next viewing rectangle, [0 4 0 5] by [3 78 3 80], we isolate the local maximum value as
approximately 3 79 when x 0 46. In the last viewing rectangle, [ 0 5 0 4] by [2 80 2 82], we isolate the local
minimum value as 2 81 when x 0 46.
3.80
5
3.79
2.82
2.81
-2 2 3.78 0.40 0.45 0.50
2.80 -0.50 -0.45 -0.40
Full file at https://testbank123.eu/Solutions-Manual-for-Precalculus-Mathematics-for-Calculus-7th-Edition-Stewart
Full file at https://testbank123.eu/Solutions-Manual-for-Precalculus-Mathematics-for-Calculus-7th-Edition-Stewart

226 CHAPTER 2 Functions CHAPTER 2 Review 226
4 2
3
78. f x x 2 3 6 x 1 3. In the first viewing rectangle, [ 10 10] by [ 10 10], we see that f x has a local maximum and
a local minimum. The local minimum is 0 at x 0 (and is easily verified). In the next viewing rectangle, [3 95 4 05] by
[3 16 3 18], we isolate the local maximum value as approximately 3 175 when x 4 00.
10 3.18
-10
10
-10
3.17
3.16
3.95 4.00 4.05
79. h t 16t 2 48t 32 6 t 2 3t
32 6 t 2 3t 9
32 36
16 t 2 3t 9
68 6 t 3
68
4 2
The stone reaches a maximum height of 68 feet.
80. P x 500 12x 0 0004x 2 0 0004 x 2 30,000x
1500 0 0004 x 2 30,000x 225,000,000
1500 90,000 0 0004 x 15,000 2 88,500
The maximum profit occurs when 15,000 units are sold, and the maximum profit is $88,500.
81. f x x 2, g x x 2 82. f x x 2 1, g x 3 x 2
5 5
-4 -2 2
83. f x x 2 3x 2 and g x 4 3x .
(a) f g x x 2 3x 2
4 3x x 2 6x 6
(b) f g x x 2 3x 2
4 3x x 2 2
-2 2
(c) f g x x 2 3x 2
4 3x 4x 2 12x 8 3x 3 9x 2 6x 3x 3 13x 2 18x 8
(d)
f
g x
x 2 3x 2
4 3x
, x 4
(e) f g x f 4 3x 4 3x 2 3 4 3x 2 16 24x 9x 2 12 9x 2 9x 2 15x 6
(f) g f x g x 2 3x 2
4 3 x 2 3x 2
3x 2 9x 2
84. f x 1 x 2 and g x x 1. (Remember that the proper domains must apply.) 2
(a) f g x f x 1
1 x 1 1 x 1 x
(b) g f x g 1 x 2
1 x 2
1 x 2 x
(c) f g 2 f g 2 f 2 1
f 1 1 1 2 2.
(d) f f 2 f f 2 f 1 2 2
f 5 1 5 2 26.
(e) f g f x f g f x f x 1 x 2 1 x 2. Note that g f x x by part (b).
(f) g f g x g f g x g x x 1. Note that f g x x by part (a).
Full file at https://testbank123.eu/Solutions-Manual-for-Precalculus-Mathematics-for-Calculus-7th-Edition-Stewart
Full file at https://testbank123.eu/Solutions-Manual-for-Precalculus-Mathematics-for-Calculus-7th-Edition-Stewart

227 CHAPTER 2 Functions CHAPTER 2 Review 227
4
2
2
1
1 x
4
x 4
85. f x 3x 1 and g x 2x x 2 .
f g x f 2x x 2
3 2x x 2
1 3x 2 6x 1, and the domain is .
g f x g 3x 1 2 3x 1 3x 1 2 6x 2 9x 2 6x 1 9x 2 12x 3 , and the domain is
f f x f 3x 1 3 3x 1 1 9x 4, and the domain is .
2g g x g 2x x 2
2 2x x 2
2x x 2
domain is .
4x 2x 2 4x 2 4x 3 x 4 x 4 4x 3 6x 2 4x , and
86. f x x , has domain x x 0 . g x x
2 , has domain x x 4 .
f g x f
2
x 4
2
2
x 4
. f g x is defined whenever both g x and f g x are defined; that is,
2
whenever x 4 and x
0. Now
2
x 4 0 x 4 0 x 4. So the domain of f g is 4 .
g f x g x
x
. g f x is defined whenever both f x and g f x are defined; that is, whenever 4
x 0 and x 4 0. Now x 4 0 x 16. So the domain of g f is [0 16 16 .
f f x f x
x x 1 4 . f f x is defined whenever both f x and f f x are defined; that is,
whenever x 0. So the domain of f f is [0 . 2
g g x g
2 2 x 4
2 4
2 4 x 4
x 4
9 2x
g g x is defined whenever both g x and
x 4
g g x are defined; that is, whenever x 4 and 9 2x 0. Now 9 2x 0 2x 9 x 9 . So the domain of
g g is x x 9 4 .
87. f x 1 x , g x 1 x 2 and h x 1 x .
f g h x f g h x f g 1 x
f 1 1 x 2
f 1 1 2 x x
f x 2 x
x 2 x
1 2 x x 1 x 2
1 x
88. If h x x and g x 1 x , then g h x g x
1 x . If f x 1
x , then
1
f g h x f 1 x
T x .
89. f x 3 x 3 . If x1 x2, then x 3 x 3 (unequal numbers have unequal cubes), and therefore 3 x 3 3 x 3. Thus f 1 2 1 2
is a one-to-one function.
90. g x 2 2x x 2 x 2 2x 1
1 x 1 2 1. Since g 0 2 g 2 , as is true for all pairs of numbers
equidistant from 1, g is not a one-to-one function.
91. h x
1
x 4 . Since the fourth powers of a number and its negative are equal, h is not one-to-one. For example,
h 1 1
1 4 1 and h 1 1
1, so h 1 h 1 .
1 4
92. r x 2 x 3. If x1 x2 , then x1 3 x2 3, so x1 3 x2 3 and 2 x1 3 2 x2 3. Thus r
is one-to-one.
Full file at https://testbank123.eu/Solutions-Manual-for-Precalculus-Mathematics-for-Calculus-7th-Edition-Stewart
Full file at https://testbank123.eu/Solutions-Manual-for-Precalculus-Mathematics-for-Calculus-7th-Edition-Stewart

CHAPTER 2 Test 227 227 CHAPTER 2 Functions
93. p x 3 3 1 6x 2 5x 3 . Using a graphing device and
the Horizontal Line Test, we see that p is not a one-to-one
function.
94. q x 3 3 1 6x 2 5x 3. Using a graphing device and
the Horizontal Line Test, we see that q is a one-to-one
function.
10 10
-5 5 -5 5
-10 -10
95. f x 3x 2 y 3x 2 3x y 2 x 1 y 2 . So f x 1 x 2 .
2x 1 2x 1
3 3
1 1 1
96. f x 3
y 3
2x 1 3y 2x 3y 1 x 2
3y 1 So f
x 2
3x 1 .
97. f x x 1 3 y x 1 3 x 1 3 y x 3 y 1. So f 1 x 3 x 1.
98. f x 1 5 x 2. y 1 5 x 2 y 1 5 x 2 x 2 y 1 5 x 2 y 1 5 . So
f 1 x 2 x 1 5.
99. The graph passes the Horizontal Line Test, so f has an inverse. Because f 1 0, f 1 0 1, and because f 3 4,
f 1 4 3.
100. The graph fails the Horizontal Line Test, so f does not have an inverse.
101. (a), (b) f x x 2 4, x 0
y
f
102. (a) If x1 x2 , then 4 x1 4 x2, and so
1 4 x1 1 4 x2 . Therefore, f is a
one-to-one function.
f Ð! (b), (c) y
1
1 x f Ð!
f
1
x 2 y 4 x y 4. So
f 1 x x 4, x 4.
(d) f x 1 4
1
x . y 1 4
x 4
x
x y 1
x y 1 4 . So f x x 1 4,
x 1. Note that the domain of f is [0 , so
y 1 4 x 1. Hence, the domain of f is
[1 .
CHAPTER 2 TEST
1. By the Vertical Line Test, figures (a) and (b) are graphs of functions. By the Horizontal Line Test, only figure (a) is the
graph of a one-to-one function.
Full file at https://testbank123.eu/Solutions-Manual-for-Precalculus-Mathematics-for-Calculus-7th-Edition-Stewart
Full file at https://testbank123.eu/Solutions-Manual-for-Precalculus-Mathematics-for-Calculus-7th-Edition-Stewart

CHAPTER 2 Test 228 228 CHAPTER 2 Functions
y
2
1
x
x f x
1
0
1
2
3
4
27
8
1
0
1
8
3000
2000
1000
0 1 2 3 4 5 x
1
0 2 2
a 2
a 2
2. (a) f 0 0
0; f 2
x 2 1 3
; f a 2 a 2 1
. a 3
(b) f x x
. Our restrictions are that the input to the radical is nonnegative and that the denominator must not be 0. 1
Thus, x 0 and x 1 0 x 1. (The second restriction is made irrelevant by the first.) In interval notation, the
domain is [0 .
10 2
(c) The average rate of change is f 10 f 2
10 2 10 1
2 1 3
10 2
10 11 2 .
264
3. (a) “Subtract 2, then cube the result” can be expressed
algebraically as f x x 2 3.
(c)
(b)
(d) We know that f has an inverse because it passes the Horizontal Line Test. A verbal description for f is, “Take the
cube root, then add 2.”
(e) y x 2 3 3 y x 2 x 3 y 2. Thus, a formula for f is f 1 x 3 x 2.
4. (a) f has a local minimum value of 4 at x 1 and local maximum values of 1 at x 4 and 4 at x 3.
(b) f is increasing on 4 and 1 3 and decreasing on 4 1 and 3 .
5. R x 500x 2 3000x
(a) R 2 500 2 2 3000 2 $4000 represents their total
sales revenue when their price is $2 per bar and
R 4 500 4 2 3000 4 $4000 represents their total
sales revenue when their price is $4 per bar
(c) The maximum revenue is $4500, and it is achieved at a price
(b)
R
5000
4000
6. The net change is f 2 h f 2 2 h 2 2 2 h 22 2 2 4 h2 4h 4 2h 0 2h h2
and the average rate of change is
f 2 h f 2
2 h 2
2h h2 h
2 h.
Full file at https://testbank123.eu/Solutions-Manual-for-Precalculus-Mathematics-for-Calculus-7th-Edition-Stewart
Full file at https://testbank123.eu/Solutions-Manual-for-Precalculus-Mathematics-for-Calculus-7th-Edition-Stewart

CHAPTER 2 Test 229 229 CHAPTER 2 Functions
y
y=g(x)
10
y=f(x)
1
x
y
1
1
7. (a) f x x 5 2 x 2 10x 25 is not linear because it cannot be
expressed in the form f x ax b for constants a and b.
g x 1 5x is linear.
(c) g x has rate of change 5.
(b)
0
8. (a) f x x 3
y
(b) g x x 1 3 2. To obtain the graph of g,
shift the graph of f to the right 1 unit and
downward 2 units.
y
1
1 x
1
1 x
9. (a) y f x 3 2. Shift the graph of f x to the right 3 units, then shift the graph upward 2 units.
(b) y f x . Reflect the graph of f x about the y-axis.
10. (a) f 2 1 2 1 2 3 (since 2 1 ).
f 1 1 1 0 (since 1 1 ).
(b)
x
11. f x x 2 x 1; g x x 3.
(a) f g x f x g x x 2 x 1
x 3 x 2 2x 2
(b) f g x f x g x x 2 x 1
x 3 x 2 4
(c) f g x f g x f x 3 x 3 2 x 3 1 x 2 6x 9 x 3 1 x 2 5x 7
(d) g f x g f x g x 2 x 1
x 2 x 1
3 x 2 x 2
(e) f g 2 f 1 1 2 1 1 1. [We have used the fact that g 2 2 3 1.]
(f) g f 2 g 7 7 3 4. [We have used the fact that f 2 22 2 1 7.]
(g) g g g x g g g x g g x 3 g x 6 x 6 3 x 9. [We have used the fact that
g x 3 x 3 3 x 6.]
Full file at https://testbank123.eu/Solutions-Manual-for-Precalculus-Mathematics-for-Calculus-7th-Edition-Stewart
Full file at https://testbank123.eu/Solutions-Manual-for-Precalculus-Mathematics-for-Calculus-7th-Edition-Stewart

230 CHAPTER 2 Functions Modeling with Functions 230
y
f
1
1
f Ð!
12. (a) f x x 3 1 is one-to-one because each real number has a unique cube.
(b) g x x 1 is not one-to-one because, for example, g 2 g 0 1.
1 13. f g x
1
1 1
x for all x 0, and g f x
1
1 2 x 2 2 x for all x 2. Thus, by
x 2 2
x x 2
the Inverse Function Property, f and g are inverse functions.
x 3
x 3
5y 3
14. f x . y 2x 5
2x 5 2x 5 y x 3 x 2y 1 5x 3 x
2y 1 . Thus,
f 1 x 5x 3
. 2x 1
15. (a) f x 3 x , x 3 y 3 x
y2 3 x x 3 y2 . Thus
f 1 x 3 x 2, x 0.
(b) f x 3 x , x 3 and f 1 x 3 x 2,
x 0
x
16. The domain of f is [0 6], and the range of f is [1 7].
17. The graph passes through the points 0 1 and 4 3 , so f 0 1 and f 4 3.
18. The graph of f x 2 can be obtained by shifting the graph of f x to the right
2 units. The graph of f x 2 can be obtained by shifting the graph of f x
upward 2 units.
y
y=f(x)+2
y=f(x-2)
f
1
1 x
19. The net change of f between x 2 and x 6 is f 6 f 2 7 2 5 and the average rate of change is
f 6 f 2 5 .
6 2 4
20. Because f 0 1, f 1 0. Because f 4 3, f 1 3 4.
21. y
f
f Ð!
1
1 x
Full file at https://testbank123.eu/Solutions-Manual-for-Precalculus-Mathematics-for-Calculus-7th-Edition-Stewart
Full file at https://testbank123.eu/Solutions-Manual-for-Precalculus-Mathematics-for-Calculus-7th-Edition-Stewart
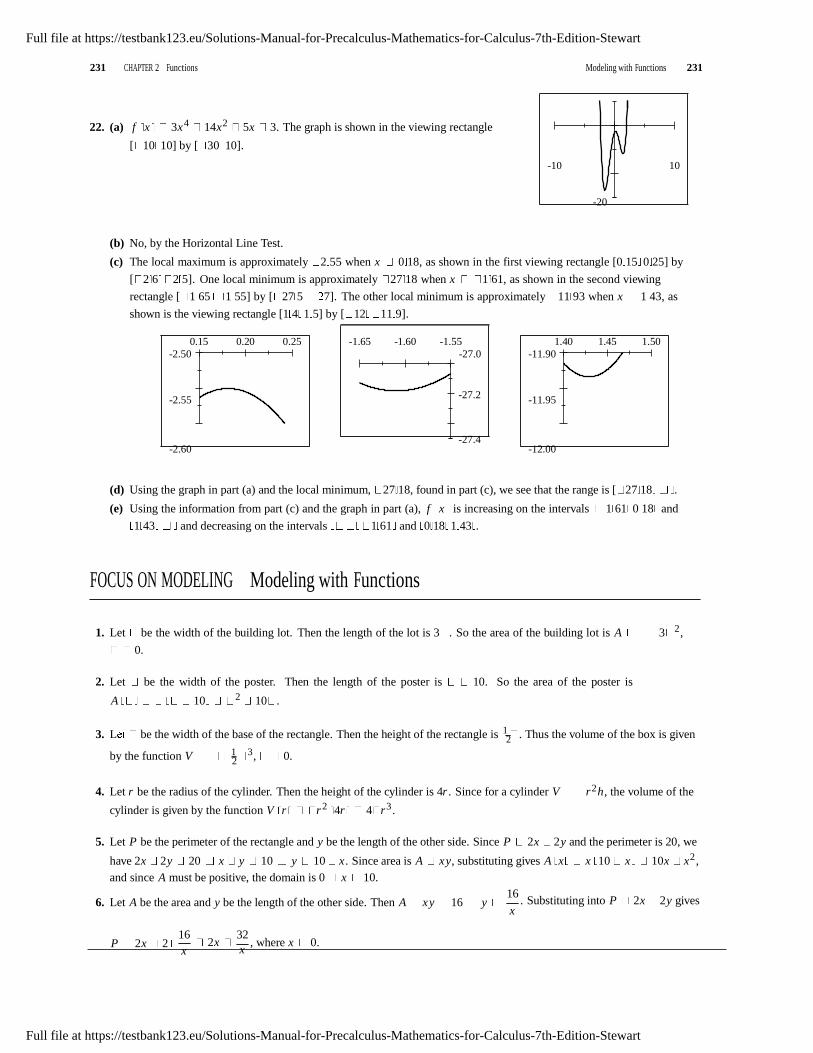
231 CHAPTER 2 Functions Modeling with Functions 231
2
2
x
22. (a) f x 3x 4 14x 2 5x 3. The graph is shown in the viewing rectangle
[ 10 10] by [ 30 10].
-10 10
-20
(b) No, by the Horizontal Line Test.
(c) The local maximum is approximately 2 55 when x 0 18, as shown in the first viewing rectangle [0 15 0 25] by
[ 2 6 2 5]. One local minimum is approximately 27 18 when x 1 61, as shown in the second viewing
rectangle [ 1 65 1 55] by [ 27 5 7]. The other local minimum is approximately 11 93 when x 1 43, as
shown is the viewing rectangle [1 4 1 5] by [ 12 11 9].
0.15 0.20 0.25
-2.50
-1.65 -1.60 -1.55
-27.0
1.40 1.45 1.50
-11.90
-2.55 -27.2
-11.95
-2.60
-27.4 -12.00
(d) Using the graph in part (a) and the local minimum, 27 18, found in part (c), we see that the range is [ 27 18 .
(e) Using the information from part (c) and the graph in part (a), f x is increasing on the intervals 1 61 0 18 and
1 43 and decreasing on the intervals 1 61 and 0 18 1 43 .
FOCUS ON MODELING Modeling with Functions
1. Let be the width of the building lot. Then the length of the lot is 3 . So the area of the building lot is A 3 2,
0.
2. Let be the width of the poster. Then the length of the poster is 10. So the area of the poster is
A 10 2 10 .
3. L be the width of the base of the rectangle. Then the height of the rectangle is 1 . Thus the volume of the box is given
by the function V 1 3, 0.
4. Let r be the radius of the cylinder. Then the height of the cylinder is 4r . Since for a cylinder V r 2 h, the volume of the
cylinder is given by the function V r r 2 4r 4 r 3 .
5. Let P be the perimeter of the rectangle and y be the length of the other side. Since P 2x 2 y and the perimeter is 20, we
have 2x 2y 20 x y 10 y 10 x . Since area is A xy, substituting gives A x x 10 x 10x x 2 ,
and since A must be positive, the domain is 0 x 10.
6. Let A be the area and y be the length of the other side. Then A xy 16 y 16
. Substituting into P 2x 2 y gives
P 2x 2
16
x 2x
32 , where x 0.
x
Full file at https://testbank123.eu/Solutions-Manual-for-Precalculus-Mathematics-for-Calculus-7th-Edition-Stewart
Full file at https://testbank123.eu/Solutions-Manual-for-Precalculus-Mathematics-for-Calculus-7th-Edition-Stewart

232 FOCUS ON MODELING Modeling with Functions 232
2
x
4
4
2
1
7
4
b
x
x
x 2
5
b
7. Let h be the height of an altitude of the equilateral triangle whose side has length x ,
as shown in the diagram. Thus the area is given by A 1 xh. By the Pythagorean
x x h
Theorem, h2
1
2 2 x 2 h2
1 x 2 x 2 h2 3 x 2 h 3 x .
Substituting into the area of a triangle, we get _ 2
A x 1 xh 1 x 3
3 x 2, x 0.
2 2 2 4
8. Let d represent the length of any side of a cube. Then the surface area is S 6d 2 , and the volume is V d 3 d 3
V .
2Substituting for d gives S V 6 3 V 6V 2 3, V 0.
A A
9. We solve for r in the formula for the area of a circle. This gives A r 2 r 2
A
r , so the model is
r A , A 0.
C10. Let r be the radius of a circle. Then the area is A r 2, and the circumference is C 2 r r . Substituting for r
2
gives A C
C 2
2
C 2 4
, C 0.
6011. Let h be the height of the box in feet. The volume of the box is V 60. Then x 2 h 60 h .
The surface area, S, of the box is the sum of the area of the 4 sides and the area of the base and top. Thus
S 4xh 2x 2 4x
60
x 2
2x 2 240
x
2x 2 , so the model is S x 240
x
2x 2, x 0.
5 12. By similar triangles,
L
12 L d
5 L d 12L 5d 7L L
5d
7 . The model is L d d .
13. dª
dÁ
D
Let d1 be the distance traveled south by the first ship and d2 be the distance
traveled east by the second ship. The first ship travels south for t hours at 5 mi/h, so
d1 15t and, similarly, d2 20t . Since the ships are traveling at right angles to
each other, we can apply the Pythagorean Theorem to get
D t
d 2 d 2 15t 2 20t 2 225t 2 400t 2 25t .
1 2
14. Let n be one of the numbers. Then the other number is 60 n, so the product is given by the function
P n n 60 n 60n n2.
15. Let b be the length of the base, l be the length of the equal sides, and h be the
height in centimeters. Since the perimeter is 8, 2l b 8 2l 8 b
l l 2h l 1 8 b . By the Pythagorean Theorem, h2
1 b
l 2
2 2
h l 2 1 b2 . Therefore the area of the triangle is
b
A 1 b h 1 b
l 2 1 b2
1 8 b 2 1 b2
2 2
b 2
4 2 4 4
2 b
4
64 16b b b 4
64 16b 4
4
4 b b 4 b
Full file at https://testbank123.eu/Solutions-Manual-for-Precalculus-Mathematics-for-Calculus-7th-Edition-Stewart
Full file at https://testbank123.eu/Solutions-Manual-for-Precalculus-Mathematics-for-Calculus-7th-Edition-Stewart

233 FOCUS ON MODELING Modeling with Functions 233
so the model is A b b 4 b, 0 b 4.
Full file at https://testbank123.eu/Solutions-Manual-for-Precalculus-Mathematics-for-Calculus-7th-Edition-Stewart
Full file at https://testbank123.eu/Solutions-Manual-for-Precalculus-Mathematics-for-Calculus-7th-Edition-Stewart

234 FOCUS ON MODELING Modeling with Functions 234
First number Second number Product
1
2
3
4
5
6
7
8
9
10
11
18
17
16
15
14
13
12
11
10
9
8
18
34
48
60
70
78
84
88
90
90
88
2
16. Let x be the length of the shorter leg of the right triangle. Then the length of the other triangle is 2x . Since it is a right
triangle, the length of the hypotenuse is x 2
P x x 2x 5 x 3 5 x .
2x 2 5x 2 5 x (since x
0 ). Thus the perimeter of the triangle is
17. Let be the length of the rectangle. By the Pythagorean Theorem, 1
2 h2
102 h2
102
2
4
2 4 100 h2
2 100 h2 (since Therefore, the area of the rectangle is A h 2h 100 h2,
so the model is A h 2h 100 h2, 0 h 10.
18. Using the formula for the volume of a cone, V 1 r 2 h, we substitute V 100 and solve for h. Thus 100 1 r 2 h
300 h r
r 2 .
19. (a) We complete the table.
3 3
(b) Let x be one number: then 19 x is the other
number, and so the product, p, is
p x x 19 x 19x x 2.
(c) p x 19x x 2 x 2 19x 2
x
19x 19
2 2
19
2 2
x 9 5 2 90 25
So the product is maximized when the numbers
are both 9 5.
From the table we conclude that the numbers is
still increasing, the numbers whose product is a
maximum should both be 9 5.
20. Let the positive numbers be x and y. Since their sum is 100, we have x y 100 y 100 x . We wish to minimize
the sum of squares, which is S x 2 y2 x 2 100 x 2. So S x x 2 100 x 2 x 2 10,000 200x
x 2 2x 2 200x 10,000 2 x 2 100x
10,000 2 x 2 100x 2500
10,000 5000 2 x 50 2 5000.
Thus the minimum sum of squares occurs when x 50. Then y 100 50 50. Therefore both numbers are 50.
Full file at https://testbank123.eu/Solutions-Manual-for-Precalculus-Mathematics-for-Calculus-7th-Edition-Stewart
Full file at https://testbank123.eu/Solutions-Manual-for-Precalculus-Mathematics-for-Calculus-7th-Edition-Stewart

235 FOCUS ON MODELING Modeling with Functions 235
Width Length Area
200 2000 400,000
300 1800 540,000
400 1600 640,000
500 1400 700,000
600 1200 720,000
700 1000 700,000
800 800 640,000
2
30
21. (a) Let x be the width of the field (in feet) and l be the length of the field (in feet). Since the farmer has 2400 ft of fencing
we must have 2x l 2400.
2000
200 200
Area=2000(200)=400,000
1000
400
1000 1000
700 700
Area=400(1000)=400,000
Area=1000(700)=700,000
It appears that the field of largest area is about 600 ft 1200 ft.
(b) Let x be the width of the field (in feet) and l be the length of the field (in feet). Since the farmer has 2400 ft
of fencing we must have 2x l 2400 l 2400 2x . The area of the fenced-in field is given by
A x l x 2400 2x x 2x 2 2400x 2 x 2 1200x .
(c) The area is A x 2 x 2 1200x 6002
2 6002
2 x 600 2 720,000. So the maximum area occurs
when x 600 feet and l 2400 2 600 1200 feet.
22. (a) Let be the width of the rectangular area (in feet) and l be the length of the field (in feet). Since the farmer has 750
feet of fencing, we must have 5 2l 750 2l 750 5 l 5 150 . Thus the total area of the four
5
pens is A l 5 150 2 150 .2 2
5
5
5
5
(b) We complete the square to get A 2
2 150
2 2 150 752 2
752 2
75 2
14062 5. Therefore, the largest possible total area of the four pens is 14,062 5 square feet.
23. (a) Let x be the length of the fence along the road. If the area is 1200, we have 1200 x width, so the width of the garden
1200
is x
. Then the cost of the fence is given by the function C x 5 x 3
x 2 1200
x
8x 7200
. x
(b) We graph the function y C x in the viewing
rectangle [0 75] [0 800]. From this we get the
cost is minimized when x 30 ft. Then the
width is 1200 40 ft. So the length is 30 ft and
the width is 40 ft.
(c) We graph the function y C x and y 600 in
the viewing rectangle [10 65] [450 650].
From this we get that the cost is at most $600
when 15 x 60. So the range of lengths he
can fence along the road is 15 feet to 60 feet.
500 600
0
0 50
500
20 40 60
Full file at https://testbank123.eu/Solutions-Manual-for-Precalculus-Mathematics-for-Calculus-7th-Edition-Stewart
Full file at https://testbank123.eu/Solutions-Manual-for-Precalculus-Mathematics-for-Calculus-7th-Edition-Stewart

236 FOCUS ON MODELING Modeling with Functions 236
4
24. (a) Let x be the length of wire in cm that is bent into a square. So 10 x is the length of wire in
cm that is bent into the second square. The width of each square is x
and 4
10 x
4
, and the area
of each square is x 2 x 2
10 x 2 and 100 20x x 2
. Thus the sum of the areas is
4 16 4
16
x 2 100 20x x 2 100 20x 2x 2 1 2 5 25
A x 16 16 16
8
x
4
x 4
.
25
(b) We complete the square. A x 1 x 2 5 x 25 1 x 2 10x
25 1 x 2 10x 25
25 1
2 25
8 4 4 8 4 8 4
25 2
8 8
x 5 8
So the minimum area is 8 cm when each piece is 5 cm long.
25. (a) Let h be the height in feet of the straight portion of the window. The circumference of the semicircle
is C 1 x . Since the perimeter of the window is 30 feet, we have x 2h 1 x 30. 2 2
Solving for h, we get 2h 30 x 1 x h 15 1 x 1 x . The area of the window is 2 2 4
2A x xh 1
1 x
x 15 1 x 1 x
1 x 2 15x 1 x 2 1 x 2 .
2 2 2 4
1
8 2 8
120
(b) A x 15x 1 4 x 2 4 x 2 x
8 8 4
1
2 120 60 2
450 1
60 2 450
8
4 x x 4
60
4
4
8 4
1
x 4
1
4
The area is maximized when x
8 40, and hence h 15 2
8 40 4
8 40 4 20.
26. (a) The height of the box is x , the width of
the box is 12 2x , and the length of the
box is 20 2x . Therefore, the volume of
the box is
V x x 12 2x 20 2x
4x 3 64x 2 240x , 0 x 6
(b) We graph the function y V x in the viewing rectangle
[0 6] [200 270].
250
200
(c) From the graph, the volume of the box
with the largest volume is 262 682 in3
when x 2 427.
0 5
From the calculator we get that the volume of the box is
greater than 200 in3 for 1 174 x 3 898 (accurate to 3
decimal places).
27. (a) Let x be the length of one side of the base and let h be the height of the box in feet. Since the volume of
12the box is V x 2 h 12, we have x 2 h 12 h . The surface area, A, of the box is sum of the
x 2
Full file at https://testbank123.eu/Solutions-Manual-for-Precalculus-Mathematics-for-Calculus-7th-Edition-Stewart
Full file at https://testbank123.eu/Solutions-Manual-for-Precalculus-Mathematics-for-Calculus-7th-Edition-Stewart

237 FOCUS ON MODELING Modeling with Functions 237
2
area of the four sides and the area of the base. Thus the surface area of the box is given by the formula
A x 4xh x 2 4x
12
x 2
x 2 48
x x , x 0.
Full file at https://testbank123.eu/Solutions-Manual-for-Precalculus-Mathematics-for-Calculus-7th-Edition-Stewart
Full file at https://testbank123.eu/Solutions-Manual-for-Precalculus-Mathematics-for-Calculus-7th-Edition-Stewart

238 FOCUS ON MODELING Modeling with Functions 238
(b) The function y A x is shown in the first viewing rectangle below. In the second viewing rectangle, we isolate the
minimum, and we see that the amount of material is minimized when x (the length and width) is 2 88 ft. Then the
12 height is h
x 2 1 44 ft.
50 26
25
0 0 2 4
24 3.0
28. Let A, B, C , and D be the vertices of a rectangle with base AB on the x -axis and its other two vertices C and D above the x
-axis and lying on the parabola y 8 x 2. Let C have the coordinates x y , x 0. By symmetry, the coordinates of D
must be x y . So the width of the rectangle is 2x , and the length is y 8 x 2. Thus the area of the rectangle is
A x length width 2x 8 x 2
16x 2x 3. The graphs of A x below show that the area is maximized when
x 1 63. Hence the maximum area occurs when the width is 3 26 and the length is 5 33.
y
y=8-x@
20 18 D C
10 17
x
A B x
0 0 2 4
16 1.5 2.0
29. (a) Let be the width of the pen and l be the length in meters. We use the area to establish a relationship between
100 and l . Since the area is 100 m2, we have l 100 l . So the amount of fencing used is
F 2l 2 2
100
2 200 2 2
.
(b) Using a graphing device, we first graph F in the viewing rectangle [0 40] by [0 100], and locate the approximate
location of the minimum value. In the second viewing rectangle, [8 12] by [39 41], we see that the minimum value of
F occurs when 10. Therefore the pen should be a square with side 10 m.
100 41
50 40
0 0 20 40
39 8 10 12
Full file at https://testbank123.eu/Solutions-Manual-for-Precalculus-Mathematics-for-Calculus-7th-Edition-Stewart
Full file at https://testbank123.eu/Solutions-Manual-for-Precalculus-Mathematics-for-Calculus-7th-Edition-Stewart

239 FOCUS ON MODELING Modeling with Functions 239
5
2
2
2
30. (a) Let t1 represent the time, in hours, spent walking, and let t2 represent
the time spent rowing. Since the distance walked is x and the walking
speed is 5 mi/h, the time spent walking is t1 1 x . By the
Pythagorean Theorem, the distance rowed is
(b) We graph y T x . Using the zoom
function, we see that T is minimized
when x 6 13. He should land at a point
6 13 miles from point B.
d 22 7 x 2 x 2 14x 53, and so the time spent 4
rowing is t2 1 x 2 14x 53. Thus the total time is 2
T x 1 x 2 14x 53 1 x .
2 5 0
0 2 4 6
31. (a) Let x be the distance from point B to C , in miles. Then the distance from A to C is x 2 25, and the energy used in
flying from A to C then C to D is f x 14 x 2 25 10 12 x .
(b) By using a graphing device, the energy expenditure is minimized when the distance from B to C is about 5 1 miles.
200 169.1
100 169.0
0 0 5 10
168.9 5.0 5.1 5.2
32. (a) Using the Pythagorean Theorem, we have that the height of the upper triangles is 25 x 2 and the height of the lower
triangles is 144 x 2. So the area of the each of the upper triangles is 1 x 25 x 2, and the area of the each of the
lower triangles is 1 x 144 x 2. Since there are two upper triangles and two lower triangles, we get that the total area
is A x 2 1 x 25 x 2
2
1 x 144 x 2
x 25 x 2 144 x 2 .
2 2
(b) The function y A x x 25 x 2 144 x 2 is shown in the first viewing rectangle below. In the second
viewing rectangle, we isolate the maximum, and we see that the area of the kite is maximized when x 4 615.
So the length of the horizontal crosspiece must be 2 4 615 9 23. The length of the vertical crosspiece is
52 4 615 2 122 4 615 2 13 00.
100 60.1
50 60.0
0 0 2 4
59.9 4.60 4.62 4.64
Full file at https://testbank123.eu/Solutions-Manual-for-Precalculus-Mathematics-for-Calculus-7th-Edition-Stewart
Full file at https://testbank123.eu/Solutions-Manual-for-Precalculus-Mathematics-for-Calculus-7th-Edition-Stewart

1
2 FUNCTIONS
2.1 FUNCTIONS
H Suggested Time and Emphasis
2 –1 class. Essential material.
H Points to Stress
1. The idea of function, viewed as the dependence of one quantity on a different quantity.
2. The notation associated with piecewise-defined functions.
3. Domains and ranges from an algebraic perspective.
4. Four different representations of functions (verbally, algebraically, visually, and numerically).
H Sample Questions
• Text Question: What is a function?
Answer: Answers will vary. The hope is that the students will, in their own words, arrive at the idea that a
function assigns each element of one set to exactly one element of another set (or the same set).
• Drill Question: Let ( ) = + √
. Find (0) and (4).
Answer: (0) = 0, (4) = 6
H In-Class Materials
• Discuss the ties between the idea of a function and a calculator key. Keys such as sin, cos, tan, and √
represent functions. It is easy to compute and graph functions on a calculator. Contrast this with
equations such as 3 − 3 = 2 , which have graphs but are not easy to work with, even with a calculator.
(Even computer algebra systems have a tough time with some general relations.) Point out that calculators
often give approximations to function values—applying the square root function key to the number 2 gives
1 4142136 which is close to, but not equal to, √
2.
• Most math courses through calculus emphasize functions where both the domain and range sets are
numerical. One could give a more abstract definition of function, where and can be any set. For
example, there is a function mapping each student in the class to his or her birthplace. A nice thing about
this point of view is that it can be pointed out that the map from each student to his or her telephone number
may not be a function, because a student may have more than one telephone number, or none at all.
• Function notation can trip students up. Start with a function such as ( ) = 2 − and have your students
find (0), (1), ¡√
3¢, and (−1). Then have them find ( ), ( ), and (of course) ( + ). Some
students will invariably, some day, assume that ( + ) = ( ) + ( ) for all functions, but this can be
minimized if plenty of examples such as (2 + 3) are done at the outset.
85
Full file at https://testbank123.eu/Solutions-Manual-for-Precalculus-Mathematics-for-Calculus-7th-Edition-Stewart
Full file at https://testbank123.eu/Solutions-Manual-for-Precalculus-Mathematics-for-Calculus-7th-Edition-Stewart

7
CHAPTER 2 Functions
• Discuss the usual things to look for when trying to find the domain of a function: zero denominators and
negative even roots. ½ 2 if is an integer
Then discuss the domain and range of ( ) = 0 if is not an integer
½ 2 if is rational If the class seems interested, perhaps let them think about ( ) =
( − 2)
0 if is irrational
• Let ( ) = and ( ) = . Ask students if the functions are the same function. If they say − 2
“yes”, ask them to compare the domains, or to compute (2) and (2). If they say “no”, ask them to find
a value such that ( ) = ( ). [This activity assumes that students know the equation of a circle with
radius . If they do not, this may be a good opportunity to introduce the concept.]
H Examples
• Real-world piecewise functions:
1. The cost of mailing a parcel that weighs ounces (see Figure 1 in the text)
2. The cost of making photocopies (given that there is usually a bulk discount)
3. The cost of printing pages from an inkjet printer (at some point the cartridges must be replaced) r
2 − 5 + 6 • A function with a nontrivial domain:
H Group Work 1: Finding a Formula
2 − 2 + 1 has domain (−∞ 1) ∪ (1 2] ∪ [3 ∞).
Make sure that students know the equation of a circle with radius , and that they remember the notation for
piecewise-defined functions. Divide the class into groups of four. In each group, have half of them work on
each problem first, and then have them check each other’s work. If students find these problems difficult, have
them work together on each problem.
⎧ ⎧
+ 4 if ≤ −2− − 2 if ≤ −2 ⎪
2 if
2 0
Answers: 1. ( ) =
+ 2 if −2 ≤ 0 2. ( ) =
⎪⎨ − ≤
√4 2
2 if 0
H Group Work 2: Rounding the Bases
⎪ − if 0 ≤ 2
− 2 if 2
On the board, review how to compute the percentage error when estimating by 22 . (Answer: 0 04%)
Have them work on the problem in groups. If a group finishes early, have them look at (7) and (10) to
see how fast the error grows. Students have not seen exponential functions before, but Problem 3 is a good
foreshadowing of Section 4.1.
Answers: 1. 17 811434627, 17, 4 56% 2. 220 08649875, 201, 8 67% 3. 45 4314240633, 32, 29 56%
H Homework Problems
Core Exercises: 3, 15, 20, 33, 37, 50, 58, 68, 80, 89, 94
Sample Assignment: 1, 3, 8, 13, 15, 17, 20, 25, 29, 32, 33, 35, 37, 42, 43, 50, 53, 57, 58, 64, 68, 73, 76, 80, 83,
86, 89, 94 Full file at https://testbank123.eu/Solutions-Manual-for-Precalculus-Mathematics-for-Calculus-7th-Edition-Stewart
Full file at https://testbank123.eu/Solutions-Manual-for-Precalculus-Mathematics-for-Calculus-7th-Edition-Stewart

86
Full file at https://testbank123.eu/Solutions-Manual-for-Precalculus-Mathematics-for-Calculus-7th-Edition-Stewart
Full file at https://testbank123.eu/Solutions-Manual-for-Precalculus-Mathematics-for-Calculus-7th-Edition-Stewart
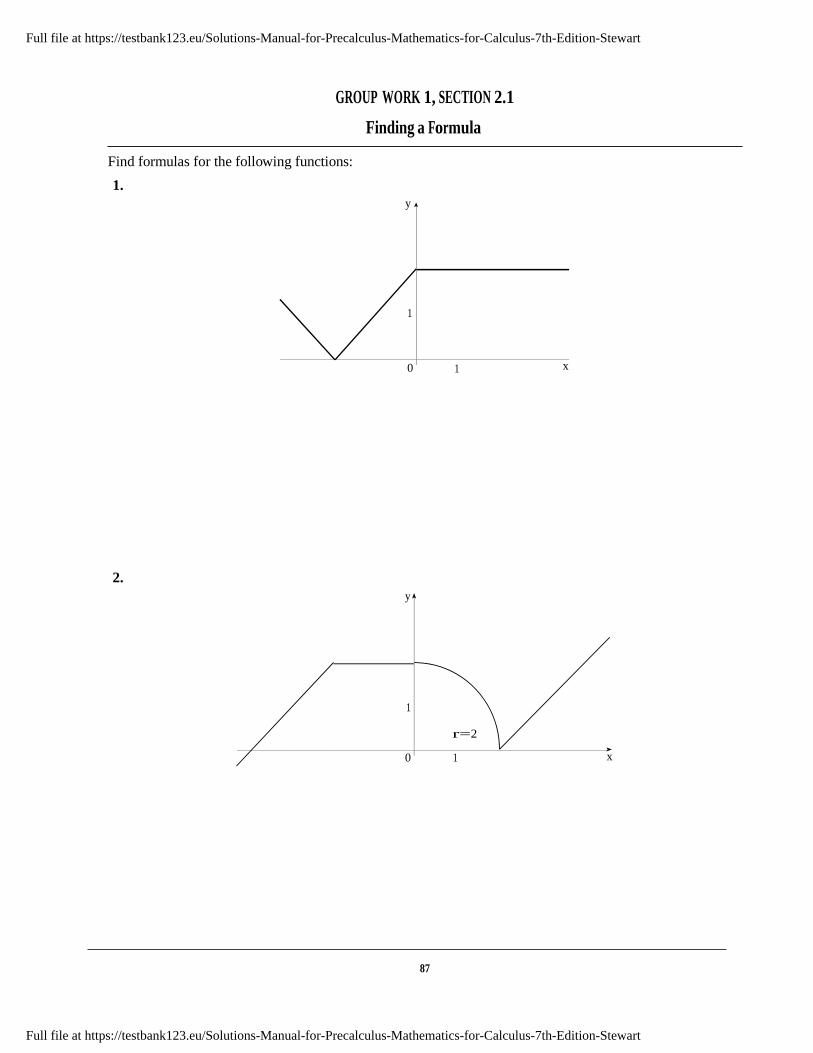
1
r=2
1
GROUP WORK 1, SECTION 2.1
Finding a Formula
Find formulas for the following functions:
1.
y
0 1 x
2.
y
0 1 x
87
Full file at https://testbank123.eu/Solutions-Manual-for-Precalculus-Mathematics-for-Calculus-7th-Edition-Stewart
Full file at https://testbank123.eu/Solutions-Manual-for-Precalculus-Mathematics-for-Calculus-7th-Edition-Stewart
GROUP WORK 2, SECTION 2.1
Rounding the Bases
1. For computational efficiency and speed, we often round off constants in equations. For example, consider
the linear function
( ) = 3 137619523 + 2 123337012
In theory, it is easy and quick to find (1), (2), (3), (4), and (5). In practice, most people doing
this computation would probably substitute
( ) = 3 + 2
unless a very accurate answer is called for. For example, compute (5) both ways to see the difference.
The actual value of (5):
The “rounding” estimate:
The percentage error:
2. Now consider
( ) = 1 12755319 3 + 3 125694 2 + 1
Again, one is tempted to substitute ( ) = 3 + 2 + 1.
The actual value of (5):
The “rounding” estimate:
The percentage error:
3. It turns out to be dangerous to similarly round off exponential functions, due to the nature of their growth.
For example, let’s look at the function
( ) = (2 145217198123)
One may be tempted to substitute ( ) = 2 for this one. Once again, look at the difference between
these two functions.
The actual value of (5):
The “rounding” estimate:
The percentage error:
88
Full file at https://testbank123.eu/Solutions-Manual-for-Precalculus-Mathematics-for-Calculus-7th-Edition-Stewart
Full file at https://testbank123.eu/Solutions-Manual-for-Precalculus-Mathematics-for-Calculus-7th-Edition-Stewart

2.2 GRAPHS OF FUNCTIONS
H Suggested Time and Emphasis
1 class. Essential material.
H Points to Stress
1. The Vertical Line Test.
2. Graphs of piecewise-defined functions.
3. The greatest integer function.
H Sample Questions
• Text Question: Your text discusses the greatest integer function [[ ]]. Compute [[2 6]], [[2]], [[−2 6]], and [[−2]].
Answer: [[2 6]] = 2, [[2]] = 2, [[−2 6]] = −3, [[−2]] = −2
• Drill Question: Let ( ) = 2 + | |. Which of the following is the graph of ? How do you know?
(a) y
0
(b) y
4
(c) y
2
(d) y
2
_1
_2 _2 _1 0 1 2 x _2 _1 0 1 2 x
_3
_4 _2 _1 0
1 2 x _2 _2
Answer: (b) is the graph of , because ( ) ≥ 0 for all .
H In-Class Materials
• Draw a graph of fuel efficiency versus time on a trip, such as the one below. Lead a discussion of what
could have happened on the trip.
Fuel Efficiency (miles/gallon)
30
20
10
0 1 2 3 Time (Hours)
• In 1984, United States President Ronald Reagan proposed a plan to change the personal income tax system.
According to his plan, the income tax would be 15% on the first $19,300 earned, 25% on the next $18,800,
and 35% on all income above and beyond that. Describe this situation to the class, and have them graph
tax owed as a function of income for incomes ranging from $0 to $80,000. Then have them try to
come up with equations describing this situation.
89
Full file at https://testbank123.eu/Solutions-Manual-for-Precalculus-Mathematics-for-Calculus-7th-Edition-Stewart
Full file at https://testbank123.eu/Solutions-Manual-for-Precalculus-Mathematics-for-Calculus-7th-Edition-Stewart

CHAPTER 2 Functions SECTION 2.2 Graphs of Functions
T
16,000
12,000
8000
4000
0 20,000 40,000 60,000
4
3
2
1
_ 1 2 3 4 5
4
3
2
1
_ 1 2 3 4 5
T
4000
3000
2000
1000
0
−
Answer:
I
• In the year 2000, Presidential candidate Steve Forbes proposed a “flat tax” model: The first $36,000 of a
taxpayer’s annual income would not be taxed at all, and the rest would be taxed at a rate of 17%. Have your
students do the same analysis they did of Reagan’s 1984 plan, and compare the models. As an extension,
consider having them look at a current tax table and draw similar graphs.
Answer:
20,000 40,000 I
• Discuss the shape, symmetries, and general “flatness” near 0 of the power functions for various values
of . Similarly discuss √
for even and odd. A blackline master is provided at the end of this section,
before the group work handouts.
H Examples
• A continuous piecewise-defined function
y
• A discontinuous piecewise-defined
function
y
2 _1 0 x
_1
_2
⎧ 4 2 if 0 ⎪⎨
2 _1 0 x
_1
_2
⎧ 2
( ) = 4 − 2 if 0 ≤ ≤ 2 4 − if 0
√ − 2 if 2 ( ) =
⎪⎩ 90
+ 2 if 0 ≤ ≤ 2 √3 if 2
Full file at https://testbank123.eu/Solutions-Manual-for-Precalculus-Mathematics-for-Calculus-7th-Edition-Stewart
Full file at https://testbank123.eu/Solutions-Manual-for-Precalculus-Mathematics-for-Calculus-7th-Edition-Stewart

CHAPTER 2 Functions SECTION 2.2 Graphs of Functions
• Classic rational functions with interesting graphs
y
4
2
0
_8 _6 _4 _2 2 4 x
_2
_4
1 2 ( ) =
2 + 2
( ) =
2 + − 2
H Group Work 1: Every Picture Tells a Story
Put students in groups of four, and have them work on the exercise. If there are questions, encourage them to
ask each other before asking you. After going through the correct matching with them, have each group tell
their story to the class and see if it fits the remaining graph.
Answers:
1. (b) 2. (a) 3. (c)
4. The roast was cooked in the morning and put in the refrigerator in the afternoon.
H Group Work 2: Functions in the Classroom
Before starting this one, review the definition of “function”. Some of the problems can be answered only by
polling the class after they are finished working. Don’t forget to take leap years into account for the eighth
problem. For an advanced class, anticipate Section 2.8 by quickly defining “one-to-one” and “bijection”, then
determining which of the functions have these properties.
91
Full file at https://testbank123.eu/Solutions-Manual-for-Precalculus-Mathematics-for-Calculus-7th-Edition-Stewart
Full file at https://testbank123.eu/Solutions-Manual-for-Precalculus-Mathematics-for-Calculus-7th-Edition-Stewart

CHAPTER 2 Functions SECTION 2.2 Graphs of Functions
Answers:
Chairs: Function, one-to-one, bijection (if all chairs are occupied)
Eye color: Function, not one-to-one
Mom & Dad’s birthplace: Not a function; mom and dad could have been born in different places
Molecules: Function, one-to-one (with nearly 100% probability); inverse assigns a number of molecules to the
appropriate student.
Spleens: Function, one-to-one, bijection. Inverse assigns each spleen to its owner.
Pencils: Not a function; some people may have more than one or (horrors!) none.
Social Security Number: Function, one-to-one; inverse assigns each number to its owner.
February birthday: Not a function; not defined for someone born on February 29.
Birthday: Function, perhaps one-to-one.
Cars: Not a function; some have none, some have more than one.
Cash: Function, perhaps one-to-one.
Middle names: Not a function; some have none, some have more than one.
Identity: Function, one-to-one, bijection. Inverse is the same as the function.
Instructor: Function, not one-to-one.
H Group Work 3: Rational Functions
Remind students of the definition of a rational function as a quotient of polynomials. Students should be able
to do this activity by plotting points and looking at domains and ranges.
Answers:
1. 2. (d) 3. (b) 4. (e) 5. (c) 6. (a)
H Homework Problems
Core Exercises: 3, 7, 22, 34, 42, 47, 52, 60, 70, 78, 83
Sample Assignment: 3, 4, 7, 8, 16, 22, 25, 31, 34, 38, 42, 45, 47, 50, 52, 56, 60, 64, 66, 70, 73, 76, 78, 81, 83,
87
92
Full file at https://testbank123.eu/Solutions-Manual-for-Precalculus-Mathematics-for-Calculus-7th-Edition-Stewart
Full file at https://testbank123.eu/Solutions-Manual-for-Precalculus-Mathematics-for-Calculus-7th-Edition-Stewart

CHAPTER 2 Functions SECTION 2.2 Graphs of Functions
y y y
1 1 1
0 1 x
y
1
0 1 x
2
y
1
0 1 x
3
y
1
0 1 x 0 1 x 0 1 x
4 5 6
y y y
1 1 1
0 1 x
y
1
0 1 x
√
y
1
0 1 x
√3
y
1
0 1 x 0 1 x 0 1 x
√4
√5
√6
93
Full file at https://testbank123.eu/Solutions-Manual-for-Precalculus-Mathematics-for-Calculus-7th-Edition-Stewart
Full file at https://testbank123.eu/Solutions-Manual-for-Precalculus-Mathematics-for-Calculus-7th-Edition-Stewart

GROUP WORK 1, SECTION 2.2
Every Picture Tells a Story
One of the skills you will be learning in this course is the ability to take a description of a real-world occur-
rence, and translate it into mathematics. Conversely, given a mathematical description of a phenomenon, you
will learn how to describe what is happening in plain language. Here follow four graphs of temperature ver-
sus time and three stories. Match the stories with the graphs. When finished, write a similar story that would
correspond to the final graph.
T T
t
Graph 1
t
Graph 2
T T
t
Graph 3
t
Graph 4
(a) I took my roast out of the freezer at noon, and left it on the counter to thaw. Then I cooked it in the oven
when I got home.
(b) I took my roast out of the freezer this morning, and left it on the counter to thaw. Then I cooked it in the
oven when I got home.
(c) I took my roast out of the freezer this morning, and left it on the counter to thaw. I forgot about it, and
went out for Chinese food on my way home from work. I put it in the refrigerator when I finally got home.
94
Full file at https://testbank123.eu/Solutions-Manual-for-Precalculus-Mathematics-for-Calculus-7th-Edition-Stewart
Full file at https://testbank123.eu/Solutions-Manual-for-Precalculus-Mathematics-for-Calculus-7th-Edition-Stewart

GROUP WORK 2, SECTION 2.2
Functions in the Classroom Which of the following relations are functions?
Domain All the people in your classroom
All the people in your classroom
Function Values
Chairs
The set {blue, brown, green, hazel}
Function
(person) = his or her chair
(person) = his or her eye color
All the people in your classroom Cities (person) = birthplace of their mom and dad
All the people in your classroom
R, the real numbers
(person) = number of molecules in their body
All the people in your classroom Spleens (person) = his or her own spleen
All the people in your classroom
Pencils
(person) = his or her pencil
All the people in the United States
Integers from 0–999999999
(person) = his or her Social Security number
All the living people born in February
Days in February, 2019
(person) = his or her birthday in February 2019
All the people in your classroom
Days of the year
(person) = his or her birthday
All the people in your classroom
Cars
(person) = his or her car
All the people in your classroom
R, the real numbers
(person) = how much cash he or she has
All the people in your college Names (person) = his or her middle name
All the people in your classroom
People
(person) = himself or herself
All the people in your classroom
People
(person) = his or her mathematics instructor
95
Full file at https://testbank123.eu/Solutions-Manual-for-Precalculus-Mathematics-for-Calculus-7th-Edition-Stewart
Full file at https://testbank123.eu/Solutions-Manual-for-Precalculus-Mathematics-for-Calculus-7th-Edition-Stewart

GROUP WORK 3, SECTION 2.2
3 2
2
2
−
Rational Functions
The functions below are sad and lonely because they have lost their graphs! Help them out by matching each
function with its graph. One function’s graph is not pictured here; when you are done matching, go ahead and
sketch that function’s graph.
1. −
2. − 1
0 125 2 − 4
3. − 4
4. − 1
2 − 1
5 ¡
2 − 1¢
5. 2 + 1
+ 0 5
5 ¡
2 1¢
6. − 2 − 1
(a) y
10
(b) y
10
_4 _2 0 2 4 x _4 _2 0 2 4 x
_10 _10
(c) y
10
(d) y
10
_4 _2 0 2 4 x _4 _2 0 2 4 x
_10 _10
(e) y y
10 10
_4 _2 0 2 4 x _4 _2 0 2 4 x
_10 _10
Full file at https://testbank123.eu/Solutions-Manual-for-Precalculus-Mathematics-for-Calculus-7th-Edition-Stewart
Full file at https://testbank123.eu/Solutions-Manual-for-Precalculus-Mathematics-for-Calculus-7th-Edition-Stewart

GROUP WORK 4, SECTION 2.2
96
Full file at https://testbank123.eu/Solutions-Manual-for-Precalculus-Mathematics-for-Calculus-7th-Edition-Stewart
Full file at https://testbank123.eu/Solutions-Manual-for-Precalculus-Mathematics-for-Calculus-7th-Edition-Stewart

1
0 1
1
−
2.3 GETTING INFORMATION FROM THE GRAPH OF A FUNCTION
H Suggested Time and Emphasis
2 –1 class. Essential material.
H Points to Stress
1. Gaining information about a function from its graph, including finding function values, domain and range.
2. Algebraic and geometric definitions of increasing and decreasing.
3. Finding local extrema of a function from its graph.
H Sample Questions
• Text Question: Draw a graph of a function with domain [−10 10] and range [−2 2]. There should be at least
one interval where the graph is increasing and at least one interval where the graph is decreasing.
Answer: Answers will vary.
• Drill Question: If ( ) = − 2 + 9 + 2, find the extreme value of . Is it a maximum or a minimum?
Answer: ¡
9 ¢
= 89 is a maximum. 2 4
H In-Class Materials
• Explore domain and range with some graphs that have holes, such as the graphs of some of the functions
in the previous section.
y y
12
10
8
6
x 4
2
_4 _2 0 2 4 x
( ) = ( − 2)
− 2
r 2 5 + 6
( ) = 2 − 2 + 1
• Draw a graph of electrical power consumption in the classroom versus time on a typical weekday, pointing
out important features throughout, and using the vocabulary of this section as much as possible.
97
Full file at https://testbank123.eu/Solutions-Manual-for-Precalculus-Mathematics-for-Calculus-7th-Edition-Stewart
Full file at https://testbank123.eu/Solutions-Manual-for-Precalculus-Mathematics-for-Calculus-7th-Edition-Stewart
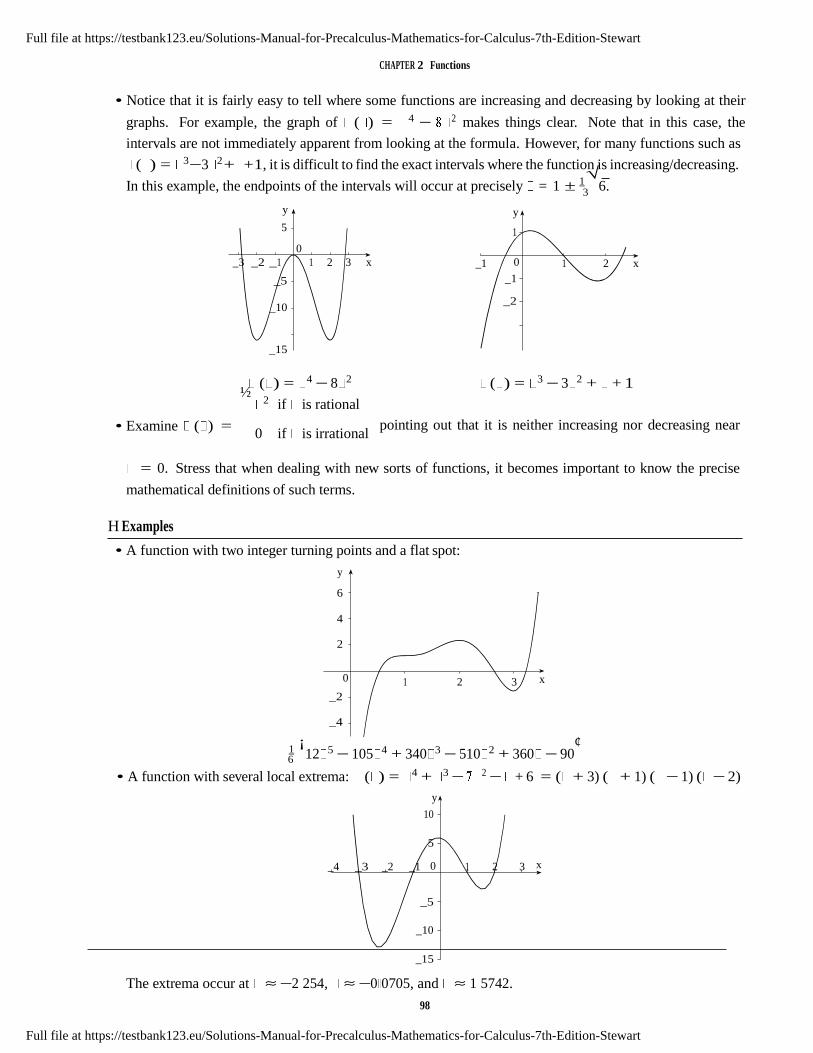
3
6
CHAPTER 2 Functions
• Notice that it is fairly easy to tell where some functions are increasing and decreasing by looking at their
graphs. For example, the graph of ( ) = 4 − 2 makes things clear. Note that in this case, the
intervals are not immediately apparent from looking at the formula. However, for many functions such as
( ) = 3 −3 2 + +1, it is difficult to find the exact intervals where the function is increasing/decreasing.
In this example, the endpoints of the intervals will occur at precisely = 1 ± 1 √
6.
y y
5 1
0
_3 _2 _1 1 2 3 x
_5
_10
_1 0
_1
_2
1 2 x
_15
( ) = 4 − 8 2
½ 2 if is rational
( ) = 3 − 3 2 + + 1
• Examine ( ) = 0 if is irrational
pointing out that it is neither increasing nor decreasing near
= 0. Stress that when dealing with new sorts of functions, it becomes important to know the precise
mathematical definitions of such terms.
H Examples
• A function with two integer turning points and a flat spot:
y
6
4
2
0 1 2 3 x
_2
_4
1 ¡12 5 − 105 4 + 340 3 − 510 2 + 360 − 90
¢
• A function with several local extrema: ( ) = 4 + 3 − 2 − + 6 = ( + 3) ( + 1) ( − 1) ( − 2)
y
10
5
_4 _3 _2 _1 0 1 2 3 x
_5
_10
_15
The extrema occur at ≈ −2 254, ≈ −0 0705, and ≈ 1 5742.
98
Full file at https://testbank123.eu/Solutions-Manual-for-Precalculus-Mathematics-for-Calculus-7th-Edition-Stewart
Full file at https://testbank123.eu/Solutions-Manual-for-Precalculus-Mathematics-for-Calculus-7th-Edition-Stewart

SECTION 2.3 Getting Information from the Graph of a Function
H Group Work 1: Calculator Exploration
This gives students a chance to graph things on their calculator and make conclusions. It will also serve as a
warning that relying on calculator graphs without understanding the functions can lead one astray.
Notice that in calculus, when we say a function is increasing, we are saying it is increasing at every point on
its domain. In this context, we are talking about increasing over an interval, which is slightly different. The
curve −1 , for example, is increasing at every point in its domain. Can we say it is decreasing over the
interval [−10 1]? No, because it is not defined in that interval. So the curve −1 is increasing over every
interval for which it is defined.
Answers:
1. (c) 2. (a) 3. (a) (assuming positive intervals) 4. (c) 5. (c) 6. (a) 7. (b) 8. (a) 9. (c)
10. (c)
y
100 2000
_5 5 x
_100 100 x
_1000
_100
( ) = 20 + sin
H Group Work 2: The Little Dip
_2000
( ) = 20 + sin
In this exercise students analyze a function with some subtle local extrema. After they have tried, reveal that
there are two local maxima and two local minima.
After students have found the extrema, point out that if they take calculus, they will learn a relatively simple
way to find the exact coordinates of the extrema.
Answers:
1. y y
1000
_3.48
_3.5
_3.52
_8 _6 _4 _2 0 2 4 x 1 2 x
2. There are local maxima at = −6 and = 5 , and local minima at = 1 and = 3 . 4 2
H Homework Problems
Core Exercises: 3, 8, 13, 22, 32, 37, 45, 48, 52, 59, 66, 67
Sample Assignment: 1, 3, 7, 8, 9, 13, 15, 20, 22, 32, 34, 36, 37, 41, 44, 45, 48, 52, 56, 57, 59, 62, 65, 66, 67, 69
99
Full file at https://testbank123.eu/Solutions-Manual-for-Precalculus-Mathematics-for-Calculus-7th-Edition-Stewart
Full file at https://testbank123.eu/Solutions-Manual-for-Precalculus-Mathematics-for-Calculus-7th-Edition-Stewart

GROUP WORK 1, SECTION 2.3
Calculator Exploration
Graph the following curves on your calculator. For each curve specify which of the following applies.
(a) The graph of is increasing over every interval (assuming the curve is defined everywhere in that interval).
(b) The graph of is decreasing over every interval (assuming the curve is defined everywhere in that
interval).
(c) The graph of is increasing over some intervals and decreasing over others.
1. ( ) = 2
2. ( ) = 3
3. ( ) = √
4. ( ) = sin
5. ( ) = cos
6. ( ) = tan
7. ( ) = −
8. ( ) = ln
9. ( ) = 4 − 1 01
10. ( ) = 20 + sin
100
Full file at https://testbank123.eu/Solutions-Manual-for-Precalculus-Mathematics-for-Calculus-7th-Edition-Stewart
Full file at https://testbank123.eu/Solutions-Manual-for-Precalculus-Mathematics-for-Calculus-7th-Edition-Stewart

GROUP WORK 2, SECTION 2.3
The Little Dip
Consider ( ) = 1 5 + 9 4 − 143 3 + 207 2 − 45 .5 16 24
1. Draw a graph of .
16 4
2. Estimate the -values of all local extrema. Make sure your estimates are accurate to three decimal places.
101
Full file at https://testbank123.eu/Solutions-Manual-for-Precalculus-Mathematics-for-Calculus-7th-Edition-Stewart
Full file at https://testbank123.eu/Solutions-Manual-for-Precalculus-Mathematics-for-Calculus-7th-Edition-Stewart

1
2
2.4 AVERAGE RATE OF CHANGE OF A FUNCTION
H Suggested Time and Emphasis
2 –1 class. Essential material.
H Points to Stress
1. Average rate of change.
H Sample Questions
• Text Question:
Let ( ) = 3 + 2.
(a) What is the average rate of change of from = 1 to = 3?
(b) What is the average rate of change of from = 1 to = ?
Answer: (a) 3 (b) 3
• Drill Question: If ( ) = ¯
2 − |3 |¯, what is the average rate of change between = −3 and = −1?
¯ ¯
Answer: 1
H In-Class Materials
• Students should see the geometry of the average rate of change — that the average rate of change from
= to = is the slope of the line from ( ( )) to ( ( )). Armed with this knowledge, students
now have a way of estimating average rate of change: graph the function (making sure that the - and
-scales are the same), plot the relevant points, and then estimate the slope of the line between them.
• It is possible, at this point, to foreshadow calculus nicely. Take a simple function such as ( ) = 2 and
look at the average rate of change from = 1 to = 2. Then look at the average rate of change from = 1 to
= 3 . If students work in parallel, it won’t take them long to fill in the following table:
From To Average Rate of Change
= 1
= 1
= 1
= 1
= 1
= 1
2
1 5
1 25
1 1
1 01
1 001
3
2 5
2 25
2 1
2 01
2 001
Note that these numbers seem to be approaching 2. This idea is pursued further in the group work.
• Assume that a car drove for two hours and traversed 120 miles. The average rate of change is clearly
60 miles per hour. Ask the students if it was possible for the car to have gone over 60 mph at some point in
the interval, and explain how. Ask the students if it was possible for the car to have stayed under 60 mph
the whole time. Ask the students if it was possible for the car never to have gone exactly 60 mph. Their
intuition will probably say that the car had to have had traveled exactly 60 mph at one point, but it will
be hard for them to justify. The truth of this statement is an example of the Mean Value Theorem from
calculus.
102
Full file at https://testbank123.eu/Solutions-Manual-for-Precalculus-Mathematics-for-Calculus-7th-Edition-Stewart
Full file at https://testbank123.eu/Solutions-Manual-for-Precalculus-Mathematics-for-Calculus-7th-Edition-Stewart

3
SECTION 2.4 Average Rate of Change of a Function
H Examples
If ( ) = 3 − , the average rate of change from = 1 to = 4 is
(4) − (1) =
¡4 − 4
¢ −
¡13 − 1
¢
= (64 − 4) − (1 − 1)
= 60
= 20
4 − 1 3 3 3
H Group Work: Small Intervals
If you have the time, and really wish to foreshadow calculus, have the students find the limit starting with
= 1 and then again with = 3. Then see if they can find the pattern, and discover that the average value is
going to approach 3 2 if we start at .
Students won’t remember every detail of this problem in a year, obviously. So when you close, try to convey
the main idea that as we narrow the interval, the average values approach a single number, and that everything
blows up if we make the interval consist of a single point. You may want to mention that exploring this
phenomenon is a major part of the first semester of calculus.
Answers:
1. 19 2. 15 25 3. 12 61 4. 12 0601 5. 12 006001 6. 11 9401 7. 12 8. You get 0
, which is undefined. 0
H Homework Problems
Core Exercises: 3, 10, 16, 24, 31, 36, 40
Sample Assignment: 3, 4, 8, 10, 11, 15, 16, 22, 24, 26, 29, 31, 33, 36, 38, 40
103
Full file at https://testbank123.eu/Solutions-Manual-for-Precalculus-Mathematics-for-Calculus-7th-Edition-Stewart
Full file at https://testbank123.eu/Solutions-Manual-for-Precalculus-Mathematics-for-Calculus-7th-Edition-Stewart
GROUP WORK, SECTION 2.4
Small Intervals
Let us consider the curve = 3. Assume I am interested only in what is happening near = 2. It is clear
that the function is getting larger there, but my question is, how quickly is it increasing? One way to find out
is to compute average rates of change.
1. Find the average rate of change between = 2 and = 3.
2. The number 2 5 is even closer to the number 2. Remember, I only really care about what is happening
very close to = 2. So compute the average rate of change between = 2 and = 2 5.
3. We can get closer still. Compute the average rate of change between = 2 and = 2 1.
4. Can we get closer? Sure! Compute the average rate of change between = 2 and = 2 01.
5. Compute the average rate of change between = 2 and = 2 001.
6. We can also approach 2 from the other side. Compute the average rate of change between = 2 and
= 1 99.
7. Your answers should be approaching some particular number as we get closer and closer to 2. What is
that number?
8. Hey, the closest number to 2 is 2 itself, right? So go ahead and compute the average rate of change between
= 2 and = 2. What happens?
104
Full file at https://testbank123.eu/Solutions-Manual-for-Precalculus-Mathematics-for-Calculus-7th-Edition-Stewart
Full file at https://testbank123.eu/Solutions-Manual-for-Precalculus-Mathematics-for-Calculus-7th-Edition-Stewart

1
5
2
2.5 LINEAR FUNCTIONS AND MODELS
H Suggested Time and Emphasis
2 –1 class. Essential material.
H Points to Stress
1. Definition of a linear function.
2. The relationship between slope and rate of change, including units.
3. Creating linear models in an applied context.
H Sample Questions
• Text Question: What is the difference between “slope” and “rate of change?”
Answer: The text describes this as a difference in points of view. Any response that gets at the idea of a
slope being a property of a graph and a rate of change being a property of a physical situation should be
given full credit.
• Drill Question: Which of the following, if any, are linear functions?√
(a) ( ) = 3 + √
2 (b) ( ) = 3 − 2 + (c) ( ) = (d) ( ) = √
3 − 4 (e) ( ) = −
Answer: (a), (b), (c), (e)
√3
4
H In-Class Materials
• It is important to guide students from the perspective of Section 1.10 (Lines) to the more applied
perspective of this section. Start by asking the students to graph ( ) = . You should see graphs
that look like the one below.
As you know, students tend not to label their axes, and if the - and -axis scales are equal, the slope of
the line is nowhere near 60. Ask them for the slope and -intercept of their line.
105
Full file at https://testbank123.eu/Solutions-Manual-for-Precalculus-Mathematics-for-Calculus-7th-Edition-Stewart
Full file at https://testbank123.eu/Solutions-Manual-for-Precalculus-Mathematics-for-Calculus-7th-Edition-Stewart
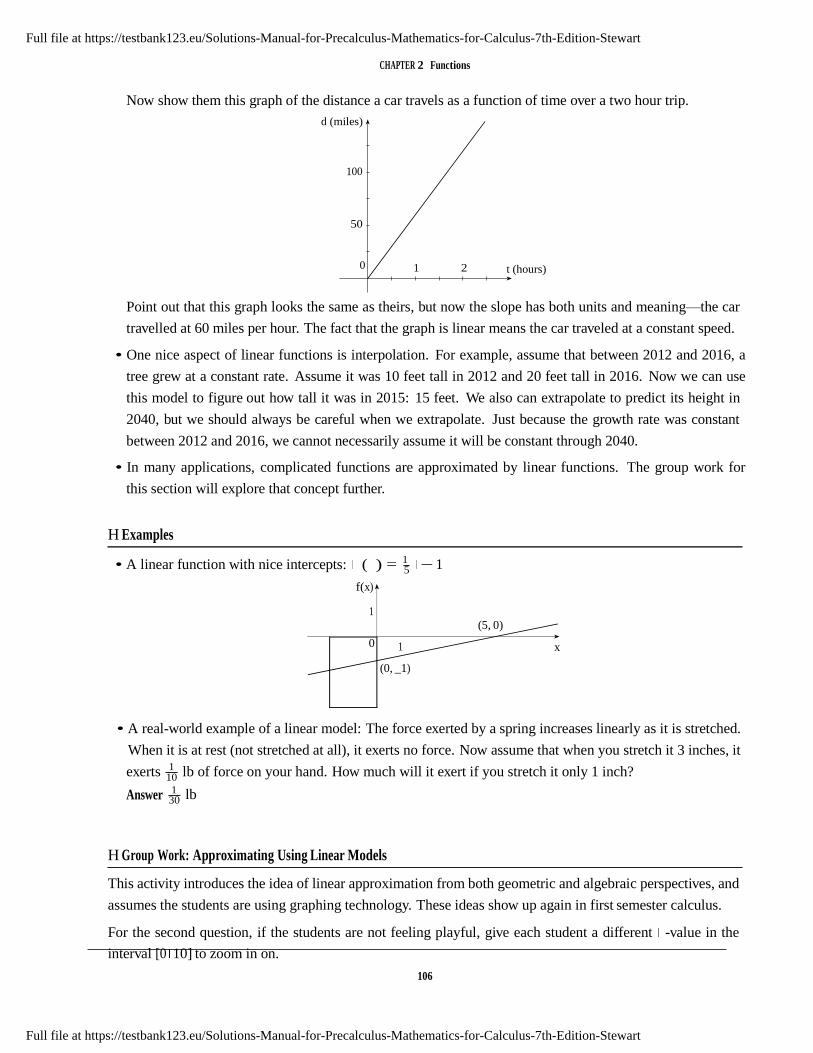
1
(5, 0)
1
(0, _1)
5
10
30
CHAPTER 2 Functions
Now show them this graph of the distance a car travels as a function of time over a two hour trip.
d (miles)
100
50
0 1 2 t (hours)
Point out that this graph looks the same as theirs, but now the slope has both units and meaning—the car
travelled at 60 miles per hour. The fact that the graph is linear means the car traveled at a constant speed.
• One nice aspect of linear functions is interpolation. For example, assume that between 2012 and 2016, a
tree grew at a constant rate. Assume it was 10 feet tall in 2012 and 20 feet tall in 2016. Now we can use
this model to figure out how tall it was in 2015: 15 feet. We also can extrapolate to predict its height in
2040, but we should always be careful when we extrapolate. Just because the growth rate was constant
between 2012 and 2016, we cannot necessarily assume it will be constant through 2040.
• In many applications, complicated functions are approximated by linear functions. The group work for
this section will explore that concept further.
H Examples
• A linear function with nice intercepts: ( ) = 1 − 1
f(x)
0 x
• A real-world example of a linear model: The force exerted by a spring increases linearly as it is stretched.
When it is at rest (not stretched at all), it exerts no force. Now assume that when you stretch it 3 inches, it
exerts 1
Answer 1
lb of force on your hand. How much will it exert if you stretch it only 1 inch?
lb
H Group Work: Approximating Using Linear Models
This activity introduces the idea of linear approximation from both geometric and algebraic perspectives, and
assumes the students are using graphing technology. These ideas show up again in first semester calculus.
For the second question, if the students are not feeling playful, give each student a different -value in the
interval [0 10] to zoom in on.
106
Full file at https://testbank123.eu/Solutions-Manual-for-Precalculus-Mathematics-for-Calculus-7th-Edition-Stewart
Full file at https://testbank123.eu/Solutions-Manual-for-Precalculus-Mathematics-for-Calculus-7th-Edition-Stewart

SECTION 2.5 Linear Functions and Models
Answers:
1.(a) f(x)
10
(b) It looks linear. (c) It looks linear.
5
0
2.(a) f(x)
10
5 10 x
(b) It looks linear. (c) It looks linear.
5
0
3.(a) f(x)
10
8
5 10 x (b) (6 5) = (7 5) = ( )
= 4 11 − 20 31
(c) They are close.
6
0 6.5
7 7.5 x
H Homework Problems
Core Exercises: 3, 9, 14, 17, 21, 29, 35, 42, 46, 52
Sample Assignment: 1, 3, 5, 7, 9, 13, 14, 15, 17, 18, 21, 22, 25, 27, 29, 32, 35, 36, 38, 42, 43, 45, 46, 49, 52
107
Full file at https://testbank123.eu/Solutions-Manual-for-Precalculus-Mathematics-for-Calculus-7th-Edition-Stewart
Full file at https://testbank123.eu/Solutions-Manual-for-Precalculus-Mathematics-for-Calculus-7th-Edition-Stewart

2
2
GROUP WORK, SECTION 2.5
Approximating Using Linear Models
1. Consider the rather nasty function ( ) = 10
−
(a) Sketch this function on the interval [0 10].
f(x)
+ 4√
.
10
5
0 5 10 x
(b) is clearly not a linear function. But notice that between = 8 and = 9 it looks almost linear. Plot
this function on your calculator on the interval [8 9]. Does it look linear?
(c) Now look at your original graph near = 1 . It is clearly curved there. But look what happens when
you plot it on the interval [0 4 0 6]. Does it look linear?
2. Let’s play with a kind of function you may never have seen yet: ( ) = + 2 sin − cos 2 .
(a) Sketch this function on the interval [0 10].
f(x)
10
5
0 5 10 x
(b) Notice how this function is even wigglier than the previous one! But something interesting happens
when you zoom in. Pick any value of and zoom in on it repeatedly. Does it eventually look linear?
108
Full file at https://testbank123.eu/Solutions-Manual-for-Precalculus-Mathematics-for-Calculus-7th-Edition-Stewart
Full file at https://testbank123.eu/Solutions-Manual-for-Precalculus-Mathematics-for-Calculus-7th-Edition-Stewart

Approximating Using Linear Models
3. This is a key idea that is used in many real-world applications. If a function is “smooth” (that is, its graph
has no breaks or sharp corners) then no matter how twisty it is, if you zoom in close enough, it looks linear.
(a) Graph , the function from Part 2, on the interval [6 5 7 5].
f(x)
0 6.5 7 7.5 x
(b) Compute (6 5) and (7 5), and use this information to find the equation of a straight line that
intersects the graph of at = 6 5 and at = 7 5.
(c) Graph and your line on the same axes. Are they close?
f(x)
0 6.5 7 7.5 x
109
Full file at https://testbank123.eu/Solutions-Manual-for-Precalculus-Mathematics-for-Calculus-7th-Edition-Stewart
Full file at https://testbank123.eu/Solutions-Manual-for-Precalculus-Mathematics-for-Calculus-7th-Edition-Stewart
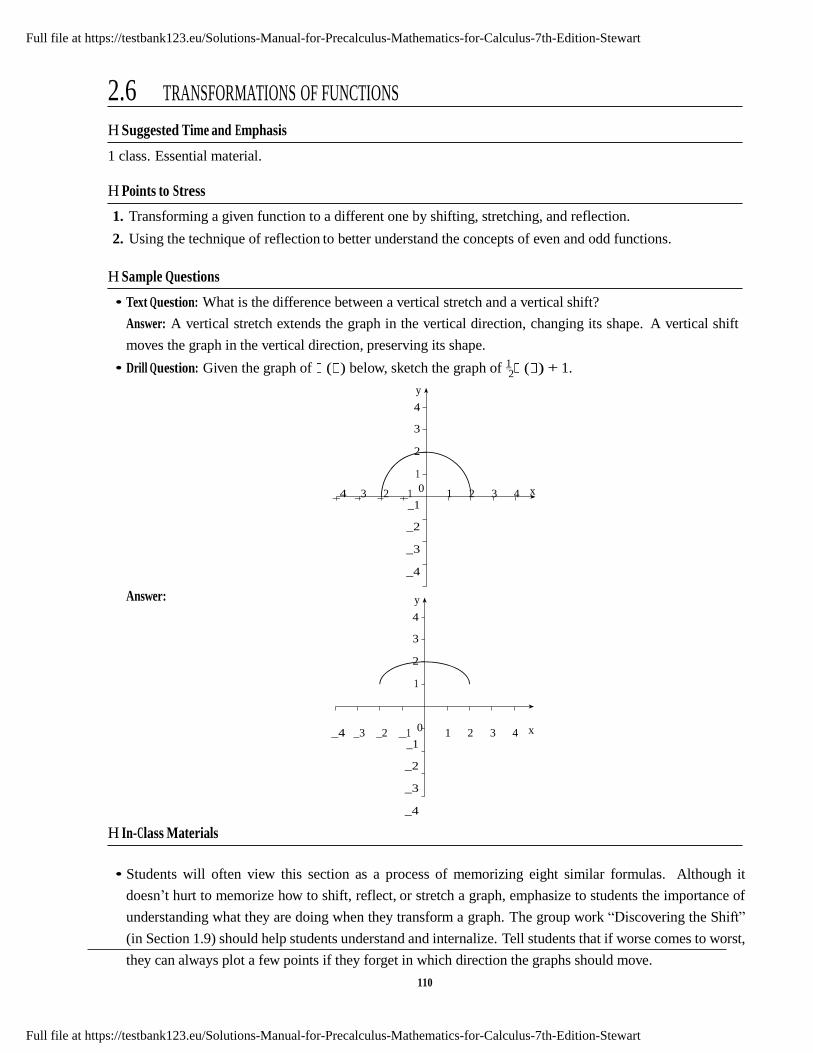
2
2.6 TRANSFORMATIONS OF FUNCTIONS
H Suggested Time and Emphasis
1 class. Essential material.
H Points to Stress
1. Transforming a given function to a different one by shifting, stretching, and reflection.
2. Using the technique of reflection to better understand the concepts of even and odd functions.
H Sample Questions
• Text Question: What is the difference between a vertical stretch and a vertical shift?
Answer: A vertical stretch extends the graph in the vertical direction, changing its shape. A vertical shift
moves the graph in the vertical direction, preserving its shape.
• Drill Question: Given the graph of ( ) below, sketch the graph of 1 ( ) + 1.
y
4
3
2
1
Answer:
_4 _3 _2 _1 0
_1
_2
_3
_4
y
4
3
2
1
1 2 3 4 x
H In-Class Materials
_4 _3 _2 _1 0
_1
_2
_3
_4
1 2 3 4 x
• Students will often view this section as a process of memorizing eight similar formulas. Although it
doesn’t hurt to memorize how to shift, reflect, or stretch a graph, emphasize to students the importance of
understanding what they are doing when they transform a graph. The group work “Discovering the Shift”
(in Section 1.9) should help students understand and internalize. Tell students that if worse comes to worst,
they can always plot a few points if they forget in which direction the graphs should move.
110
Full file at https://testbank123.eu/Solutions-Manual-for-Precalculus-Mathematics-for-Calculus-7th-Edition-Stewart
Full file at https://testbank123.eu/Solutions-Manual-for-Precalculus-Mathematics-for-Calculus-7th-Edition-Stewart

2
SECTION 2.6 Transformations of Functions
• Show the class a function they have not learned about yet, such as ( ) = sin . (If students know about
sin, then show them arctan or − 2
—any function with which they are unfamiliar.) Point out that even
though they don’t know a lot about sin , once they’ve seen the graph, they can graph sin +3, sin ( − 1),
2 sin , − sin , etc.
• Graph ( ) = 2 with the class. Then anticipate Section 3.2by having students graph ( − 2)2 − 3 and
( + 1)2
+ 2, finally working up to ( ) = ( − )2 + . If you point out that any equation of the form
( ) = 2 + + can be written in this so-called standard form, students will have a good start on the
next section in addition to learning this one.
• This is a good time to start discussing parameters. Ask your students to imagine a scientist who knows
that a given function will be shaped like a stretched parabola, but has to do some more measurements to
find out exactly what the stretching factor is. In other words, she can write ( ) = − 2, noting that she
will have to figure out the experimentally. The is not a variable, it is a parameter. Similarly, if we are
going to do a bunch of calculations with the function ( ) = √3 + 2, and then do the same calculations
with √3 + 3,
√3 − , and
q3
− 3
, it is faster and easier to do the set of calculations just once, with the
function ( ) = √3 + , and then fill in the different values for at the end. Again, this letter is called
a parameter. Ask the class how, in the expression ( ) = + 3 , they can tell which is the variable, and
which is the parameter—the answer may encourage them to use careful notation.
H Examples
A distinctive-looking, asymmetric curve that can be stretched, shifted and reflected:
y
20
10
0 1 2 3 4 5 6 7
x
( ) = ¯
2 − 5 + √ ¯ ¯ ¯
H Group Work 1: Label Label Label, I Made It Out of Clay
Some of these transformations are not covered in the book. If the students are urged not to give up, and to
use the process of elimination and testing individual points, they should be able to successfully complete this
activity.
Answers: 1. (d) 2. (a) 3. (f) 4. (e) 5. (i) 6. (j) 7. (b) 8. (c) 9. (g) 10. (h)
111
Full file at https://testbank123.eu/Solutions-Manual-for-Precalculus-Mathematics-for-Calculus-7th-Edition-Stewart
Full file at https://testbank123.eu/Solutions-Manual-for-Precalculus-Mathematics-for-Calculus-7th-Edition-Stewart

CHAPTER 2 Functions
H Group Work 2: Which is the Original?
The second problem has a subtle difficulty: the function is defined for all , so some graphs show much more
of the behavior of ( )than others do.
Answers: 1. 2 ( + 2), 2 ( ), (2 ), ( + 2), ( ) 2. 2 ( ), ( ), ( + 2), (2 ), 2 ( + 2)
H Homework Problems
Core Exercises: 3, 9, 14, 17, 21, 29, 35, 42, 46, 52
Sample Assignment: 1, 3, 5, 7, 9, 13, 14, 15, 17, 18, 21, 22, 25, 27, 29, 32, 35, 36, 38, 42, 43, 45, 46, 49, 52
112
Full file at https://testbank123.eu/Solutions-Manual-for-Precalculus-Mathematics-for-Calculus-7th-Edition-Stewart
Full file at https://testbank123.eu/Solutions-Manual-for-Precalculus-Mathematics-for-Calculus-7th-Edition-Stewart

GROUP WORK 1, SECTION 2.6
Label Label Label, I Made it Out of Clay This is a graph of the function ( ):
y
5
0 2 x
Give each graph below the correct label from the following:
(a) ( + 3) (b) ( − 3) (c) (2 ) (d) 2 ( ) (e) | ( )|
(f) (| |) (g) 2 ( ) − 1 (h) (2 ) + 2 (i) ( ) − (j) 1 ( )
y y y y
5 5 5 5
0 2 x 0 2 x 0 2 x 0 2 x
Graph 1 Graph 2 Graph 3 Graph 4
y y y y
5 5 5 5
0 2 x 0 2 x 0 2 x 0 2 x
Graph 5 Graph 6 Graph 7 Graph 8
y y
5 5
0 2 x 0 2 x
Graph 9 Graph 10
113
Full file at https://testbank123.eu/Solutions-Manual-for-Precalculus-Mathematics-for-Calculus-7th-Edition-Stewart
Full file at https://testbank123.eu/Solutions-Manual-for-Precalculus-Mathematics-for-Calculus-7th-Edition-Stewart

GROUP WORK 2, SECTION 2.6
Which is the Original?
Below are five graphs. One is the graph of a function ( ) and the others include the graphs of 2 ( ), (2 ),
( + 2), and 2 ( + 2). Determine which is the graph of ( ) and match the other functions with their
graphs.
1. y y y
1 1 1
0 1 x 0 1 x 0 1 x
Graph 1 Graph 2 Graph 3
y y
1 1
0 1 x 0 1 x
Graph 4 2.
y y
1 1
Graph 5
y
1
0 2 x 0 2 x 0 2 x
Graph 1 Graph 2 Graph 3
y y
1 1
0 2 x 0 2 x
Graph 4 Graph 5
114
Full file at https://testbank123.eu/Solutions-Manual-for-Precalculus-Mathematics-for-Calculus-7th-Edition-Stewart
Full file at https://testbank123.eu/Solutions-Manual-for-Precalculus-Mathematics-for-Calculus-7th-Edition-Stewart

1
2.7 COMBINING FUNCTIONS
H Suggested Time and Emphasis
2 –1 class. Essential material.
H Points to Stress
1. Addition, subtraction, multiplication, and division of functions.
2. Composition of functions.
3. Finding the domain of a function based on analysis of the domain of its components.
H Sample Questions
• Text Question: The text describes addition, multiplication, division, and composition of functions. Which of
these operations is represented by the following diagram? x
input
Answer: Composition
g g(x) f f(g(x))
output
• Drill Question: Let ( ) = 4 and ( ) = 3 + .
(a) Compute ( ◦ ) ( ).
(b) Compute ( ◦ ) ( ).
Answer: (a) 4 ¡
3 + ¢
= 3 + 4 (b) (4 )3 + 4 = 64 3 + 4
H In-Class Materials
• Do the following problem with the class:
y
y=f(x)
1
0 1 x
From the graph of = ( ) = − 2 + 2 shown above, compute ◦ at = −1, 0, and 1. First do it
graphically, then algebraically.
115
Full file at https://testbank123.eu/Solutions-Manual-for-Precalculus-Mathematics-for-Calculus-7th-Edition-Stewart
Full file at https://testbank123.eu/Solutions-Manual-for-Precalculus-Mathematics-for-Calculus-7th-Edition-Stewart
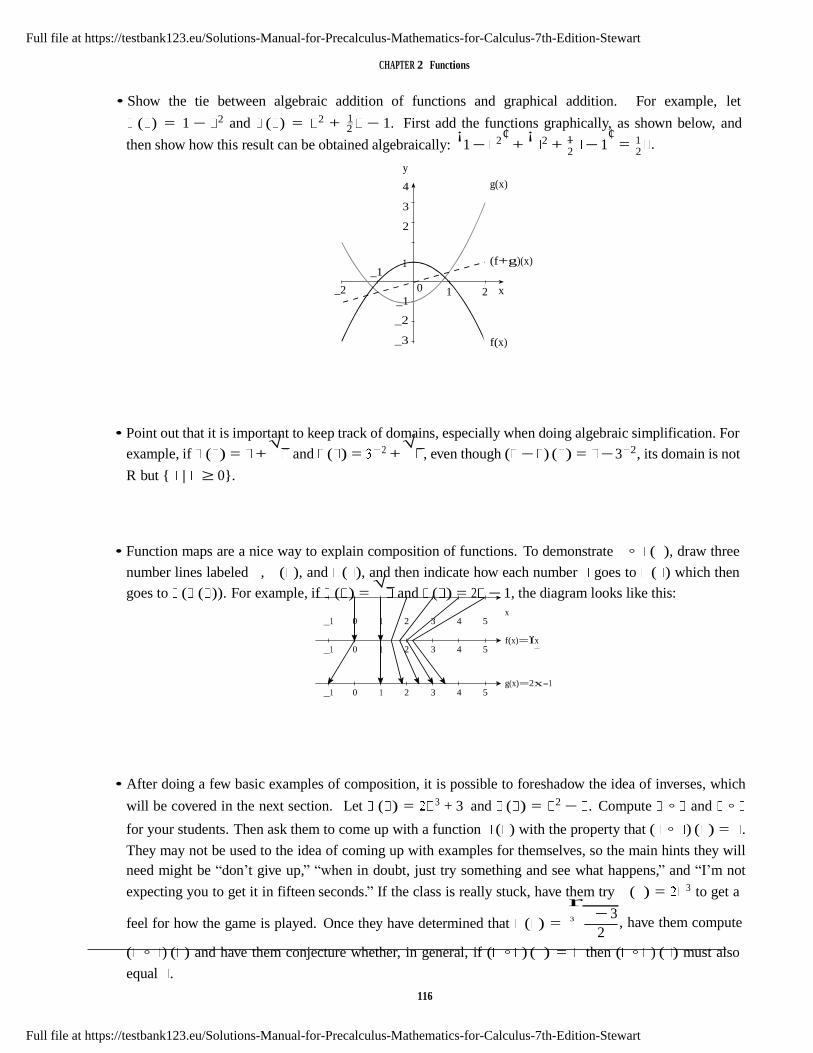
CHAPTER 2 Functions
2
2 2
• Show the tie between algebraic addition of functions and graphical addition. For example, let
( ) = 1 − 2 and ( ) = 2 + 1 − 1. First add the functions graphically, as shown below, and ¡ ¢ ¡ ¢
then show how this result can be obtained algebraically:
y
4
3
2
1 − 2 +
g(x)
2 + 1 − 1 = 1 .
1 _1
_2 0 _1
_2
_3
(f+g)(x)
1 2 x
f(x)
• Point out that it is important to keep track of domains, especially when doing algebraic simplification. For
example, if ( ) = + √
and ( ) = 2 + √
, even though ( − ) ( ) = − 3 2, its domain is not
R but { | ≥ 0}.
• Function maps are a nice way to explain composition of functions. To demonstrate ◦ ( ), draw three
number lines labeled , ( ), and ( ), and then indicate how each number goes to ( ) which then
goes to ( ( )). For example, if ( ) = √
and ( ) = 2 − 1, the diagram looks like this:
x _1 0 1 2 3 4 5
_1 0 1 2 3 4 5
_1 0 1 2 3 4 5
f(x)=Ïx
g(x)=2x-1
• After doing a few basic examples of composition, it is possible to foreshadow the idea of inverses, which
will be covered in the next section. Let ( ) = 3 + 3 and ( ) = 2 − . Compute ◦ and ◦
for your students. Then ask them to come up with a function ( ) with the property that ( ◦ ) ( ) = .
They may not be used to the idea of coming up with examples for themselves, so the main hints they will
need might be “don’t give up,” “when in doubt, just try something and see what happens,” and “I’m not
expecting you to get it in fifteen seconds.” If the class is really stuck, have them try ( ) = 3 to get a r
− 3feel for how the game is played. Once they have determined that ( ) =
3 , have them compute
2
( ◦ ) ( ) and have them conjecture whether, in general, if ( ◦ ) ( ) = then ( ◦ ) ( ) must also
equal .
116
Full file at https://testbank123.eu/Solutions-Manual-for-Precalculus-Mathematics-for-Calculus-7th-Edition-Stewart
Full file at https://testbank123.eu/Solutions-Manual-for-Precalculus-Mathematics-for-Calculus-7th-Edition-Stewart

SECTION 2.7 Combining Functions
H Examples √
Combined functions with graphs: Let ( ) = 2 − 3 + 2 and ( ) = − . y y
2 f 2 f
y
2 f-g f
1 1 1
f+g
_2 _1 0
_1
_2
1 2 3 x
g
_2 _1 0
_1
_2
1 2 3 x
g
_2 _1 0
_1
_2
1 2 3 x
g
_3 _3 _3
y y y
2 f 2
1 1
_1 _1
g
fg
_3 _3
f
f/g
g
5
4
3
2
1
_2 _1 0
_1
_2
f ¥ g
f
1 2 3 x
g
y y
2 f 2 f
1
_2 _1 0
_1
_2
1 2 3 x
g ¥ f
g
1
g ¥ g
_2 _1 0
_1
_2
1 2 3 x
g
_3 _3
H Group Work 1: Transformation of Plane Figures
This tries to remove the composition idea from the numerical context, and introduces the notion of symmetry
groups. It is a longer activity than it seems, and can lead to an interesting class discussion of this topic.
Answers:µ 
1. (a)
µ 
= (b)
= (c)
µ µ ¶¶
= (d)
µ µ ¶¶
=
µ 
2. This is false. For example, ( ◦ )
µ 
= , but ( ◦ ) = .
3. It is true: reversing something thrice in a mirror gives the same result as reversing it once.
117
Full file at https://testbank123.eu/Solutions-Manual-for-Precalculus-Mathematics-for-Calculus-7th-Edition-Stewart
Full file at https://testbank123.eu/Solutions-Manual-for-Precalculus-Mathematics-for-Calculus-7th-Edition-Stewart

CHAPTER 2 Functions
GROUP WORK 26, SECTION 2.7
+
even even even
odd even odd
even odd odd
odd odd even
·
even even even
odd even even
even odd even
odd odd odd
+ ◦ ◦
even even even even even even
even odd neither odd even even
odd even neither odd even even
odd odd odd even odd odd
neither neither unknown unknown unknown unknown
4. It rotates the shape 270◦ clockwise or, equivalently, 90◦ counterclockwise.
H Group Work 2: Odds and Evens
This is an extension of Exercise 102 in the text. Students may find the third problem difficult to start. You may
want to give selected table entries on the board first, before handing the activity out, to make sure students
understand what they are trying to do.
Answers:
1. 2.
3.
H Group Work 3: It’s More Fun to Compute
Each group gets one copy of the graph. During each round, one representative from each group stands,
and one of the questions below is asked. The representatives write their answer down, and all display their
answers at the same time. Each representative has the choice of consulting with their group or not. A correct
solo answer is worth two points, and a correct answer after a consult is worth one point.
1. ( ◦ ) (5) 5. ( ◦ ) (5) 9. ( ◦ ) (1)
2. ( ◦ ) (5) 6. ( ◦ ) (−3) 10. ( ◦ ◦ ) (4)
3. ( ◦ ) (0) 7. ( ◦ ) (−1) 11. ( ◦ ◦ ) (4)
4. ( ◦ ) (5) 8. ( ◦ ) (1) 12. ( ◦ ◦ ) (4)
Answers: 1. 0 2. 0 3. 1 H Homework Problems
4. 5 5. 1 6. 1 7. 1 8. 0
9. 2 10. 1 11. 1 12. 1
Core Exercises: 4, 10, 15, 20, 26, 34, 38, 49, 57, 64, 71, 75, 79, 86, 92, 104
Sample Assignment: 2, 4, 6, 7, 10, 13, 15, 20, 22, 24, 26, 27, 29, 34, 36, 38, 45, 49, 52, 55, 57, 61, 64, 67, 69,
71, 73, 75, 77, 79, 82, 85, 86, 92, 93, 95, 98, 104
118 Full file at https://testbank123.eu/Solutions-Manual-for-Precalculus-Mathematics-for-Calculus-7th-Edition-Stewart
Full file at https://testbank123.eu/Solutions-Manual-for-Precalculus-Mathematics-for-Calculus-7th-Edition-Stewart

CHAPTER 2 Functions
GROUP WORK 27, SECTION 2.7
Transformation of Plane Figures
So far, when we have been talking about functions, we have been assuming that their domains and ranges
have been sets of numbers. This is not necessarily the case. For example, look at this figure:
Let’s let our domain be all the different ways we can move this figure around, including flipping it over:
½ ¾
= µ 
Now let be the function that rotates the shape 90◦ clockwise:
= . Let be the function that
µ 
flips the shape over a vertical line drawn through the center: =
1. Find the following:µ 
(a)
µ 
(b)
µ
(c)
µ ¶¶
(d)
µ µ ¶¶
2. Is it true that ◦ = ◦ ? Why or why not?
3. Is it true that ◦ ◦ = ? Why or why not?
4. Write, in words, what the function ◦ ◦ does to a shape.
119
Full file at https://testbank123.eu/Solutions-Manual-for-Precalculus-Mathematics-for-Calculus-7th-Edition-Stewart
Full file at https://testbank123.eu/Solutions-Manual-for-Precalculus-Mathematics-for-Calculus-7th-Edition-Stewart

GROUP WORK 2, SECTION 2.7
Odds and Evens
1. Let be an odd number, and be an even number. Fill in the following table (the first row is done for
you).
+
even even even
odd even
even odd
odd odd
2. We can also multiply numbers together. Fill in the corresponding multiplication table:
·
even even
odd even
even odd
odd odd
3. Now we let and be (nonzero) functions, not numbers. We are going to think about what happens when
we combine these functions. When you fill in the table, you can write “unknown” if the result can be odd
or even, depending on the functions. You can solve this problem by drawing some pictures, or by using
the definition of odd and even functions.
+ ◦ ◦
even even
even odd
odd even
odd odd
neither neither
120
Full file at https://testbank123.eu/Solutions-Manual-for-Precalculus-Mathematics-for-Calculus-7th-Edition-Stewart
Full file at https://testbank123.eu/Solutions-Manual-for-Precalculus-Mathematics-for-Calculus-7th-Edition-Stewart
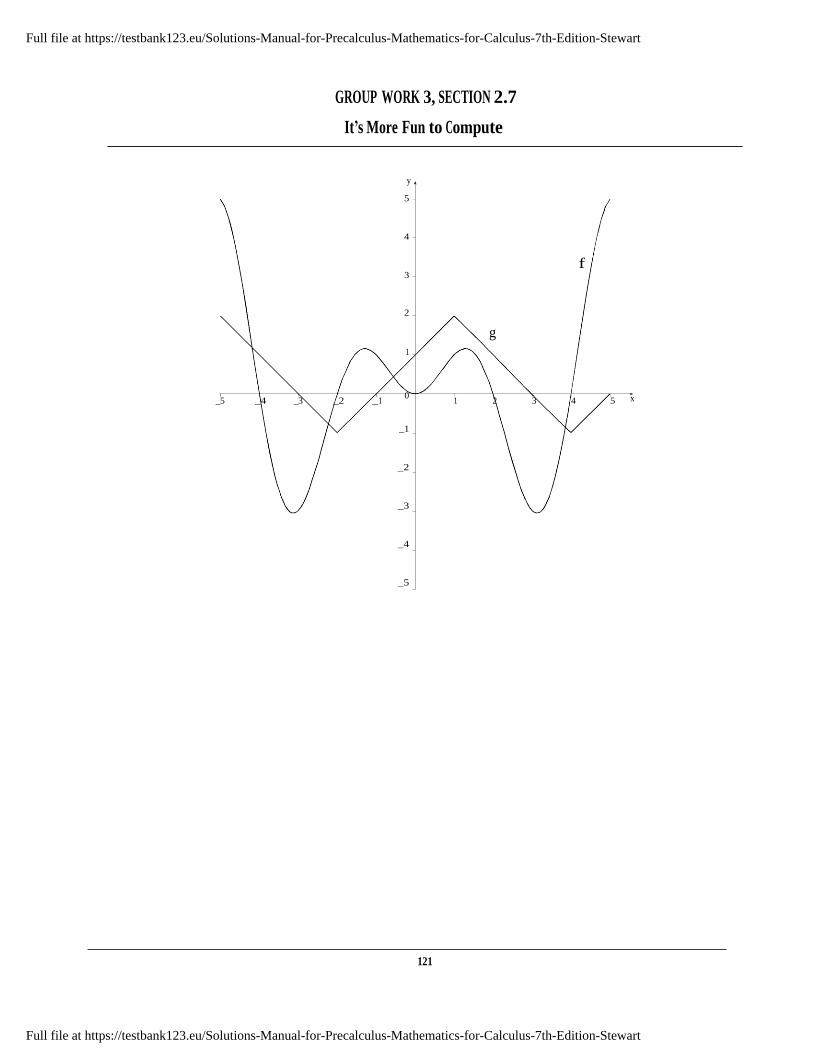
GROUP WORK 3, SECTION 2.7
x
It’s More Fun to Compute
y
5
4
f 3
2
g
1
0
_5 _4 _3 _2 _1 1 2 3 4 5
_1
_2
_3
_4
_5
121
Full file at https://testbank123.eu/Solutions-Manual-for-Precalculus-Mathematics-for-Calculus-7th-Edition-Stewart
Full file at https://testbank123.eu/Solutions-Manual-for-Precalculus-Mathematics-for-Calculus-7th-Edition-Stewart

•
2.8 ONE-TO-ONE FUNCTIONS AND THEIR INVERSES
H Suggested Time and Emphasis
1–2 classes. Essential material.
H Points to Stress
1. One-to-one functions: their definition and the Horizontal Line Test.
2. Algebraic and geometric properties of inverse functions.
3. Finding inverse functions.
H Sample Questions
• Text Question: The function is graphed below. Sketch −1, the inverse function of .
y
2 f
1
_3 _2 _1 0
_1
1 2 x
_2
_3
Answer:
y
2
1
_3 _2 _1
f
f Ð!
0 1 2 x
_1
_2
_3
• Drill Question: If (−2) = 4 (−1) = 3 (0) = 2 (1) = 1 and (2) = 3, what is −1 (2)?
Answer: 0
H In-Class Materials
1 Make sure students understand the notation: −1 is not the same thing as .
• Starting with ( ) = √3 − 4, compute −1 (−2) and −1 (0). Then use algebra to find a formula for
−1 ( ). Have the class try to repeat the process with ( ) = 3 + − 2. Note that facts such as −1 (−2) = 0, −1 (0) = 1, and and −1(8) = 2 can be found by looking at a table of values for ( ) but
that algebra fails to give us a general formula for −1 ( ). Finally, draw graphs of , −1, , and −1.
122
Full file at https://testbank123.eu/Solutions-Manual-for-Precalculus-Mathematics-for-Calculus-7th-Edition-Stewart
Full file at https://testbank123.eu/Solutions-Manual-for-Precalculus-Mathematics-for-Calculus-7th-Edition-Stewart

SECTION 2.8 One-to-One Functions and Their Inverses
−1 ( )
3 4 2 5 7 8
1 2 3 4
• Pose the question: If is always increasing, is −1 always increasing? Give students time to try prove
their answer.
Answer: This is true. Proofs may involve diagrams and reflections about = , or you may try to get them
to be more rigorous. This is an excellent opportunity to discuss concavity, noting that if is concave up
and increasing, then −1 is concave down and increasing.
• Point out that the idea of “reversing input and output” permeates the idea of inverse functions, in all four
representations of “function”. When finding inverse functions algebraically, we explicitly reverse and
. When drawing the inverse function of a graph, by reflecting across the line = we are reversing the
- and -axes. If ( ) is the cost (in dollars) to make fruit roll-ups, then −1 ( ) is the number of fruit
roll-ups that could be made for dollars—again reversing the input and the output. Finally, show the class
how to find the inverse of a function given a numeric data table, and note that again the inputs and outputs
are reversed.
( )
1 2 3 4
3 4 2 5 7 8
• Make sure to discuss units carefully: when comparing = ( ) to = −1 ( ), the units of and trade
places.
H Examples
• The graph of a complicated function and its inverse:
y
2
c Ð!(x)
1 c(x)
_2 _1 1 2 x
_1
_2
123
Full file at https://testbank123.eu/Solutions-Manual-for-Precalculus-Mathematics-for-Calculus-7th-Edition-Stewart
Full file at https://testbank123.eu/Solutions-Manual-for-Precalculus-Mathematics-for-Calculus-7th-Edition-Stewart
CHAPTER 2 Functions
H Group Work 1: Inverse Functions: Domains and Ranges
While discussing the domains and ranges of inverse functions, this exercise foreshadows later excursions into
the maximum and minimum values of functions.
If a group finishes early, ask them this question:
“Now consider the graph of ( ) = √
2 − 3 + 2. What are the domain and range of ( )? Try to figure out
the domain and range of −1 ( ) by looking at the graph of . In general, what information do you need to
be able to compute the domain and range of −1 ( ) from the graph of a function ?”
Answers:
1. It is one-to-one, because the problem says it climbs steadily.
2. −1 is the time in minutes at which the plane achieves a given altitude.
3. Reverse the data columns in the given table to get the table for the inverse function. The domain and range
of are 0 ≤ ≤ 30 and 0 ≤ ≤ 29,000, so the domain and range of −1 are 0 ≤ ≤ 29,000 and
0 ≤ −1 ≤ 30.
4. You can expect to turn on your computer after about 8 5 minutes.
5. is no longer 1-1, because heights are now achieved more than once.
Bonus The domain of −1 is the set of all -values on the graph of , and the range of −1 is the set of all
-values on the graph of .
H Group Work 2: The Column of Liquid
If the students need a hint, you can mention that the liquid in the mystery device was mercury.
Answers 1. The liquid is 1 cm high when the temperature is 32 ◦F. 2. The liquid is 2 cm high when the
temperature is 212 ◦F 3. The inverse function takes a height in cm, and gives the temperature. So it is a
device for measuring temperature. 4. A thermometer
H Group Work 3: Functions in the Classroom Revisited
This activity starts the same as “Functions in the Classroom” from Section 2.2. At this point, students have
learned about one-to-one functions, and they are able to explore this activity in more depth.
Answers
Chairs: Function, one-to-one, bijection (if all chairs are occupied). If one-to-one, the inverse assigns a chair to
a person.
Eye color: Function, not one-to-one
Mom & Dad’s birthplace: Not a function; mom and dad could have been born in different places
Molecules: Function, one-to-one (with nearly 100% probability); inverse assigns a number of molecules to the
appropriate student.
Spleens: Function, one-to-one, bijection. Inverse assigns each spleen to its owner.
Pencils: Not a function; some people may have more than one or (horrors!) none.
Social Security Number: Function, one-to-one; inverse assigns each number to its owner.
February birthday: Not a function; not defined for someone born on February 29.
Birthday: Function, perhaps one-to-one. If one-to-one, the inverse assigns a day to a person.
124
Full file at https://testbank123.eu/Solutions-Manual-for-Precalculus-Mathematics-for-Calculus-7th-Edition-Stewart
Full file at https://testbank123.eu/Solutions-Manual-for-Precalculus-Mathematics-for-Calculus-7th-Edition-Stewart

SECTION 2.8 One-to-One Functions and Their Inverses
GROUP WORK 1, SECTION 2.8
Cars: Not a function; some have none, some have more than one.
Cash: Function, perhaps one-to-one. If one-to-one, the inverse assigns an amount of money to a person.
Middle names: Not a function; some have none, some have more than one.
Identity: Function, one-to-one, bijection. Inverse is the same as the function.
Instructor: Function, not one-to-one.
H Homework Problems
Core Exercises: 3, 8, 14, 20, 24, 35, 48, 54, 57, 64, 67, 79, 71
Sample Assignment: 1, 3, 8, 10, 14, 15, 18, 20, 22, 24, 25, 29, 31, 35, 38, 41, 46, 47, 48, 54, 56, 57, 60, 64, 66,
67, 70, 71, 73, 77, 79, 81, 82
125 Full file at https://testbank123.eu/Solutions-Manual-for-Precalculus-Mathematics-for-Calculus-7th-Edition-Stewart
Full file at https://testbank123.eu/Solutions-Manual-for-Precalculus-Mathematics-for-Calculus-7th-Edition-Stewart

SECTION 2.8 One-to-One Functions and Their Inverses
GROUP WORK 1, SECTION 2.8
Inverse Functions: Domains and Ranges
Let ( ) be the altitude in feet of a plane that climbs steadily from takeoff until it reaches its cruising altitude
after 30 minutes. We don’t have a formula for , but extensive research has given us the following table of
values:
( )
0 1
0 5
1
3
7
10
20
25
30
50
150
500
2000
8000
12,000
21,000
27,000
29,000
1. Is ( ) a one-to-one function? How do you know?
2. What does the function −1 measure in real terms? Your answer should be descriptive, similar to the way
( ) was described above.
126
Full file at https://testbank123.eu/Solutions-Manual-for-Precalculus-Mathematics-for-Calculus-7th-Edition-Stewart
Full file at https://testbank123.eu/Solutions-Manual-for-Precalculus-Mathematics-for-Calculus-7th-Edition-Stewart

Inverse Functions: Domains and Ranges
GROUP WORK 2, SECTION 2.8
3. We are interested in computing values of −1. Fill in the following table for as many values of as you
can. What quantity does represent?
−1 ( )
What are the domain and range of ? What are the domain and range of −1?
4. You are allowed to turn on electronic equipment after the plane has reached 10,000 feet. Approximately
when can you expect to turn on your laptop computer after taking off?
5. Suppose we consider ( ) from the time of takeoff to the time of touchdown. Is ( ) still one-to-one?
127 Full file at https://testbank123.eu/Solutions-Manual-for-Precalculus-Mathematics-for-Calculus-7th-Edition-Stewart
Full file at https://testbank123.eu/Solutions-Manual-for-Precalculus-Mathematics-for-Calculus-7th-Edition-Stewart
Inverse Functions: Domains and Ranges
GROUP WORK 2, SECTION 2.8
The Column of Liquid
It is a fact that if you take a tube and fill it partway with liquid, the liquid will rise and fall based on the
temperature. Assume that we have a tube of liquid, and we have a function ( ), where is the height
of the liquid in cm at temperature in ◦F.
1. It is true that (32) = 1. What does that mean in physical terms?
2. It is true that (212) = 10. What does that mean in physical terms?
3. Describe the inverse function −1. What are its inputs? What are its outputs? What does it measure?
4. Hospitals used to use a device that measured the function −1. Some people used to have such a device in
their homes. What is the name of this device?
128
Full file at https://testbank123.eu/Solutions-Manual-for-Precalculus-Mathematics-for-Calculus-7th-Edition-Stewart
Full file at https://testbank123.eu/Solutions-Manual-for-Precalculus-Mathematics-for-Calculus-7th-Edition-Stewart

GROUP WORK 3, SECTION 2.8
Functions in the Classroom Revisited
Which of the following are functions? Of the ones that are functions, which are one-to-one functions? De-
scribe what the inverses tell you.
Domain All the people in your classroom
All the people in your classroom
Function Values
Chairs
The set {blue, brown, green, hazel}
Function
(person) = his or her chair
(person) = his or her eye color
All the people in your classroom Cities (person) = birthplace of their mom and dad
All the people in your classroom
R, the real numbers
(person) = number of molecules in their body
All the people in your classroom Spleens (person) = his or her own spleen
All the people in your classroom
Pencils
(person) = his or her pencil
All the people in the United States
Integers from 0–999999999
(person) = his or her Social Security number
All the living people born in February
Days in February, 2019
(person) = his or her birthday in February 2019
All the people in your classroom
Days of the year
(person) = his or her birthday
All the people in your classroom
Cars
(person) = his or her car
All the people in your classroom
R, the real numbers
(person) = how much cash he or she has
All the people in your college Names (person) = his or her middle name
All the people in your classroom
People
(person) = himself or herself
All the people in your classroom
People
(person) = his or her instructor
129
Full file at https://testbank123.eu/Solutions-Manual-for-Precalculus-Mathematics-for-Calculus-7th-Edition-Stewart
Full file at https://testbank123.eu/Solutions-Manual-for-Precalculus-Mathematics-for-Calculus-7th-Edition-Stewart

Full file at https://testbank123.eu/Solutions-Manual-for-Precalculus-Mathematics-for-Calculus-7th-Edition-Stewart
Full file at https://testbank123.eu/Solutions-Manual-for-Precalculus-Mathematics-for-Calculus-7th-Edition-Stewart

⎝ ⎠
⎝ ⎠
FOCUS ON PROBLEM SOLVING 2 SOLUTIONS
1. The final digit of 947362
is determined by 7362
. Looking at the first few powers of 7,
we have 71 = 7, 7
2 = 49, 73 = 343, 7
4 = 2401, and
75 = 16807, 7
6 = 117649, 77 = 823543, 7
8 = 5764801 , and so on. The last digit seems to
follow a pattern that repeats every fourth power: 7, 9, 3,1, 7, 9, 3,1,... We divide 362 by 4
and get a remainder 2, which corresponds to 9 (the second term in the pattern). So the
final digit of 947362
is the number 9.
2. We are given f ( x) = x2 and f ( x) = f ( f ( x)) , for n = 0,1, 2, ... We look at the first0
three terms to find a pattern. 2
n+1 0 n
f0 ( x) = x ,
2 2 2 4
f1 ( x) = f0+1 ( x) = f0 ( f0 ( x)) = f0 ( x ) = ( x ) = x
4 4 2 8f2 ( x) = f1+1 ( x) = f0 ( f1 ( x)) = f0 ( x ) = ( x ) = x
8 8 2 16f3 ( x) = f2+1
( x) = f0 ( f2 ( x)) = f0 ( x ) = ( x ) = x
2n+1
We can see that the formula is fn ( x) = x , for n = 0,1, 2, ...
3. We have
f ( x) =
1
and f
( x) = f ( f
( x)) , for n = 0,1, 2,... We look at the first
0 2 − x
n+1 0 n
three terms to find a pattern.
f ( x) = 1
, 0 2 − x
f ( x) = f
( x) = f
( f ( x)) = f ⎛ 1 ⎞
= 1
1 0+1 0 0 0 ⎜ 2 − x
⎟ 2 −
1 2 − x
= 1
⋅ 2 − x
= 2 − x
= 2 − x
2 − 1 2 − x 2 − x
2(2 − x) −1 3 − 2x
f ( x) = f
( x) = f
( f ( x)) = f ⎛ 2 − x ⎞
= 1
2 1+1 0 1 0 ⎜ 3 − 2 x
⎟ 2 −
2 − x 3 − 2x
= 1
⋅ 3 − 2 x
= 3 − 2 x
= 3 − 2 x
2 − 2 − x
3 − 2x
3 − 2 x
Full file at https://testbank123.eu/Solutions-Manual-for-Precalculus-Mathematics-for-Calculus-7th-Edition-Stewart
Full file at https://testbank123.eu/Solutions-Manual-for-Precalculus-Mathematics-for-Calculus-7th-Edition-Stewart

2(3 − 2 x) − (2 − x) 4 − 3x
5
Full file at https://testbank123.eu/Solutions-Manual-for-Precalculus-Mathematics-for-Calculus-7th-Edition-Stewart
Full file at https://testbank123.eu/Solutions-Manual-for-Precalculus-Mathematics-for-Calculus-7th-Edition-Stewart

⎝ ⎠
f ( x) = f
( x) = f ( f
( x)) = f ⎛ 3 − 2 x ⎞
= 1
3 2+1 0 2 0 ⎜ 4 − 3x
⎟ 2 −
3 − 2 x 4 − 3x
= 1
⋅ 4 − 3x
= 4 − 3x
= 4 − 3x
2 − 3 − 2 x
4 − 3x
4 − 3x 2(4 − 3x) − (3 − 2 x) 5 − 4 x
We can see that the formula is fn ( x) = (n + 1) − nx
, for n = 0,1, 2, ... and hence (n + 2) − (n + 1) x
f (3) = 101 −100(3)
= −199
= 199
.100
102 −101(3) −201 201
4. Let us see what happens when we square similar numbers with fewer 9’s.
392 = 1521, 399
2 = 159201, 39992 = 15992001, 39999
2 = 1599920001
We observe that the pattern is the square begins with 15, then there is a number of 9’s
with the number being one less than the original number of 9’s, then there is a 2, then
there is a number of 0’s with the number being the same as the number of 9’s, and then
ends with a 1. Note that 3, 999, 999, 999, 999 contains 12 nines, so according to the
pattern this number squared begins with 15, then has eleven 9’s, then has a 2, then has
eleven 0’s, and ends with one:
39999999999992 = 15, 999, 999, 999, 992, 000, 000, 000, 001
This can be verified algebraically as follows:
3, 999, 999, 999, 9992 = (4, 000, 000, 000, 000 −1)
2
= (4, 000, 000, 000, 000)2
− 2 (4, 000, 000, 000, 000) + 1
= 16, 000, 000, 000, 000, 000, 000, 000, 000 − 8, 000, 000, 000, 000 + 1
= 15, 999, 999, 999, 992, 000, 000, 000, 001
5. To find the domain of the function
f ( x) = 1 −
2 − 3 − x
, we use the fact that the
square root function is only defined for positive real values, including 0.
1 − 2 − 3 − x ≥ 0 ⇔ 0 ≤ 2 − 3 − x ≤ 1 ⇔ 0 ≤ 2 − 3 − x ≤ 1
( we can square all the terms in the inequality because the squaring function is
increasing for positive real values)
By similar reasoning,
0 ≤ 2 − 3 − x ≤ 1 ⇔ −2 ≤ − 3 − x ≤ −1
⇔ 1 ≤ 3 − x ≤ 2 ⇔ 1 ≤ 3 − x ≤ 22
Again by similar reasoning,
Full file at https://testbank123.eu/Solutions-Manual-for-Precalculus-Mathematics-for-Calculus-7th-Edition-Stewart
Full file at https://testbank123.eu/Solutions-Manual-for-Precalculus-Mathematics-for-Calculus-7th-Edition-Stewart

1 ≤ 3 − x ≤ 4 ⇔ −2 ≤ − x ≤ 1 ⇔ −1 ≤ x ≤ 2 .
So the domain of f is [−1, 2] .
6
Full file at https://testbank123.eu/Solutions-Manual-for-Precalculus-Mathematics-for-Calculus-7th-Edition-Stewart
Full file at https://testbank123.eu/Solutions-Manual-for-Precalculus-Mathematics-for-Calculus-7th-Edition-Stewart

6. We have the following equivalence if x ≥ 0 :
f ( x) = x2 − 4 x + 3 = x2 − 4x + 3 = ( x −1)( x − 3)
We find the sign of ( x −1)( x − 3) on the following intervals:
Case (i): 0 ≤ x ≤ 1 ⇒ ( x −1)( x − 3) ≥ 0 ⇔
Case (ii): 1 ≤ x ≤ 3 ⇒ ( x −1)( x − 3) ≤ 0 ⇔
f ( x) =
f ( x) =
x2 − 4x + 3 = x2 − 4x + 3
x2 − 4x + 3 = −( x2 − 4 x + 3)
Case (iii): 3 ≤ x ≤ ∞ ⇒ ( x −1)( x − 3) ≥ 0 ⇔
f ( x) =
x2 − 4 x + 3 = x2 − 4x + 3
We now can sketch the graph of f for x ≥ 0 , and then use the fact that f is an even
function to reflect the graph about the y-axis to obtain the graph of f for x < 0 .
7. Note that f ( x) = x2 −1 − x2 − 4 = ( x −1)( x + 1) − ( x − 2)( x + 2) we consider the
following intervals:Case (i) x ≤ −2 ⇒ ( x −1)( x + 1) ≥ 0 and ( x − 2)( x + 2) ≥ 0
⇒ f ( x) = ( x2 −1) − ( x2 − 4) = 3
Case (ii): −2 ≤ x ≤ −1 ⇒ ( x −1)( x + 1) ≥ 0 and ( x − 2)( x + 2) ≤ 0
⇒ f ( x) = ( x2 −1) + ( x2 − 4) = 2 x2 + 5
Case (iii) −1 ≤ x ≤ 1 ⇒ ( x −1)( x + 1) ≤ 0 and ( x − 2)( x + 2) ≤ 0
⇒ f ( x) = − ( x2 −1) + ( x2 − 4) = −3
Case (iv): 1 ≤ x ≤ 2 ⇒ ( x −1)( x + 1) ≥ 0 and ( x − 2)( x + 2) ≤ 0
⇒ f ( x) = ( x2 −1) + ( x2 − 4) = 2 x2 + 5
Case (v) x ≥ 2 ⇒ ( x −1)( x + 1) ≥ 0 and ( x − 2)( x + 2) ≥ 0
Full file at https://testbank123.eu/Solutions-Manual-for-Precalculus-Mathematics-for-Calculus-7th-Edition-Stewart
Full file at https://testbank123.eu/Solutions-Manual-for-Precalculus-Mathematics-for-Calculus-7th-Edition-Stewart

⇒ f ( x) = ( x2 −1) − ( x2 − 4) = 3
7
Full file at https://testbank123.eu/Solutions-Manual-for-Precalculus-Mathematics-for-Calculus-7th-Edition-Stewart
Full file at https://testbank123.eu/Solutions-Manual-for-Precalculus-Mathematics-for-Calculus-7th-Edition-Stewart

We now can sketch the graph of f for x ≥ 0 , and then use the fact that f is an even
function to reflect the graph about the y-axis to obtain the graph of f for x < 0 .
8. (a) Notice that axb = 0 for 0 ≤ x < 1 , axb = 1 for 1 ≤ x < 2 , axb = 2 for 2 ≤ x < 3 ,
axb = −1 for −1 ≤ x < 0 , and so on. We use these observations to sketch a graph
of the greatest integer function.
(b) Notice that x − a xb = x for 0 ≤ x < 1 , x − a xb = x −1 for 1 ≤ x < 2 ,
x − a xb = x − 2 for 2 ≤ x < 3 , x − a xb = − x for −1 ≤ x < 0 , and so on.
Full file at https://testbank123.eu/Solutions-Manual-for-Precalculus-Mathematics-for-Calculus-7th-Edition-Stewart
Full file at https://testbank123.eu/Solutions-Manual-for-Precalculus-Mathematics-for-Calculus-7th-Edition-Stewart

8
Full file at https://testbank123.eu/Solutions-Manual-for-Precalculus-Mathematics-for-Calculus-7th-Edition-Stewart
Full file at https://testbank123.eu/Solutions-Manual-for-Precalculus-Mathematics-for-Calculus-7th-Edition-Stewart

We use these observations to sketch a graph of f ( x) = x − a xb .
9. We consider the function axb2
+ a yb2
= 1 and look at the four cases.
Case (i): axb = 0 and a y b = 1 ⇒ 0 ≤ x < 1 and 1 ≤ y < 2
Case (ii): axb = 1 and a y b = 0 ⇒ 1 ≤ x < 2 and 0 ≤ y < 1
Case (iii): axb = 0 and a yb = −1 ⇒ 0 ≤ x < 1 and −1 ≤ y < 0
Case (iv): axb = −1 and a y b = 0 ⇒ 0 ≤ x < −1 and 0 ≤ y < 1
We use these observations to sketch a graph.
Full file at https://testbank123.eu/Solutions-Manual-for-Precalculus-Mathematics-for-Calculus-7th-Edition-Stewart
Full file at https://testbank123.eu/Solutions-Manual-for-Precalculus-Mathematics-for-Calculus-7th-Edition-Stewart

9
Full file at https://testbank123.eu/Solutions-Manual-for-Precalculus-Mathematics-for-Calculus-7th-Edition-Stewart
Full file at https://testbank123.eu/Solutions-Manual-for-Precalculus-Mathematics-for-Calculus-7th-Edition-Stewart
Range Number Digits Total Digits
[1, 9]
[10, 99] [100,
999] [1000,
9999] [10000,
99999]
9
90
900
9000
90,000
1
2
3
4
5
9
189
2889
38,889
488,889
10.
100th
position: First we note that the last 1-digit number is in position 9 and that
100 − 9 = 91 positions will be filled by 2-digit numbers, and 45 2-digit numbers will
fill 90 positions, so the number in the 100th
position is the first digit of the number
10 + 45 = 55 . So the number in the 100th
position is 5.
1000th
position: First we note that the last 2-digit number is in position 189 and that
1000 −189 = 811 positions will be filled by 3-digit numbers, and 270 3-digit numbers
will fill 810 positions, so the number in the 1000th
position is the first digit of the
number 100 + 270 = 370 . So the number in the 1000th
position is 3.
10,000th
position: First we note that the last 3-digit number is in position 2889 and that
10, 000 − 2889 = 7111 positions will be filled by 4-digit numbers, and 1777 4-digit
numbers will fill 7108 positions, so the number in the 10,000th
position is the third
digit of the number 10, 000 + 1777 = 11, 777 . So the number in the 10,000th
position is
7.
300,000
th position: First we note that the last 4-digit number is in position 38,889 and
that 300, 000 − 38, 889 = 261,111 positions will be filled by 5-digit numbers, and
52,222 3-digit numbers will fill 261,110 positions, so the number in the 300,000th
position is the first digit of the number 10, 000 + 52, 222 = 62, 222 . So the number in
the 300,000th
position is 6.
11. Let h1 be the height of the pyramid whose square base length is a. Then h1 − h is the
height of the pyramid whose square base length is b. Thus the volume of the truncated
pyramid is V = 1
h a2 −
1 (h − h)b
2 = 1
h a2 −
1 h b
2 + 1
hb2 =
1 h (a
2 − b2 ) + 1
hb2 .
3 1
3 1 3
1 3
1 3 3
1 3
Next we must find a relationship between h1 and the other variables. Using geometry,
the ratio of the height to the base of the two pyramids must be the same. Thus
h1 h1 − h ah = ⇔ bh1 = ah1 − ah ⇔ h1 (a − b) = ah ⇔ h1 = . Substituting for h1 we
a b a − b
have V = 1 ah
(a2 − b2 ) + 1
hb2 = 1
ah (a + b ) + 1
hb2 = 1
h (a2 + ab + b2 ) .3 a − b 3 3 3 3
Full file at https://testbank123.eu/Solutions-Manual-for-Precalculus-Mathematics-for-Calculus-7th-Edition-Stewart
Full file at https://testbank123.eu/Solutions-Manual-for-Precalculus-Mathematics-for-Calculus-7th-Edition-Stewart

10
Full file at https://testbank123.eu/Solutions-Manual-for-Precalculus-Mathematics-for-Calculus-7th-Edition-Stewart
Full file at https://testbank123.eu/Solutions-Manual-for-Precalculus-Mathematics-for-Calculus-7th-Edition-Stewart

y
1
1 x
Cumulative Review Test: Chapters 2, 3, and 4 1
CUMULATIVE REVIEW TEST: CHAPTERS 2, 3, and 4
1. f x x 2 4x , g x x 4
(a) The domain of f is .
(b) The domain of g is the set of all x for which x 4 0 x 4, that is, [ 4 .
(c) f 2 2 2 4 2 12, f 0 02 4 0 0, f 4 42 4 4 0, g 0 0 4 2,
g 8 8 4 2 3, g 6
6 4
2, which is undefined.
(d) f x 2 x 2 2 x 2 x 2 4x 4x x 2 4, g x 2 x 2 4 x 6,
f 2 h 2 h 2 4 2 h 4 4h h2 8 4h h2 4
(e)
g 21 g 5
21 5
21 4 5 4 16
2
5 3 1 16
8
(f) f g x f g x x 4 4 x 4
x 4 4 x 4,
g f x g f x x 2 4x 4
g f 12 12 2 10
x 2 2 x 2 , f g 12 12 4 4 12 4 16 4 16 0,
(g) y x 4 y2 x 4 x y2 4. Reverse x and y: y x 2 4. Thus, the inverse of g is g 1 x x 2 4,
x 0.
2. f x
4 if x 2
x 3 if x 2
(b)
(a) f 0 4, f 1 4, f 2 4, f 3 3 3 0, and
f 4 4 3 1.
3. f x 2x 2 8x 5
(a) f x 2 x 2 4x
5 2 x 2 4x 4
8 5
2 x 2 2 13
(b) Because a 2 0, f has a maximum value of 13 at x 2.
(d) f is increasing on 2 and decreasing on 2 .
(e) g x 2x 2 8x 10 f x 5, so its graph is obtained by shifting that of f upward 5 units.
(f) h x 2 x 3 2 8 x 3 5 f x 3 , so its graph is obtained by shifting that of f to the left 3 units.
Full file at https://testbank123.eu/Solutions-Manual-for-Precalculus-Mathematics-for-Calculus-7th-Edition-Stewart
Full file at https://testbank123.eu/Solutions-Manual-for-Precalculus-Mathematics-for-Calculus-7th-Edition-Stewart