full dissertation: antenatal care in southern african
TRANSCRIPT

Page | 1
Health Economics Division
School of Public Health and Family Medicine
University of Cape Town
Full Dissertation:
Assessing Socio-economic inequalities in the use of
Antenatal care in Southern African Development
Community
Name: Keolebogile Mable Selebano Student Number: SLBKEO001
Email: [email protected]
Supervisor: A/Prof John Ataguba
Date: February 2019
Univers
ity of
Cap
e Tow
n

The copyright of this thesis vests in the author. No quotation from it or information derived from it is to be published without full acknowledgement of the source. The thesis is to be used for private study or non-commercial research purposes only.
Published by the University of Cape Town (UCT) in terms of the non-exclusive license granted to UCT by the author.
Univers
ity of
Cap
e Tow
n

Page | 2
PLAGIARISM DECLARATION
I know that plagiarism is wrong. Plagiarism is to use another's work and pretend that it
is one's own.
I have used the required convention for citation and referencing. Each contribution to
and quotation in this assignment from the work(s) of other people has been attributed,
and has been cited and referenced.
This assignment is my own work.
I have not allowed, and will not allow, anyone to copy my work with the intention of
passing it off as his or her own work.
I acknowledge that copying someone else's assignment or essay, or part of it, is wrong,
and declare that this is my own work.
Signature: K.M Selebano
Date: 11/02/2019

Page | 3
ACKNOWLEDGEMENTS
Truly grateful to God for having afforded me an opportunity to be a student in one of the prestigious
universities in Africa, where I got supervision and mentorship from one of the greatest minds in the
school of health economics.
A special thanks to my supervisor, A/Prof Ataguba for his guidance through the completion of this
dissertation.
Last but not least, I want to thank my family and friends for all the support they have granted me
throughout my tertiary education journey.

Page | 4
Table of contents
SECTION 1: Research Proposal ...................................................................................................... 7
Introduction ................................................................................................................................................ 11
Problem Statement ..................................................................................................................................... 12
Research Aim .............................................................................................................................................. 14
Research Objective ..................................................................................................................................... 14
Literature review ......................................................................................................................................... 15
A. Theoretical Review ............................................................................................................................. 15
The distinction between health equality and health equity ............................................................... 15
B. Methodological Review ...................................................................................................................... 15
Measurement of inequality in health care utilization ........................................................................ 15
C. Empirical Review ................................................................................................................................. 19
Methods ...................................................................................................................................................... 21
A. Data source ..................................................................................................................................... 21
B. Study population ............................................................................................................................. 21
Table 1 List of SADC counties and years for which DHS data is available* ......................................... 22
C. Study variables ................................................................................................................................ 22
D. Analytic methods ............................................................................................................................ 23
E. Data Analysis ................................................................................................................................... 25
F. Research Ethics ............................................................................................................................... 25
References .................................................................................................................................................. 26
SECTION 2: Literature Review ................................................................................................... 32
Introduction ................................................................................................................................................ 33
Aim .............................................................................................................................................................. 34
Objectives ................................................................................................................................................... 34
Methods .................................................................................................................................................. 34
Search and selection strategy ............................................................................................................. 34
Data Extraction.................................................................................................................................... 36
Level of evidence and certainty .............................................................................................................. 38
Results ......................................................................................................................................................... 39
Figure 1: Description of the search results selection process for the literature review ........................ 39
Discussions .................................................................................................................................................. 93

Page | 5
High-income countries ............................................................................................................................ 94
Study design ........................................................................................................................................ 94
Measure of SES ................................................................................................................................... 94
Analytic methods for SES inequality assessment................................................................................ 94
Findings of the review ......................................................................................................................... 94
Low-to-middle-income countries............................................................................................................ 96
Study design ........................................................................................................................................ 96
Analytic methods for SES inequality assessment................................................................................ 97
Findings of the review ......................................................................................................................... 97
Low-income Countries .......................................................................................................................... 101
Study Design...................................................................................................................................... 101
Measure of SES ................................................................................................................................. 101
Analytic Methods for SES inequality assessment ............................................................................. 101
Findings of the Review ...................................................................................................................... 102
Conclusion ................................................................................................................................................. 104
References ................................................................................................................................................ 105
Section 3: Manuscript .................................................................................................................... 108
Abstract ..................................................................................................................................................... 109
Introduction ...................................................................................................................................... 109
Methods ............................................................................................................................................ 109
Results ............................................................................................................................................... 109
Discussions and conclusion ............................................................................................................... 110
Introduction .............................................................................................................................................. 111
Methods .................................................................................................................................................... 113
Study population and a brief overview of health financing profile and MHC patterns in SADC countries
.............................................................................................................................................................. 113
Data source ........................................................................................................................................... 114
Study variables ...................................................................................................................................... 115
Analytic methods .................................................................................................................................. 115
Descriptive statistics ......................................................................................................................... 115
Assessing inequality in antenatal care utilization ............................................................................. 116
Results ....................................................................................................................................................... 118
Descriptive statistics ............................................................................................................................. 125

Page | 6
Analytic Assessment ............................................................................................................................. 128
Discussion.................................................................................................................................................. 130
Descriptive Statistics ............................................................................................................................. 130
Analytic assessment .............................................................................................................................. 134
Limitations ................................................................................................................................................ 136
Conclusion ................................................................................................................................................. 136
Acknowledgements ................................................................................................................................... 137
References ................................................................................................................................................ 138
Section 4: Policy Brief .................................................................................................................... 143
Section 5: Appendices ..................................................................................................................... 148
Appendix 1: Human Ethics Research Approval ..................................................................................... 149
Appendix 2: Submission Guidelines for PLOS ONE Journal ................................................................... 151

Page | 7
SECTION 1: Research Proposal
Assessing inequalities in the use of maternal health
services in the Southern African Development
Community Countries

Page | 8
Section 1: Table of Contents
SECTION 1: Research Proposal ...................................................................................................... 7
Introduction ................................................................................................................................................ 11
Problem Statement ..................................................................................................................................... 12
Research Aim .............................................................................................................................................. 14
Research Objective ..................................................................................................................................... 14
Literature review ......................................................................................................................................... 15
A. Theoretical Review ............................................................................................................................. 15
The distinction between health equality and health equity ............................................................... 15
B. Methodological Review ...................................................................................................................... 15
Measurement of inequality in health care utilization ........................................................................ 15
C. Empirical Review ................................................................................................................................. 19
Methods ...................................................................................................................................................... 21
A. Data source ..................................................................................................................................... 21
B. Study population ............................................................................................................................. 21
Table 1 List of SADC counties and years for which DHS data is available* ......................................... 22
C. Study variables ................................................................................................................................ 22
D. Analytic methods ............................................................................................................................ 23
E. Data Analysis ................................................................................................................................... 25
F. Research Ethics ............................................................................................................................... 25
References .................................................................................................................................................. 26
SECTION 2: Literature Review ................................................................................................... 32
Introduction ................................................................................................................................................ 33
Aim .............................................................................................................................................................. 34
Objectives ................................................................................................................................................... 34
Methods .................................................................................................................................................. 34
Search and selection strategy ............................................................................................................. 34
Data Extraction.................................................................................................................................... 36
Level of evidence and certainty .............................................................................................................. 38
Results ......................................................................................................................................................... 39
Figure 1: Description of the search results selection process for the literature review ........................ 39
Discussions .................................................................................................................................................. 93

Page | 9
High-income countries ............................................................................................................................ 94
Study design ........................................................................................................................................ 94
Measure of SES ................................................................................................................................... 94
Analytic methods for SES inequality assessment................................................................................ 94
Findings of the review ......................................................................................................................... 94
Low-to-middle-income countries............................................................................................................ 96
Study design ........................................................................................................................................ 96
Analytic methods for SES inequality assessment................................................................................ 97
Findings of the review ......................................................................................................................... 97
Low-income Countries .......................................................................................................................... 101
Study Design...................................................................................................................................... 101
Measure of SES ................................................................................................................................. 101
Analytic Methods for SES inequality assessment ............................................................................. 101
Findings of the Review ...................................................................................................................... 102
Conclusion ................................................................................................................................................. 104
References ................................................................................................................................................ 105
Section 3: Manuscript .................................................................................................................... 108
Abstract ..................................................................................................................................................... 109
Introduction ...................................................................................................................................... 109
Methods ............................................................................................................................................ 109
Results ............................................................................................................................................... 109
Discussions and conclusion ............................................................................................................... 110
Introduction .............................................................................................................................................. 111
Methods .................................................................................................................................................... 113
Study population and a brief overview of health financing profile and MHC patterns in SADC countries
.............................................................................................................................................................. 113
Data source ........................................................................................................................................... 114
Study variables ...................................................................................................................................... 115
Analytic methods .................................................................................................................................. 115
Descriptive statistics ......................................................................................................................... 115
Assessing inequality in antenatal care utilization ............................................................................. 116
Results ....................................................................................................................................................... 118
Descriptive statistics ............................................................................................................................. 125
Page | 10
Analytic Assessment ............................................................................................................................. 128
Discussion.................................................................................................................................................. 130
Descriptive Statistics ............................................................................................................................. 130
Analytic assessment .............................................................................................................................. 134
Limitations ................................................................................................................................................ 136
Conclusion ................................................................................................................................................. 136
Acknowledgements ................................................................................................................................... 137
References ................................................................................................................................................ 138
Section 4: Policy Brief .................................................................................................................... 143
Section 5: Appendices ..................................................................................................................... 148
Appendix 1: Human Ethics Research Approval ..................................................................................... 149
Appendix 2: Submission Guidelines for PLOS ONE Journal ................................................................... 151

Page | 11
Introduction
Beyond ensuring economic stability, advancements in technology, and education, the wealth of
nations is also hinged on the health status of its inhabitants and how the government can provide
for quality and accessible health care (Larson & Mercer, 2004). Amongst the many classifications
and indicators of a country’s health status, such as nutrition (Larson & Mercer, 2004), provision
of health security (WHO, 2015), or service coverage, health services received by pregnant women
also reflects the commitments countries make in ensuring a healthy population (Larson &
Mercer, 2004).
Antenatal care (ANC), which is mainly preventive care received by pregnant women (Lincetto et
al., 2006), dates back to the 18th century when childbirth was not as medicalized (Wald, 1985).
In this time, potential parents had little confidence that their child could be born safely and thrive.
As a result, a quarter of all marriages were childless either because of the untimely death of the
neonate or infertility (Margolis & Kotch, 1931). A decline in this trend was due to advancements
in medical care which saw a rise in medical technology such as fertility treatments, medical
interventions during pregnancy and appointment of a more professional class of midwives to
attend to childbirths (WHO, 2002).
In Africa, ANC coverage is described as successful, with 69% of pregnant women attaining at least
one antenatal care contact before childbirth (Lincetto, 2006). However, to achieve the full life-
saving potential that ANC promises for women and babies, a package often called the “focused
antenatal care” is required (Kerber et al., 2007). Essential interventions, amongst other things,
include surveillance of the pregnant woman and her unborn baby, management of pregnancy-
related complications, treatment of concurrent ailments, and screening for infectious diseases
that can potentially be transmitted to the baby. Many of these essential services remain scanty
in sub-Saharan Africa due to many reasons leading to inequalities in access and use of these
maternal services (Lincetto et al., 2006). Inequalities in health care generally refer to any
measurable differences in the use of health care attributable to individuals or socially relevant
groupings (Arcaya, Arcaya, & Subramanian, 2015).

Page | 12
Although ANC remains a routine or a recommended service in many African countries, access to
ANC services is not universal (Kerber et al., 2007). In middle-income countries such as South
Africa, inequality in access to maternal health care can go as far as being wealth-based and/or
geographic, where the rich and those living in urban areas have better coverage than the poor
and those who live in rural areas (Silal et al., 2012). These trends also exist in low-income
countries such as Zimbabwe, where those with secondary education and living in relatively urban
areas show a greater utilization of maternal health care during pregnancy (Muchabaiwa et al.,
2012).
Health care inequalities, in particular, have become an area of focus, not only because of the
pressures that have been placed on policymakers who are fraught with difficult questions, such
as, decisions to improve the health of the worst-off groups (Kerber et al., 2007), but it is also an
area widely explored because of its associations with socioeconomic and geographic background
of the users (Zafer, Kılıc, Ozturk, & Emre, 2015).
Problem Statement
Good health care during pregnancy is not only imperative for the mother, but it is equally
important for the development of the unborn baby. It is during this time that health-promoting
behaviours and fitting parenting skills can be fostered, pre-existing conditions such as
malnutrition, malaria, HIV/AIDS and anaemia that worsen during pregnancy can be monitored
(Channon, Neal, Osrin, Madise, & Stones, 2010), and women who have been subject to genital
mutilation, gender-based violence, and potential home and workplace hazards can be identified
(WHO, 2006). Thus, satisfactory ANC not only binds the woman with the health system but also
her family, and enhances the chance of being attended to by a health professional during birth
(Kerber et al., 2007). Ultimately, this contributes to the critical continuum of care, even once the
baby is born (Lincetto et al., 2006).
On the other hand, poor compliance with prenatal care has negative effects on both women and
their babies (Brown, 1996). The negative effects for the mother include, but are not limited to,

Page | 13
development of conditions such as hypertension (pre-eclampsia or eclampsia) and antepartum
haemorrhage, which are directly related to inadequate care during pregnancy. Although easily
preventable, these conditions continue to contribute to the rise in maternal mortality in
developing countries, mainly due to lack of access (Lincetto et al., 2006). A report by UNICEF
(2013) states that “1 in 3300 in high-income countries compared to 1 in 41 in low-income
countries have a lifetime risk of maternal death due to these preventable conditions”. Also, sub-
Saharan Africa has an estimated infant mortality rate of 52 per 1000 live births compared to 8
per 1000 live births in European regions due to congenital infections or fetal alcohol syndrome,
equated to poor or no ANC (Lincetto et al., 2006). The differences in maternal and child mortality
and morbidity mirror the huge discrepancies between rich and poor people both within and
between countries (Borghi et al., 2006)
Consequently, until recently, four ANC visits have been recommended because of their potential
to improve survival and health of both mothers and their babies, and to ascertain that key
services are provided during the pregnancy period such as preventing the development of
complications, monitoring pre-existing health conditions and ensuring teachings surrounding the
effects of unhealthy lifestyles (Lincetto et al., 2006). Worldwide, socioeconomic inequalities are
one of the leading factors that contribute to lack of use of ANC, along with remotely placed health
facilities, inadequate human resource or inefficient medical technology (Zafer et al., 2015).
Amongst the many equity stratifiers that potentially explain these trends, such as attaining a low
level of education, living in a rural area and access to poorly resourced hospitals, user fees, in
countries where they are levied, can also deter women from seeking medical attention during
pregnancy (Muchabaiwa et al., 2012).
Many women across Africa still don’t have access to these services and the current coverage and
trends in the Southern African Development Community (SADC) countries are still to be explored
(United Nations, 2015). In the period between 1990 and 2015, the World Health Organization
reported advancements in maternal mortality rates; however, these trends remained
unacceptably high in sub-Saharan Africa. The unprecedented efforts of improving the lives of
Africans conducted by the United Nations were partially successful, and the achievement of

Page | 14
Millennial Developmental Goals (MDGs) was equally hindered by gaps in coverage, equity, and
provision of quality services (Wilunda et al., 2015). The set target for the 5th MDG was to reduce
Maternal Mortality Ratio (MMR) by three quarters (United Nations, 2015). Sub-Saharan Africa
only achieved a 49% drop in maternal mortality between 1990 and 2015, for which 56% of the
births were attended to by skilled health personnel compared to 87% in developed countries
(United Nations, 2015). Also, only half of the pregnant women in developing countries were
reported to receive the recommended minimum of four ANC visits (United Nations, 2015).
The SADC, comprising 15-member countries in southern Africa had an average MMR estimated
at 460 per 100,000 live births in 2008 (WHO, UNICEF, UNFPA, & Bank, 2011). After 15 years of
the MDG initiative in 2015, SADC countries were reported to have made little progress in
achieving their MDG-5 (United Nations, 2015). This was combined with an alarming increase in
MMR in two of the SADC countries, namely Zimbabwe and Zambia, at 550 per 100,000 live births
(United Nations, 2015). ANC is one of the pillars of Safe Motherhood Initiatives (Muchabaiwa et
al., 2012) and in-depth analysis and interpretation of its usage will help accelerate progress
towards combating maternal mortality and forming policies that promote equal access. To my
knowledge, apart from a few individual country studies (Muchabaiwa et al., 2012; Wabiri et al.,
2016; Zere et al., 2010), there is a dearth of studies that analyse inequality in the use of ANC
services in SADC countries as a collective.
Research Aim
Assessing inequalities in maternal health indicators in the SADC region.
Research Objective
Assessing inequalities in ANC coverage among women aged 15-49 with a live birth in the last 5
years preceding the survey in selected SADC countries.

Page | 15
Literature review
A. Theoretical Review
Inequalities in access to health care are responsible for a plethora of policy reforms in both the
developing and developed countries (Culyer & Wagstaff, 1992). Of recent, reform proposals are
founded on the distributional equity grounds giving rise to the prominent issue of continual
debate on health care delivery and financing (Wagstaff & van Doorslaer, 1992), along with a
thorough understanding of the terminology of equality and equity in health care (Arcaya, Arcaya,
& Subramanian, 2015).
The distinction between health equality and health equity
Kawachi, Subramanian, & Almeida-Filho (2002) define inequality and equality as pure
dimensional concepts about measurable quantities, whereas inequity and equity as concepts
expressing a moral commitment to social justice. Arcaya et al., (2015) support this notion by
stating that since equality is a descriptive term, we can decide from observing a distribution if
that given distribution is equal or unequal. Equity, on the other hand, is defined as a normative
term and cannot be referenced to solely by considering distribution, but it must be coupled with
value judgement (Le Grand, 1987). Thus numerous policymakers concur that equity should
feature prominently in health policy decisions (Gilson, 1988).
B. Methodological Review
Measurement of inequality in health care utilization
Irrespective of the growing evidence of socio-economic differences in the use of healthcare since
the mid-19th century (Arcaya et al., 2015), concerns regarding the measurement of health
inequalities from an economics perspective were only acknowledged following Wagstaff’s
publication on “the Measurement Inequalities in Health” in 1991 (Regidor, 2004a). In this time,

Page | 16
Wagstaff (1991) cautioned that conclusions reached by different authors regarding trends in
health inequality vary depending on the type of measure employed. Mackenbach & Kunst (1997),
in their review of measures used to assess the magnitude of socio-economic inequalities in
health, concluded that the measure imposed mainly depends on the objective pursued.
Below is a brief review of six measures of inequalities that have been used in the literature and
their respective limitations. The six measures include i) the range ii) the Lorenz curve and the
Gini coefficient iii) the Pseudo-Lorenz curve iv) the index of dissimilarity v) the slope and relative
indices of inequality and vi) the concentration curve and its associated concentrated index.
The range
The range involves comparing percentage point differences of one extreme value to another, in
this case, the inequalities in health between the top and bottom socio-economic groups
(Wagstaff et al., 1991a). Two major shortcomings of the range include 1) its failure to capture
inequalities in the intermediate groups and 2) it takes no account of the size of groups
(weightings) being compared which could lead to misleading results when comparisons are made
over time or across countries (Wagstaff et al., 1991a).
The Lorenz curve and the Gini coefficient
The Lorenz curve focuses on the distribution of health among individuals of a given population
(Wagstaff et al., 1991a). It plots the cumulative proportions of the population ranked from the
least healthy person to the most healthy person against the cumulative percentage of overall
health (Wagstaff et al., 1991a). The measure of inequality is expressed as a proportion of the
area between the Lorenz curve and the diagonal (X) and the area below the diagonal (Y) (Regidor,
2004a). See Figure 1 below. This measure is denoted by the letter G and is known as the Gini
coefficient and ranges from 0 to 1 (Regidor, 2004a). When there is complete equality, G=0 and
the Lorenz curve is diagonal (Regidor, 2004a). However, when there is complete inequality, the
Lorenz curve moves rightwards along the horizontal axis and G=1 (Regidor, 2004a). Although the
Lorenz curve reflects the experiences of people of all social classes better than the range, it fails
to stratify the populations by social class (Wagstaff et al., 1991a). The absence of stratifying
means that the question of relating inequalities in health to socioeconomic status is not being
addressed (Wagstaff et al., 1991a).

Page | 17
Figure 1. Lorenz Health Curve (Regidor, 2004a)
Pseudo Lorenz Curves
The pseudo-Lorenz curve is a derivative of the Lorenz curve that employs group data rather than
individual data (Wagstaff et al., 1991a). The groups are occupational classes that are then ranked
by their mortality, starting with the class with the lowest mortality (Wagstaff et al., 1991a). The
associated pseudo-Gini coefficient is 0 when there are no morbidity differences between the
groups, and the pseudo-Gini coefficient is 1 if all ill-health rests in the hands of one person
(Mackenbach & Kunst, 1997). However, because the population is allocated into groups
according to social class and rather than health status, this means that the curve is not a Lorenz
curve at all (Wagstaff et al., 1991a). Over and above this, the pseudo-Lorenz curve, just like the
true Lorenz curve, also does not reflect the socio-economic dimensions to inequalities in health.
The Index of dissimilarity
This index reflects the percentage of total health that would need to be redistributed from
individuals who’s health is above average to those whose health is below average, to achieve
health equality for all socio-economic groups (Regidor, 2004a). This index is usually large if the
X
Y
G = X/X+Y

Page | 18
groups with the highest or lowest health states have large representations, and only relatively
few people occupy intermediate positions (Mackenbach & Kunst, 1997). However, the index of
dissimilarity suffers from the insensitivity to the socio-economic dimensions to inequalities in
health (Wagstaff et al., 1991a). It is centred on how each socio-economic group’s share of the
population’s health compares with its population share without accounting for how disparity
compares with the socio-economic group’s socioeconomic status (Wagstaff et al., 1991a)
The slope and relative indices of inequality
The slope index of inequality (SII) and the relative index of inequality (RII) show the relation
between socio-economic dimensions and inequalities in health. Thus, it shows the frequency of
a health problem in each socio-economic category alongside the hierarchical ranking of the socio-
economic category on the social scale (Regidor, 2004b). The SII is then defined as the slope of
the regression line showing the relationship between a class’s health status and its relative rank
in the socio-economic distribution (Wagstaff et al., 1991a). It can be interpreted as the absolute
change in health level or the frequency of a health problem when moving from the lowest socio-
economic group through to the highest (Wagstaff et al., 1991a). Although sensitive to changes
in the distribution of the population among different socio-economic categories and reflect the
experience of all individuals, its disadvantage is that it can only be applied to ordinal socio-
economic variables (Regidor, 2004b). Also, the regression estimate should not reflect any
deviations from linearity. Otherwise, the magnitude of the index will be biased (Regidor, 2004b).
Also, because of its sensitivity to changes in the mean level of population health, if this measure
increases proportionally in all socio-economic categories, the SII will increase whereas the
relative differences remain constant (Wagstaff et al., 1991a). This limits the comparison of trends
in socioeconomic inequality in health across different populations, given that the frequency of
the problem has reduced more in some populations than in others (Wagstaff et al., 1991a). The
proposed alternative is the RII which can be estimated in one of two ways: 1) divide the SII by the
mean level of population health or by the frequency of the health problem in the population. 2)
divide the predicted value of the regression at the highest point (1) by the predicted value of the
regression at the lowest point (0).

Page | 19
Concentration indices and concentration curves
Concentration curves can be used to assess whether socioeconomic inequality in a given health
sector such as ANC exists and whether it is more pronounced in one country or another or one
point in time or another (Wagstaff, Paci, & Van Doorslaer, 1991b). One of the limitations of a
concentration curve is that does not give a measure of the magnitude of inequality that can be
conveniently compared across given regions within a country or between countries (Makdissi &
Yazbeck, 2014). This limitation is overcome by the use of the concentration index, which allows
for the quantification of the degree of socioeconomic-related inequality in the use of health care
(Wagstaff et al., 1991b). Substantive literature shows its use in measuring the degree of
socioeconomic-related inequality in child malnutrition (Wagstaff, Van Doorslaer, & Watanabe,
2003), child mortality (Wagstaff et al., 2003) and adult health (van Doorslaer et al., 1997). In the
present study, it will be used to measure and compare the degree of socioeconomic-related
inequality in health care utilization (ANC) among pregnant women in SADC countries.
C. Empirical Review
In high-income countries, gestation is often associated with a positive and fulfilling experience,
but for many women in low-resource countries, this period is associated with suffering, morbidity
and in many cases maternal death (Ononokpono & Odimegwu, 2014). This persists despite the
many attempts in reducing maternal mortality rates (Magadi, Zulu, & Brockerhoff, 2003). In sub-
Saharan African countries, there is an estimated maternal mortality ratio of 500 per 100,000 live
births, and besides, it contributes 56% of all maternal deaths globally (Ononokpono & Odimegwu,
2014). This brief empirical review focuses on how individuals’ given ‘socioeconomic status’
affects these trends observed in accessing ANC and is defined as a construct that considers the
overall household wealth, education and employment status of the expecting mothers.
Socioeconomic factors including the husband’s occupation, wealth status, and financial difficulty
have been found to influence the utilization of maternity services (Alam et al., 2015; Rai et al.,
2012). Similarly, the women’s educational attainment and occupation are markers of economic
resources which empower them to take control of their own health and facilitate easy access to
quality maternal health care (Ononokpono & Odimegwu, 2014).

Page | 20
In a study conducted in a Nigerian population, 70% of women with secondary education and
formal employment delivered in a health facility while only 11% without education and
unemployed did so (Ononokpono & Odimegwu, 2014). An overall of 85% per cent of women in
the richest quartile delivered in a health facility as opposed to 8.4% in the lowest quartile
(Ononokpono & Odimegwu, 2014). This is also true for Zimbabwe where the odds of utilising
maternal care are higher for women with higher education and coming from richest households
compared to the less educated and coming from poorer households (Muchabaiwa et al., 2012).
Sepehri et al. (2008) report that 88.4% of women who had given birth in a health facility were
more likely to have attained 3-6 ANC visits as opposed to 45.0% with no visit at all. These findings
also concur with a study conducted by Rai et al. (2012) where there is a positive correlation
between delivery at a health facility and attaining more than four ANC visits. The urban poor in
sub-Saharan Africa is, on average, 1.4 times more likely to initiate antenatal care late in
pregnancy or to make an inadequate number of antenatal visits (three or fewer) during
pregnancy than the urban non-poor (Magadi et al., 2003).
Whilst it is evident that wealth quartile remains strongly associated with educational attainment
and employment, several authors (Zere et al., 2010; Ononokpono & Odimegwu, 2014; Sepehri et
al., 2008; Celik & Hotchkiss, 2000) further extrapolate this relationship to having a health
insurance and ease of access to ANC. In a study conducted in a Turkish population having health
insurance was found to have an important influence in increasing the probability of both prenatal
care use and birth delivery assistance (Celik & Hotchkiss, 2000). Similarly, in a study conducted
by Zere et al., (2010) assessing inequalities in utilization of maternal health interventions in
Namibia, analysis conducted with concentration curves showed a pro-poor use of public facilities
for place of delivery and place of antenatal care as opposed to a pro-rich use of private facilities
for place of delivery and place of antenatal care.
Another derivative of access to ANC is place of residence and in a study conducted in South Africa
employing the slope and relative indices of inequality and concentration index, pregnant women

Page | 21
in the wealthiest two quartiles were more concentrated in urban cities of Gauteng and Western
Cape provinces and attended four or more ANC visits compared to three quarters of the poorest
quartile and residing in relatively rural parts of South Africa such as KwaZulu Natal, Limpopo and
Eastern Cape provinces (Wabiri et al., 2016b). This is consistent with the study conducted by
Pathak et al. (2010) in India and selected states where economic inequalities in the use of
prenatal care measured by concentration indices and concentration curves, according to place of
residence, showed substantially large, consistent and pro-rich inequalities between 1992-2006
(CI: 0.39, 0.42, 0.35 during 1992–1993, 1998-1999 and 2005-2006 respectively).
Methods
A. Data source
The Demographic and Health Surveys (DHS) from eleven of the fifteen SADC countries for which
data are available will be used. DHS are nationally representative surveys that make use of
standardized questions to collect data from women of reproductive age ranging from 15 to 49
years in developing countries (DHS, 2013). The DHS obtains information on women’s
sociodemographic characteristics, along with maternal health care utilization (DHS, 2013).
B. Study population
SADC countries were chosen because of their rich historical and cultural affinities that exist
amongst their people (SADC, 2005). Beyond this, SADC countries have a common shared vision
that pursues economic well-being, improved standards and quality life, peace and social justice
for the people of Southern Africa (SADC, 2005). A study of this nature conducted on a body of
countries whose vision align with each other can deepen integration within its boards and
harmonize political and social-economic policies and plans of member states.

Page | 22
Four countries are not in the analysis for one of two reasons, either 1) No data are available as in
the case of Botswana, Mauritius, and Seychelles or 2) Data are outdated as in the case of South
Africa.
Table 1 List of SADC counties and years for which DHS data is available*
# Country Years (most recent data)
1 Angola 2015-2016
2 Democratic Republic of Congo 2013-2014
3 Lesotho 2014
4 Madagascar 2016
5 Malawi 2015-2016
6 Mozambique 2011
7 Namibia 2013
8 Swaziland 2006-2007
9 Tanzania 2015-2016
10 Zambia 2013-2014
11 Zimbabwe 2015
*This represents the availability of data at the time of writing (2018).
C. Study variables
Equality in access to ANC will be measured in association with four variables. In the analyses, these
variables will be divided into three mutually exclusive categories namely: (a) no ANC visit, (b) less
than four ANC visits and, (c) equal to or more than four ANC visits. A fourth category will be
created to assess socioeconomic inequality in access to ANC using the number of ANC visits that
pregnant women had received (Intensity).
The DHS does not directly report information on household expenditure or income but employs
asset or wealth index as a substitute for consumption expenditure or socioeconomic status (DHS,
2013). Data on ownership of the household asset are relatively easy to collect in routine

Page | 23
household surveys (van de Walle, 1998), making an asset index a relatively useful measure of
socioeconomic status in developing countries. Another benefit of asset index as a measure of
socioeconomic status is that it is less prone to under-reporting as in the case of income where
individuals fear being marginalized for higher taxes, for instance (Phiri & Ataguba, 2014).
D. Analytic methods
In the first instance, this study will conduct basic descriptive analysis, including descriptive
statistics across equity stratifiers such as the women’s employment status or occupation,
education and household wealth.
Analytically, this study will use concentration curves and indices to quantify and graphically
examine socioeconomic inequality in ANC services in the SADC region. The vertical axis of the
concentration curve (Figure 1) shows the cumulative share of the health variable, which in this
case will be ANC utilization. The horizontal axis shows the cumulative proportion of the
population ranked by socioeconomic status (SES) (Wagstaff A, Paci P, 1991).

Page | 24
Figure 2 below shows a concentration curve with a hypothetical example of health care utilization. If the
concentration curve C(p) lies above the line of equality (i.e. the 45˚line), then health utilization is
concentrated amongst the poor. If the concentration curve C(p*) lies below the line of equality, then
health utilization is concentrated amongst the rich (Phiri & Ataguba, 2014).
Source:(Phiri & Ataguba, 2014)
Figure 2: Concentration curve for health care utilisation illustrated
To analyse the overall extent of inequality in access to ANC by socioeconomic status, this study
computes concentration indices derived from the concentration curves (Umuhoza & Ataguba,
2018). The concentration index corresponds to twice the area between the concentration curve
and the line of equality (Umuhoza & Ataguba, 2018). The concentration index ranges from -1
(when health care utilization is concentrated among the poor) to +1 (when health care utilization
is concentrated among the rich) (Phiri & Ataguba, 2014). Thus a negative index is indicative of a
higher distribution of utilization among the poor and a positive index signifies a higher
distribution of utilization among the rich (Phiri & Ataguba, 2014).
These methods, as outlined above, will be applied to the four variables that will be constructed.

Page | 25
E. Data Analysis
Stata (StataCorp, Texas, United States) will be used for data management, data exploration, and
analysis.
F. Research Ethics
This study uses existing datasets, i.e. the DHS datasets. This use of secondary data is, therefore,
not expected to raise any ethical matters. As per procedure, ethics approval will be sought from
the Human Research and Ethics Committee (HREC) of the University of Cape Town.

Page | 26
References
Alam, N., Hajizadeh, M., Dumont, A., & Fournier, P. (2015). Inequalities in maternal health care
utilization in sub-saharan African countries: A multiyear and multi-country analysis. PLoS
ONE, 10(4), 1–16. http://doi.org/10.1371/journal.pone.0120922
Arcaya, M. C., Arcaya, A. L., & Subramanian, S. V. (2015). Inequalities in health: definitions,
concepts, and theories, 1(3), 1–12.
Arcaya, M. C., Arcaya, A. L., Subramanian, S. V, & Arcaya A. L.; Subramanian, S. V., M. C. . A.
(2015). Inequalities in health: definitions, concepts, and theories. Global Health Action,
8(3), 27106. Retrieved from
http://ovidsp.ovid.com/ovidweb.cgi?T=JS&CSC=Y&NEWS=N&PAGE=fulltext&D=medl&AN=
26112142%5Cnhttp://bf4dv7zn3u.search.serialssolutions.com.myaccess.library.utoronto.c
a/?url_ver=Z39.88-
2004&rft_val_fmt=info:ofi/fmt:kev:mtx:journal&rfr_id=info:sid/Ovid:medl&rft
Borghi, J., Ensor, T., Somanathan, A., Lissner, C., & Mills, A. (2006). Maternal Survival 4
Mobilising fi nancial resources for maternal health. The Lancet Maternal Survival Series,
6736(6). http://doi.org/10.1016/S0140-6736(06)69383-5
Celik, Y., & Hotchkiss, D. R. (2000). The socio-economic determinants of maternal health care
utilization in Turkey. Social Science & Medicine: An International Journal, 50(12), 1797–
1806. Retrieved from
http://libaccess.mcmaster.ca/login?url=http://search.proquest.com/docview/43664139?a
ccountid=12347%5Cnhttp://sfx.scholarsportal.info/mcmaster?url_ver=Z39.88-
2004&rft_val_fmt=info:ofi/fmt:kev:mtx:journal&genre=article&sid=ProQ:ProQ:indexislami
cus&atitle=The+socio-
economic+determinants+of+maternal+health+care+utilization+in+Turkey&title=Social+Sci
ence+&+Medicine:+an+International+Journal&issn=02779536&date=2000-01-
01&volume=50&issue=12&spage=1797&au=Celik,+Yusuf;Hotchkiss,+David+R&isbn=&jtitle
=Social

Page | 27
Channon, A., Neal, S., Osrin, D., Madise, N., & Stones, W. (2010). Examining the “‘ Urban
Advantage ’” in Maternal Health Care in Developing Countries, 7(9).
http://doi.org/10.1371/journal.pmed.1000327
Culyer, A. J., & Wagstaff, A. (1992). Need,Equity and Equality in Health and Health Care, 12.
DHS. (2013). Demographic and Health Surveys Methodology. United States Agency for
International Development (USAID).
Gilson, L. (1988). Government health care charges : is equity being abandoned? London :
Evaluation and Planning Centre for Health Care, London School of Hygiene and Tropical
Medicine. http://doi.org/8811519
Kawachi, I., Subramanian, S. V., & Almeida-Filho, N. (2002). A glossary for health inequalities.
(Glossary). Journal of Epidemiology & Community Health, 56(9), 647–653. Retrieved from
http://go.galegroup.com.proxy.lib.utk.edu:90/ps/i.do?&id=GALE%7CA90984956&v=2.1&u
=tel_a_utl&it=r&p=AONE&sw=w&authCount=1
Kerber, K. J., Graft-johnson, J. E. De, Bhutta, Z. A., Okong, P., Starrs, A., & Lawn, J. E. (2007).
Continuum of care for maternal , newborn , and child health : from slogan to service
delivery, 370.
Larson, C., & Mercer, A. (2004). Global health indicators: an overview, 171(10), 1199–1200.
Le Grand, J. (1987). Equity , Health , and Health Care. Soc&t Justice Research, 1(3), 257–274.
Lincetto, O., Mothebesoane-anoh, S., Gomez, P., & Munjanja, S. (2006). Antenatal Care, 51–62.
Mackenbach, J. P., & Kunst, A. E. (1997). MEASURING THE MAGNITUDE OF SOCIO-ECONOMIC
INEQUALITIES IN HEALTH: AN OVERVIEW OF AVAILABLE MEASURES ILLUSTRATED WITH
TWO EXAMPLES FROM EUROPE. Soc Sci Med., 44(6), 757–771.
Magadi, M. A., Zulu, E. M., & Brockerhoff, M. (2003). The inequality of maternal health care in
urban sub-Saharan Africa in the 1990s. Population Studies, 57(3), 347–366.
http://doi.org/10.1080/0032472032000137853

Page | 28
Makdissi, P., & Yazbeck, M. (2014). Measuring socioeconomic health inequalities in presence of
multiple categorical information. Journal of Health Economics, 34(1), 84–95.
http://doi.org/10.1016/j.jhealeco.2013.11.008
Margolis, L., & Kotch, J. (1931). Tracing the H istorical F oundations of M aternal and C hild H
ealth to C ontemporary T imes.
Muchabaiwa, Lazarus Mazambani, D., Chigusiwa, L., Bindu, S., & Mudavanhu, V. (2012).
Determinants of maternal healthcare utilization in Zimbabwe. International Journal of
Economic Sciences and Applied Research, 5(2), 145–162.
Muchabaiwa, L., Mazambani, D., Chingusiwa, L., Bindu, S., & Mudavanhu, V. (2012).
Determinants of maternal healthcare utilization in Zimbabwe. International Journal of
Economic Sciences and Applied Research, 5(2), 145–162.
Ononokpono, D. N., & Odimegwu, C. O. (2014). Determinants of Maternal Health Care
Utilization in Nigeria: a multilevel approach. The Pan African Medical Journal, 17(Supp 1),
2. http://doi.org/10.11694/pamj.supp.2014.17.1.3596
Pathak, P. K., Singh, A., & Subramanian, S. V. (2010). Economic Inequalities in Maternal Health
Care: Prenatal Care and Skilled Birth Attendance in India, 1992–2006. PLOS ONE, 5(10),
e13593. Retrieved from https://doi.org/10.1371/journal.pone.0013593
Phiri, J., & Ataguba, J. E. (2014). Inequalities in public health care delivery in Zambia, 13(1), 1–9.
http://doi.org/10.1186/1475-9276-13-24
Rai, R. K., Singh, P. K., & Singh, L. (2012). Utilization of Maternal Health Care Services among
Married Adolescent Women: Insights from the Nigeria Demographic and Health Survey,
2008. Women’s Health Issues, 22(4), e407–e414. http://doi.org/10.1016/j.whi.2012.05.001
Regidor, E. (2004a). Measures of health inequalities: Part 1. Journal of Epidemiology and
Community Health, 58(10), 858–861. http://doi.org/10.1136/jech.2003.015347
Regidor, E. (2004b). Measures of health inequalities: Part 2. Journal of Epidemiology and
Community Health, 58(11), 900–903. http://doi.org/10.1136/jech.2004.023036

Page | 29
Sarah, B. (1996). Paying Attention to Children in a Changing Health Care System Summaries of
Workshops.
Sepehri, A., Sarma, S., Simpson, W., & Moshiri, S. (2008). How important are individual,
household and commune characteristics in explaining utilization of maternal health
services in Vietnam? Social Science and Medicine, 67(6), 1009–1017.
http://doi.org/10.1016/j.socscimed.2008.06.005
Silal, S. P., Penn-kekana, L., Harris, B., Birch, S., & Mcintyre, D. (2012). Exploring inequalities in
access to and use of maternal health services in South Africa.
Umuhoza, S. M., & Ataguba, J. E. (2018). Inequalities in health and health risk factors in the
Southern African Development Community : evidence from World Health Surveys, 1–15.
United Nations, 2015: United Nations. (2015). The Millennium Development Goals Report 2015.
Retrieved from
/citations?view_op=view_citation&continue=/scholar%3Fhl%3Den%26as_sdt%3D0,26%26
scilib%3D1%26scioq%3Dthe%2Bmillennium%2Bgoals%2Breport%2B2015&citilm=1&citatio
n_for_view=xgbvHCQAAAAJ:LK8CI43ZvvMC&hl=en&scioq=the+millennium+goals+report+
2015&oi=p%0Ahttp://ww
van de Walle, D. (1998). Assessing the welfare impacts of public spending. World Development,
26(3), 365–379. http://doi.org/https://doi.org/10.1016/S0305-750X(97)10064-X
van Doorslaer, E., Wagstaff, A., Bleichrodt, H., Calonge, S., Gerdtham, U. G., Gerfin, M., …
Winkelhake, O. (1997). Income-related inequalities in health: some international
comparisons. J.Health Econ., 16(0167–6296 (Print)), 93–112.
Wabiri, N., Chersich, M., Shisana, O., Blaauw, D., Rees, H., & Dwane, N. (2016a). Growing
inequities in maternal health in South Africa: A comparison of serial national household
surveys. BMC Pregnancy and Childbirth, 16(1). http://doi.org/10.1186/s12884-016-1048-z
Wabiri, N., Chersich, M., Shisana, O., Blaauw, D., Rees, H., & Dwane, N. (2016b). Growing
inequities in maternal health in South Africa: A comparison of serial national household

Page | 30
surveys. BMC Pregnancy and Childbirth, 16(1). http://doi.org/10.1186/s12884-016-1048-z
Wagstaff, A., Paci, P., & Van Doorslaer, E. (1991a). On the Measurement Inequalities in Health.
Soc Sci Med., 33(5), 545–557. Retrieved from http://www.jstor.org/stable/1911028
Wagstaff, A., Paci, P., & Van Doorslaer, E. (1991b). On the measurement of inequalities in
health*, 33(5), 545–557.
Wagstaff, A., & van Doorslaer, E. (1992). Equity in the finance of health care: Some international
comparisons. Journal of Health Economics, 11(4), 361–387.
http://doi.org/https://doi.org/10.1016/0167-6296(92)90012-P
Wagstaff, A., Van Doorslaer, E., & Watanabe, N. (2003). On decomposing the causes of health
sector inequalities with an application to malnutrition inequalities in Vietnam. Journal of
Econometrics, 112(1), 207–223. http://doi.org/10.1016/S0304-4076(02)00161-6
Wagstaff A, Paci P, van D. E. (1991). On the measurement of inequalities in health. Soc Sci
Med., 33(5), 545–57.
Wald, L. (1985). Health Then and Now, 75(6).
WHO. (2002). Essential Antenatal , Perinatal and Postpartum Care Training modules Regional
Office for Europe.
WHO. (2006). Female genital mutilation and obstetric outcome : WHO collaborative prospective
study in six African countries *, 15, 1835–1841.
WHO. (2015). 100 Core Health Indicators.
WHO, UNICEF, UNFPA, & Bank, T. W. (2011). Trends in Maternal Mortality. Gender Statistics
Database. Retrieved from
http://databank.worldbank.org/Data/Views/VariableSelection/SelectVariables.aspx?sourc
e=Gender Statistics
Wilunda, C., Putoto, G., Riva, D. D., & Manenti, F. (2015). Assessing Coverage , Equity and
Quality Gaps in Maternal and Neonatal Care in Sub- Saharan Africa : An Integrated

Page | 31
Approach, 1–15. http://doi.org/10.1371/journal.pone.0127827
Zafer, C., Kılıc, D., Ozturk, S., & Emre, A. (2015). Equity in maternal health care service
utilization : a systematic review for developing countries, 815–825.
http://doi.org/10.1007/s00038-015-0711-x
Zere, E., Tumusiime, P., Walker, O., Kirigia, J., Mwikisa, C., & Mbeeli, T. (2010). Inequities in
utilization of maternal health interventions in Namibia: Implications for progress towards
MDG 5 targets. International Journal for Equity in Health, 9(i), 1–11.
http://doi.org/10.1186/1475-9276-9-16

Page | 32
SECTION 2: Literature Review
Assessing inequalities in the use of maternal health
services in the Southern African Development
Community Countries

Page | 33
Introduction
The World Health Organization’s (WHO) recommendation of four antenatal care (ANC) visits
during pregnancy, in addition to their key interventions and activities, significantly reduce
maternal mortality due to pregnancy complications in well-resourced health facilities (Lincetto,
Mothebesoane-anoh, Gomez, & Munjanja, 2006). Other than routine mandatory health check-
ups done on neonates until just about the end of childhood, in some cases, pregnancy is the first
time that otherwise healthy women come in contact with the formal health sector (hIarlaithe et
al., 2014). Depending on their experiences, be pleasant or not, this can deter women from
further use, or encourage continued use to postpartum care (Alcock et al., 2015). Other than the
quality of service given, there are numerous reasons that can influence women’s decision to use
these facilities such as place of residence, maternal age, marital status, level of education, wealth
and cultural beliefs (Rai et al., 2012; Magadi et al., 2003; Celik & Hotchkiss, 2000). This literature
review will focus on socioeconomic status (SES) as one of these factors, taking into account
household (HH) wealth, women’s education, employment status and spouse education, where
applicable.
According to UNICEF June 2018 data, the global coverage of access to ANC with skilled health
personnel is 86%, and only 62% receive at least four ANC visits. In regions with the highest rates
of maternal mortality, such as South Asia and sub-Saharan Africa, even fewer women receive at
least four ANC visits (46% and 52%, respectively (UNICEF, 2018)). While there may have been
assumptions that the Millennium Development Goals (MDGs) will eradicate poverty and increase
access to maternal health care, progress has been uneven across regions and countries, leaving
significant gaps particularly in developing countries (WHO, 2015). The global figures presented
above point to an urgent need to address the barriers which are preventing women from
accessing ANC services.

Page | 34
Aim
This literature review aims to explore different socioeconomic factors that contribute to
inequality in the use of ANC services worldwide.
Objectives
Objectives of the empirical review are to highlight previous and current debates around
socioeconomic inequalities in access and use of maternal health care and explore the
assumptions authors have made to arrive at their conclusions. This review will also help in
identifying gaps and/or limitations in the existing literature and further validate the need for the
current research. Studies from different regions were included to reflect different contexts and
settings.
Methods
Search and selection strategy
Peer-reviewed literature that assessed inequality in access to ANC in pregnant women using
quantitative and qualitative study designs was reviewed. A three-step method was followed to
identify the articles that were reviewed. The titles, abstracts and full texts were independently
examined by the primary author as outlined in Box 1. Articles were excluded at each step if they
were unrelated to the topic or met the exclusion criteria.

Page | 35
Box 1. A summary of the exclusion criteria applied by the primary author to identify relevant
articles
1. Non-peer reviewed articles
2. Studies centered on equity
3. Studies are addressing maternal health care (MHC) with no focus on ANC. E.g. only
addressing skilled birth attendance or only addressing postnatal care.
4. Studies focused on migrant women
The reference lists of the remaining publications were searched for potential relevance and
eligibility. If the abstracts of the studies met the screening eligibility criteria, full-text articles
were read and examined if they met the inclusion criteria outlined in Box 2.
Box 2. The inclusion criteria used to select articles to be included in the literature review
1. The article must include original data
2. All women of reproductive ages
3. Articles that are written in English
4. Articles from high-income countries, low-to-middle-income countries and low-income
countries were included.
The PubMed electronic database was searched for studies using Title and Abstract to identify at
least one term from each of the following categories (last search: July 2018):
“Socioeconomic status” [Title/Abstract] OR “SES”[Title/Abstract] OR
“Economic”[Title/Abstract] OR “Income Inequalities”[Title/Abstract] OR “Income
Differences”[Title/Abstract] OR “Wealth Disparities”[Title/Abstract]
AND Access*[Title/Abstract] OR Afford*[Title/Abstract]

Page | 36
AND “Maternal Health Care”[Title/Abstract] OR “MHC”[Title/Abstract] OR “Antenatal
Care”[Title/Abstract] OR “ANC”[Title/Abstract]
The Scopus electronic database was searched for studies using similar Title and Abstract to
identify the search terms as outlined above (last search: September 2018)
Data Extraction
The primary author completed data extraction. Relevant articles meeting the inclusion criteria
as per Box 2 were reviewed with all relevant information, such as the objective of the study, the
measure of SES, variables of interest, along with study findings and conclusions.

Page | 37
Box 3. Inequality and Maternal health care terminology
1. Health Inequality: Health inequality is the generic term used to designate variations
and disparities in the health attainment of individuals and social groups (Kawachi &
Subramanian, 2002).
2. Socioeconomic Status (SES): Socioeconomic factors comprise demographic, social,
structural, and attitudinal influences which increase the likelihood of a person to seek
ANC services when pregnant (Andersen 1995). Among the examples of socioeconomic
variables that influence the use of ANC are age, level of education, employment status,
household size, geographic distance, and physical accessibility. These factors can
influence ANC use among pregnant women either positively or negatively (Akowuah,
Agyei-baffour, & Awunyo-vitor, 2018).
3. Antenatal Care (ANC): Antenatal healthcare is defined by the World Health
Organization (2000) as the “care a pregnant mother receives before birth” and involves
among other services, education, screening, counselling, treatment of the minor
ailment, and immunisation (Akowuah et al., 2018).
4. Prenatal Care: Synonymous with ANC
5. Skilled Birth Attendance (SBA): Defined as the delivery experience with a health
professional such as a doctor, nurse, midwife or auxiliary midwife. Traditional birth
attendants and community health workers were not considered as health professionals
(Do, Thi, Tran, Phonvisay, & Oh, 2018). Also referred to as Institutional delivery.
6. Postnatal Care (PNC): This is an important component of maternal health care as there
is a high chance of developing grave and life-threatening maternal health complications
after delivery. A postnatal care visit is an ideal time to educate a new mother on how
to care for herself and her new-born. It is recommended that women receive at least
three postnatal check-ups, the first within two days of delivery, the second on the third
day after delivery and the third on the seventh day after delivery (Charlotte Warren,
Pat Daly, Lalla Toure, n.d.).
7. Household (HH) size: Household size is another important predisposing factor believed
to influence the utilisation of antenatal care. Household size is measured as the number

Page | 38
of persons in a particular household that live in the same house and share resources
(Akowuah et al., 2018).
Level of evidence and certainty
The level of evidence was determined for each article reviewed following the inclusion and
exclusion criteria. A study was deemed of lower quality if the only measure of inequality was
subjective in the form of participants’ interviews.

Page | 39
Results
Figure 1: Description of the search results selection process for the literature review
Figure 1 illustrates a search through Scopus and PubMed that yielded a total of 1365 articles,
seventeen of which were duplicates. About 1348 articles were screened, and only 135 articles
were tested for eligibility based on the inclusion and exclusion criteria. Thus a total of 32 items
were included in this review

Page | 40
Table 1: Empirical studies of socioeconomic inequalities in the use of maternal health care in ‘high-income countries
Author: Chiavarini, Lanari, Minelli, & Salmasi, 2014
Type of study;
Country; Year of
analysis
Background context of the
country
Study objectives Measure of SES Analytic methods
for SES inequality
assessment
Variables of interest
Cross-sectional
Study; Italy-
Umbria; 2005 -
2010
A study conducted on 37
000 women between ages
20 – 39 years
Nationality of mother
considered
o Italian
o European Union
o Rest of the world
Provide accurate
knowledge about
the inadequate use
of prenatal health
care
Socio-
demographic
indicators:
Employment
Status
Education
Standard and
multilevel
regression models
Number of prenatal
visits
The timing of the
first visit
Findings:
Women making a lower number of visits tend to be less educated with respect to making a recommended number of prenatal visits.
A higher percentage of employed mothers follow recommendations and have four or more ANC examinations
Education vs four or more ANC visits
Higher education = 95.29%
Lower education = 86.85%
Employment vs four or more ANC visits
White-collar = 94.88%
Unemployed = 87.60%
Conclusions:
Inadequate prenatal care in those with low education.
Having a job improved the use of services (workspaces allow transmission of information about negative consequences of delayed
prenatal visits).
Limitations:
Content and quality of care received by women not documented

Page | 41
Author: Park, Vincent, & Hastings-Tolsma, 2007
Type of study;
Country; Year of
analysis
Background context of the
country
Study objectives Measure of SES Analytic methods
for SES inequality
assessment
Variables of interest
A retrospective,
descriptive
design; USA;
1996 - 1997
American College of
Obstetricians and
Gynaecologists (ACOG)
traditionally recommends
about 14 prenatal visits to
low-risk pregnant women.
A study conducted in a large,
urban university midwifery
faculty practice setting
The disparity in
prenatal care among
women of colour in
the timing of initiation
of prenatal care and
the total number of
prenatal visits
Education
Method of
payment.
Nurse-Midwifery
Clinical Data Set
(NMCDS)
Pearson correlation
and Chi-square
were used to
determine whether
a relationship
between the two
variables existed.
Timing of initiation
of prenatal care
Total number of
prenatal visits
Findings:
The mean number of prenatal visits was 10.3 visits, and the range was 1–26 visits.
Women who were high school or college graduates visited prenatal clinics more often than women with less than a high school education
(p = 0.001)
Women with private insurance or Medicaid were more likely to visit prenatal clinics than women who had other forms of public insurance
(p < 0.001)
Conclusion:
The non-Hispanic white women at the university hospital clinic, with high school or college degrees and insurance or Medicaid, were
more likely to visit prenatal clinics.
Examination of the association between the timing of initiation of prenatal care and demographic variables showed significant
differences in race and education.
Limitations:
This study has a comparatively small sample (439 participants), and most of the participants were women of colour in low socio-economic
conditions.

Page | 42
Table 2: Empirical studies of socioeconomic inequalities in the use of maternal health care in ‘low-to-middle-income countries’
Author: Tsawe & Susuman, 2014
Type of study;
Country; Year of
analysis
Background context of the
country
Study objectives Measure of SES Analytic methods
for SES inequality
assessment
Variables of interest
Mixed Methods
(Quantitative and
Qualitative);
South Africa
(Eastern Cape);
Year of analysis
missing
Lower levels of education
Long queues at the
hospital and longer
distances to the Centre
Health care resources
often unequally
distributed between rural
and urban areas
Health professionals
mistreat women with a
positive HIV status during
consultations
Examine whether
women in Mdantsane
are accessing and
using MHC.
Examine what factors
are associated with
access and use of MHC
services.
Education
Occupation
Access to
medical aid
Bivariate and
multivariate
regression models
Dependent variables:
Access to MHC
ANC during
pregnancy
Independent
variables:
Maternal
education
Occupation
Medical aid
Findings:
Only 35.2% of women surveyed (267) were accessing MHC
Occupation (p<0.05) and medical aid (p<0.001) were significantly associated with MHC access.
Women with secondary education had a higher proportion of MHC use compared to women with primary education
Use of ANC:
More than half (58.4%) of women went for at least four ANC visits.
About 41.6% went for five or more ANC visits
Self-employed women (74.4%) went for the recommended 4 visits
Women with secondary education were 2.9 times as likely to use ANC compared to those with no education
Limitations:
Only 267 participants were interviewed, therefore study no representative of the South African population

Page | 43
Author: Arokiasamy & Pradhan, 2013
Type of study;
Country; Year of
analysis
Background context of the
country
Study objectives Measure of SES Analytic methods
for SES inequality
assessment
Variables of interest
Cross-sectional
Study;
India and 19
major states;
Analysis periods
include: 1992-
1993, 1998 –
1999, 2005 - 2006
Highly pronounced
variations exist in MHC
coverage in India across its
states
There are striking
inequalities by SES
Provision of MHC was
minimal in some states
with increased maternal
and childhood mortality
and morbidity
Working women have
lower MHC use because of
opportunity and monetary
costs forgone.
Religion – caste/tribe
hinders the use of MHC.
Women who practice
these customs are
discriminated against.
Assess the degree to
which the observed
MHC use can be
accounted for by
social & economic
determinants
HH economic
status index is
broken into
three categories
as low, medium
and high
women’s
education
women’s
working status
Husband’s
education
Multi-level logistic
regression models
Dependent variables
Attendance of four
ANC visits.
Safe delivery
coverage
Other variables
Demographic
factors
Socio-economic
factors
Service availability

Page | 44
Author: Arokiasamy & Pradhan, 2013, continued
Findings:
In the state of Bihar, fully recommended MHC coverage was merely 5% for illiterate women, which rose to about 45% for women who
completed high school.
State of Nadu Tamil more than 75% of illiterate women received full ANC, with a lower proportion of illiterate women.
Low fertility was linked with high SES and in turn, higher MHC use.
Women with higher parities may not feel the need to receive care during pregnancy from their experience. Women with higher
parities were also most likely bound by cultural and economic constraints.
Conclusions:
The study found an overall higher level of MHC utilization for the following reasons:
o Educated women can easily break away from tradition
o Can take advantage of facilities available
o Can make independent decisions.
Limitations:
None mentioned

Page | 45
Author: Silal, Penn-Kekana, Harris, Birch, & McIntyre, 2012
Type of study;
Country; Year of
analysis
Background context of the
country
Study objectives Measure of SES Analytic methods
for SES inequality
assessment
Variables of interest
Mixed methods
(Quantitative-
Qualitative study
design; South
Africa;
2008/2009
Analysis was done on
women from two rural
and two urban health sub-
districts.
Mainly black Africans in
the study (both in rural
and urban areas –
recruitment from public
hospitals)
About 56% of participants
were aged between 21
and 29 years.
Those in rural areas were
more likely to be married
It is routine to have an HIV
test done when pregnant
(although not mandatory)
Health and health service
delivery has been affected
by relics of South African
past, including racial and
gender discrimination,
violence and severe
income inequalities.
Explores barriers to
access obstetric care
from the perspective
of women needing
care
Household wealth
index using
multiple
correspondence
analysis
conducted on
several HH level
variables:
Type of house
Material of walls
Type of toilet
The primary
source of energy
for cooking
Ownership of
assets such as a
vehicle, fridge,
and livestock
etc.
One thousand two
hundred and thirty
(1231) quantitative
exit interviews and
sixteen qualitative in-
depth interviews
(over 18 years)
Regression analysis:
Logistic regression
Multiple linear
regression
Demographic and
socioeconomic
predictor variables:
Proxies for
affordability include
the amount of
money spent on the
day of delivery or
skilled birth
attendance

Page | 46
Author: Silal, Penn-Kekana, Harris, Birch, & McIntyre, 2012, continued
Findings:
Patients from wealthier HHs spent significantly less money as a percentage of HH expenditure compared to patients from poorest HHs
holding other variables constant.
Neither employment nor education yielded significant associations with costs as a percentage of HH expenditure
Over 90% of South Africans use ANC and Skilled Birth Attendance (SBA).
Conclusions:
Inequalities are found in favour of wealthier women and urban dwellers.
Rural women had difficulty in accessing emergency obstetric care in district hospitals, owing to barriers like distance, cost of transport,
shortage of medication and problems with staff attitude towards the poor.
Limitations:
The study is facility-based. Thus, researchers only interviewed women who had used services and overcame barriers to accessing these
services.
Amount of money spent on the day of birth as a measure of affordability was used as a sole variable for affordability

Page | 47
Author: Viegas Andrade, Noronha, Singh, Rodrigues, & Padmadas, 2012
Type of study;
Country; Year of
analysis
Background context of the
country
Study objectives Measure of SES Analytic methods
for SES inequality
assessment
Variables of interest
Ecological study;
Brazil and India;
2005 - 2006
ANC coverage is almost
universal in Brazil
90% of women in Brazil
receive four or more visits.
In India, only ¾ of women
receive any form of care,
and less than 2/5 have the
recommended four or
more visits.
Quality of service provision
is also another factor that
discourages service use in
both countries.
Brazil is one of the most
unequal economies in the
world.
87% of Brazilian live in
urban areas as opposed to
28% in Indians in India.
Health care expenditure
mainly incurred in private
sector through health
insurance in Brazil and via
out of pocket expenditure
in India.
A systematic
comparison of Brazil
and India to better
the understanding of
different policy
approaches and
their influence on
the extent of
antenatal behaviour
among different
socioeconomic
groups.
Wealth index
based on the
ownership of HH
assets.
Demographic and
Health Survey (DHS) –
Brazil
National Family
Health Survey – India
Concentration
indices and
concentration
curves
Binary logistic
regression models
were used to
examine the
socioeconomic
inequalities
determining ANC
behaviour,
adjusting for
relevant controls
Predictor variables
Socioeconomic
Status
Outcome variables
Number of ANC
visits considering
diagnoses and
medical procedures
followed during
each visit
In India, these were
categorized into
less than four or
more than four
In Brazil, these were
categorized into
less than six or
more than six.

Page | 48
Author: Viegas Andrade, Noronha, Singh, Rodrigues, & Padmadas, 2012, continued
Findings:
On average, a woman in Brazil spent 7.8 years in the school whereas her Indian counterpart spent only 4.4 years.
In India, the poorest-poor had only one year of schooling experience compared to ten years among the richest-rich. Corresponding
figures for Brazil were 5.4 and 9.8 years, respectively.
In Brazil, less than 4% of the poorest-poor women had health insurance when compared to about 48% among those in the richest-rich
category.
In India, the overall household income coverage was very low, less than 1% among the poorest-poor and about 12% amongst the richest-
rich group.
A little more than 50% of the Brazilian women in the poorest-poor group had ≥ 6 visits, and this was less than 5% among their
counterparts in India.
About 80% of the poorest-poor in India had not received even the standard minimum of four visits.
Brazilian women with private household income.
o Rural areas: 8.3%
o Urban areas: 25.6%
Indian women with private HI
o Rural areas: 1.6%
o Urban areas: 7.3%
Conclusion:
The frequency of ANC visits was higher among wealthier groups in both Brazil and India. However, the average difference in ANC visits
between the richest and the poorest was relatively higher in India than Brazil.
The difference in ANC use between urban and rural areas was negligible despite the differences in SES. However, in India, there were
huge differences.
Inequalities in access to four or more ANC visits are significantly pronounced in India, and in Brazil, the differences are significant only
for those who had six or more visits.
Limitations:
Data in the DHS are self-reported and might suffer from possible reporting bias

Page | 49
Author: Rashid, Antai, & Antai, 2014
Type of study;
Country; Year of
analysis
Background context of the
country
Study objectives Measure of SES Analytic methods
for SES inequality
assessment
Variables of interest
Cross-sectional
Study; Namibia;
2006 - 2007
Study conducted on 9,804
females aged 15 – 49 years
from both rural and urban
areas.
Estimate the role of
socioeconomic
position as a
determinant of the
utilisation of MHC in
Namibia
Wealth index Demographic and
Health Survey
Multivariate logistic
regression
Exposure variables:
Education
Occupation
Wealth index
Place of residence
Marital status
Age
Outcome variables
Access to
prenatal care
Access to
institutional
delivery
Access to
postnatal care

Page | 50
Author: Rashid, Antai, & Antai, 2014, continued
Findings:
Women without education and partners without education reported fewer ANC visits compared to those with secondary and higher
education.
Both women and their partners who were agricultural self-employed reported less care compared to professional, technical and
management workers.
Women with no education (odds ratio: 0.15) and women in poor HH (odds ratio: 0.4) were less likely to use prenatal care by
professional health care workers compared to women who had secondary or higher education and women in rich households,
respectively.
Conclusion:
Effective interventions need to factor in the less educated and poor women in rural areas to achieve increased maternal health service
utilisation.
Education exerts effects on health-seeking behaviour through several ways:
o Greater knowledge and information in accessing MHC and its preventive ill-health advantage.
o Therefore increase the probability that a woman would make critical choices regarding the availability and quality of services by
health institutions

Page | 51
Author: Pathak, Singh, & Subramanian, 2010
Type of study;
Country; Year of
analysis
Background Context of the
Country
Study Objectives Measure of SES Analytic methods
for SES inequality
assessment
Variables of interest
Longitudinal
Study; India in
three contrasting
states, namely,
Uttar Pradesh,
Maharashtra and
Tamil Nadu;
1992 - 200
Analysis conducted on three
culturally, demographic,
geographic and
socioeconomically
contrasting states.
Uttar Pradesh is the most
populous state of India
situated in the central part
of the country with a large
proportion of the state’s
population suffering from
poverty, low female
literacy and low women
autonomy.
Maharashtra situated in
the western part of India is
the second most populous
states with relatively
higher socioeconomic
development.
Tamil Nadu is among the
most advanced Indian
states in terms of
socioeconomic and
demographic parameters.
Analyse the trends and
patterns in utilisation
of prenatal care in the
first trimester with
four or more
ANC visits and SBA
Composite wealth
index derived
from a similar set
of durable asset
ownership, access
to utilities,
infrastructure, and
housing
characteristics for
all three rounds of
NFHS.
Three rounds of
National Family
Health Survey (NFHS)
Bivariate analyses
Concentration
curve and
concentration
index
Logistic regression
and multinomial
logistic regression
models
Likelihood of using
prenatal care;
Likelihood of using
skilled birth
attendance

Page | 52
Author: Pathak, Singh, & Subramanian, 2010, continued
Findings:
Across all the study states, the use of PNC remained substantially lower among poor mothers than their non-poor counterparts.
Economic inequalities in the use of PNC remained precipitously high among rural mothers (concentration indices: 0.35, 0.39 & 0.37)
compared to their urban counterparts (concentration indices: 0.25, 0.23 & 0.18) in India during these respective periods, 1992–1993;
1998-1999; 2005-2006.
Maternal and paternal education, urban residence, mass-media exposure and any form of pregnancy complications were significantly
associated with the use of PNC in India
Conclusions:
Among the study states, the economic inequality in the use of PNC remained high in rural mothers compared to their urban
counterparts during the 1992–2006 period.
The findings from the study revealed a sluggish increment in PNC in India during 1992–2006. However, the increments were mainly
noted among the non-poor mothers, and the poor mothers benefitted least from the government-sponsored maternal health care
services over the past 15 years.
The largest improvement in the use of maternal care services w recorded in Tamil Nadu, followed by Maharashtra, while the least
change was observed in Uttar Pradesh.
Limitations:
None listed.

Page | 53
Author: Alcock et al., 2015
Type of study;
Country; Year of
analysis
Background context of the
country
Study objectives Measure of SES Analytic methods
for SES inequality
assessment
Variables of interest
Cross-sectional
study,
Quantitative and
qualitative
methods;
Mumbai, India;
September 2011
to March 2013
Data for the study were
provided by 3848 women
who had delivered a baby
in the preceding two years.
Just over half had some
secondary education.
Most (74 %) were in the
age group 20–29 years and
56 % had one or two
children.
Most were Muslim (83 %).
Muslim women were more
likely to seek prenatal and
delivery care at private
hospitals, reflecting a
strong preference for
female physicians
To quantify the
pattern, determinants,
and choice of
maternity care
provider at the health
facility level in public
and private sectors in
Mumbai’s
informal urban
settlements, and to
explore the reason
underlying these
choices.
Assets and
amenities
Housing fabric
Maternal
schooling
Primary quantitative
and qualitative data
were collected in a
baseline census over
18 months
The univariable
logistic regression
model
Prenatal care as
attendance of at least
three check-ups (the
locally recommended
minimum).

Page | 54
Author: Alcock et al., 2015, continued
Findings:
Overall, institutional maternity care-seeking was high: 94 % made three or more prenatal visits, and 85 % had a facility delivery.
Uptake of prenatal care and institutional delivery care was lower for women who never went to school, were poorer, and who had
recently arrived in Mumbai.
The odds of prenatal care increased with education, economic status in terms of household asset quintile, and duration of stay in
Mumbai, and decreased with parity.
Even in the most disadvantaged groups, women choose among health providers in both the private and public sectors.
Some women who had particularly poor perceptions or experiences of public sector care had either sought financial support from within
the family or had taken a loan to avoid seeking care at a public hospital.
Conclusion:
Institutional delivery is the norm in Mumbai’s informal settlements. However, poorer and less educated women and recent migrants
were less likely to receive professional prenatal and delivery care.
Limitations:
A qualitative limitation arose from the use of quantitative and qualitative methods in grounded theory: Authors found it difficult to
reconcile analytical concepts derived from deductive (quantitative) and inductive (qualitative) methods.

Page | 55
Author: Singh et al., 2012
Type of study;
Country; Year of
analysis
Background context of the
country
Study objectives Measure of SES Analytic methods
for SES inequality
assessment
Variables of interest
Cross-sectional
Study; India;
2007–08.
Data collected on 601
districts from 34 states and
union territories of India.
Compare inequalities
in the use of PNC
between facility births
and home births and
to determine
inequalities in the use
of PNC.
A wealth index is
computed based
on the ownership
of household
assets and
consumer
durables
The third round of the
District Level
Household Survey
(DLHS-3)
Binary logistic
regression models
Outcome variable:
type and timing of
postnatal care.
Main explanatory
variable of interest
was a proxy measure
of household
economic status
Findings:
Only about 42% received the recommended four or more visits. Only 46% of women received advice on institutional care for childbirth
Only 44% of the mothers interviewed in the survey received any PNC check-up within 48 hours of giving birth
The rich-poor ratio varied from as low as 1.7 in case of receipt of any form of ANC to as high as 3.4 in regard to the compliance with 4 or
more ANC visits.
Conclusion:
There are significant socio-economic inequalities in access to PNC even for those accessing facility-based care. The coverage of essential
PNC is inadequate, especially for mothers from economically disadvantaged households.
The present findings are indicative of the fact that part of the non-use and inequalities in maternal health care can be explained by the
inherent drawbacks in health systems which are inclined to treat clients based on their socio-economic position.
Limitations:
This research could not externally validate the survey responses, although the trends were seen in various rounds of DLHS ensure
consistency across time.

Page | 56
Author: Asamoah, Agardh, Pettersson, & Östergren, 2014
Type of study;
Country; Year of
analysis
Background context of the
country
Study objectives Measure of SES Analytic methods
for SES inequality
assessment
Variables of interest
Cross Sectional
Study; Ghana;
1988, 1993, 1998,
2003, and 2008.
The majority of participants
were within 25–34 years,
had basic education, resided
in rural areas and were
married. For one-fifth of the
respondents, it was their first
birth experience while the
majority had more than one
birth experience (para 1 to 3:
44–50% and para 4 +: 28–
36% between 1988 and
2008).
Investigate the
magnitude and trends
in income-, education-
, residence-, and
parity-related
inequalities in access
to antenatal care and
skilled attendance at
birth
Educational
level
Income level
Ghana Demographic
and Health Surveys
(DHS).
Logistic regression
model
Regression-based
Total Attributable
Fraction (TAF)
Antenatal care
visits. ANC accessed
using two variables:
a) no ANC visit or at
least one visit, and
b) less than four
ANC visits or at
least four visits
Skilled attendance
at birth. Responses
were dichotomised
as a) women who
had skilled
attendance at birth
from a doctor,
nurse, or midwife),
and b) those who
had no skilled
attendance at birth.

Page | 57
Author: Asamoah, Agardh, Pettersson, & Östergren, 2014, continued
Findings:
The rural-urban gap and education-related inequalities in the utilisation of antenatal care and skilled birth attendants seem to be closing
over time, while income- and parity-related inequalities in the use of antenatal care are on a sharp rise.
Within the income levels, increased utilisation of ANC was mostly attributed to high-income women. Two decades ago, income-related
inequalities in ANC and SBA utilisation in Ghana were minimal
From 1993 to 2008, the proportion of women with at least one ANC visit increased from 87.1% to 96.1%, those with at least four visits
increased from 60.1% to 78.7%.
The utilisation of SBA increased mainly in women with urban residence, high education, high income, and low parity
Conclusion:
Intensifying community-based health education through media and door-to-door campaigns could further reduce the mentioned
education- and parity-related inequalities.
Limitations:
Self-reporting bias
There was no data on the composition and quality of antenatal care received which could have given a more informed idea on the
adequacy of care
The declining trend in the rural/urban gap in the use of maternal health services may partly be attributed to changes in infrastructure
and improved access to maternal health care services.

Page | 58
Author: Adeyanju, Tubeuf, & Ensor, 2017
Type of study;
Country; Year of
analysis
Background context of the
country
Study objectives Measure of SES Analytic methods
for SES inequality
assessment
Variables of interest
Cross-sectional
study; Nigeria;
1990 and 2008
The population remains
religious and can be seen to
be quite evenly split
between Christian (42% in
1990) and
Muslim (53%) at both times
points although there it
seems that the latter is larger
overall this may be as a result
of the increasing birth rates
in the Muslim groups.
The population is still largely
rural (75% in 1990 and 64%
in 2008), but an increase in
the population urbanisation
is seen.
In Nigeria, maternal health
care remains highly
underfunded with only 7%
of Nigeria’s annual budget
has gone to the health
sector since the early 1990s
Analyse the trends in
socioeconomic
inequalities in the
access t
o maternal and
child health care over
time in Nigeria
between 1990 and
2008
Household wealth
index constructed
with economic
proxies, such as
housing quality,
household
amenities,
consumer
durables and
size of
landholding
Nigerian
Demographic and
Health Survey
Concentration
curves and indices
Skilled antenatal
care from a health
professional or
otherwise
Skilled birth
attendance from a
health professional
or otherwise
Control variables:
Education
Wealth Index

Page | 59
Author: Adeyanju, Tubeuf, & Ensor, 2017, continued
Findings:
Inequalities in access to skilled antenatal care were concentrated among the wealthier group with both years’ curves lying below the line
of equality and inequalities increased over time with a CCI of 0.24 (95% CI 0.235-0.251) in 1990 and 0.26 (95% CI 0.256-0.272).
Inequalities in skilled birth attendance increased between 1990 and 2008.
Literacy-related inequality in skilled birth attendance increased while education-related inequality declined over-time.
Conclusion:
Observed an increase in inequalities in access to care for the two maternal health variables
The socioeconomic inequalities in access to maternal health care have increased with access to care favouring women in richer
households.
While some socio-economic groups have benefited from faster economic growth and improvements in living standards, much of the
population continues to lack access to maternal services
Limitations:
The analysis is not causal but rather presents associations between several characteristics and the care outcomes.

Page | 60
Author: Makate & Makate, 2017
Type of study;
Country; Year of
analysis
Background context of the
country
Study objectives Measure of SES Analytic methods
for SES inequality
assessment
Variables of interest
Cross-sectional
Study;
Zimbabwe; 1994,
1999,
2005/2006, and
2010/2011.
Policies implemented to
improve access to MHC
including the Primary
Health Care (PHC) of the
mid-1980s and the
Maternal and Neonatal
Health (MNH) roadmap
2007–2015 launched in
2009 among others
Had one of the worst
economic crisis in its history
that saw the deterioration
in the major sectors of the
economy.
The degradation in the
quality of health because of
the exodus of qualified
health professionals to
neighbouring countries and
abroad has contributed to
inequalities in health. The
increase in user fees in
health in 1993–94 is
plausibly responsible for
the widening gap between
the poor and rich in the
country.
Measure and explain
wealth-related
inequalities in
prenatal care use, and
professional delivery
assistance
Asset-based
household
wealth index
Demographic and
Health Survey for
Zimbabwe (ZDHS)
Erreygers corrected
concentration
index
Receipt of four or
more antenatal care
visits as our measure
for prenatal care use.
Explanatory
variables:
The age of the
woman at the
time of birth
Education level
Contraceptive
usage
Marital status
Employment
status
Religious beliefs
Access to
information
Previously
terminated
pregnancy

Page | 61
Author: Makate & Makate, 2017, continued
Findings:
The prevalence of MHC utilisation for women in the bottom three wealth quintiles (poorest, poorer, and average) appear somewhat
lower than those in the top two wealth quintiles (richer and richest).
Women from wealthier families (richer and richest) appear to have had high utilisation rates over time (1994 – 2011).
The overall trends in disparities in prenatal care use show a pro-rich distribution in 1994, 2005/06 and 2010/11 with a pro-poor
distribution observed in 1999.
Inequalities in professional delivery support have also been pro-rich over the period under study.
The pattern of inequalities over time also reveals a widening gap between the rural wealth-poor and the rural wealth-rich individuals.
The decomposition analysis of the wealth-related inequalities in maternal health care use demonstrated that household wealth was
amongst the most important factors explaining the observed differences in maternal health care in Zimbabwe. This result makes intuitive
sense given the documented rise in poverty levels in the country since the mid-1990s
while schooling appears to explain a fair share of the observed inequalities in maternal health care use, its contribution has declined over
time.
Conclusion:
The observed pro-rich distribution in disparities in maternal health care was mostly explained by household wealth, education, religion,
health insurance coverage, and access to information.
Limitations:
Factors identified to influence maternal health care outcomes do not necessarily have a causal interpretation
Some of the data recorded by the ZDHS on maternal health care use are based on self-reports of the interviewed women, which can
result in recall bias.
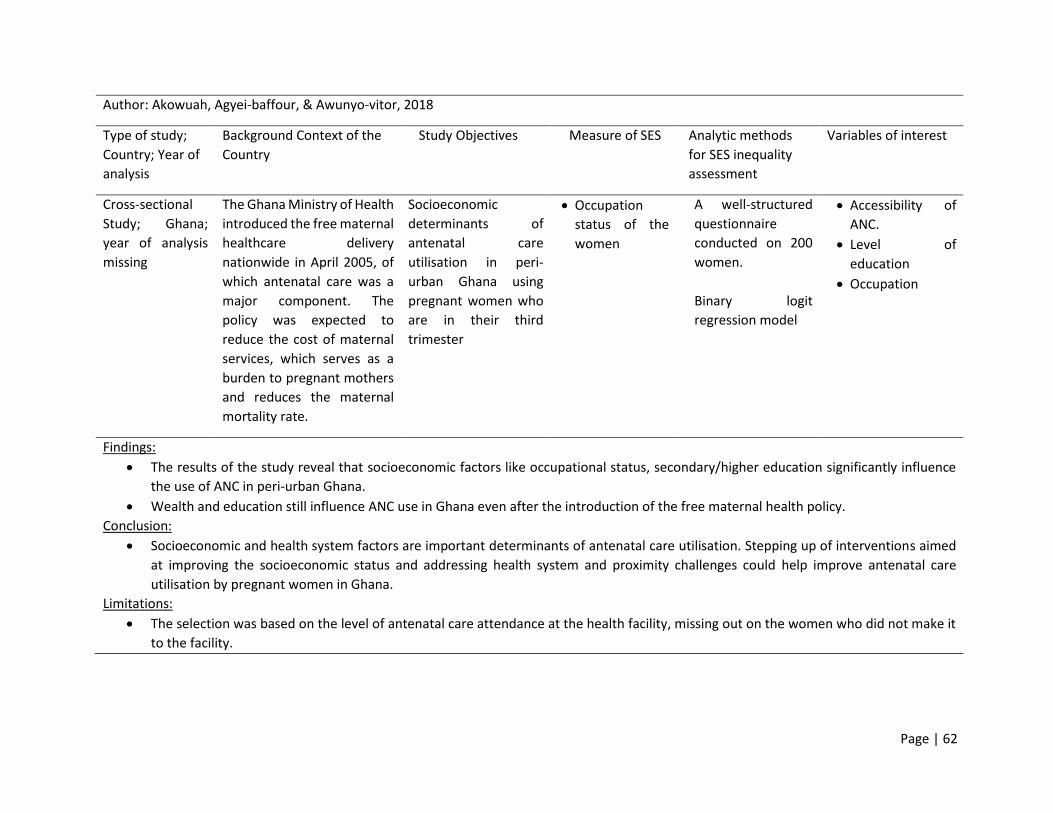
Page | 62
Author: Akowuah, Agyei-baffour, & Awunyo-vitor, 2018
Type of study;
Country; Year of
analysis
Background Context of the
Country
Study Objectives Measure of SES Analytic methods
for SES inequality
assessment
Variables of interest
Cross-sectional
Study; Ghana;
year of analysis
missing
The Ghana Ministry of Health
introduced the free maternal
healthcare delivery
nationwide in April 2005, of
which antenatal care was a
major component. The
policy was expected to
reduce the cost of maternal
services, which serves as a
burden to pregnant mothers
and reduces the maternal
mortality rate.
Socioeconomic
determinants of
antenatal care
utilisation in peri-
urban Ghana using
pregnant women who
are in their third
trimester
Occupation
status of the
women
A well-structured
questionnaire
conducted on 200
women.
Binary logit
regression model
Accessibility of
ANC.
Level of
education
Occupation
Findings:
The results of the study reveal that socioeconomic factors like occupational status, secondary/higher education significantly influence
the use of ANC in peri-urban Ghana.
Wealth and education still influence ANC use in Ghana even after the introduction of the free maternal health policy.
Conclusion:
Socioeconomic and health system factors are important determinants of antenatal care utilisation. Stepping up of interventions aimed
at improving the socioeconomic status and addressing health system and proximity challenges could help improve antenatal care
utilisation by pregnant women in Ghana.
Limitations:
The selection was based on the level of antenatal care attendance at the health facility, missing out on the women who did not make it
to the facility.

Page | 63
Table 3: Empirical studies of socioeconomic inequalities in the use of maternal health care in ‘Low-income countries’
Author: Wang & Hong, 2015
Type of study;
Country; Year of
analysis
Background context of the
country
Study objectives Measure of SES Analytic methods
for SES inequality
assessment
Variables of interest
Cross-sectional
study; Cambodia;
2010
The analysis was done on
women aged 20-34,
already had 1 or more
children and had some
form of education
The majority lived in rural
areas, 80% reported
access to various types of
media
30% of the population lives
below the poverty line (6
472 women analysed).
Examine the level of
service use along the
continuum of care
Asset index Demographic Health
Survey:
Three sequential
regression models
Continuum of care:
ANC visits, SBA and
Postnatal care (PNC),
48 hours post-
delivery.

Page | 64
Author: Wang & Hong, 2015, continued
Findings:
3/5 Cambodian women received all three types of MHC services for their most recent birth
Regional variations in use range from 14% to 96% in capital cities.
Quality of ANC is connected to women’s use of SBA and PNC.
Overall use in Cambodia:
60% attended all recommended four visits
90% had at least 1 visit
74% of women had skilled birth attendance
Women from wealthier HHs are more likely to receive postnatal care than women from poorer HHs, although the effect of wealth on
PNC does not appear to be as strong as its effect on ANC and PNC.
After receiving ANC many women dropped out from the pathway of continued care.
Conclusions
The use of services (continuum of care) substantially vary by wealth status, education, and Health Insurance coverage.
89% from the richest HHs compared to 39% of those form the poorest HHs, receive the full range of services.
Odds of using ANC are five times higher for women with secondary education than for women without education
A woman with health insurance has a 30% greater odds of having ANC.
Limitations:
The analysis used secondary data thus cannot account for maternal complications that can potentially drive women to health facilities
for more MHC.

Page | 65
Author: Joshi, Torvaldsen, Hodgson, & Hayen, 2014
Type of study;
Country; Year of
analysis
Background context of the
country
Study objectives Measure of SES Analytic methods
for SES inequality
assessment
Variables of interest
South Asia,
Nepal; 2011
Nepal follows the World
Health Organization’s
recommendation of
initiation of ANC within the
first four months of
pregnancy and at least
four ANC visits during an
uncomplicated pregnancy
Younger women, living in
urban areas, having
primary education or
higher, with lower parity,
from non-farming
occupations, in higher
wealth quintiles, who did
not smoke and whose
husbands also had primary
education or higher, were
more likely to attend four
or more ANC visits and
receive higher quality ANC
Investigate factors
associated with:
(1) Four or more ANC
visits and
(2) Receipt of good
quality ANC, among
Nepalese women
who had given birth
in the previous five
years.
DHS wealth
quintile divided
into categories:
poorest, poorer,
middle, richer
and richest; and
were derived
using the
principal
components
analysis based
on information
from housing
characteristics
and ownership
of durable
household
goods)
Women’s
education
Women’s work
status in the past
12 months
Demographic and
Health Survey
Logistic regression
models
Outcome Variable:
Attendance at four
or more ANC visits
Quality ANC as
that which
included all seven
recommended
items of ANC in
Nepal

Page | 66
Author: Joshi, Torvaldsen, Hodgson, & Hayen, 2014, continued
Findings:
Half the women (n = 2078, 50.0%, 95% CI = 46.1 to 53.8%) had four or more ANC visits, whereas the other half had fewer than 4 ANC
visits, including 15% of women who had no ANC at all
A larger proportion of women attending four or more ANC visits received good quality ANC, compared to those who attended fewer
than four ANC visits (84% vs 16%).
With increasing education levels of women, their odds of receiving four or more ANC visits also increased, which was as high as seven
times for women with tertiary education compared to those with no education (OR = 7.11; 95% CI: 3.28 to 15.44).
Women in the richest quintile had three times the odds of receiving four or more ANC visits than women in the poorest quintile (OR =
3.00; 95% CI: 1.95 to 4.60).
The levels of husbands’ education increased the odds of women getting four or more ANC visits.
Conclusion:
We found that receipt of four or more ANC visits and the quality of ANC were associated with several factors ranging from socio-economic
Women's education was strongly associated with greater use of maternal health care [38]. Female education improves wealth reduces
gender disparity and empowers women
Limitations:
The data were self-reported, and it was a retrospective study making the information thus collected subject to recall bias.

Page | 67
Author: Sharma, Sawangdee, & Sirirassamee, 2007
Type of study;
Country; Year of
analysis
Background context of the
country
Study objectives Measure of SES Analytic methods
for SES inequality
assessment
Variables of interest
Cross-sectional
Study; Nepal;
1996 and 2001.
The country has employed
the use of outreach
service workers who make
home visits to increase
access to MHC and
information regarding
health during pregnancy.
Mass media is also one of
the mechanisms the
country has put in place to
further use of MHC
To understand how
far programme
interventions issues
have been successful
in Nepal to increase
MHC usage with a
special focus on the
relationship between
SES score and
educational
attainment as one of
the determinants.
SES was
measured by
adding yes/no
responses for
possession of
eight household
durable goods or
services: radio,
television, car,
electricity,
bicycle, tap
water, modern
toilet, modern
floor material.
1996 Nepal Family
Health Survey and
2001 Nepal
Demographic and
Health Survey
Multiple and
Simple logistic
regression models
Dependent
variables:
antenatal care,
delivery care and
postnatal care,
during the last
pregnancy and
birth.
Explanatory
variables include:
Women’s highest
qualification and
employment
status

Page | 68
Author: Sharma et al., 2007, continued
Findings:
Among women’s status variables, education showed a strong association with the use of all maternal health services. Women with
primary and higher education were more likely to use these services than uneducated women.
All working women, irrespective of the type of employment, were less likely to use delivery and postnatal care.
Women working in the service sector, however, were more likely (not significant) to use prenatal care services compared with women
who did not work.
Conclusion:
Education was positively associated with all three maternal health service utilisation. Potentially because of educated women’s greater
decision-making power on health-related issues.
Employed women, irrespective of their type of employment, were less likely to utilise maternal health services.
The likelihood of utilising maternal health services increased with an increased household economic status score. The likelihood of
utilising maternal health services increased with an increased household economic status score.
Limitations:
None mentioned
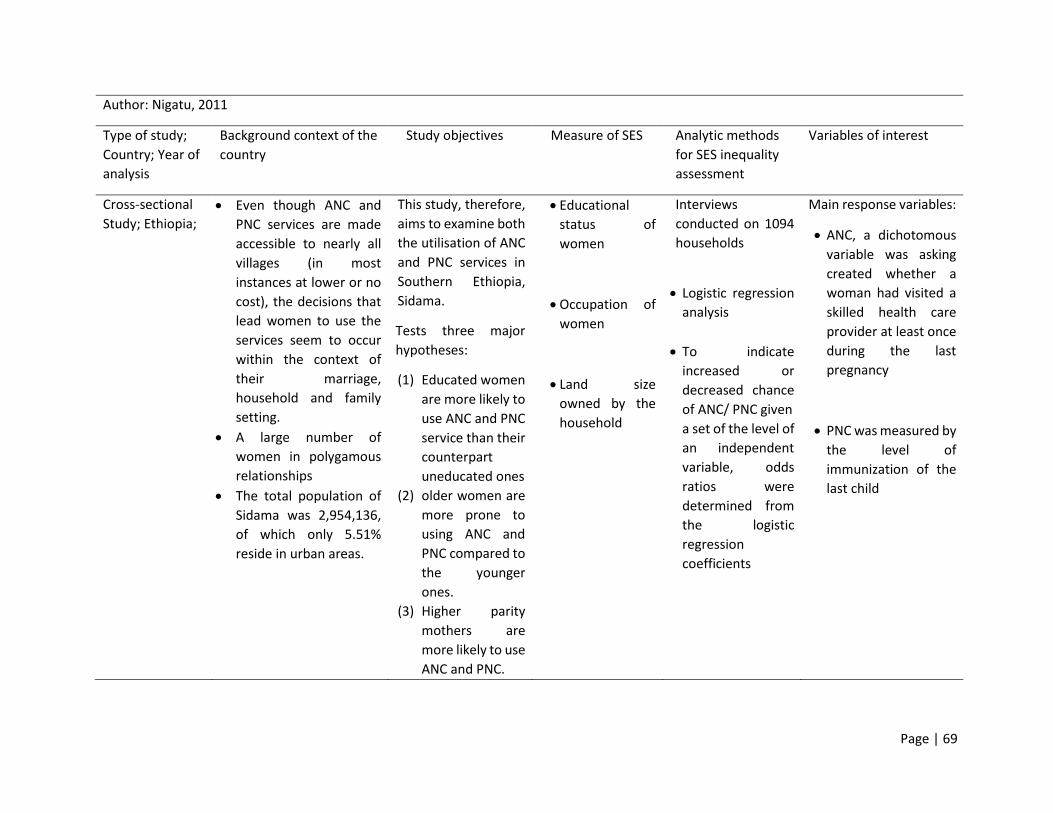
Page | 69
Author: Nigatu, 2011
Type of study;
Country; Year of
analysis
Background context of the
country
Study objectives Measure of SES Analytic methods
for SES inequality
assessment
Variables of interest
Cross-sectional
Study; Ethiopia;
Even though ANC and
PNC services are made
accessible to nearly all
villages (in most
instances at lower or no
cost), the decisions that
lead women to use the
services seem to occur
within the context of
their marriage,
household and family
setting.
A large number of
women in polygamous
relationships
The total population of
Sidama was 2,954,136,
of which only 5.51%
reside in urban areas.
This study, therefore,
aims to examine both
the utilisation of ANC
and PNC services in
Southern Ethiopia,
Sidama.
Tests three major
hypotheses:
(1) Educated women
are more likely to
use ANC and PNC
service than their
counterpart
uneducated ones
(2) older women are
more prone to
using ANC and
PNC compared to
the younger
ones.
(3) Higher parity
mothers are
more likely to use
ANC and PNC.
Educational
status of
women
Occupation of
women
Land size
owned by the
household
Interviews
conducted on 1094
households
Logistic regression
analysis
To indicate
increased or
decreased chance
of ANC/ PNC given
a set of the level of
an independent
variable, odds
ratios were
determined from
the logistic
regression
coefficients
Main response variables:
ANC, a dichotomous
variable was asking
created whether a
woman had visited a
skilled health care
provider at least once
during the last
pregnancy
PNC was measured by
the level of
immunization of the
last child

Page | 70
Author: Nigatu, 2011, continued
Findings:
Women who are working in formal employment (such as in civil services) were 1.96 times more likely to use the ANC services.
Illiterate women were 27.9% and 24.7% less likely to use the ANC and PNC services respectively compared to their counterpart literate
women.
Conclusion:
The study has revealed that the level of ANC service utilisation is relatively higher in Sidama (about 77.4%) compared to other
populations in southern Ethiopia. However, most women might have visited the service to get treatment for their health problem
instead of deliberately seeking ANC services.
It is also likely that literate women seek out higher quality services and have a greater ability to use health care inputs that offer better
care
Limitations:
The study collected information on service utilisation in relation to the most recent birth during the 24 months preceding the survey,
and hence, it is difficult to look into consistency in the use of these services between successive births.

Page | 71
Author: Memirie, Verguet, Norheim, Levin, & Johansson, 2016
Type of study;
Country; Year of
analysis
Background context of the
country
Study objectives Measure of SES Analytic methods
for SES inequality
assessment
Variables of interest
Cross-sectional
Study; Ethiopia;
2005 and 2011.
The national health policy of
Ethiopia gives strong
emphasis on fulfilling the
needs of the rural residents,
which constitute 84 % of the
Ethiopian population.
Ensuring universal access to
health care is one of the
main targets of the national
Health Sector Development
Program (HSDP) IV (2011–
2015) in Ethiopia.
1) To measure changes
in the degree of
inequality in the
utilisation of selected
MCH interventions
and child morbidities
over time
2) To determine factors
associated with
inequality and
inequity in access to
care
Household asset
index using
principal
components
analysis.
Wealth quintiles
were used as a
living standard
measure in the
subsequent
modelling.
Data from DHS
conducted in
Ethiopia
Concentration and
horizontal inequity
indices
Utilization of MCH
services was selected
for analysis.
These were binary
variables, where a
value of 1 was
assigned if care was
accessed or a value of
0 if care was not
accessed.

Page | 72
Author: Memirie, Verguet, Norheim, Levin, & Johansson, 2016, continued
Findings:
Decomposition of the concentration index shows that 47% and 76% of wealth-related inequality in access to SBA and modern
contraceptive use is explained by the direct effect of household economic status and by educational attainment of parents.
Public hospitals and private facilities played a major role as delivery care services outlet, more so for the wealthiest quintile and urban
residents (pro-rich).
Conclusion:
Despite improvements in coverage of MCH services, the inequality by wealth quintile has remained persistently high in both the 2005
and 2011 surveys.
Socioeconomic status, measured by a wealth index and parental educational attainment, were the main predictors of differences in
utilization of MCH services
The low utilisation of these services among the poor and rural residents might be related to out-of-pocket spending by families, either
for services or because families need to travel to a health facility.
Limitations:
Recall bias is one possible problem in surveys as they are based on maternal recall.
The computation of concentration indices for binary outcomes, we used a linear regression model that may lead to inaccuracies.

Page | 73
Author: Wilunda et al., 2015
Type of study;
Country; Year of
analysis
Background context of the
country
Study objectives Measure of SES Analytic methods for
SES inequality
assessment
Variables of interest
Cross-sectional
Study; three
districts in South
West Shoa Zone
(Wolisso, Wonchi
and Goro),
Ethiopia;
February 2013
Most of the participants
were from Wolisso District
(55.6 %); rural dwellers
(86.3 %); of Oromo ethnicity
(86.6 %); uneducated
(52.3 %); Orthodox
Christians (51.8 %); with a
partner with at least primary
education (77 %); and
married (96.4 %). Less than a
half (48.8 %) knew the
minimum recommended
number of ANC visits and
23.3 % could mention at
least three danger signs of
pregnancy.
Determine the
coverage of at least
four ANC visits and
delivery by an SBA
and to identify
determinants of
utilisation of these
services
Housing
material
Asset ownership
access to water
sanitation
facilities
UNICEF’s Multiple
Cluster Indicator
Survey questionnaires
and JHPIEGO’s tools
for monitoring birth
preparedness and
complication
readiness (492
women interviewed)
Logistic regression
models were used to
obtain unadjusted and
adjusted odds ratios
with 95 % CIs for the
associations between
various factors and
each of the outcome
variables.
Variables with p < 0.1
in the unadjusted
analysis were included
in multivariate
analysis.
Attendance of at
least four ANC visits
provided by a
health professional
or a health
extension worker
Delivery care by an
SBA, i.e. a doctor,
nurse, midwife, or a
health officer.

Page | 74
Author: Wilunda et al., 2015, continued
Findings:
Coverage of at least four ANC visits and SBA at delivery were 45.5 and 28.6 %, respectively.
Women in the highest wealth quintile had a three-and-a-half-fold increase in the odds of attending ANC compared to those in the lowest
wealth quintile (OR 3.53, 95 % CI 1.69-7.39)
The wealth index was positively associated with delivery by an SBA with women in the highest wealth quintile having a 9-fold increase in
the odds of delivery by an SBA compared to those in the lowest wealth quintile (OR 8.94, 95 % CI 2.45–32.61)
15% of women with secondary or higher education, as opposed to 43.8% of those with no education, attended all four ANC visits.
Conclusion:
Attendance of at least four ANC visits was positively associated with wealth status, knowledge of the recommended number of ANC
visits, and attitude towards maternal health care, but was negatively associated with woman’s age.
This study suggests that education is not a strong determinant of the utilisation of maternal health services in this context where more
than half of the women are uneducated.
Limitations:
Transportation and direct or indirect costs were also not evaluated in this survey.
Inadequate staffing potentially leading to long waiting time in receiving care at health facilities was also not studied here.

Page | 75
Author: (Tsegay et al., 2013)
Type of study;
Country; Year of
analysis
Background context of
the country
Study objectives Measure of SES Analytic methods
for SES inequality
assessment
Variables of interest
Cross-sectional
Study; Ethiopia,
Tigray; August to
September 2009
Eighty per cent of the
population are estimated
to live in rural areas, and
most of the inhabitants
are Christian. The region is
divided into seven zones
and 47 districts, of which
35 are rural, and 12 are
urban. There is one
specialised referral
hospital as well as five
zonal hospitals, seven
district hospitals and 208
health centres.
Determine the
prevalence of
maternal health care
utilisation and
explore its
determinants among
rural women aged
15–49 years in Tigray
Respondents’(women)
education
Husbands´ occupation
A structured
questionnaire
based on an
existing tool
(women from
1,115 households
were interviewed)
Univariable
logistic regression
ANC use was
defined as
whether the
mother paid at
least one visit to
the health post
during her
pregnancy.
Place of delivery
was classified as
home delivery or
institutional
delivery
Findings:
Mothers with 5–12 years of education (OR=3.18, 95% CI: 1.85-5.47) were more likely to attend ANC than non-educated and grade 1–4
mothers.
Having husbands with a non-farming occupation (OR=2.26, 95% CI: 1.43-3.58) were also associated with greater use of ANC.
Conclusion:
Women’s education improves the status of women, enabling them to decide to seek health care and to identify danger signs during
pregnancy. Furthermore, it increases women’s knowledge of where and how the best health care can be accessed and enhances women’s
capability of making autonomous decisions
It becomes clear from this study that the key factor for improving maternal health care and access is women’s education.
Limitations:
The data were collected by health extension workers who were familiar with the community, which could result in social desirability bias.

Page | 76
Author: Mezmur, Navaneetham, Letamo, & Bariagaber, 2017
Type of study;
Country; Year of
analysis
Background context of the
country
Study objectives Measure of SES Analytic methods
for SES inequality
assessment
Variables of interest
Cross-sectional
study; Ethiopia;
2000, 2005 and
2011.
Ethiopia is the second-most
populous country in the
African region. It has made
remarkable progress in
reducing poverty over the
past decade.
Despite the progress in
reducing poverty over the
past decade, the country’s
per capita national health
expenditure of 20.77 US$ in
the year 2011 remains the
lowest compared to the
Sub-Saharan Africa average
of US$ 93.65 and that of
WHO’s recommended US$
30–40 per person needed to
cover essential healthcare
Out-of-pocket healthcare
payment is catastrophic and
comprises 80% of the
healthcare expenditure,
which is much higher
compared to 62% in sub-
Saharan Africa.
Examine
socioeconomic
inequalities in the
uptake of maternal
health services and to
identify factors that
contribute to such
inequalities
Wealth index,
constructed
using
information
collected on
durable asset
ownership,
access to
utilities and
infrastructure
Ethiopian
Demographic and
Health Surveys
(EDHS)
Concentration
curves and the
related
concentration
index (CI)
Decomposition
analysis
Minimum of one
ANC, four or more
ANC
Initiated the first
ANC in the first
trimester of
pregnancy,
Exposure Variables:
Maternal
Education
Maternal
Occupation

Page | 77
Author: Mezmur, Navaneetham, Letamo, & Bariagaber, 2017, continued
Findings:
The uptake of a minimum of one ANC and adequate ANC (3+ ANC) were more frequent among the richest segment of society.
Across the survey years, the average increase in the uptake of these services is greater among women in the richest wealth quintile.
Initiation of the first ANC in the first trimester of pregnancy amongst the poorest wealth quintile increased marginally, whereas the
increase for women in the richest wealth quintile was greater.
The positive CI values of 0.308, 0.323 and 0.310 for the uptake of a minimum of one ANC in the year 2000, 2005 and 2011 respectively
indicate skewness towards the non-poor population.
Inequality in the uptake of four or more ANC declined from 0.409 in the year 2000 to 0.353 in 2011.
Conclusion:
There is a general improvement in the uptake of maternal health services in Ethiopia over the past decade which is inequitable to the
disadvantage of the poor
Inequalities are much larger in care while giving birth than in other maternal healthcare indicators.
The observed widening inequalities in the uptake of delivery care favouring the rich over the study period; however, mean the
implemented health programs have not adequately addressed the issue of equity.
Limitations:
The cross-sectional nature of the data does not allow drawing causal inferences.
DHS data are associated with recall bias given that data were collected retrospectively on events that took place 5 years before the survey

Page | 78
Author: Mehata et al., 2017
Type of study;
Country; Year of
analysis
Background context of the
country
Study objectives Measure of SES Analytic methods
for SES inequality
assessment
Variables of interest
Cross-sectional
study; Nepal;
1994 to 2011.
Nepal has made significant
progress in meeting
maternal and child health-
related Millennium
Development Goals and
has achieved remarkable
reductions in maternal,
newborn, infant, and under-
five mortality over the past
two decades. However, stark
disparities in utilisation of
services and health
outcomes persist along
geographic, economic, and
sociocultural lines.
Assess the social
determinants of
inequalities in the use
of maternal health
services
in Nepal by drawing on
national household
surveys.
Wealth index cross-sectional
surveys conducted in
Nepal in 1996 (Nepal
Family Health Survey,
NFHS), 2001, 2006,
and 2011 (Nepal
Demographic and
Health Surveys
(NDHS)):
Bivariate and
multivariate logistic
regression
Rate difference and
rate ratios were
calculated to
measure income
inequalities
concentration index
and 95% confidence
interval (95% CI)
were also used to
assess income
inequality over
time.
Dependent variable:
Antenatal care
Institutional
delivery
Delivery by
cesarean section
Independent
Variable:
Mothers’ education
Caste and ethnicity
Wealth quintile
Rural/urban
residence
Ecological zone

Page | 79
Author: Mehata et al., 2017, continued
Findings:
The percentage of mothers with four antenatal care (ANC) visits increased from 9% to 54%, and the institutional delivery rate increased
from 6% to 47% between 1994 and 2011.
The institutional delivery rate increased both in public and private sector facilities between 1994–1996 and 2009–2011. While public
health facilities continue to have a larger number of deliveries in comparison to private, the rate of increase in institutional delivery
was higher among for-profit private facilities compared to public facilities.
Mothers from the richest wealth quintile were more than five times more likely to have four ANC consultations (AOR: 5.08, 95% CI:
3.82–6.76), nine times more likely to give birth at health institutions (AOR: 9.00; 95%CI: 6.55–12.37), and nearly 10 times more likely to
give birth by C-section (AOR: 9.37; 95% CI: 4.22–20.83).
The rich: the poor ratio was reduced from 11.36 in 1994–1996 to 2.92 in 2009–2011 and the concentration index dropped from 0.60
(95%CI: 0.56–0.64) to 0.31 (95% CI: 0.29–0.33) for four ANC consultations.
Mothers with higher education were about ten times more likely (odds ratio: 10.38; 95% CI: 6.81–15.81) to use four ANC compared to
women with no education.
Conclusion:
study indicate that inequality in the utilization of maternal health services in Nepal persists, although it is in a declining trend from
1994 to 2011.
To turn the goals of universal health coverage into reality, special attention needs to be paid to poorer women, those with less
education, and those living in remote areas.
Limitations:
The design of the four NDHS surveys may not have been strictly comparable although we tried to adjust some differences such as
duration of recall period while assessing the determinants of inequalities.
The findings are prone to recall bias.
The perspectives of women who gave birth and died before an interview could take place were missing.

Page | 80
Author: Rurangirwa, Mogren, Nyirazinyoye, Ntaganira, & Krantz, 2017
Type of study;
Country; Year of
analysis
Background context of the
country
Study objectives Measure of SES Analytic methods
for SES inequality
assessment
Variables of interest
Cross-sectional
Study; Rwanda -
Kigali City; July
and August of
2014
With approximately 11
million inhabitants, 64% of
women and 66% of men in
Rwanda have a primary
school education. However,
12% of women and nine per
cent of men have no formal
education.
The majority of the low
educated or illiterate women
live in rural areas where
more than 93% of the
women are involved in small-
scale agricultural activities,
and the fertility rate is higher
than the country average of
4.6 children.
Investigate the
number and timing of
ANC visits that were
performed and socio-
demographic and
psycho-social risk
factors for low or no
attendance.
Total
household
monthly
income
Household
assets
Interviewer-
administered
questionnaire
Bi-and
multivariable
logistic regression
Odds ratios were
presented with
their 95%
confidence
intervals.
Dependent
variables:
Number of
antenatal care
visits
The timing of
antenatal care
visits
Findings:
No schooling and being poor, with no assets in the household, was not associated with poor ANC attendance with p-values of 0.24, 0.62
and 0.24, respectively.
Conclusion:
The study found that a majority of women still do not complete the recommended number of four visits to ANC during pregnancy.
Limitations:
The cross-sectional nature of our study limits the ability to draw any causal inferences, and residual confounding resulting from other
socio-demographic and psychosocial related determinants cannot be ruled out.

Page | 81
Author: Amin, Shah, & Becker, 2010
Type of study;
Country; Year of
analysis
Background Context of the
Country
Study Objectives Measure of SES Analytic methods
for SES inequality
assessment
Variables of interest
Cross-sectional
Study; 3 rural
areas from
Bangladesh -
Chittagong,
Dhaka and
Rajshahi; June
2003 to
September 2006
A wide range of therapeutic
choices in modern health
care through public health
facilities is available in rural
Bangladesh. These include
primary health care
organised around the
Health Complex located at
the Upazila (sub-district)
headquarters with in-
patient and basic
laboratory facilities.
These facilities provide a
free essential services
package (ESP) in health
care, which consists of
maternal health, family
planning, communicable
disease control, child
health, and basic curative
care.
Socioeconomic
differentials in
maternal and child
health-seeking
behaviour in selected
rural areas.
Mother's level of
schooling
Father's
occupation and
level of education
Membership in a
microcredit group
Ownership of
assets.
Household survey
calculated odds
ratios with each
covariate
conducted
multivariate
logistic regression
analyses
Trained antenatal care (ANC) provider vs. untrained provider or no ANC
Tetanus toxoid (TT) given vs. not given to the woman during the last live birth pregnancy
Child delivery by trained providers vs. untrained providers

Page | 82
Author: Amin, Shah, & Becker, 2010, continued
Findings:
Greater use of antenatal care (ANC) from a trained provider was significantly associated with years of schooling of the mothers and the
fathers, with 76.4% of mothers with more than primary school vs. 33.7% of mothers with no education seeking ANC from a trained
provider (p < 0.01).
Women whose husbands had schooling above primary level 74.5% sought ANC from a trained provider compared with 35.9% of women
whose husbands had no formal education (p < 0.01).
Mothers in families whose husbands were in agricultural or skilled labour occupations and whose households were in higher wealth
quintiles were more likely to use modern providers for antenatal and postnatal care.
Compared to the mothers in the lowest wealth quintile, mothers from the highest quintile had greater odds of seeking ANC from a
trained provider (OR = 7.6, 95% CI: 2.2-26.2, p < 0.01) and nearly 11 times higher odds to have a trained provider present at childbirth
(95% CI: 2.-45.2, p < 0.01).
Conclusion:
Both formal education and relative wealth were positively associated with the utilisation of maternal and child health services.
Consequently, both the economic and educational improvement of the poor mothers would have a reinforcing effect on improved service
utilisation, so they both need to be strengthened.
Limitations:
Data were from a purposive sample of villages in relatively remote rural areas. Therefore, the findings pertain to the population of
households of the 128 sampled villages at the time of the interview

Page | 83
Author: Collin, Anwar, & Ronsmans, 2007
Type of study;
Country; Year of
analysis
Background context of the
country
Study objectives Measure of SES Analytic methods
for SES inequality
assessment
Variables of interest
Cross-sectional
study;
Bangladesh;
1993–1994,
1996–1997,
1999–2000, and
2004.
Bangladesh has seen a
gradual decline in its
maternal mortality ratio
(deaths per 100,000 live
births) over the past decade,
from 500 in 1990 to 400 in
2001, but the ratio remains
unacceptably high,
representing 12,000
maternal deaths per year.
The official MDG-5 target of
143 deaths/100,000 live
births by 2015 can only be
achieved by overcoming
gender and socioeconomic
inequalities, and cultural
barriers, which prohibit
access to skilled and
emergency obstetric care for
the vast majority of
Bangladeshi women
Examine trends in the
proportions of live
births preceded by
antenatal
consultation, attended
by a health
professional, and
delivered by caesarean
section, according to
key socio-
demographic
characteristics.
Asset quintiles
were computed
using the
principal
components
analysis
method of
Filmer and
Pritchett
Four Bangladesh
Demographic and
Health Surveys
Logistic regressions
were used to
calculate crude and
adjusted odds
ratios
Receiving one or
more antenatal
consultations
from a health
professional
Health
professional
present at
delivery,
The birth
occurred at home
or in a health
facility.
Other variables:
Mother's age
at delivery
Parity
Mother's
highest level
of education
Father's
highest level
of education,
Residence

Page | 84
Author: Collin, Anwar, & Ronsmans, 2007, continued
Findings:
Utilization of antenatal care increased substantially, from 24% in 1991 to 60% in 2004.
Despite a relatively greater increase in rural than urban areas, utilization remained much lower among the poorest rural women without
formal education (18%) compared with the richest urban women with secondary or higher education (99%).
Within these trends there were huge inequalities; a health professional attended 86% of live births among the richest urban women with
secondary or higher education, and 35% were delivered by caesarean section, compared with 2% and 0.1% respectively of live births
among the poorest rural women without formal education.
Conclusion:
Despite commendable progress in improving uptake of antenatal care, and in equipping health facilities to provide emergency obstetric
care, the very low utilization of these facilities, especially by poor women, is a major impediment to meeting MDG-5 in Bangladesh.
Limitations:
Data on the area of residence in the three DHS surveys were not strictly comparable because, unlike the 1999–2000 survey, the 1993–
1994 and 1996–1997 surveys categorized "other urban" areas as "rural".
The recall periods were different; 3 years for the first survey, 5 years for the other surveys.

Page | 85
Author: Do, Thi, Tran, Phonvisay, & Oh, 2018
Type of study;
Country; Year of
analysis
Background context of the
country
Study objectives Measure of SES Analytic methods
for SES inequality
assessment
Variables of interest
Lao People’s
Democratic
Republic; 2000 –
2012
Lao People’s Democratic
Republic (Lao PDR) is one of
the ten “fast-track” countries
who are doing better than
comparable countries in
reducing maternal mortality.
Maternal mortality ratio has
decreased substantially in
the last decade, from 1100
(in 1990) to 220 (in 2012) per
100,000 live births.
The government has put
maternal health care
services as the entry point to
strengthen the healthcare
system in the Health Sector
Reform Agenda.
Examine the
differences in using
maternal health care
services across
different
socioeconomic
subgroups in Lao PDR.
HH wealth
index quintile
Multiple Indicator
Cluster Survey
Logistic regression
Dependent variable
Antenatal care
Delivery services
with skilled birth
attendants
Independent variable
Education
Wealth
Ethnicity
Residential areas

Page | 86
Author: Do, Thi, Tran, Phonvisay, & Oh, 2018, continued
Findings:
There were no educational disparity changes from 2000 to 2012, and there were aggravations in the disparities between ethnic groups
as well as worsening disparities between the rich and poor.
Compared to the mothers who had never attended school, the mothers who had attended primary school were more likely to use ANC
[OR = 2.32; 95% CI: 1.97–2.74] and more likely delivery with an SBA [OR = 1.40; 95% CI: 1.12–1.70].
Women with secondary or higher education were more likely to use ANC [OR = 4.58; 95% CI: 3.70–5.68] and more likely to use an SBA
[OR = 3.71; 95% CI: 2.96–4.65].
The richest quintile women were more likely to use antenatal services [OR = 3.41; 95% CI: 2.53–4.59] and more likely to deliver with an
SBA [OR = 8.21; 95% CI: 5.99–11.27] compared to the poorest quintile women.
Conclusion:
Efforts to increase maternal health service utilisation in poor and minority ethnic groups should be emphasised to reduce social
inequalities, thus encompassing multiple-sector interventions rather than focusing only on health sector-related interventions.
Limitations:
The data collected are from respondents’ recall information, which was not validated with other objective data sources such as health
facilities’ ANC and SBA registration data.

Page | 87
Table 1: Empirical studies of socioeconomic inequalities in the use of maternal health care in ‘multi-country studies’
Author: McTavish, Moore, Harper, & Lynch, 2010
Type of study;
Country; Year of
analysis
Background context of the
country
Study objectives Measure of SES Analytic methods
for SES inequality
assessment
Variables of interest
Cross-sectional
Study; sub-
Saharan Africa
(SSA); 2002 –
2003
Countries
included:
Burkina Faso,
Chad, Congo,
Côte d’Ivoire,
Ghana, Kenya,
Malawi, Mali,
Namibia,
Senegal, South
Africa, Swaziland,
Zambia, and
Zimbabwe.
Countries with low
compared to high female
literacy in SSA are
characterized by greater
gender-based inequality.
Female literacy at the
national level may be
associated with MHC use
due to a) Greater maturity
of the system b) increased
resources c) Autonomy to
all women.
Countries where women’s
economic status is higher
and where resources are
more available for women
to become educated may
also place greater legal
protections and more
progressive policies that
enable women to access
and use HH resources.
Importance of
national female
literacy on women’s
MHC use in
continental SSA
Permanent
income was
estimated at the
HH level for each
respondent
using asset-
based approach
and categorized
into quintiles
World Health Survey
Multilevel logistic
regression
Individual Variables:
Permanent HH
income
Years of schooling
Country-level
variable:
National female
literacy = proxy for
women’s status
and resources
available to
women in a
country

Page | 88
Author: McTavish, Moore, Harper, & Lynch, 2010, continued
Findings:
SSA mean female literacy of 55%
Among 11 661 respondents, 16.2% reported not using MHC during their last pregnancy.
Within countries, for each increase in a mothers’ HH income (Odds Ratio: 0.87; 95% Confidence Interval: 0.80, 0.96) and for each extra
year of schooling (OR: 0.95; 95% CI: 0.93, 0.96) the lower the probability of lacking MHC
Between Countries:
The magnitude of the association of income with lack of MHC varied across the 14 SSA countries.
Mothers residing in higher female literacy level countries had a lower level probability of lack of MHC (OR: 0.97; 95% CI: 0.95, 0.99) and
mothers residing in countries with higher levels of Gross Domestic Product per capita had a higher probability of lack of MHC (OR: 1.59;
95% CI: 1.07, 2.36)
Malawi and Zambia showed the opposite: The study found an increase in reported use of MHC irrespective of a lower GDP/c
In countries with high female literacy such as Namibia and South Africa, there are no differences between income quintiles and the
probability of lack of MHC care
Conclusions:
Within countries, education and HH income were associated with the use of MHC.
National female literacy modified the association between income and non-use of MHC facilities. i.e. the strength of the association
between income and lack of maternal health care was weaker in countries with higher female literacy.
In countries with higher female literacy, such as Zimbabwe and South Africa, where reported female literacy was over 80%, inequalities
in HH income between the poorest and richest quintiles were negligible.
Limitations:
Study restricted to SSA countries that participated in the World Health Survey.
No study to compare findings to as analysis was done both within and across countries.

Page | 89
Author: Tsala Dimbuene et al., 2017
Type of study;
Country; Year of
analysis
Background context of the
country
Study objectives Measure of SES Analytic methods
for SES inequality
assessment
Variables of interest
Cross-sectional
study; the
Democratic
Republic of the
Congo (2013–
14), Egypt (2014),
Ghana
(2014), Kenya
(2014), Nigeria
(2013) and
Zimbabwe (2015
In the period between 1980
and 2008, Zimbabwe has
seen, on average, an
increase of 5.5% in maternal
mortality per year probably
due to the high proportion of
adults
affected by AIDS
In the same period more
than 50% of
all maternal deaths during
the period occurred in six
countries in 2008, including
Nigeria
and the Democratic Republic
of the Congo
Addressed the
associations between
women’s education
and maternal health
service utilisation
through a lens of
inequities at the
individual level in
different social and
cultural
contexts.
Household
Wealth Index
Three SES strata
were defined as
follows: Poor
(40%), Middle
(40%) and
Rich (20%).
Demographic and
Health Surveys
Logistic regression
models
Dependent
variables
the antenatal care
provider,
the timing of first
antenatal care visit,
the frequency of
antenatal care
visits,
place of delivery
presence of a birth
attendant.
Independent
variable:
Maternal education
Employment status
Marital status
Health insurance

Page | 90
Author: Tsala Dimbuene et al., 2017
Findings:
findings revealed country-specific variations in maternal health service utilization, and for most indicators, there was a clear gradient
among socioeconomic strata
Women living in better-off households exhibited greater access to, and utilization of, maternal health services
In the six countries, the associations between women’s education and frequency of antenatal care visits (i.e. at least four visits) were
positive
women’s education was positively and significantly associated with the likelihood of health facility delivery across different SES groups.
In Egypt, Nigeria and, to some extent in Zimbabwe, women’s education was significantly (p<0.01) associated with the likelihood of having
a doctor as a skilled birth attendant.
Conclusions:
Multivariate analyses revealed that women’s education had a positive association with the type of antenatal care provider, timing and
frequency of antenatal care visits, place of delivery and presence of a skilled birth attendant at delivery.
The findings also showed that many other factors (results not shown) are at play and need to be taken into account for a thorough
understanding of the relationship between women’s education and maternal health service utilization outcomes, and for the
development of sustainable social and health policies aimed at improving maternal and child health while promoting an equity
approach.
Limitations:
The cross-sectional nature of the data limited the possibility of drawing any conclusion from the analyses about causation.

Page | 91
Author: Goli & Singh, 2017
Type of study;
Country; Year of
analysis
Background context of the
country
Study objectives Measure of SES Analytic methods
for SES inequality
assessment
Variables of interest
Cross-sectional
study;
Bangladesh,
Ethiopia, Nepal
and Zimbabwe;
2010 to 2011
South Asia (Nepal and
Bangladesh) and sub-
Saharan Africa (Zimbabwe
and Ethiopia) contribute 29%
and 56% respectively to the
global burden of maternal
deaths, together accounting
for 245,000 maternal deaths.
Within these regions, the
countries are in the top fifty
in terms of levels of maternal
mortality, and in the bottom
fifth in rankings of recent
progress in maternal
mortality decline, based on
the World Health
Organization 2015 report
The study quantified
the contributions of
the socioeconomic
determinants of
inequality to the
utilisation of maternal
health care services in
four countries in
diverse geographical
and cultural settings:
Household wealth
quintile
contrasted using
household assets.
Demographic and
Health Surveys
Decomposition
model
Concentration
index (CI)
Concentration
curves
Dependent variables
Less than three
ANC visits
No Institutional
delivery
No Postnatal care
Independent
variables
place of residence
mother’s literacy
level
Mother’s Level of
education
Husband’s
education level
Child’s birth order
Women’s work
status
Women’s risky age

Page | 92
Author: Goli & Singh, 2017, continued
Findings:
Although maternal health care was poorer among lower socioeconomic status groups, the level of CI varied across the different countries
for the same outcome indicator: CI of −0.1147, −0.1146, −0.2859 and −0.0638 for <3 antenatal care visits; CI of −0.1338, −0.0925, −0.1960
and −0.2531 for non-institutional delivery; and CI of −0.1153, −0.0370, −0.1817 and −0.0577 for no postnatal care within 2 days of delivery
for Bangladesh, Ethiopia, Nepal and Zimbabwe, respectively.
Analyses found that for all four countries the plotted CI curves diverged from the line of equity for all three maternal health indicators,
indicating that the under-utilisation or non-utilization of maternal health care was heavily concentrated among relatively poor women.
In terms of specific outcomes with regard to inequality in ANC visits, the distance from the line of equity to the line of concentration
curve was greatest in Nepal (CI=−0.2859) relative to Bangladesh (CI=−0.1147), Ethiopia (CI=−0.1146) and Zimbabwe (CI=−0.0632).
In the case of institutional delivery, inequality was highest in Zimbabwe with a CI value of −0.2527, followed by Nepal (CI=−0.1959),
Bangladesh (CI=−0.1337) and Ethiopia (CI=−0.03702).
Nepal also had the greatest inequalities in postnatal care visits within 2 days of delivery (CI=−0.1816), followed by Bangladesh
(CI=−0.1153), Zimbabwe (CI=−0.0577) and Ethiopia (CI=−0.0370).
Ethiopia had the least inequality with regard to postnatal care within 2 days of delivery.
The variables mother’s illiteracy, partner’s illiteracy, poor economic status and birth order 3+ were found to be positively associated with
<3 ANC visits in all four countries.
Conclusion:
Key contributing factors for socioeconomic inequalities in maternal health care varied across the selected countries.
Policy initiatives must consider factors such as economic status, education level and regional disadvantages to reduce the burden of
maternal mortality in low- and middle-income countries.
Limitations:
Recall bias

Page | 93
Discussions
Commitments from MDGs to SDGs have enhanced emphasis on maternal health care service
strengthening, especially in low-to-middle-income countries and low-income countries. There is
an evident transition in the promotion of the use of all three components of MHC (i.e. ANC, SBA
and PNC) where there previously was a single approach and effort to each of these services
(Wang & Hong). While these services are believed to better the health outcomes of pregnant
women, and their babies and numerous studies have repeatedly demonstrated the importance
of these services, their use has not been universal and varied by countries.
The focus of this literature review is narrowed mainly on the relationship between SES and the
use of ANC. Following data extraction, countries were categorized into one of three divisions
namely, 1) High-income countries (Table 1), 2) Low-to-middle-income countries (Table 2), 3) Low-
income countries (Table 3) as classified according to the 2014 World Development Indicators
(World Bank, 2014). For the sake of this review, a fourth category was formed, classified as multi-
country studies (Table 4).

Page | 94
High-income countries
Study design
The two studies conducted in high-income countries used different study designs. The study
conducted in Italy employed a cross-sectional design conducted on 37 000 women (Chiavarini et
al., 2014) whereas the study conducted in the USA used a retrospective descriptive design on 439
women (Park et al., 2007).
Measure of SES
Employment and level of education were often used as a measure of SES in high-income countries
as opposed to asset index in the majority of studies conducted in low-income countries and low-
to-middle-income countries (Park et al., 2007; Chiavarini et al., 2014). Another method Park et
al., (2007) used not seen in any of the studies included in this literature review was the method
of payment as a measure of SES, alluding to having medical insurance or not.
Analytic methods for SES inequality assessment
The study conducted in Italy employed standard and multilevel regression models as a means of
assessing SES inequalities in the use of ANC (Chiavarini et al., 2014). On the other hand, Park et
al., (2007) conducted a Pearson correlation and Chi-square methods to determine the correlation
between the total number of prenatal visits and SES from the Nurse-Midwifery Clinical Data Set.
Findings of the review
From the search results, studies that were based in high-income countries were focused rather
on the quality of care women received as opposed to the number of ANC visits attained in relation
to SES. This is because coverage of ANC in high-income countries was almost always universal
Page | 95
and disparities did not follow SES differences but rather demographic patterns such as race and
age, which were beyond the scope of this review.
Nonetheless, the recommended minimum number of ANC visits in high-income countries varied
considerably ranging from four to fourteen visits. For instance, Chiavarini et al., (2014) and Park
et al. (2007) show varying contexts in terms of the number of recommended prenatal visits. The
minimum number of recommended prenatal visits in the USA was 14 for low-risk pregnant
women as per the American College of Obstetrics and Gynaecology (ACOG) guidelines (Park et
al., 2007). On the other hand, in Italy, the recommended number of prenatal visits was the same
as that recommended by the WHO, which is a minimum of four visits for pregnancy with no
complications (Chiavarini et al., 2014).
Unlike in low-income countries and low-to-middle-income countries, attaining the
recommended number of visits in high-income countries mirrored the differences in the type of
insurance women in question had access to (Chiavarini et al., 2014; Park et al., 2007). In the USA,
having private insurance significantly increased the likelihood of having more prenatal care visits
compared to women with other forms of public insurance (Park et al., 2007).
On the other hand, employment and level of education in high-income countries was consistent
with the existing body of knowledge, where higher education and employment of the mother
has been shown to enhance the use of ANC (Chiavarini et al., 2014; Park et al., 2007). In Italy in
particular, the strength of determination of the use of ANC by these predictor variables was the
same, i.e. education did not surpass employment in increasing use of ANC and vice versa
(Chiavarini et al., 2014).

Page | 96
Although Italy and USA are high-income countries, the policy implications of their findings
concurred with those in low-to-middle-income countries, where the focus is centred on
empowering women that are unemployed and poorly educated.
Low-to-middle-income countries
Study design
Majority of the studies employed a cross-sectional study design unless the authors took an
interest in qualitative data as well, for which a mixed-method (quantitative and qualitative)
approach was used. Use of mixed methods is seen in studies conducted in South Africa (Tsala
Dimbuene et al., 2017; Silal et al., 2012) and Mumbai - India (Alcock et al., 2015). Only a study
conducted in Ghana solely used a qualitative method in the form of a questionnaire, carried out
in only 200 women, qualifying it as a study with the least number of participants in all developing
countries (Akowuah et al., 2018). On the other hand, all the multi-country studies also used the
cross-sectional study design and the Demographic and Health Survey as a primary source of data,
except for the study that was conducted in sub-Saharan Africa that used the World Health Survey
(McTavish et al., 2010).Measures of SES
The asset-based household wealth index was a significant measure of SES. Some of the unique
factors included the type of house the mother lived in, the source of energy and ownership of
land and livestock (Alcock et al., 2015; Silal et al., 2012; Adeyanju et al., 2017). Authors used a
combination of these measures to determine the household economic status index, taking into
account the occupation of the mother and their spouse, with an except for Akowuah et al., (2018)
that only looked at the occupation status of the mother as the sole measure of SES.
Similarly, all other multi-country studies used the household wealth quintile constructed from
the household assets as a measure of SES and McTavish et al., (2010) estimated a permanent

Page | 97
income at the household level from each respondent by using an asset-based approach in sub-
Saharan African countries.
Analytic methods for SES inequality assessment
Logistic regression was used in assessing the relationship between MHC and SES across most of
the studies. In addition to this, a few authors (Viegas Andrade et al., 2012; Pathak et al., 2010;
Adeyanju et al., 2017) used concentration indices and concentration curves to quantify the extent
of inequality. Makate & Makate, (2017) deviated from using standard concentration indices and
made use of G-Erreygers corrected concentration indices as an analytic method for SES inequality
assessment. Goli & Singh, (2017) who did a multi-country analysis, used the concentration curve,
concentration indices and decomposition models as analytic methods.
Findings of the review
Factors that influence and promote the use of ANC in low-to-middle-income countries vary.
These include SES, age group, religion, parity and marital status. In the studies retrieved from
the literature search, low-to-middle-income countries followed the WHO recommended
guidelines of a minimum of four ANC visits for an uncomplicated pregnancy, except for Brazil with
a minimum of six ANC visits for an uncomplicated pregnancy (Viegas Andrade et al., 2012).
However, it is worth noting that although Brazil is classified as a low-to-middle-income country
(World Bank, 2014), it has one of the most unequal economies and these guidelines were
potentially reserved for richer communities (Viegas Andrade et al., 2012). Another exception to
the rules was a region in India called Mumbai, where at least three prenatal care checkups were
recommended locally for an uncomplicated pregnancy (Alcock et al., 2015).
From the search results as conducted in this literature review, there was an overrepresentation
of studies conducted in India as one of the low-to-middle-income countries with a high rate of

Page | 98
maternal mortality (Viegas Andrade et al., 2012). These studies focused on analysing the trends
of ANC utilisation, and although authors concurred on economic factors that influenced the
uptake of MHC or the lack thereof, they often had different contextual reasons on arriving at
their respective conclusions (Alcock et al., 2015; Arokiasamy & Pradhan, 2013). There were
striking SES inequalities in the use of ANC in different states across India with unemployed and
least educated women attaining a lower number of ANC visits and surprisingly, with religion
varying as an additional factor that perpetuated this evidence. For instance, while Alcock et al.,
(2015) showed that Muslim women were more likely to seek prenatal care and made up the
majority of the educated population, Arokiasamy & Pradhan (2013) argued that religion or caste
hindered the use of MHC, employability and economic empowerment of women.
In contrast to the many studies that showed that education of the mother further enhanced the
use of MHC (Pathak et al., 2010; Asamoah et al., 2014; Rashid et al., 2014; Tsawe & Susuman,
2014) there were authors that showed that in economically advanced states even illiterate
women received the full ANC coverage (Viegas Andrade et al., 2012; Silal et al., 2012). Makate &
Makate (2017) further added that while school appears to explain a fair share of the observed
inequalities in ANC use, its contribution has significantly declined over time according to a study
that was conducted in Zimbabwe looking at the period from 1994 to 2011. In a study conducted
in Nigeria, Adeyanju et al., (2017) consider education and literacy as two separate entities, with
education signifying the level of education a woman has attained and literacy signifying basic
ability to read and write. In their study, Adeyanju et al., (2017) noted an increase in literacy-
related inequality in MHC use and a decline in education-related inequality in MHC between 1990
and 2008 which agrees with a study conducted in Ghana by Asamoah et al., (2014) and
Arokiasamy & Pradhan (2013) in the State of Bihar in India. With regards to findings from the
multi-country studies (McTavish et al., 2010; Goli & Singh, 2017; Tsala Dimbuene et al., 2017),
education showed to be a prominent socioeconomic determinant of MHC utilization in the three
studies conducted in diverse geographical and cultural settings (Tsala Dimbuene et al., 2017; Goli
& Singh, 2017; McTavish et al., 2010). McTavish et al. conducted a study in 14 sub-Saharan
African countries analysing the importance of national female literacy and MHC use. In this study,

Page | 99
the authors conclude that for each extra year of schooling a mother attains, there is an increased
probability of MHC use (McTavish et al., 2010). This is in agreement with the notion that
women’s education will improve the status of the women’s ability to acquire wealth
independently and enhance the women’s autonomy in making decisions to seek health care and
identify danger signs during pregnancy (McTavish et al., 2010; Joshi et al., 2014; Tsala Dimbuene
et al., 2017; Tsegay et al., 2013).
With regards to household wealth, there were inconsistencies seen where in some instances the
difference in the frequency of ANC use was negligible between rural and urban areas despite the
huge differences in SES (Viegas Andrade et al., 2012; Arokiasamy & Pradhan, 2013; Asamoah et
al., 2014), as opposed to states in India where economic inequalities in the use of ANC was
significantly higher in rural mothers when compared to their urban counterparts (Pathak et al.,
2010).
Furthermore, although a close association is often seen between wealth and place of residence,
household income was viewed in isolation to the number of ANC visits. Household income
proved to be a significant determinant of ANC use (Akowuah et al., 2018; Makate & Makate,
2017) even in countries where free maternal health policies were in places such as Ghana
(Akowuah et al., 2018) and South Africa (Silal et al., 2012), suggesting that implementation of
interventions that seek to improve citizens’ SES are just as imperative in improving ANC
utilization. All low-to-middle-income countries included in this systematic review showed that
inequalities in use of ANC favoured wealthier women over their poorer counterparts (Adeyanju
et al., 2017; Asamoah et al., 2014; Rashid et al., 2014; Makate & Makate, 2017; Alcock et al.,
2015), and a few authors noted a sharp rise in this inequality in studies that considered change
over prolonged periods of time (Adeyanju et al., 2017; Asamoah et al., 2014; Makate & Makate,
2017). It is worth noting that in some instances, poor women received some form of prenatal
care even if it was not institutionalised or provided by a registered health professional (Rashid et
al., 2014).

Page | 100
Whilst an assumption can be made following this finding that the employment of the mother
would have a similar effect in increasing the use of ANC, this was not always the case as seen in
a study conducted by Arokiasamy & Pradhan (2013) where working women had lower use of ANC
because of “opportunity and monetary costs forgone” (Arokiasamy & Pradhan, 2013). Similarly,
the employment of the mother alone was not a sufficient determinant of use of ANC but also the
type of occupation. For instance, in a study conducted in South Africa, more self-employed than
private employees and even far more than government employees attained the recommended
four ANC visits (Tsawe & Susuman, 2014).
Another SES factor influencing the frequency of ANC visits was having access to health insurance
for the use of private care with the hope of avoiding poor service in public facilities. Poorer
women were not only disadvantaged in terms of less use of MHC facilities during pregnancy, but
when they did, they also spent a higher percentage of their household expenditure in maternal
care compared to women from wealthier households due to lack of medical insurance coverage
(Silal et al., 2012). In Mumbai, poorer women incurred catastrophic health spending by
borrowing money, trying to avoid poor public services and lack of choice for opting for a female
clinician (Alcock et al., 2015). Their use of private care also fed into their preference for a female
physician during consultations (Alcock et al., 2015).
Majority of these low-to-middle-income countries reported enforcement of interventions that
were put in place to improve the overall care of women during pregnancy (Adeyanju et al., 2017;
Tsawe & Susuman, 2014; Akowuah et al., 2018), however, only a few and already advantaged
socio-economic groups seemed to benefit from fast-growing economies and much of the poorer
populations continue to lack access to basic maternal care (Adeyanju et al., 2017).

Page | 101
Low-income Countries
Study Design
All studies conducted in low-income countries included in this literature review followed the
cross-sectional study design. Majority of the authors opted for the use of the Demographic and
Health Survey as a primary source of their data, except for two authors that used varying methods
in studies conducted in Ethiopia. The one author used the UNICEF’s Multiple Cluster Indicator
Survey Questionnaires on 492 women making this the smallest sample for low-income countries
(Wilunda et al., 2015), and the other author used a structured questionnaire based on an
unnamed existing tool with 1115 participants (Tsegay et al., 2013).
Measure of SES
For all studies in the review, wealth quintiles were used as a measure of a living standard,
constructed from information collected on access to utilities, sanitation facilities, durable asset
ownership and infrastructure. Two authors (Tsegay et al., 2013; Amin et al., 2010) extended this
measure of SES to the husband’s education and occupation.
Analytic Methods for SES inequality assessment
The use of regression models was standard in almost all the studies and odds ratios with each
covariate and odds ratios determined from logistic regression coefficients were often deployed
(Amin et al., 2010; Rurangirwa et al., 2017; Wilunda et al., 2015; Nigatu, 2011; Collin et al., 2007).
Memirie et al., (2016) and Mehata et al. (2017) used concentration curves and related
concentration indices as analytic methods for SES inequality assessment. In addition to this,
Mezmur et al., (2017) in a study conducted in Ethiopia, was the only author that used the
decomposition analysis to assess SES inequalities in the use of ANC.

Page | 102
Findings of the Review
Of the low-income countries included in the review, there was commendable progress in
improving uptake of antenatal care, with numerous authors reporting a significant decline in
maternal mortality, especially in Asian countries (Do et al., 2018; Collin et al., 2007; Mehata et
al., 2017). In pursuit of MDGs, these countries employed the outreach service workers’ system
and the media as a mechanism to improve ANC use (Sharma et al., 2007). However, in
Bangladesh and Ethiopia, despite the unprecedented efforts to equip health facilities in providing
MHC, the low utilization specifically by poor women continued to be an impediment to reaching
the MDG-5 (Collin et al., 2007; Mezmur et al., 2017) as seen in Nigeria, classified as one of the
low-to-middle-income countries (Adeyanju et al., 2017). In Ethiopia, the low utilization among
the poor was related to out-of-pocket spending either for services or for travelling to a health
facility by families (Memirie et al., 2016). Out-of-pocket spending comprised 80% of the health
expenditure in Ethiopia (Mezmur et al., 2017).
Within these low-income countries, there were no variations in terms of the number of visits
women were supposed to make because they all followed the WHO’s recommendation of at least
four ANC visits during an uncomplicated pregnancy. Under-utilization of ANC was heavily
concentrated among poor women and the inequalities in use of overall MHC was far more
significant compared to low-to-middle-income countries (Goli & Singh, 2017; Wang & Hong,
2015; Joshi et al., 2014; Mehata et al., 2017; Amin et al., 2010; Do et al., 2018; Wilunda et al.,
2015; Mezmur et al., 2017). In Ethiopia, this pro-rich use of ANC services was evident even in
public facilities (Memirie et al., 2016).
Women’s education was also significantly and positively associated with the likelihood of ANC
use (Tsala Dimbuene et al., 2017; McTavish et al., 2010; Wang & Hong, 2015; Joshi et al., 2014;
Mehata et al., 2017; Do et al., 2018; Memirie et al., 2016; Tsegay et al., 2013; Nigatu, 2011), thus
women with higher education were more likely to use adequate ANC. However, contrary to this,
and given that educated women were more likely to be employed and use adequate ANC (Joshi

Page | 103
et al., 2014; Nigatu, 2011), Sharma et al., (2007) in a study conducted in Nepal reported that
employed women irrespective of their type of employment were less likely to utilize maternal
health services. This is in conformity with the findings by Wilunda et al., (2015) where only a
smaller proportion (15%) of women with secondary or higher education as opposed to more
(43.8%) without education, attended all four ANC visits. Also, as seen with some of the low-to-
middle-income countries such as Zimbabwe (Makate & Makate, 2017), educational disparities in
use of ANC showed no changes between 2000 and 2012 in Lao People’s Democratic Republic (Do)
and no associations were reported in Rwanda (Rurangirwa et al., 2017). These authors conclude
that in their respective contexts, education is not a strong determinant of MHC use (Wilunda et
al., 2015; Do et al., 2018; Rurangirwa et al., 2017).
Having a health insurance, a spouse, their level of education and the type of occupation they
possessed showed more significant as a determinant of ANC use in low-income countries
compared to in high-income countries and low-to-middle-income countries (Joshi et al., 2014;
Amin et al., 2010; Tsegay et al., 2013). Having a husband with a non-farming occupation was
associated with enhanced use of ANC (Tsegay et al., 2013). As with high-income and low-to-
middle income countries, the use of ANC services was influenced by health insurance coverage
although this finding was only reported by one author (Wang & Hong, 2015) amongst all low-
income countries included in the review.
Recommendations given from these low-income countries mirrored that of the entire world,
where an emphasis is placed on poorer women, with less education and living in more remote
areas. There was a consensus within the authors that both economic and educational
empowerment of the disadvantaged mothers would have a positive effect on improved service
utilisation.

Page | 104
Conclusion
Majority of the studies included in this review used secondary data from the DHS where the
survey is based on maternal recall and are thus subject to recall bias. No study took account of
maternal complications as a reason to why some women would attend all recommended four
visits or more as per country guideline requirements.
Reported widening inequalities in the use of ANC over the years across countries point to the fact
that health programmes that are supposed to ensure universal access to all women have not
adequately addressed the issue faced particularly in low-to-middle-income countries and low-
income countries.
To my knowledge and apart from a few individual country studies seen in literature (Muchabaiwa
et al., 2012; Wabiri et al., 2016; Zere et al., 2010), there is a dearth of studies that analyse
inequality in the use of ANC services in SADC countries as a collective, also evidenced by this
review. Although there was representation of multi-country studies as per the literature review
search conducted in this study, these studies only focused on women’s education and MHC
services with little to no focus on other socioeconomic determinants of inequalities in MHC use,
and employed logistic regressions to arrive at their conclusions (McTavish et al., 2010; Tsala
Dimbuene et al., 2017). Goli & Singh (2017) looked at SES determinants of MHC utilisation but
only focused on four countries including Bangladesh, Ethiopia, Nepal and Zimbabwe. Thus a gap
exists for this comprehensive analysis, employing the same methods and databases for all SADC
countries.

Page | 105
References
Adeyanju, O., Tubeuf, S., & Ensor, T. (2017). Socio-economic inequalities in access to maternal and child healthcare in Nigeria: Changes over time and decomposition analysis. Health Policy and Planning (Vol. 32). https://doi.org/10.1093/heapol/czx049
Akowuah, J. A., Agyei-baffour, P., & Awunyo-vitor, D. (2018). Determinants of Antenatal Healthcare Utilisation by Pregnant Women in Third Trimester in Peri-Urban Ghana, 2018(2000). https://doi.org/10.1155/2018/1673517
Alcock, G., Das, S., More, N. S., Hate, K., More, S., Pantvaidya, S., … Houweling, T. A. J. (2015). Examining inequalities in uptake of maternal health care and choice of provider in underserved urban areas of Mumbai, India: A mixed methods study. BMC Pregnancy and Childbirth, 15(1), 1–11. https://doi.org/10.1186/s12884-015-0661-6
Amin, R., Shah, N. M., & Becker, S. (2010). Socioeconomic factors differentiating maternal and child health-seeking behavior in rural Bangladesh : A cross-sectional analysis, 1–11.
Arokiasamy, P., & Pradhan, J. (2013). Maternal health care in India: Access and demand determinants. Primary Health Care Research and Development, 14(4), 373–393. https://doi.org/10.1017/S1463423612000552
Asamoah, B. O., Agardh, A., Pettersson, K. O., & Östergren, P. (2014). Magnitude and trends of inequalities in antenatal care and delivery under skilled care among different socio-demographic groups in Ghana from 1988 – 2008.
Celik, Y., & Hotchkiss, D. R. (2000). The socio-economic determinants of maternal health care utilization in Turkey. Social Science & Medicine: An International Journal, 50(12), 1797–1806. Retrieved from http://libaccess.mcmaster.ca/login?url=http://search.proquest.com/docview/43664139?accountid=12347%5Cnhttp://sfx.scholarsportal.info/mcmaster?url_ver=Z39.88-2004&rft_val_fmt=info:ofi/fmt:kev:mtx:journal&genre=article&sid=ProQ:ProQ:indexislamicus&atitle=Th
Charlotte Warren, Pat Daly, Lalla Toure, P. M. (n.d.). Opportunities for Africa’s Newborns: Chapter 4- Postnatal Care, (Imci), 80–90. Retrieved from http://www.who.int/pmnch/media/publications/aonsectionIII_4.pdf
Chiavarini, M., Lanari, D., Minelli, L., & Salmasi, L. (2014). Socio-demographic determinants and access to prenatal care in Italy. BMC Health Services Research, 14(1), 1–10. https://doi.org/10.1186/1472-6963-14-174
Collin, S. M., Anwar, I., & Ronsmans, C. (2007). International Journal for Equity in A decade of inequality in maternity care : antenatal care , professional attendance at delivery , and caesarean section in Bangladesh ( 1991 – 2004 ), 9, 1–9. https://doi.org/10.1186/1475-9276-6-9
Do, N., Thi, H., Tran, G., Phonvisay, A., & Oh, J. (2018). Trends of socioeconomic inequality in using maternal health care services in Lao People ’ s Democratic Republic from year 2000 to 2012, 1–8.
Goli, S., & Singh, D. (2017). DECOMPOSING THE SOCIOECONOMIC I N E Q U A L I T Y I N U T I L I Z A T I O N OF MATERNAL HEALTH CARE SERVICES IN S E L E C T E D C O U N T R I E S O F S O U T H AS I A AN D SUB-SAHARAN AFRICA. https://doi.org/10.1017/S0021932017000530

Page | 106
hIarlaithe, M. O., Grede, N., de Pee, S., & Bloem, M. (2014). Economic and Social Factors are Some of the Most Common Barriers Preventing Women from Accessing Maternal and Newborn Child Health (MNCH) and Prevention of Mother-to-Child Transmission (PMTCT) Services: A Literature Review. AIDS and Behavior, 18, 516–530. https://doi.org/10.1007/s10461-014-0756-5
Joshi, C., Torvaldsen, S., Hodgson, R., & Hayen, A. (2014). Factors associated with the use and quality of antenatal care in Nepal: A population-based study using the demographic and health survey data. BMC Pregnancy and Childbirth, 14(1), 1–11. https://doi.org/10.1186/1471-2393-14-94
Kawachi, I., & Subramanian, S. V. (2002). A glossary for health inequalities, 647–653.
Lincetto, O., Mothebesoane-anoh, S., Gomez, P., & Munjanja, S. (2006). Antenatal Care, 51–62.
Magadi, M. A., Zulu, E. M., & Brockerhoff, M. (2003). The inequality of maternal health care in urban sub-Saharan Africa in the 1990s. Population Studies, 57(3), 347–366. https://doi.org/10.1080/0032472032000137853
Makate, M., & Makate, C. (2017). The evolution of socioeconomic status-related inequalities in maternal health care utilization: evidence from Zimbabwe, 1994–2011. Global Health Research and Policy, 2(1), 1. https://doi.org/10.1186/s41256-016-0021-8
McTavish, S., Moore, S., Harper, S., & Lynch, J. (2010). National female literacy, individual socio-economic status, and maternal health care use in sub-Saharan Africa. Social Science and Medicine, 71(11), 1958–1963. https://doi.org/10.1016/j.socscimed.2010.09.007
Mehata, S., Paudel, Y. R., Dariang, M., Aryal, K. K., Lal, B. K., Khanal, M. N., & Thomas, D. (2017). Trends and Inequalities in Use of Maternal Health Care Services in Nepal : Strategy in the Search for Improvements, 2017(2008). https://doi.org/10.1155/2017/5079234
Memirie, S. T., Verguet, S., Norheim, O. F., Levin, C., & Johansson, K. A. (2016). Inequalities in utilization of maternal and child health services in Ethiopia: the role of primary health care. BMC Health Services Research, 16(1), 51. https://doi.org/10.1186/s12913-016-1296-7
Mezmur, M., Navaneetham, K., Letamo, G., & Bariagaber, H. (2017). Socioeconomic inequalities in the uptake of maternal healthcare services in Ethiopia. BMC Health Services Research, 17(1), 13–17. https://doi.org/10.1186/s12913-017-2298-9
Nigatu, R. (2011). Antenatal and postnatal care service utilization in Southern Ethiopia: A population-based study. African Health Sciences, 11(3), 390–397.
Park, J. H., Vincent, D., & Hastings-Tolsma, M. (2007). Disparity in prenatal care among women of colour in the USA. Midwifery, 23(1), 28–37. https://doi.org/10.1016/j.midw.2005.08.002
Pathak, P. K., Singh, A., & Subramanian, S. V. (2010). Economic Inequalities in Maternal Health Care: Prenatal Care and Skilled Birth Attendance in India, 1992–2006. PLOS ONE, 5(10), e13593. Retrieved from https://doi.org/10.1371/journal.pone.0013593
Rai, R. K., Singh, P. K., & Singh, L. (2012). Utilization of Maternal Health Care Services among Married Adolescent Women: Insights from the Nigeria Demographic and Health Survey, 2008. Women’s Health Issues, 22(4), e407–e414. https://doi.org/10.1016/j.whi.2012.05.001
Rashid, M., Antai, D., & Antai, D. (2014). Socioeconomic position as a determinant of maternal healthcare utilization: A population-based study in Namibia. Journal of Research in Health Sciences,

Page | 107
14(3), 187–192.
Rurangirwa, A. A., Mogren, I., Nyirazinyoye, L., Ntaganira, J., & Krantz, G. (2017). Determinants of Poor Utilization of Antenatal Care Services among Recently Delivered Women in Rwanda: A Population Based Study. MCN The American Journal of Maternal/Child Nursing, 42(6), 366. https://doi.org/10.1097/NMC.0000000000000382
Sharma, S. K., Sawangdee, Y., & Sirirassamee, B. (2007). Access to health: Women’s status and utilization of maternal health services in Nepal. Journal of Biosocial Science, 39(5), 671–692. https://doi.org/10.1017/S0021932007001952
Silal, S. P., Penn-Kekana, L., Harris, B., Birch, S., & McIntyre, D. (2012). Exploring inequalities in access to and use of maternal health services in South Africa. BMC Health Serv Res, 12, 120. https://doi.org/10.1186/1472-6963-12-120
Singh, A., Padmadas, S. S., Mishra, U. S., Pallikadavath, S., Johnson, F. A., & Matthews, Z. (2012). Socio-economic inequalities in the use of postnatal care in india. PLoS ONE, 7(5). https://doi.org/10.1371/journal.pone.0037037
Tsala Dimbuene, Z., Amo-Adjei, J., Amugsi, D., Mumah, J., Izugbara, C. O., & Beguy, D. (2017). Women’S Education and Utilization of Maternal Health Services in Africa: a Multi-Country and Socioeconomic Status Analysis. Journal of Biosocial Science, 1–24. https://doi.org/10.1017/S0021932017000505
Tsawe, M., & Susuman, A. (2014). Determinants of access to and use of maternal health care services in the Eastern Cape, South Africa: a quantitative and qualitative investigation. BMC Research Notes, 7(1), 723. https://doi.org/10.1186/1756-0500-7-723
Tsegay, Y., Gebrehiwot, T., Goicolea, I., Edin, K., Lemma, H., & Sebastian, M. S. (2013). Determinants of antenatal and delivery care utilization in Tigray region , Ethiopia : a cross-sectional study, 1–10.
UNICEF. (2018). Monitoring the situation of children and women - Antenatal care. Retrieved from https://data.unicef.org/topic/maternal-health/antenatal-care/
Viegas Andrade, M., Noronha, K., Singh, A., Rodrigues, C. G., & Padmadas, S. S. (2012). Antenatal care use in Brazil and India: Scale, outreach and socioeconomic inequality. Health and Place, 18(5), 942–950. https://doi.org/10.1016/j.healthplace.2012.06.014
Wang, W., & Hong, R. (2015). Levels and determinants of continuum of care for maternal and newborn health in Cambodia-evidence from a population-based survey. BMC Pregnancy and Childbirth, 15(1), 1–9. https://doi.org/10.1186/s12884-015-0497-0
WHO. (2015). The Millennium Development Goals Summary 2015, 5.
Wilunda, C., Quaglio, G., Putoto, G., Takahashi, R., Calia, F., Abebe, D., … Atzori, A. (2015). Determinants of utilisation of antenatal care and skilled birth attendant at delivery in South West Shoa Zone , Ethiopia : a cross sectional study. Reproductive Health, 1–12. https://doi.org/10.1186/s12978-015-0067-y
World Bank. (2014). World Development Indicators 2014. World Bank Publications.

Page | 108
Section 3: Manuscript
Assessing Socio-economic inequalities in the use of
Antenatal care in the Southern African Development
Community

Page | 109
Abstract
Introduction
Despite the unprecedented efforts of national governments along with various NGOs to achieve
the third SDG, which is to reduce global maternal mortality to less than 70 per 100 000 live births
by 2030, developing countries seem to be lagging far behind in reaching this goal (UNDP, 2016).
This paper focuses on socioeconomic inequalities in the use of ANC services as an important
aspect of MHC in SADC countries.
Methods
The data used in this study are obtained from the Demographic and Health Survey (DHS). Three
mutually exclusive variables were created to assess ANC inequality, namely, 1) No ANC visits 2)
Less than four ANC visits and 3) At least four ANC visits. A fourth variable that assesses the actual
number of ANC visits that a pregnant woman had received was created and called ‘Intensity’.
ANC and SES using the wealth index were used to construct the concentration curves and indices
to determine whether health care utilization is concentrated among the poor or the rich.
Results
Over 70% of all who lived in rural areas had ‘0 ANC’, with Namibia and Tanzania as the only
exception to this finding. In four of the eleven countries, over 58.36% of women were married
and were likely to make an adequate number of ANC visits. Namibia and Lesotho are two of the
eleven countries that had a great majority of women educated up to the secondary level, 65.61%

Page | 110
and 49.90% of which attained at least 4 ANC visits, respectively. Women who worked in
agricultural settings had the least likelihood of attaining any ANC visits.
Discussions and conclusion
ANC use was consistently lower in women with no education, doing agricultural work and those
residing in rural areas in the SADC region. Overall, marriage is inconclusive in determining ANC
use. Inequality in wealth makes ANC utilization more predominant among the rich. Saving
mothers and babies is ultimately saving the population and knowledge of the patterns of
maternal health usage is imperative to draw relevant policies that are evidence-based.

Page | 111
Introduction
The burden of maternal mortality continues to plague sub-Saharan Africa (SSA) despite the
interventions to achieve the fifth Millennium Development Goal (MDG), which was to reduce
maternal mortality ratio by three quarters between 1990 and 2015 (1). Post-MDGs, the
Sustainable Development Goals (SDGs) set similar targets to address maternal health challenges
and to fill the remaining gaps (2). Despite the unprecedented efforts of national governments
along with the help from various non-governmental organizations (NGOs) to achieve the third
SDG, which is to reduce global maternal mortality to less than 70 per 100 000 live births by 2030,
developing countries seem to be lagging far behind in reaching this goal (UNDP, 2016).
Recognisably, the factors that affect maternal mortality are broader than access to maternal
health services. However, the continuum of care inclusive of the use of antenatal care (ANC)
services, skilled birth attendance (SBA) and postnatal care (PNC) services remain beneficial in
reducing maternal mortality and improving the health outcomes of newborns. In many
developing countries, access and provision of these services are still not universal (3).
The World Health Organization (WHO) reports that approximately 830 women die daily from
preventable causes related to pregnancy and childbirth (4). Even though most of the
interventions and funds have been directed towards low-middle income countries (5,6,7), about
99% of these maternal deaths occur in developing countries (4). Women from more deprived
communities, those with limited education, those with informal employment and those living in
rural areas bear the most burden (8,9). Also, women from poorer households access far less

Page | 112
maternal care compared to women from richer households (13,14,15). The positive correlation
between women’s capacity to earn money and their ability to use maternal health care (MHC)
services (12) remains a major challenge in many developing countries. Employed women not
only have greater autonomy over their health but also have exposure to relevant information
and knowledge on maternal and child health (13). These patterns are most apparent in
developing countries compared to developed countries, where even the most disadvantaged
women can use adequate maternal health services (15,16).
This paper focuses on the use of ANC services as an important aspect of MHC services. ANC is
usually the point of entry into the health system by pregnant women. In many cases, this is a
likely predictor of the use of SBA and the frequency of PNC visits (14,17,18). While studies that
explore the influence of Socioeconomic Status (SES) on the use of ANC have been carried out in
numerous SSA countries, a multi-country assessment of these patterns in Southern African
Development Community (SADC) countries, using the same method and a uniform source of data
has not been realised. This is particularly of concern because the deficit in knowledge of these
trends in this regard means there is no real form of evidence for which policies can be drawn and
informed, and the current study seeks to close this gap. Therefore, this study aims to make a
comprehensive assessment of the SES inequalities in the use of ANC in SADC countries.

Page | 113
Methods
Study population and a brief overview of health financing profile and MHC patterns in SADC
countries
The SADC is a body of countries with rich historical and cultural affinities. They share a subset of
goals, one of which is to improve the health of its people (18). The SADC region’s population is
over 340 million, and life expectancy remains within the range of 51 to 75 years (19). Indisputably,
the Demographic and Health Survey (DHS) were conducted in SADC countries with varying
national population sizes (see Table 1). The most populous country within this region is the
Democratic Republic of Congo with 81 million people, and the least populous country is Mauritius
with 1.2 million people (20) although not included in this study because of data unavailability.
The other countries excluded from this study because of lack of DHS data include Botswana,
South Africa and Seychelles.
Table 1.1: Sample size per country
# Country Abbreviation Survey year Population size(2017) *Sample size
1 Angola ANG 2015 - 2016 29,78 million 8 839
2 The Democratic
Republic of Congo
DRC 2013 - 2014 81,34 million 11 214
3 Lesotho LST 2014 2,233 million 949
4 Madagascar MDG 2008 - 2009 25,57 million 8 470
5 Malawi MLW 2015 - 2016 18,62 million 13 389
6 Mozambique MZB 2011 29,67 million 7 485
7 Namibia NAM 2013 2,534 million 3 119
8 Swaziland SWZ 2006 - 2007 1,367 million 2 069
9 Tanzania TAN 2015 - 2016 57,31 million 7 019
10 Zambia ZWB 2013 - 2014 17,09 million 9 217
11 Zimbabwe ZIM 2015 16,53 million 4 805
*Sample size = number of women aged 15-49 years

Page | 114
Despite the shared goals towards a common future between the SADC countries, they have
varying health financing profiles, which in turn have a direct influence on the use of ANC. For
instance, while out of pocket (OOP) payment is prominent for basic health needs in some
countries such as Zambia, Tanzania and Zimbabwe (23,24,25), it is relatively low and has gradually
decreased in other countries such as Malawi, Angola, Botswana, Mozambique and Namibia
(26,27,28,29,30). Malawi was previously noted to be one of the countries with the highest
maternal mortality rates in the world (29), but as a result of a decrease in OOP payments, there
has since been a decline in maternal deaths for which some of it is accredited to the removal of
user fees (29). Intuitively, countries with a low OOP payments have more funds or a greater
portion of government health expenditure as a percentage of total health expenditure, hence
less dependence on citizens to pay for their own basic health care.
Data source
The data used in this study are obtained from the Demographic and Health Survey (DHS) from
eleven of the fifteen SADC countries (see Table 1). This is primarily based on the availability of
the DHS data in these countries. In all the countries, the DHS is a cross-sectional survey with
nationally representative data using standardised questions to collect information mainly from
women of reproductive age (i.e. aged between 15 and 49 years) (30). Among other variables,
the DHS contains data on women’s sociodemographic and socioeconomic characteristics along
with MHC utilisation (30).

Page | 115
Study variables
Three mutually exclusive variables were created. Namely, 1) No ANC visits (i.e. when a woman
with a live birth in the specified period did not have any ANC visit; 0 ANC) 2) Less than four ANC
visits (i.e. having at least one ANC visit but less than 4 visits; 1-3 ANC) and 3) At least four ANC
visits (i.e. a woman with at least four ANC visit; ≥ 4 ANC). A fourth encompassing category (ANC
intensity) uses the actual number of ANC visits that a pregnant woman had received.
The DHS does not directly report information on household expenditure or income but contains
information on household assets or a wealth index (30). In this paper, the wealth index is used
as a proxy for socioeconomic status (SES) (30). This index was constructed from household asset
data, which comprised access to sanitation facilities, type of flooring material and source of
drinking water (30).
Analytic methods
Descriptive statistics
A comparative analysis of the utilisation of ANC in the eleven SADC countries in general and
separately by wealth quintiles was conducted to give a descriptive assessment of inequalities in
the use of antenatal care. This analysis uses equity stratifiers such as women’s marital status,
type of residence, highest education level, respondents' occupation and wealth index.

Page | 116
Assessing inequality in antenatal care utilization
Concentration indices and curves are used to examine whether the distribution of ANC utilisation
favours the poor or not (31).
Concentration curves
In this study, the two key variables used to construct the concentration curve include ANC as a
health variable of interest (i.e. 0 ANC, 1-3 ANC, ≥ 4 ANC and ANC intensity) and SES using the
wealth index. The concentration curve plots the cumulative percentage of ANC use (y-axis)
against the cumulative percentage of the population of each country, ranked from poorest to
richest on the x-axis (32).
Figure 1: Concentration curve with a hypothetical example of health care utilisation
Source: Phiri & Ataguba (33)

Page | 117
As shown in Figure 1, if everyone irrespective of their wealth quintile attains the same number
of ANC visits (health utilisation), the concentration curve will be a 45-degree line, also known as
the line of equality. On the contrary, if the ANC variable takes a higher (lower) value among the
richer people, the concentration curve will lie below (above) the line of equality (32).
Concentration Indices
The concentration index is defined as twice the area between the concentration curve and the
line of equality (34). It was used to assess the overall extent of inequality in the use of ANC by
SES. The index ranges from -1 to +1 (31). A negative index, corresponding to the concentration
curve lying above the line of equality, indicates a higher distribution of utilisation among the
poor and a positive index signifies a higher distribution of utilisation among the rich (33).

Page | 118
Results
Table 2.1: Descriptive statistics for ‘0 ANC’ visits
ANG DRC LST MDG MLW MZB NAM SWZ TAN ZMB ZIM
Residence Type (%)
Urban 26.63 16.64 31.41 4.37 7.75 11.51 50.34 14.48 23.17 24.27 20.80
Rural 73.37 83.36 68.59 95.63 92.25 88.49 49.66 85.52 76.83 75.73 79.20
Marital status (%)
Never married 17.09 4.51 21.33 5.81 11.77 3.70 41.14 44.45 10.47 5.35 3.68
Married
Living together
14.72 65.29 44.85 68.21 64.04 56.60 13.97 29.53 47.43 79.19 82.85
59.77 17.81 9.03 7.67 8.66 26.15 40.38 14.94 33.32 0.54 4.21
Education (%)
No education 59.28 28.82 1.74 49.74 21.30 55.06 21.80 10.22 32.61 34.90 1.23
Primary 33.86 53.26 60.96 43.45 72.27 42.68 33.22 58.06 53.18 52.12 46.65
Secondary 6.41 17.84 35.15 6.81 6.42 2.26 41.80 26.56 12.26 12.99 51.79
Employment (%)
Not working 18.87 15.58 0.00 6.00 44.57 49.79 63.71 60.36 18.94 26.84 43.97
Agriculture 59.88 61.86 13.06 84.21 34.32 43.96 3.04 5.24 54.36 51.98 17.41
Domestic services 16.95 20.42 62.69 3.49 2.79 5.55 22.03 26.12 11.57 19.25 35.13
Wealth (%)
Poorest 48.13 40.15 14.98 49.56 35.81 40.56 26.71 31.33 33.03 42.02 30.89
Poorer 34.37 25.06 30.44 26.50 18.78 27.71 25.75 33.14 16.81 22.90 23.67
Middle 11.69 18.03 39.30 12.82 25.13 18.78 15.76 19.20 16.17 13.08 17.95
Richer 3.72 10.16 7.49 7.56 10.86 8.43 16.85 9.69 17.31 18.81 23.84
Richest 2.09 6.60 7.78 3.56 9.42 4.52 14.93 6.64 16.69 3.19 3.66

Page | 119
Table 2.2: Descriptive Statistics for ‘1-3 ANC’ visits
ANG DRC LST MDG MLW MZB NAM SWZ TAN ZMB ZIM
Residence Type (%)
Urban 58.36 25.69 36.67 7.40 11.95 25.95 43.66 18.40 21.86 37.87 34.08
Rural 41.64 74.31 63.33 92.60 88.05 74.05 56.34 81.60 78.14 62.13 65.92
Marital status (%)
Never married 17.22 5.44 13.19 3.42 4.68 4.83 47.87 50.08 6.45 10.24 7.95
Married
Living together
13.34 60.75 69.15 76.53 77.05 57.24 17.23 32.65 56.89 78.09 76.96
59.60 24.20 0.00 7.87 5.33 25.41 29.15 12.81 24.95 0.51 4.43
Education (%)
No education 28.91 20.30 0.32 24.25 13.33 38.76 8.74 9.38 22.46 11.02 0.91
Primary 45.60 45.77 47.33 60.15 67.30 52.57 31.48 34.22 66.18 54.17 23.39
Secondary 24.65 33.40 48.24 15.21 18.55 8.48 57.03 54.08 11.16 32.15 66.80
Employment (%)
Not working 26.88 18.59 0.00 6.40 30.92 53.72 62.97 59.59 13.76 42.86 50.28
Agriculture 35.56 56.37 16.27 78.87 44.63 33.94 0.94 3.69 61.98 31.36 12.19
Domestic services 32.96 21.72 46.60 6.90 6.08 11.21 27.68 25.07 7.12 21.40 30.65
Wealth (%)
Poorest 21.38 22.54 14.84 26.04 24.61 25.05 26.76 23.36 26.39 23.61 23.77
Poorer 29.17 23.39 20.59 24.48 22.74 22.91 21.43 21.36 23.52 21.25 21.01
Middle 27.53 22.03 23.90 22.47 19.83 20.22 22.27 21.62 20.88 21.09 13.89
Richer 14.73 20.06 28.93 18.58 18.54 19.41 20.52 17.78 17.62 20.79 28.36
Richest 7.20 11.98 11.74 8.43 14.28 12.41 9.03 15.88 11.58 13.27 12.96

Page | 120
Table 2.3: Descriptive Statistics for ‘≥ 4 ANC’ visits
ANG DRC LST MDG MLW MZB NAM SWZ TAN ZMB ZIM
Residence Type (%)
Urban 77.00 40.05 45.90 17.71 16.71 34.63 52.43 24.70 37.65 38.08 33.48
Rural 23.00 59.95 54.10 82.29 83.29 65.37 47.57 75.30 62.35 61.92 66.52
Marital status (%)
Never married 17.64 6.71 9.70 2.56 3.05 5.91 47.44 36.73 7.89 9.16 3.92
Married 13.96 61.03 76.89 79.60 78.54 54.77 22.90 43.31 58.36 79.54 81.62
Living together 59.32 23.04 1.39 7.05 4.90 27.38 24.32 14.15 20.55 0.93 3.60
Education (%)
No education 16.56 13.72 0.83 17.39 11.43 29.97 4.19 7.96 15.38 9.08 1.15
Primary 36.75 37.14 34.58 52.48 63.80 50.98 19.21 33.05 63.75 53.26 29.69
Secondary 42.10 45.96 51.29 27.95 21.76 17.86 68.37 51.44 19.39 32.61 62.81
Employment (%)
Not working 30.48 20.90 0.00 9.64 27.06 52.49 49.98 53.81 17.90 42.08 46.27
Agriculture 18.74 43.85 10.95 64.53 43.90 28.87 1.64 4.13 45.63 30.55 11.41
Domestic
services
41.34 29.17 44.40 12.57 7.56 14.30 31.38 26.41 8.88 20.67 31.96
Wealth (%)
Poorest 10.92 17.13 7.46 16.55 22.26 16.75 19.22 17.09 16.69 20.45 20.36
Poorer 16.06 19.43 13.52 18.10 20.82 17.87 19.09 19.43 17.10 20.81 18.37
Middle 22.32 19.59 18.99 19.43 18.53 19.14 19.94 19.46 17.50 20.42 18.03
Richer 26.67 18.98 24.18 20.67 17.75 23.13 22.67 21.39 22.24 18.21 22.61
Richest 24.04 24.88 35.85 25.25 20.63 23.12 19.08 22.62 26.46 20.10 20.63

Page | 121
Table 3: Concentration Indices showing wealth-related inequalities in the use of antenatal care
# Country 0 ANC 1-3 ANC ≥ 4 ANC ANC intensity
1. Angola -0.4915 (0.0119)
-0.1530 (0.0123)
0.1930 (0.0043)
0.1814 (0.0035)
2. DRC -0.2977 (0.1560)
-0.0529 (0.0064)
0.1082 (0.0056)
0.0701 (0.0032)
3. Lesotho -0.3855 (0.0830)
-0.2094 (0.0364)
0.0816 (0.0106)
0.0968 (0.0095)
4. Madagascar -0.4029 (0.0194)
-0.0981 (0.0074)
0.1539 (0.0061)
0.1001 (0.0032)
5. Malawi -0.1855 (0.0366)
-0.0371 (0.0052)
0.0413 (0.0049)
0.0193 (0.0022)
6. Mozambique -0.3397 (0.0205)
-0.0825 (0.0082)
0.1249 (0.0063)
0.0878 (0.0033)
7. Namibia -0.1203 (0.0499)
-0.1397 (0.0250)
0.0309 (0.0049)
0.0671 (0.0059)
8. Swaziland -0.3315 (0.0767)
-0.1014 (0.0294)
0.0301 (0.0060)
0.0495 (0.0053)
9. Tanzania -0.1099 (0.0480)
-0.1259 (0.0072)
0.1206 (0.0066)
0.0586 (0.0027)
10. Zambia -0.2942 (0.0508)
-0.0385 (0.0070)
0.0365 (0.0053)
0.0244 (0.0021)
11. Zimbabwe -0.2301 (0.0314)
-0.0490 (0.0180)
0.0311 (0.0047)
0.0548 (0.0043)
Standard errors in parenthesis All Concentration Indices significant at the 1% level

Page | 122
Figure 2: Concentration curves showing the cumulative share of ANC utilization in SADC countries.
20%
60%
80%
40%
100%
0%C
umul
ativ
e Sh
are
of A
NC
Util
izat
ion
0% 20% 40% 60% 80% 100%Cumulative Share of Population Ranked by SES
45˚ line 0 ANC
1-3 ANC ≥ 4 ANC
Intensity
Concentration Curves for Angola
0%20
%40
%60
%80
%10
0%C
umul
ativ
e Sh
are
of A
NC
Util
izat
ion
0% 20% 40% 60% 80% 100%Cumulative Share of Population Ranked By SES
45˚ line 0 ANC
1-3 ANC ≥ 4 ANC
Intensity
Concentration Curves for DRC0%
20%
40%
60%
80%
100%
Cum
ulat
ive
Shar
e of
AN
C U
tiliz
atio
n
0% 20% 40% 60% 80% 100%Cumulative Share of Population Ranked By SES
45˚ line 0 ANC
1-3 ANC ≥ 4 ANC
Intensity
Concentration Curves for Lesotho
0%20
%40
%60
%80
%10
0%C
umul
ativ
e Sh
are
of A
NC
Util
izat
ion
0% 20% 40% 60% 80% 100%Cumulative Share of Population Ranked By SES
45˚ line 0 ANC
1-3 ANC ≥ 4 ANC
Intensity
Concentration Curves for Madagascar
A B
C D

Page | 123
0%20
%40
%60
%80
%10
0%C
umul
ativ
e Sh
are
of A
NC
Util
izat
ion
0% 20% 40% 60% 80% 100%Cumulative Share of Population Ranked By SES
45˚ line 0 ANC
1-3 ANC ≥ 4 ANC
Intensity
Concentration Curves for Malawi
0%20
%40
%60
%80
%10
0%C
umul
ativ
e Sh
are
of A
NC
Util
izat
ion
0% 20% 40% 60% 80% 100%Cumulative Share of Population Ranked By SES
45˚ line 0 ANC
1-3 ANC ≥ 4 ANC
Intensity
Concentration Curves for Mozambique0%
20%
40%
60%
80%
100%
Cum
ulat
ive
Shar
e of
AN
C U
tiliz
atio
n
0% 20% 40% 60% 80% 100%Cumulative Share of Population Ranked By SES
45˚ line 0 ANC
1-3 ANC ≥ 4 ANC
Intensity
Concentration Curves for Namibia
0%20
%40
%60
%80
%10
0%C
umul
ativ
e Sh
are
of A
NC
Util
izat
ion
0% 20% 40% 60% 80% 100%Cumulative Share of Population Ranked By SES
45˚ line 0 ANC
1-3 ANC ≥ 4 ANC
Intensity
Concentration Curves for Swaziland
E F
G H

Page | 124
0%20
%40
%60
%80
%10
0%C
umul
ativ
e Sh
are
of A
NC
Util
izat
ion
0% 20% 40% 60% 80% 100%Cumulative Share of Population Ranked By SES
45˚ line 0 ANC
1-3 ANC ≥ 4 ANC
Intensity
Concentration Curves for Tanzania
0%20
%40
%60
%80
%10
0%C
umul
ativ
e Sh
are
of A
NC
Util
izat
ion
0% 20% 40% 60% 80% 100%Cumulative Share of Population Ranked By SES
45˚ line 0 ANC
1-3 ANC ≥ 4 ANC
Intensity
Concentration Curves for Zambia0%
20%
40%
60%
80%
100%
Cum
ulat
ive
Shar
e of
AN
C U
tiliz
atio
n
0% 20% 40% 60% 80% 100%Cumulative Share of Population Ranked By SES
45˚ line 0 ANC
1-3 ANC ≥ 4 ANC
Intensity
Concentration Curves for Zimbabwe
I J
K

Page | 125
Descriptive statistics
Rural vs urban residence and ANC Utilization
In ten of the SADC countries included in this study, there was an overrepresentation of
women who lived in rural areas, the majority of which were not attending any ANC visits as
opposed to those living in urban areas making the recommended number of four ANC visits.
Consequently, over 70% of all who lived in rural areas had ‘0 ANC’, with Namibia and
Tanzania as the only exception to this finding. Although not profoundly different from ‘0
ANC’ use, attaining ‘1 – 3 ANC’ for rural Namibian and Tanzanian women was more popular
compared to all other countries included in the study. However, use of adequate or ‘≥ 4
ANC’ was similar in all other countries specifically for urban women except for Zimbabwe
where even the urban population (34.08%) were not making the recommended number of
four visits (see Table 2.2).
Marital Status
Two (Angola and Namibia) out of eleven countries had the lowest proportion of married
women with 13.97% and 21.71%, respectively. All other countries had well over 40% of the
women included in the survey marked as ‘Married’. Study data showed that in Angola
majority of couples cohabitate, and their use of ANC is equally weighted across all mutually
exclusive categories, i.e. neither ‘0 ANC’, ‘1-3 ANC’ nor ‘≥ 4 ANC’ dominated in the outcome.
Women living with their partners were therefore just as likely not to make any ANC visits as
they were likely to make adequate ANC visits. This was not the case in Namibia, where a
greater proportion (40.38%) of women ‘cohabitating’ did not make any ANC visits (see Table
2.1). Majority in Namibia (47.24%) and Swaziland (39.02%) as outlined in Table 2.2 were

Page | 126
‘never married’ and did not live with their partners, and these women were more likely to
have some form of ANC even if they did not attain all four recommended visits.
On the other hand, in four of the eleven countries namely Lesotho, Madagascar, Malawi and
Tanzania, well over 58.36% of women were married and were likely to make an adequate
number of ANC visits (see Table 2.3).
In the DRC and Mozambique, the majority of the women surveyed were married, however,
in contrast to Lesotho, Malawi, Madagascar and Tanzania these women were likely to make
‘0 ANC’ visits (see Table 2.1) as opposed to ‘≥ 4 ANC’ visits.
Zimbabwe and Zambia are the only two countries out of the eleven that did not show any
discernible patterns to being married. Although the majority (78.92%) of the women in both
countries were legally married, that did not increase or decrease their likelihood of making
either ‘0 ANC’, ‘1-3 ANC’ or ‘≥ 4 ANC’ visits.
Education
Namibia and Lesotho are two of the eleven countries that had a great majority of women
educated up to the secondary level or higher, 65.61% and 49.90% of which attained at least
4 ANC visits, respectively (see Table 2.3). Swaziland and Zimbabwe alike also had most
women with a secondary education level. However, they differed from Namibia and
Lesotho because these women were more likely to make ‘1-3 ANC’ visits at 68.80% for
Zimbabwe and 54.80% for Swaziland as opposed to ‘≥ 4 ANC’ visits (see Table 2.2). The
second largest group for all four of these countries was women who studied or attained
education up to the primary level, most of which had ‘0 ANC’ visits.

Page | 127
On the other hand, over 42.36% of women in the DRC and 65.61% in Malawi had attained
only primary education, making up most women surveyed in these countries. Fifty-three
per cent in the DRC and 72.27% in Malawi of these women had ‘0 ANC’ visits (see Table 2.1).
On the contrary, five countries namely Angola, Madagascar, Mozambique, Tanzania and
Zambia also had majority of women surveyed with education attainment up to the primary
level, except for these women were more likely to attain some form of ANC (1-3 ANC) even
if they did not complete the full course of four ANC visits.
Employment Status
An analysis of women’s employment status and use of ANC was heavily dependent on the
type of work women had. Women who worked in agricultural settings had the least
likelihood of attaining any ANC visits. These women made up the majority in Angola, DRC
Madagascar and Tanzania and a range of about 54.36% to 84.21% had ‘0 ANC’ (see Table
2.1) except in Malawi where 44.63% had ‘1-3 ANC’ visits (see Table 2.2).
In the SADC countries analysed, unemployment was one other category that was common
that followed agricultural work in popularity. In Mozambique, Zambia and Zimbabwe, the
majority of the women were not working, and these women were more likely to make ‘1-3
ANC’ visits as opposed to their working counterparts. The only three countries with the
majority of women unemployed that deviated from this finding were Malawi, Namibia and
Swaziland, where over 44%, 63% and 60% of women in this category, respectively, had ‘0
ANC’ visits (see Table 2.1).
Lesotho is the only country where the majority of women did domestic services, and their
use of ‘1-3 ANC’ and ‘≥ 4 ANC’ was evenly distributed with ‘0 ANC’ as the slightly dominant

Page | 128
category. Women with white-collar jobs were underrepresented and thus omitted from the
analysis.
Analytic Assessment In all eleven countries analysed in the present study, the use of ‘0 ANC’ was pro-poor across
the border. Similarly, analysis of descriptive statistics supported this finding where the
poorer and the poorest populations showed greater proportions of ‘0 ANC’ use (see Table
2.1). Angola, however, showed the greatest extent of pro-poorness use with a
concentration index of -0.4915 (standard error = 0.0119) as presented in Table 3.
Furthermore, findings in the majority of the countries showed a consistent pro-poor
inequality in having less than four ANC visits (1-3 ANC visits). This is particularly the case in
Angola, Lesotho, Madagascar, Mozambique, Namibia, Swaziland and Tanzania where the
concentration indices (CIs) range from -0.1014 (0.0294) to -0.2094 (0.0364) as outlined in
Table 3. The DRC and Zimbabwe, on the other hand, showed a unique picture where the
use of ‘1-3 ANC’ visits appears equal for quintiles 1 to 3 but becomes markedly pro-poor for
quintiles 4 and 5 (see Figure 2, concentration curves for DRC and Zimbabwe). Malawi and
Zambia on the other hand bring out stark differences from other countries, showing a
perfect picture of equality in the use of ‘1-3 ANC’ visits across all wealth quintiles as seen in
Figure 2 (concentration curves for Malawi and Zambia), with CIs estimated at -0.0371
(0.0052) and -0.0385 (0.0070), respectively (see Table 3).
The disparity between the rich and the poor was well defined in the use of more than four
ANC visits (≥ 4 ANC) in Angola, DRC, Lesotho, Madagascar, Mozambique and Tanzania. All

Page | 129
concentration curves (see Figure 2) for these countries lie below the line of equality, and the
CIs are positive (see Table 3) which confirm that the use of ANC is pro-rich. As in the case
of ‘0 ANC’ visits, the inequality with regards to ‘≥ 4 ANC’ visits was more pronounced in
Angola with a CI of 0.1930 (0.0043) as seen in Table 3. On the other hand, Namibia and
Swaziland showed similar patterns of equality in the use of ‘≥ 4 ANC’ visits with positive CIs
estimated at 0.0309 (0.0049) and 0.0301 (0.0060), respectively (see Table 3). Although
Malawi, Zambia and Zimbabwe showed somewhat similar patterns, the slight skewness of
their respective curves (Figure 2) leaned towards the non-poor population with CIs
estimated at 0.0413 (0.0049), 0.0365 (0.0053) and 0.0311 (0.0047), respectively (see Table
3).
Assessment of the intensity of ANC service utilisation (ANC intensity) showed a picture that
resembles equality in Malawi and Zambia (see Figure 2, concentration curves for Malawi
and Zambia) for all wealth quintiles with CIs closest to zero at 0.0193 (0.0022) and 0.0244
(0.0021), respectively (see Table 3). Although similar, Zimbabwe, Namibia and Swaziland
had slightly more pronounced pro-rich distributions. All other countries (Angola, DRC,
Lesotho, Madagascar, Mozambique, and Tanzania) that showed a pro-rich use of ‘≥ 4 ANC’
visits showed a pro-rich ANC intensity. Of these countries, the DRC, Lesotho and Tanzania
were the closest to equality with CIs estimated at 0.0701 (0.0032), 0.0968 (0.0095) and
0.0586 (0.0027), respectively (see Table 3). Their concentration curves can be seen almost
abreast to the line of equality (see Figure 2).

Page | 130
Discussion
This study aimed to make a comprehensive assessment of the SES inequalities in the use of
ANC services in the SADC region. The study uses simple descriptive statistics and analytical
methods using concentration indices and curves for analysis.
Descriptive Statistics
Rural vs urban residence and ANC utilization
In terms of place of residence and the variations in attaining ANC visits, living in an urban
area was associated with the likelihood of attaining ‘≥ 4 ANC’ than all other mutually
exclusive categories. Similarly, living in a rural area was associated with the likelihood of
attaining ‘0 ANC’ use compared to all other mutually exclusive categories. This finding is
supported by other studies in both developed and developing countries (35,36,37).
Tanzania and Namibia’s deviation from this finding can potentially be explained by their
relatively smaller sample of women, with no ‘over-representation’ of rural women as seen
in all other ten countries. Thus, Tanzania and Namibia were the only countries that did not
show a higher proportion of ‘0 ANC’ use among rural dwellers, suggesting that most women
had some form of ANC visits even if they did not complete the full course of recommended
four ANC visits. This is in agreement with a cohort study conducted in Vietnam, where
almost all women reported some form of ANC use during pregnancy (38). Given that women
in rural areas had fewer visits, the large disparity in ANC adequacy between the two settings
suggests that special attention need to be given to rural areas, focusing on the importance
of ANC and ways of luring pregnant women in.

Page | 131
Marital status
Whilst marriage can be considered as an institutional structure that promotes women’s
support from their spouse during pregnancy (39,40) as seen in Malawi, Madagascar,
Lesotho, and Tanzania in the present study, in some African cultures, marriage can be seen
as a custom that takes away from women’s authority over their owns’ lives decisions, some
of which include health-related choices. Different patterns have emerged in many other
countries with regards to attaining an adequate number of ANC visits and being married,
and thus, no sole conclusion could be reached. A study conducted by Rai and colleagues
(41) found that a high proportion of women in Nigeria were “married to much older men
based on religion and cultural beliefs, practising cultural norms that restricted women from
seeking health-related assistance during pregnancy”. As in the present study, limited use of
ANC among married women in Mozambique is also reported by Charfudin (42) who
concluded that majority of births take place at home, pointing to a possible lack of urgency
for women to consult health professionals during their pregnancy. Also, early marriages or
child marriages are a popular trend in Mozambique, which is in line with findings by Rai and
colleagues (41). Similarly, in the DRC, which also showed low use of ANC among married
women, females are more likely to get married before the age of 18 compared to their male
counterparts, which also possibly speaks to their waned down authority regarding their own
productive health (43). On the other hand, although early marriages are quite common in
Zambia (44), being married did not seem to predict women’s likelihood of attaining
adequate or inadequate use of ANC. Furthermore, in countries where marriage did not
seem to influence the use of ANC as in the case of Zambia and Zimbabwe, a study conducted
by Musandirire and colleagues (45) had contrasting findings wherein cultural practices,

Page | 132
power dynamics and gender roles were shown to have taken away the Zimbabwean married
women’s capacity to exercise their maternal health care rights during pregnancy, including
their susceptibility to infectious diseases that contribute to some of the maternal
mortalities. From these findings, a deduction can be made to promote community-based
programmes or interventions that can help encourage spousal support during pregnancy,
which will be paramount in bridging the gap between attaining ‘0 ANC’ visit and reaching an
adequate or more than four ANC visits. This is not to suggest that cultural practices should
be ignored, but rather a mechanism that can help create awareness regarding cultural
norms that are potentially health-damaging to both the mother and the unborn child during
pregnancy.
Education
Findings in Namibia and Lesotho contrast those backed by literature (15,16) where countries
with relatively more educated women, even the most illiterate women attain some form of
ANC due to economic advancements. In these two countries this was not the case as,
although the majority of women with a secondary education level made the recommended
number of ANC visits, the remainder of women with no education or just primary level
education had no form of ANC. Nonetheless, women’s educational attainment has been
shown to have an inordinate influence on authority; it affords them and their ability to make
informed decisions over their own health (46).
In countries (Zambia, Tanzania, Mozambique, Madagascar and Angola) where most women
had primary level education and had attained ‘1-3 ANC’ visits, a deduction can be made that
these women had some form of knowledge about the importance of ANC even if they did
not complete the recommended course of four visits. Given that these women initiated the

Page | 133
visits but did not attend all four or more visits, the underlying reasons for the lack of
compliance could include but are not limited to 1) Poor quality of service from health
professionals (47), 2) discouragement to continue using ANC services due to lack of
resources (47), 3) being a first time mother or not or (48) 4) the need to just have a
pregnancy registered should complications arise or for administrative purposes such as
issuing of birth certificates once the baby is born (49). This points to the fact that while
knowledge or the lack thereof can sway women to use ANC or not, other factors can
potentially confound this finding if not controlled for. For instance, Wang and Hong (16) in
a study conducted in Cambodia, found that while education had a relatively stronger effect
on predicting ANC use, the quality of care received in the first visit or two was likely to
predict the continuation of care. In a qualitative study conducted in South Africa, some
women reported poor quality of services and being reprimanded and scolded by health
professionals as reasons why they had inadequate use of ANC or opted to book late for their
pregnancy (50).
Employment
The lack of ANC use among women who did agriculture work in the present study is possibly
due to the fear of loss of a day’s wage should a visit be made to a health facility. In
agreement with the present, a couple of authors have reported higher odds of fewer ANC
visits among women who engaged in agriculture jobs when compared to women who do
not work (47,48). Acharya and colleagues (53) further supported that mothers employed in
the agricultural sector have no maternal autonomy and are the most at risk of complications
that could arise during the gestation period. Thus, this potentially leads to missed
opportunities for educating women about their health during pregnancy, such as the need

Page | 134
to do less strenuous work that could, in some instances, lead to miscarriages. Therefore,
failure of women attending ANC services due to their respective occupations can result in
dire consequences such as eluding correct diagnosis, treating and preventing pregnancy-
related ailment, some of which are transferrable to the baby.
Contrary to studies that have found that employment of the women increases their
authority over their health (7,50,51), in the present study four countries that showed the
highest level of unemployment amongst the mothers had well over 50% of the women
attaining either ‘1-3 ANC’ visits or four or more ANC visits. Although this finding is quite
unusual, especially in African countries, other studies have reported similar findings (10,52).
However, it is intuitive that unemployed women have relatively more time to make all
recommended visits as opposed to their working counterparts that have to face the
opportunity costs of lost wages. Given that unemployed women are not economically
independent, it is possible that financial spousal support and location of health centres
within their vicinity contributed to their continued use of maternal health services during
pregnancy. Authors that have looked extensively into barriers or enablers of ANC use point
to a combination of these factors (spousal support and location of the facility) as key
determinants of continued service use (53,54).
Analytic assessment
In the present study, concentration curves were complemented with concentration indices
to allow for examination of the pattern of socioeconomic inequalities in the uptake of ANC

Page | 135
across the eleven SADC countries. The distribution of the share of adequate ANC services is
unequal at the disadvantage of the poor. The CI of all the ‘0 ANC’ and ‘1-3 ANC’ visits were
negative, revealing a higher pro-poor use of inadequate antenatal care by poorer women.
This is consistent with other studies where inadequate or complete lack of ANC use is
prevalent among the poor (59,60,61). The analysis further showed a pro-rich use of ‘≥ 4
ANC’ visits except for countries that showed some form of equality such as Malawi, Zambia
and Zimbabwe, with CIs closest to zero. Interventions that had been put in place in these
countries (Malawi, Zambia and Zimbabwe) to promote the use of maternal health services
during pregnancy shows that some progress has been made in reducing inequalities in the
use of adequate ANC. In Malawi where the majority of the women surveyed in the current
study were married, the literature shows that an intervention promoting male involvement
in maternal health care in both urban and rural areas of Malawi had a greater influence on
this (62). On the other hand, in Zambia ‘Safe Motherhood Action Groups’ interventions
were initiated to increase coverage of maternal services among the poorest and most
remote populations in Zambia (63). In Zimbabwe, the ‘Pillars of Safe Motherhood’ were
formed, one of which was focused on ANC services, including PMTCT, nutrition, and
ensuring these were made available to all pregnant (64).
However, much public awareness in countries such as Angola and Madagascar that showed
the highest level of inequality overall has to be considered for change. All the SADC
countries included in this study signed to achieving the MDGs and subsequently the SDGs,
which is a step in the positive direction, but it is evident the widened inequality in most of
these countries have not been addressed.

Page | 136
Limitations
The cross-sectional nature of the DHS data does not allow for any causal inferences to be
made. The study also did not take note of whether mothers were primigravidae or
multigravidas, which could highly influence their continued use of ANC. Similarly, there is
no mentioned of pregnancy complications that can potentially drive women to seek
maternal care and attain four or more ANC visits. Nonetheless, the results of this study
were unique in that four mutually exclusive categories regarding use of ANC was analysed
in SADC countries, deriving its novelty from the fact that women who attained ‘0 ANC’ visits
were analysed as a separate entity.
Also, a fourth category which analysed the intensity of inequality of ANC service use was
derived and assessed.
Conclusion
Use of antenatal care and associated maternal mortality are indices that measure how good
a country is doing in terms of achieving its health goals. In this study, the ANC usage rates,
although reasonable on an overall basis, were consistently lower for women with lower
education, doing agricultural work and those residing in rural areas. On the other hand,
marriage did not prove to be a significant determinant of ANC use with countries showing
differences in the relationship between the use of ANC and marital status. The analytical
analysis showed that inequality in wealth makes ANC utilisation more predominant among
the rich. Saving mothers and babies is ultimately saving the population and knowledge of

Page | 137
the patterns of maternal health usage is imperative in this regard, to draw relevant policies
that are evidence-based.
Acknowledgements
I would love to thank my parents for their undying support throughout my school and varsity
years. Also, truly grateful for the patience, strength and perseverance I drew from my
relationship with God throughout the years. A special thanks also to my supervisor, A/Prof
John Ataguba, who guided me through my Master of Public Health journey, it’s truly an
honour to have been a recipient of his knowledge and wisdom.

Page | 138
References 1. United Nations 2015: United Nations. The Millennium Development Goals Report 2015.
2015; Available from: /citations?view_op=view_citation&continue=/scholar%3Fhl%3Den%26as_sdt%3D0,26%26scilib%3D1%26scioq%3Dthe%2Bmillennium%2Bgoals%2Breport%2B2015&citilm=1&citation_for_view=xgbvHCQAAAAJ:LK8CI43ZvvMC&hl=en&scioq=the+millennium+goals+report+2015&oi=p%0Ahttp://ww
2. United Nations Development Programme. From the MDGs to Sustainable Development for All: Lessons from 15 Years of Practice. United Nations Dev Program. 2016;92.
3. Lincetto O, Mothebesoane-anoh S, Gomez P, Munjanja S. Opportunities for Africa’s Newborns. Antenatal Care. 2006;Chapter 3 (51–62).
4. WHO recommendations on Maternal Health. 2017. Available from: https://www.who.int/maternal_child_adolescent/documents/maternal-health-recommendations/en/
5. Collin SM, Anwar I, Ronsmans C. International Journal for Equity in A decade of inequality in maternity care : antenatal care , professional attendance at delivery , and caesarean section in Bangladesh ( 1991 – 2004 ). 2007;9:1–9.
6. Mehata S, Paudel YR, Dariang M, Aryal KK, Lal BK, Khanal MN, et al. Trends and Inequalities in Use of Maternal Health Care Services in Nepal : Strategy in the Search for Improvements. 2017;2017(2008).
7. Nigatu R. Antenatal and postnatal care service utilization in Southern Ethiopia: A population-based study. Afr Health Sci. 2011;11(3):390–7.
8. Alcock G, Das S, More NS, Hate K, More S, Pantvaidya S, et al. Examining inequalities in uptake of maternal health care and choice of provider in underserved urban areas of Mumbai, India: A mixed methods study. BMC Pregnancy Childbirth. 2015;15(1):1–11.
9. Adeyanju O, Tubeuf S, Ensor T. Socio-economic inequalities in access to maternal and child healthcare in Nigeria: Changes over time and decomposition analysis. Vol. 32, Health Policy and Planning. 2017. 1111-1119 p.
10. Wilunda C, Quaglio G, Putoto G, Takahashi R, Calia F, Abebe D, et al. Determinants of utilisation of antenatal care and skilled birth attendant at delivery in South West Shoa Zone , Ethiopia : a cross sectional study. Reprod Health. 2015;1–12.
11. Singh A, Padmadas SS, Mishra US, Pallikadavath S, Johnson FA, Matthews Z. Socio-economic inequalities in the use of postnatal care in india. PLoS One. 2012;7(5).
12. Sharma SK, Sawangdee Y, Sirirassamee B. Access to health: Women’s status and utilization of maternal health services in Nepal. J Biosoc Sci. 2007;39(5):671–92.
13. Navaneetham K, Dharmalingam A. Utilization of maternal health care services in SERVICES IN SOUTH INDIA K . Navaneetham Centre for Development Studies Thiruvananthapuram , India A . Dharmalingam Department of Sociology & Social Policy University of Waikato , Hamilton , New Zealand Octob. 2000;(July 2014).
14. Silal SP, Penn-Kekana L, Harris B, Birch S, McIntyre D. Exploring inequalities in access to and use of maternal health services in South Africa. BMC Heal Serv Res. 2012;12:120.
15. Viegas Andrade M, Noronha K, Singh A, Rodrigues CG, Padmadas SS. Antenatal care use in

Page | 139
Brazil and India: Scale, outreach and socioeconomic inequality. Heal Place. 2012;18(5):942–50.
16. Wang W, Hong R. Levels and determinants of continuum of care for maternal and newborn health in Cambodia-evidence from a population-based survey. BMC Pregnancy Childbirth. 2015;15(1):1–9.
17. Kerber KJ, Graft-johnson JE De, Bhutta ZA, Okong P, Starrs A, Lawn JE. Continuum of care for maternal , newborn , and child health : from slogan to service delivery. 2007;370.
18. SADC Major Achievements and Challenges. 25 Years of Regional Cooperation and Integration 2005;
19. SADC RVA& A (RVAA). Synthesis Report on the State of Food and Nutrition Security and Vulnerability in Southern Africa. 2018;(July).
20. SADC. SADC Facts & Figures. 2012. Available from: https://www.sadc.int/about-sadc/overview/sadc-facts-figures/
21. Health Policy Project. Zambia Health Financing Profile. IHME World Heal Organ Glob Heal Obs. 2015;(May).
22. Health Policy Project. Health Financing Profile - Tanzania. Heal Policy Proj. 2016;(May):2012–3.
23. MoHCC. Zimbabwe 2016 Health and Child Care Budget Brief. 2016;
24. Health Policy Project. MALAWI Health Financing Profile. 2016;(May 2016):2016–7.
25. Health Policy Project. Angola Health Financing Profile. 2016;(May):1–2.
26. Health Policy Project. Botswana Health Financing Profile. 2016;(May):1–2.
27. Health Policy Project. Health Financing Profile: Mozambique. World Heal Organ Natl Heal Accounts. 2015;(May):2012–3.
28. Health Policy Project. Namibia Health Financing Profile. Namibia Natl Heal Accounts. 2014;0809(May).
29. Ranchod S, Erasmus D, Abraham M, Bloch J, Chigiji K, Dreyer K. Effective health financing models in SADC: Three case studies Prepared for FinMark Trust by Insight Actuaries and Consultants. 2016;(April). Available from: https://www.mm3admin.co.za/documents/docmanager/f447b607-3c8f-4eb7-8da4-11bca747079f/00104930.pdf
30. DHS. Demographic and Health Surveys Methodology. United States Agency Int Dev. 2013;
31. Wagstaff A, Paci P, Van Doorslaer E. On the Measurement Inequalities in Health. Soc Sci Med [Internet]. 1991;33(5):545–57. Available from: http://www.jstor.org/stable/1911028
32. O’Donnell O, van Doorslaer E, Wagstaff A, Lindelow M. Analyzing Health Equity Using Household Survey Data. 2007.
33. Phiri J, Ataguba JE. Inequalities in public health care delivery in Zambia. 2014;13(1):1–9.
34. Umuhoza SM, Ataguba JE. Inequalities in health and health risk factors in the Southern African Development Community : evidence from World Health Surveys. 2018;1–15.
35. Nagdeva DA. Urban-rural differentials in maternal and child healthcare. Heal Popul Perspect

Page | 140
Issues. 2009;32(1):36–46.
36. Afful-Mensah G, Nketiah-Amponsah E, Boakye-Yiadom L. Rural-urban differences in the utilization of maternal healthcare in Ghana: The case of antenatal and delivery services. African Soc Sci Rev. 2014;6(1):1–22.
37. Yaya S, Bishwajit G, Shah V. Wealth, education and urban–rural inequality and maternal healthcare service usage in Malawi. BMJ Glob Heal. 2016;1(2):e000085.
38. Tran TK, Nguyen CTK, Nguyen HD, Eriksson B, Bondjers G, Gottvall K, et al. Urban - Rural disparities in antenatal care utilization: A study of two cohorts of pregnant women in Vietnam. BMC Health Serv Res. 2011;11(1):120.
39. Promundo, CulturaSalud, REDMAS. Program P: A Manual for Engaging Men in Fatherhood, Caregiving, and Maternal and Child Health. 2013;
40. Sonke Gender Justice. State of South Africa’s Fathers. In Human Sciences Research Council; 2018.
41. Rai RK, Singh PK, Singh L. Utilization of Maternal Health Care Services among Married Adolescent Women: Insights from the Nigeria Demographic and Health Survey, 2008. Women’s Heal Issues [Internet]. 2012;22(4):e407–14. Available from: http://dx.doi.org/10.1016/j.whi.2012.05.001
42. Sacoor C, Payne B, Augusto O, Vilanculo F, Nhacolo A, Vidler M, et al. Health and socio-demographic profile of women of reproductive age in rural communities of southern Mozambique. PLoS One. 2018;13(2):1–16.
43. Arimatsu L. Democratic Republic of Congo: 1993-2010. Int Law Classif armed Confl. 2012;141–220.
44. M Ngoma C. Factors Influencing Women’s Optimum Health in Zambia. J Healthc Commun. 2016;01(04):1–6.
45. Musandirire B. IS MARRIAGE A HAVEN OR A RISK FOR WOMEN IN IN THE ERA OF HIV / AIDS : INTERROGATING WOMEN ` S REPRODUCTIVE RIGHTS IN MARRIAGE . BY Supervisor : Professor J . Stewart A Dissertation submitted in partial fulfilment of the requirements of the Masters Degree . 2016;
46. McTavish S, Moore S, Harper S, Lynch J. National female literacy, individual socio-economic status, and maternal health care use in sub-Saharan Africa. Soc Sci Med. 2010;71(11):1958–63.
47. Escamilla V, Calhoun L, Winston J, Speizer IS. The Role of Distance and Quality on Facility Selection for Maternal and Child Health Services in Urban Kenya. J Urban Heal. 2018;95(1):1–12.
48. Ochako R, Fotso JC, Ikamari L, Khasakhala A. Utilization of maternal health services among young women in Kenya: Insights from the Kenya Demographic and Health Survey, 2003. BMC Pregnancy Childbirth [Internet]. 2011;11(1):1. Available from: http://www.biomedcentral.com/1471-2393/11/1
49. Edu BC, Agan TU, Monjok E, Makowiecka K. Effect of free maternal health care program on health-seeking behavior of women during pregnancy, intra-partum and postpartum periods in Cross River State of Nigeria: A mixed method study. Maced J Med Sci. 2017;5(3):370–82.
50. Kaswa R, Rupesinghe GFD, Longo-Mbenza B. Exploring the pregnant women’s perspective

Page | 141
of late booking of antenatal care services at Mbekweni Health Centre in Eastern Cape, South Africa. African J Prim Heal care Fam Med. 2018;10(1):1–9.
51. Yaya S, Bishwajit G, Ekholuenetale M, Shah V, Kadio B, Udenigwe O. Timing and adequate attendance of antenatal care visits among women in Ethiopia. PLoS One. 2017;12(9):1–16.
52. Rashid M, Antai D, Antai D. Socioeconomic position as a determinant of maternal healthcare utilization: A population-based study in Namibia. J Res Health Sci. 2014;14(3):187–92.
53. Acharya D, Singh JK, Kadel R, Yoo SJ, Park JH, Lee K. Maternal factors and utilization of the antenatal care services during pregnancy associated with low birth weight in rural Nepal: Analyses of the antenatal care and birth weight records of the matri-suman trial. Int J Environ Res Public Health. 2018;15(11):1–14.
54. Chiavarini M, Lanari D, Minelli L, Salmasi L. Socio-demographic determinants and access to prenatal care in Italy. BMC Health Serv Res. 2014;14(1):1–10.
55. Tsawe M, Susuman A. Determinants of access to and use of maternal health care services in the Eastern Cape, South Africa: a quantitative and qualitative investigation. BMC Res Notes. 2014;7(1):723.
56. Arokiasamy P, Pradhan J. Maternal health care in India: Access and demand determinants. Prim Heal Care Res Dev. 2013;14(4):373–93.
57. Pell C, Meñaca A, Were F, Afrah NA, Chatio S, Manda-Taylor L, et al. Factors Affecting Antenatal Care Attendance: Results from Qualitative Studies in Ghana, Kenya and Malawi. PLoS One. 2013;8(1).
58. Yasuoka J, Nanishi K, Kikuchi K, Suzuki S, Ly P, Thavrin B, et al. Barriers for pregnant women living in rural, agricultural villages to accessing antenatal care in Cambodia: A community-based cross-sectional study combined with a geographic information system. PLoS One. 2018;13(3):1–20.
59. Celik Y, Hotchkiss DR. The socio-economic determinants of maternal health care utilization in Turkey. Soc Sci Med an Int J [Internet]. 2000;50(12):1797–806. Available from: http://libaccess.mcmaster.ca/login?url=http://search.proquest.com/docview/43664139?accountid=12347%5Cnhttp://sfx.scholarsportal.info/mcmaster?url_ver=Z39.88-2004&rft_val_fmt=info:ofi/fmt:kev:mtx:journal&genre=article&sid=ProQ:ProQ:indexislamicus&atitle=Th
60. Wabiri N, Chersich M, Shisana O, Blaauw D, Rees H, Dwane N. Growing inequities in maternal health in South Africa: A comparison of serial national household surveys. BMC Pregnancy Childbirth [Internet]. 2016;16(1). Available from: http://dx.doi.org/10.1186/s12884-016-1048-z
61. Zere E, Tumusiime P, Walker O, Kirigia J, Mwikisa C, Mbeeli T. Inequities in utilization of maternal health interventions in Namibia: Implications for progress towards MDG 5 targets. Int J Equity Health. 2010;9(i):1–11.
62. Kululanga LI, Sundby J, Malata A, Chirwa E. Striving to promote male involvement in maternal health care in rural and urban settings in Malawi - A qualitative study. Reprod Health [Internet]. 2011;8(1):36. Available from: http://www.reproductive-health-journal.com/content/8/1/36
63. Jacobs C, Michelo C, Moshabela M. Implementation of a community-based intervention in

Page | 142
the most rural and remote districts of Zambia: A process evaluation of safe motherhood action groups. Implement Sci. 2018;13(1):1–10.
64. Ministry of Health & Child Wealth. The Zimbabwe National Maternal and Neonatal Health Road Map. Maternal and Perinatal Mortality Study. 2007;1–43.

Page | 143
Section 4: Policy Brief
Assessing inequalities in the use of maternal health
services in the Southern African Development
Community Countries

Page | 144
What do we know about maternal health service coverage, and what should be
done to improve service coverage in the SADC countries?
Introduction
Disparities in maternal health care are of concern
to all developing countries and present one of the
biggest possible challenges to governmental
policies in many SADC countries. With the rates of
maternal mortality stagnant in most countries
varying interventions implemented to achieve the
millennium development goals (MDGs) and now
the sustainable development goals (SDGs), have
not effectively closed the crude differences
between the rich and the poor in the use of
antenatal care (ANC) services.
Previous research conducted in different sub-
Saharan countries shows that poorer women
continue to have fewer ANC visits compared to
their more affluent counterparts. Majority of
these implicated women tend to be poorly
educated and unemployed. The findings of the
present study show that these disparities continue
to persist. Furthermore, women who live in urban
areas which are often richer and more educated
are more likely to take advantage of ANC services
offered, making them beneficiaries of health
services most needed by the least advantaged.
Even though it is acknowledged that women from
poorer backgrounds have a higher risk of
maternal mortalities subject to low use of ANC,
this comprehensive assessment of inequalities in maternal health care is limited in SADC
countries.
Even in SADC countries where user fees are
minimal or non-existent for maternal health
services, women from poorer backgrounds
often bear the greater financial burden such
as transport costs to maternal facilities or
losing a day’s wage if working in agricultural
settings.
To date, women’s dependence on men for
economic survival has been a principal
barrier to women’s control over their
reproductive behaviour in majority of
developing countries. This is often associated
with poor attendance of maternal health care.
In many developing countries, women bear a
disproportionate burden of disease compared
to men. Yet, achieving Universal Health
Coverage (UHC) for pregnant women is still
elusive. UHC is about giving access to quality
care to all who need such services and
offering financial protection.
The World Health Organization (WHO) states that almost two-thirds of maternal
deaths are a result of largely preventable causes, majority of which are subject to
failing to attend the recommended four ANC visits.

Page | 145
Figure 1
Women doing agricultural work
tend to have far less ANC visits
compared to women with white-
collar jobs or unemployed
women.
Figure 2: Women without any formal education report fewer antenatal care visits compared to
educated women.
Key Findings
Disparities in ANC coverage, between the rich and the poor, is highest in Angola
compared to the other 11 SADC countries
Women from poorer backgrounds are more likely to report fewer ANC visits
compared to their more affluent counterparts
Women attaining at least secondary education are more empowered and report
relatively more ANC use than women with primary or no formal education.
Women who work in agricultural settings are less likely to make the recommended
number of ANC visits, compared to the unemployed women.
Women residing in rural areas remain disadvantaged as they use far less maternal
health services compared to their urban counterparts.
0
20
40
60
80
100
ANG DRC LST MDG MLW MZB NAM SWZ TAN ZMB ZIM
Per
cen
tage
(%
)
Percentage of pregnant women attaining at least 4 ANC visits
Women without Education Women with Education
Abbreviations ANG: Angola DRC: Democratic Republic of Congo LST: Lesotho MDG: Madagascar MLW: Malawi MZB: Mozambique NAM: Namibia SWZ: Swaziland TAN: Tanzania ZMB: Zambia ZIM: Zimbabwe

Page | 146
Recommendations
Empowering women with more economic participation, such as getting an education
and employment and granting them control in their households and communities, is key
to ensuring that women achieve control over their reproductive health. This includes
teaching women to see beyond their pregnancy-related health, but also let them know
of services that are available once that baby is born. These services include
immunisation against infectious and the use of the continuum of care.
Getting fathers to engage or encouraging spousal support can also promote the use of
antenatal care. Men should be educated about the importance of maternal health care
through, for example, the promotion of community-based programs or interventions
that can help encourage spousal support during pregnancy
Because poorer women have fewer ANC visits, they may be unable to afford
transportation to facilities. Therefore, shortening the distance to clinical facilities is
critical. This may be done through building facilities closer to people, the use of mobile
clinics in rural communities with no maternal clinics at reach. Community-based health
care workers can also be trained and deployed to make home visits to pregnant women.
There should be collaborations enforced among the SADC countries to share knowledge
and ideas on interventions that have worked well for countries with lower rates of
maternal mortality and those with higher rates of ANC coverage.
There should be social protection policies in place that protect women, especially the
poor and those in rural communities, from wage loss when they attend antenatal care,
irrespective of their occupation. This may also require laws that support maternity
leave and time off for antenatal care.
Conclusion
Saving mothers and babies is ultimately saving the population and knowledge of the patterns of
maternal health usage is imperative in this regard, to draw relevant policies that are evidence-
based.

Page | 147
Bibliography
Borghi, J., Ensor, T., Somanathan, A., Lissner, C., & Mills, A. (2006). Maternal Survival 4 Mobilising fi nancial resources for maternal health. The Lancet Maternal Survival Series, 6736(06). https://doi.org/10.1016/S0140-6736(06)69383-5
Edu, B. C., Agan, T. U., Monjok, E., & Makowiecka, K. (2017). Effect of free maternal health care program on health-seeking behavior of women during pregnancy, intra-partum and postpartum periods in Cross River State of Nigeria: A mixed method study. Macedonian Journal of Medical Sciences, 5(3), 370–382. https://doi.org/10.3889/oamjms.2017.075
Magadi, M. A., Zulu, E. M., & Brockerhoff, M. (2003). The inequality of maternal health care in urban sub-Saharan Africa in the 1990s. Population Studies, 57(3), 347–366. https://doi.org/10.1080/0032472032000137853
UNICEF. (2018). Monitoring the situation of children and women - Antenatal care. Retrieved from https://data.unicef.org/topic/maternal-health/antenatal-care/
Acknowledgements
Special thanks go to A/Prof John Ataguba for his incredible supervision and mentoring me
through the completion of this study.
Disclaimer
The photographs and images in this policy brief are used for illustrative purposes only (which allows
free and easy-to-use copyright licenses).
For more information, please contact:
Keolebogile Mable Selebano
Email [email protected]

Page | 148
Section 5: Appendices
Page | 149
Appendix 1: Human Ethics Research Approval
signature removed to avoid exposure online

Page | 150

Page | 151
Appendix 2: Submission Guidelines for PLOS ONE Journal
PLOS ONE Manuscript Guidelines
(copied from the PLOS ONE website in 2015)
1. Format Requirements
2. Guidelines for Standard Sections
o Title
o Authors and Affiliations
o Abstract
o Introduction
o Materials and Methods
o Results, Discussion, and Conclusions
o Acknowledgments
o References
o Figure Legends
o Supporting Information Captions
o Data Reporting Guidelines
o Accession Numbers
o Striking Images
o Tables
3. Specific Reporting Guidelines
o Human Subject Research
o Clinical Trials
o Animal Research
o Observational and Field Studies
o Cell Line Research
o Blots and Gels
o Antibodies
o Systematic Review/Meta-Analysis
o Paleontology and Archaeology Research
o Software Papers
o Database Papers

Page | 152
o New Zoological Taxon
o New Botanical Taxon
o New Fungal Taxon
o Qualitative Research
1. Format Requirements
PLOS ONE does not consider presubmission inquiries. All submissions should be prepared with the following files:
Cover letter
Manuscript, including tables and figure legends
Figures (guidelines for preparing figures can be found at the Figure and Table
Guidelines)
Prior to submission, authors who believe their manuscripts would benefit from professional
editing are encouraged to use language-editing and copyediting services. Obtaining this
service is the responsibility of the author, and should be done before initial submission. These
services can be found on the web using search terms like "scientific editing service" or "manuscript editing service." Submissions are not copyedited before publication.
In addition to the guidelines below, please refer to our downloadable sample files to make sure that your submission meets our formatting requirements:
Download sample title, author list, and affiliations page (PDF) Download full manuscript sample (PDF)
Submissions that do not meet the PLOS ONE Publication Criterion for language standards may be rejected.
Cover Letter
You should supply an approximately one page cover letter that:

Page | 153
Concisely summarizes why your paper is a valuable addition to the scientific literature Briefly relates your study to previously published work
Specifies the type of article you are submitting (for example, research article,
systematic review, meta-analysis, clinical trial)
Describes any prior interactions with PLOS regarding the submitted manuscript
Suggests appropriate PLOS ONE Academic Editors to handle your manuscript (view
a complete listing of our academic editors)
Lists any opposed reviewers
Your cover letter should not include requests to reduce or waive publication fees. Should
your manuscript be accepted, you will have the opportunity to include your requests at that time. See PLOS ONE Editorial Policy for more information regarding publication fees.
Manuscript Organization
PLOS ONE considers manuscripts of any length. There are no explicit restrictions for the number of words, figures, or the length of the supporting information, although we encourage a concise and accessible writing style. We will not consider monographs.
All manuscripts should be double-spaced and include line numbers and page numbers.
Manuscripts should begin with the ordered sections:
Title
Authors
Affiliations
Abstract
Introduction
and end with the sections of:

Page | 154
Acknowledgments
References
Supporting Information Captions
Figures should be cited in ascending numeric order upon first appearance. Each figure caption
should then be inserted immediately after the first paragraph in which it is cited in the article file.
Figures should not be included in the main manuscript file. Each figure must be
prepared and submitted as an individual file. Find more information about preparing figures here.
Tables should be cited in ascending numeric order upon first appearance. Each table should then be inserted immmediately after the first paragraph in which it is cited in the article file.
The title, authors, and affiliations should all be included on a title page as the first page of the manuscript file.
There are no explicit requirements for section organization between these beginning and ending sections. Articles may be organized in different ways and with different section titles,
according to the authors' preference. In most cases, internal sections include:
Materials and Methods
Results
Discussion
Conclusions (optional)
PLOS ONE has no specific requirements for the order of these sections, and in some cases it may be appropriate to combine sections. Guidelines for individual sections can be found below.
Abbreviations should be kept to a minimum and defined upon first use in the text. Non- standard abbreviations should not be used unless they appear at least three times in the text.

Page | 155
Standardized nomenclature should be used as appropriate, including appropriate usage of species names and SI units.
PLOS articles do not support text footnotes. If your accepted submission contains footnotes, you will be asked to move that material into either the main text or the reference list, depending on the content.
Manuscript File Requirements
Authors may submit their manuscript files in Word (as .doc or .docx), LaTeX (as .pdf), or RTF format. Word files must not be protected.
LaTeX Submissions. If you would like to submit your manuscript using LaTeX, you must author your article using the PLOS ONE LaTeX template and BibTeX style sheet. Articles
prepared in LaTeX may be submitted in PDF format for use during the review process. After
acceptance, however, .tex files will be required. Please consult our LaTeX guidelines for a list of what will be required.
Microsoft Word Submissions with Equations. If your manuscript is or will be in Microsoft
Word and contains equations, you must follow the instructions below to make sure that your equations are editable when the file enters production.
1. Format display equations only in MathType
(http://www.dessci.com/en/products/mathtype/).
2. Inline equations should be completely input via MathType. Do not include an
equation that is part text, part MathType.
3. Do not use graphic objects.
If you have already composed your article in Microsoft Word and used its built-in equation
editing tool, your equations will become unusable during the typesetting process. To resolve this problem, re-key your equations using MathType.
If you do not follow these instructions, PLOS will not be able to accept your file.
Back to top

Page | 156
2. Guidelines for Standard Sections
Title
Manuscripts must be submitted with both a full title and a short title, which will appear at the
top of the PDF upon publication if accepted. Only the full title should be included in the
manuscript file; the short title will be entered during the online submission process.
The full title must be 250 characters or fewer. It should be specific, descriptive, concise, and
comprehensible to readers outside the subject field. Avoid abbreviations if possible. Where appropriate, authors should include the species or model system used (for biological papers)
or type of study design (for clinical papers).
Examples:
Impact of Cigarette Smoke Exposure on Innate Immunity: A Caenorhabditis elegans Model
Solar Drinking Water Disinfection (SODIS) to Reduce Childhood Diarrhoea in Rural
Bolivia: A Cluster-Randomized, Controlled Trial
The short title must be 50 characters or fewer and should state the topic of the paper.
Back to top
Authors and Affiliations
All author names should be listed in the following order:
First names (or initials, if used), Middle names (or initials, if used), and
Last names (surname, family name)

Each author should list an associated department, university, or organizational affiliation and its
location, including city, state/province (if applicable), and country. If the article has been submitted on behalf of a consortium, all author names and affiliations should be listed at the end
of the article.
This information cannot be changed after initial submission, so please ensure that it is
correct.
To qualify for authorship, one should contribute to all of the following:
1. Conception and design of the work, acquisition of data, or analysis and interpretation of data
2. Drafting the article or revising it critically for important intellectual content
3. Final approval of the version to be published
4. Agreement to be accountable for all aspects of the work
All persons designated as authors should qualify for authorship, and all those who qualify should be listed. Each author must have participated sufficiently in the work to take public
responsibility for appropriate portions of the content. Those who contributed to the work but do
not qualify for authorship should be listed in the acknowledgments.
When a large group or center has conducted the work, the author list should include the individuals whose contributions meet the criteria defined above, as well as the group name.
All authors must approve the final manuscript before submission. PLOS ONE will contact all authors by email at submission to ensure that they are aware of the submission of the manuscript.
One author should be designated as the corresponding author, and his or her email address or
other contact information should be included on the manuscript cover page. This information will be published with the article if accepted.
See the PLOS Editorial and Publishing Policies for more information.

Page | 158
Back to top
Abstract
Describe the main objective(s) of the study
Explain how the study was done, including any model organisms used, without
methodological detail
Summarize the most important results and their significance
Not exceed 300 words