full article 4d retrospective lineage tracing...
TRANSCRIPT

FULL ARTICLE
4D retrospective lineage tracing using SPIMfor zebrafish organogenesis studies
Jim Swoger*; 1, Mariana Muzzopappa2, Hernan Lopez-Schier2, and James Sharpe*; 1; 3
1 EMBL/CRG Systems Biology Research Unit, Centre for Genomic Regulation (CRG), Barcelona, Spain2 Cell & Developmental Biology Research Unit, Centre for Genomic Regulation (CRG), Barcelona, Spain3 ICREA Research Professor, Centre for Genomic Regulation (CRG), UPF, Barcelona, Spain
Received 30 July 2010, revised 20 September 2010, accepted 21 September 2010Published online 5 October 2010
Key words: selective plane illumination microscopy, SPIM, cell tracking, zebrafish, lateral line
Æ Supporting information for this article is available free of charge under http://dx.doi.org/10.1002/jbio.201000087
1. Introduction
The developmental lineage of a cell is a key determi-nant of its available differentiation fates, and study-ing lineages is therefore a central challenge in devel-opmental and regenerative biology. Lineage tracinghas commonly been performed prospectively; inother words, a cell at an early point in developmentis chosen and labelled, (e.g. using DiI [1] or horse-radish peroxidase [2]), and at a later time-point itsdescendents are identified on the basis of havingclonally-inherited the label. This powerful approachhas been fundamental to our understanding of line-
age relationships in many developmental systems,but it suffers from a number of technical drawbacks:First, since the lineage is not known in advance(hence the motivation of the experiment) it is notpossible to pre-identify the progenitor for a given tis-sue. Multiple experiments must therefore be per-formed, labelling as many different cells as possible,to give a reasonable chance of hitting the correctprogenitor for the tissue of interest. Second, it re-quires the experimenter to physically access the em-bryo (e.g. using a microinjection needle) without dis-turbing its development. Third, labelling single cellsis technically difficult due to their size. The large
# 2011 by WILEY-VCH Verlag GmbH & Co. KGaA, Weinheim
Journal of
BIOPHOTONICS
A study demonstrating an imaging framework that per-mits the determination of cell lineages during organo-genesis of the posterior lateral line in zebrafish is pre-sented. The combination of Selective Plane IlluminationMicroscopy and specific fluorescent markers allows ret-rospective tracking of hair cell progenitors, and hencethe derivation of their lineages within the primodium. Itis shown that, because of its superior signal-to-noise ratioand lower photo-damaged properties, SPIM can providesignificantly higher-quality images than Spinning DiskConfocal technology. This allows accurate 4D lineagetracing for the hair cells over tens of hours of primor-dium migration and neuromast development.
Consecutive slices from a 4D SPIM time-lapse showingthe division of a hair-cell precursor in the primordium ofa developing zebrafish embryo.
* Corresponding authors: e-mail: [email protected], Phone: +34 933 160 185, Fax: +34 933 969 983; [email protected],Phone: +34 933 160 098, Fax: +34 933 969 983
J. Biophotonics 4, No. 1–2, 122–134 (2011) / DOI 10.1002/jbio.201000087

cells of the early cleavage stage embryos are easierto target, but give rise to large portions of the em-bryo, and therefore cannot provide high resolutionlineages.
The last two problems can be overcome by so-called genetic lineage tracing techniques. A good ex-ample is tamoxifen-inducible Cre activation of a re-porter gene such as LacZ or GFP [3]. In mice thisallows the generation of a labelled clone of cellswithout disturbing the embryo in-utero, and can alsobe titrated to allow generation of mono-clonal re-sults. However, genetic prospective lineaging stillsuffers from the first problem that many experimentsmust be performed to successfully hit the desiredprogenitor cells, and it also introduces a new prob-lem – the position of the labelling event is not con-trolled.
Recent years have seen the improvement of 4Dtime-lapse imaging technology for certain model spe-cies. Caenorhabditis elegans was the first to benefitfrom comprehensive time-lapse imaging at a spatio-temporal resolution sufficient to trace all cells andcell divisions during development, using non-fluo-rescent differential interference contrast optics [4, 5].This allows an alternative approach for determiningthe lineage of cells – retrospective lineage analysis. Ifevery cell and every cell division can be tracked, onecan start with a tissue of interest (at a later time indevelopment), and then work backwards through thetime-lapse to discover which cells are the progenitorsat an earlier developmental point. For C. elegans thishas recently been extended to a semi-automaticmethod [6].
In the last few years, Selective Plane IlluminationMicroscopy (SPIM) [7, 8] and related light-sheetbased techniques [9–11] have expanded the poten-tial for 4D optical imaging. Recently, an approach totime-lapse imaging using Scanned Light Sheet Mi-croscopy (SLSM) has been applied to a vertebratemodel species (the zebrafish, Danio rerio), allowingthe majority of cell movements to be tracked duringthe first 24 hours of development [12]. The goal wasto capture a comprehensive data-set for the wholeembryo: fluorescent labelling of all cell nuclei wasemployed to track the position of each cell, and alsoto identify most of the cell divisions that took place.However, determination of the lineage of cells givingrise to a specific organ will require more accurate in-formation about cell divisions and a method foridentifying specific cell types, as well as imaging atlater stages of development.
In zebrafish, a key application for which accuratecell lineaging would be desirable concerns the pos-terior lateral line (pLL), a sensory organ analogousto the inner ear in mammals that senses movementsin the water surrounding the fish. During organo-genesis of the pLL, a transient structure called theprimordium, consisting of about 100 cells, migrates
along the anterior-posterior axis of the fish deposit-ing clusters of 20–30 cells at regular intervals (seeFigure 1a, b). These clusters mature into neuromasts,which contain a core of mechanosensory hair cells(HC) surrounded by support cells (Figure 1c, d). TheHC in fish are homologous to HC in the human ear,however unlike mammals fish are able to regeneratetheir HC when damaged. Any information on thelineage origin of these cells is therefore of direct in-terest to regenerative medicine, but accurately trac-ing the lineage of individual cells within such a dyna-mically moving and reorganizing structure is a majorchallenge for current commercially available imagingtechnology [13].
Primarily because of its speed in relation to point-scanning confocal microscopes, the current commer-cially-available state-of-the-art technology for imag-ing zebrafish primordium migration is the SpinningDisk Confocal (SDC) microscope. However, resultsfrom this technique are often insufficient in resolu-tion and/or signal-to-noise ratio to track cells for ac-curate lineaging. SPIM, and related light-sheet-based imaging techniques, obtain 3D images using afundamentally different approach compared to con-focal, 2-photon or spinning disc microscopes, andthis difference allows superior resolution and SNR.Specifically, because only the 2D slice of interest isilluminated at any point in time, images are gener-ated with reduced photobleaching and a reducedcontribution of background from out-of-focus re-
Figure 1 (online color at: www.biophotonics-journal.org)Development of the pLL in a zebrafish embryo. (a) Em-bryo 30 hpf, showing the migrating primordium and a de-posited proneuromast. (b) Higher magnification image ofa primordium and proneuromast visualized with mem-brane-tagged eGFP. (c) A mature neuromast with ciliatedhair cells (bright fluorescence) and the surrounding sup-port cells. (d) Embryo 48 hpf, after migration of the pri-mordium and deposition of the neuromasts. (a) and (d)were imaged with a low-magnification wide-field micro-scope, (b) and (c) with SPIM.
J. Biophotonics 4, No. 1–2 (2011) 123
FULLFULLARTICLEARTICLE
# 2011 by WILEY-VCH Verlag GmbH & Co. KGaA, Weinheimwww.biophotonics-journal.org
gions of the sample, allowing a superior SNR andresolution. Additionally, because the whole 2D sliceis captured in parallel using a camera, the techniqueis also faster than point-scanning approaches. Wetherefore wished to explore the extent to which 4Dtime-lapse SPIM imaging could allow directed retro-spective lineaging, thus allowing a detailed analysisof the origin of HC within the migrating primor-dium. In particular, rather than globally tracking allcell positions using solely an unspecific nuclear label(as in [12]), we have combined a nuclear label witha primordium-specific, differently-coloured mem-brane label to enhance the detection of the cell divi-sion events of interest. A third fluorescent label thatacts as an early molecular marker of the cell-typewe wish to study – the HC (described above) – isalso used. We show that this triple-label approach,in combination with the high resolution and lowphoto-toxicity of SPIM, allows retrospective celllineaging in the developing zebrafish pLL that wasnot possible using SDC technology.
2. Experimental
2.1. The SPIM apparatus
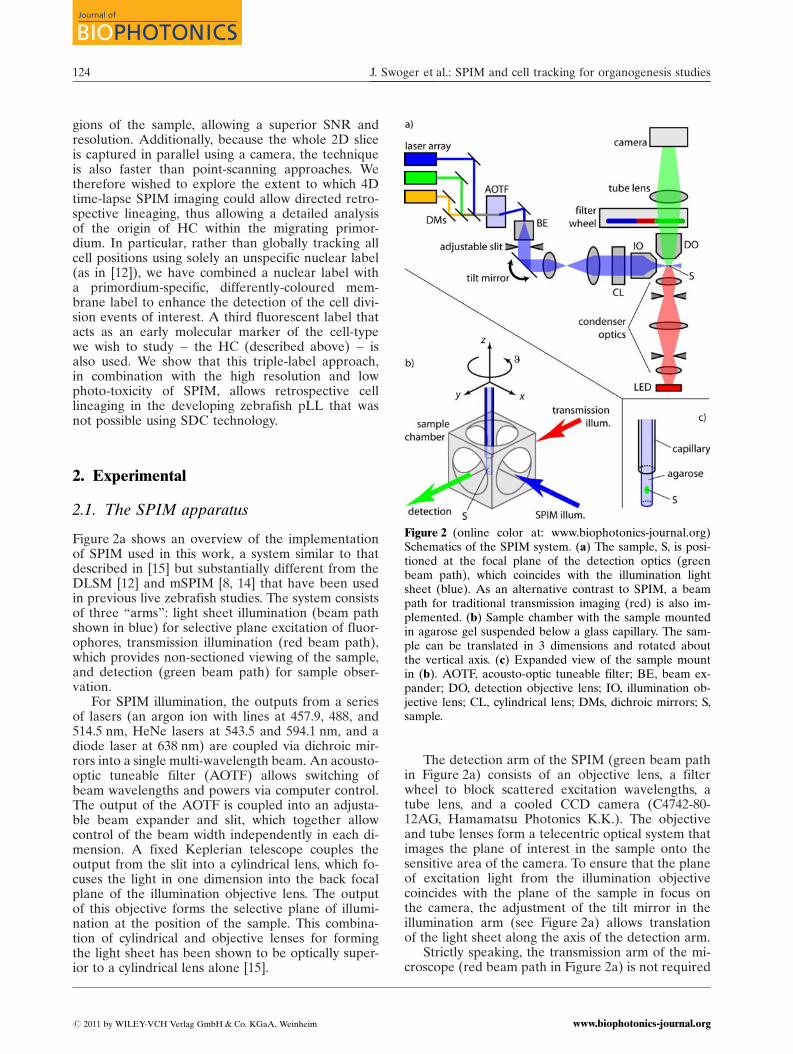
Figure 2a shows an overview of the implementationof SPIM used in this work, a system similar to thatdescribed in [15] but substantially different from theDLSM [12] and mSPIM [8, 14] that have been usedin previous live zebrafish studies. The system consistsof three “arms”: light sheet illumination (beam pathshown in blue) for selective plane excitation of fluor-ophores, transmission illumination (red beam path),which provides non-sectioned viewing of the sample,and detection (green beam path) for sample obser-vation.
For SPIM illumination, the outputs from a seriesof lasers (an argon ion with lines at 457.9, 488, and514.5 nm, HeNe lasers at 543.5 and 594.1 nm, and adiode laser at 638 nm) are coupled via dichroic mir-rors into a single multi-wavelength beam. An acousto-optic tuneable filter (AOTF) allows switching ofbeam wavelengths and powers via computer control.The output of the AOTF is coupled into an adjusta-ble beam expander and slit, which together allowcontrol of the beam width independently in each di-mension. A fixed Keplerian telescope couples theoutput from the slit into a cylindrical lens, which fo-cuses the light in one dimension into the back focalplane of the illumination objective lens. The outputof this objective forms the selective plane of illumi-nation at the position of the sample. This combina-tion of cylindrical and objective lenses for formingthe light sheet has been shown to be optically super-ior to a cylindrical lens alone [15].
The detection arm of the SPIM (green beam pathin Figure 2a) consists of an objective lens, a filterwheel to block scattered excitation wavelengths, atube lens, and a cooled CCD camera (C4742-80-12AG, Hamamatsu Photonics K.K.). The objectiveand tube lenses form a telecentric optical system thatimages the plane of interest in the sample onto thesensitive area of the camera. To ensure that the planeof excitation light from the illumination objectivecoincides with the plane of the sample in focus onthe camera, the adjustment of the tilt mirror in theillumination arm (see Figure 2a) allows translationof the light sheet along the axis of the detection arm.
Strictly speaking, the transmission arm of the mi-croscope (red beam path in Figure 2a) is not required
Figure 2 (online color at: www.biophotonics-journal.org)Schematics of the SPIM system. (a) The sample, S, is posi-tioned at the focal plane of the detection optics (greenbeam path), which coincides with the illumination lightsheet (blue). As an alternative contrast to SPIM, a beampath for traditional transmission imaging (red) is also im-plemented. (b) Sample chamber with the sample mountedin agarose gel suspended below a glass capillary. The sam-ple can be translated in 3 dimensions and rotated aboutthe vertical axis. (c) Expanded view of the sample mountin (b). AOTF, acousto-optic tuneable filter; BE, beam ex-pander; DO, detection objective lens; IO, illumination ob-jective lens; CL, cylindrical lens; DMs, dichroic mirrors; S,sample.
J. Swoger et al.: SPIM and cell tracking for organogenesis studies124
Journal of
BIOPHOTONICS
# 2011 by WILEY-VCH Verlag GmbH & Co. KGaA, Weinheim www.biophotonics-journal.org

for SPIM. However, for initial alignment of thesample it is extremely useful to be able to image intransmission mode as it reduces the exposure topotentially photo-damaging fluorescence excitationlight, and allows visualization of general morphologi-cal features of the sample which may not be fluores-cently labelled. Our transmission illumination armconsists of a light emitting diode (LED) operating at�680 nm as a source, coupled with condenser opticsthat allow control of the illumination field and aper-ture.
For imaging of live specimens in the SPIM, thesample is mounted in low-gelling-temperature agar-ose, which is extruded from a glass capillary (Fig-ure 2c). This capillary is attached to a manipulationstage that allows translation of the sample with sub-micron precision along the 3 principle axes of theinstrument. Precise rotation around the vertical (z)axis, which is orthogonal to both the illumination (x)and detection (y) axes is also possible.
The capillary holding the agarose and sample islowered into the sample chamber from above(Figure 2b). This chamber is open at the top and haswindows on the sides for illumination and viewing.For air immersion objectives, these windows aresealed to the chamber with glass cover slips, and theobjective is external to the chamber. For water dip-ping lenses, the tip of the objective is inserted intothe chamber and sealed with a rubber o-ring.
For 4D imaging over many hours, the majority ofthe adjustable microscope components need to becomputer controlled. In the system presented here,the AOTF, filter wheel, camera, LED, and themultiple-axis sample stage are controlled via a pro-gram written in the Labview programming language(National Instruments). This allows the illumination(laser excitation or LED transmission) to be syn-chronized with the detection (filter wheel and cam-era) and the scanning of the sample. Thus, 4D imageacquisitions can be programmatically defined at thebeginning of the experiment and left to run withminimal need for intervention from the user.
2.2. Sample preparation
Zebrafish were maintained under standard condi-tions, and embryos were obtained from natural mat-ings, collected and kept at 28.5 �C after injections.The following transgenic lines were used in thisstudy: cldnB:lyn-GFP [16] to highlight the pLL pri-mordium, proneuromasts and supporting cells withmembrane-tagged eGFP, and SqET4 [17] to visualizeHC and their immediate progenitors with eGFP.
To allow visualization of cell nuclei, the pCS2-H2B-tdTomato construct was generated by replacingthe mRFP1 cDNA in the pCS2-H2B-mRFP1 plas-
mid [18] with tdTomato cDNA [19] flanked by the50AgeI and 30SnaBI restriction sites. The plasmidwas linearized with NotI and mRNA synthesizedwith the mMessage mMachine SP6 kit (Ambion,AM1340) using the standard protocol. About 2 pg ofH2B-tdTomato mRNA were injected in embryos atthe 1-cell stage. Schematic representations of the cel-lular localization of these labels are shown in the in-set to Figure 3a.
Embryos with suitable GFP and tdTomato ex-pression were manually dechorionated and anesthe-tized in 610 mM Tricaine in E3 medium, which wasalso used as the immersion fluid during imaging.Embryos were embedded in agarose and introducedinto 2.7 mm diameter capillaries or 0.3 mL custom-ized syringes for SPIM imaging. For SDC imaging,embryos were mounted on the cover slip of MatTekglass bottom culture dishes N� 1.0, covered with 1%low-melting-point agarose (Invitrogen).
2.3. Data acquisition
In the SPIM experiments described herein, we useda 20�/0.5 water dipping objective lens (Leica HCXAPO L) for detection and a 10�/0.3 air objective(Leica HC PL FLUOTAR) for SPIM illumination.These provide suitable working distances for imagingintact zebrafish embryos of developmental stagespast 7 dpf, 3D resolution sufficient to resolve indivi-dual nuclei in the primordium, and a field of view of�330� 430 mm. SDC imaging was performed on aninverted Olympus microscope equipped with a Yo-kogawa CSU-X1 Spinning Disk scan head, an AndoriXon 897E EM-CCD camera, and a 20�/0.75 air ob-jective (Olympus UPlanSApo).
Typical exposure times for fluorescence imagingwere 100–200 ms; stacks with 30 to 100 slices (de-pending on the sample orientation) were recordedevery 4 minutes with a slice spacing of 1.5–2 mm. Toensure that the results from the SPIM and SDC mi-croscopes could be compared as objectively as possi-ble, the amount of time spent acquiring data at eachtime-point was the same for both systems. Illumina-tion powers and exposures were selected to optimizethe amount of signal collected in the time available,with the constraint that estimated photo-bleachinglevels would permit cell tracking over the course ofthe experiments (typically designed for 12 to 18 hours,although longer scans were performed when circum-stances permitted).
GFP fluorescence was excited with the 488 nmline of the argon ion laser and detected using a 525/50 bandpass filter. For the tdTomato channel, excita-tion was with the 543 nm HeNe laser and detectionwith a 575/60 bandpass filter. Within the detectionlimits of our system there was no crosstalk between
J. Biophotonics 4, No. 1–2 (2011) 125
FULLFULLARTICLEARTICLE
# 2011 by WILEY-VCH Verlag GmbH & Co. KGaA, Weinheimwww.biophotonics-journal.org

these channels, making them well suited for distin-guishing separate cellular compartments.
2.4. Cell tracking
Cell tracking was performed manually using MA-TLAB-based software. This allowed selection of ob-jects of interest (i.e. cells) in 4D data sets, and thecompilation of properties such as position and fluor-escence intensity of these objects. All of the fluores-cent markers in the embryo are important for suc-cessful tracking: cldnB:lyn-GPF gives the outline ofthe primordium and neuromasts by labelling theirmembranes; SqET4 drives GFP expression in devel-oping HC; and the H2B-tdTomato allows visualiza-tion of the nuclei for retrospective tracking of theSqET4+ cell precursors to the beginning of the time-lapse. Manual tracking was chosen as the most directmethod, as the goal of this work is to demonstratethat the system described is able to generate data ofsufficient quality for retrospective cell lineaging,rather than to automate the process of analysis.
This type of cell tracking is termed retrospectivebecause the process begins at the last time-point ofa time-lapse with the cells of interest (e.g. SqET4+cells), and these cells are tracked backwards in timeto discover their origins. Of course, tracking can alsobe prospective (i.e. proceed forward in time), butthis is a “blind” process in that until the tracking iscomplete the fate of the cells is not know, and itmight be necessary try many starting cells to “catch”a HC at the end of the time-lapse. This reflects oneof the major drawbacks of prospective lineaging, asdiscussed in the introduction.
3. Results and discussion
3.1. 4D SPIM visualizes pLL development
In the past, SPIM-related techniques have been usedto observe such developmental processes in zebra-fish as epiboly [12] and heart valve formation [20].In the work presented here, we use SPIM to explorethe technical possibility of retrospective lineage trac-ing in zebrafish pLL organogenesis by recording4D SPIM data sets of the migration of the primor-dium and maturation of proneuromasts. Figure 3represents a summary of one such experiment inwhich a cldnB : lyn-GFP H2B-tdTomato embryo wasimaged during 36 hours of developmental time. Thetime-lapse began at 0 h when the primordium wasquite close to the yolk sack and about to deposit itsfirst neuromast. The scanned region of the embryo
Figure 3 (online color at: www.biophotonics-journal.org)Visualization of the 4D primordium progression in acldnB : lyn-GFP, H2B-tdTomato zebrafish embryo. (a)Maximum-value projections through the GFP channel atselected time-points. The horizontal position of each time-point is relative to t ¼ 0; time-points are offset verticallyfor clarity. Lower left inset: schematic of cellular localiza-tion of fluorescent labels. cp, cytoplasm; pm, plasma mem-brane; n, nucleus. (b) Virtual slices and (c) maximum-valueprojections through the primordium at t ¼ 0. (d) Low-mag-nification bright-field image of the embryo taken with astereo microscope after the 36 hour SPIM time-lapse. Co-loured arrow-heads indicate the position of the posteriortip of the primordium at the time-points shown in (a).Scale bars: (a), (d) 100 mm; (b–c) 50 mm. See also Supple-mentary Video SV01.
J. Swoger et al.: SPIM and cell tracking for organogenesis studies126
Journal of
BIOPHOTONICS
# 2011 by WILEY-VCH Verlag GmbH & Co. KGaA, Weinheim www.biophotonics-journal.org

was shifted roughly every 4 hours to follow thecourse of the migration until 13 h 20 m, after whichthe primordium was allowed to leave the field ofview and the maturation of the last deposited pro-neuromast was imaged until 36 h.
Figure 3a shows a series of maximum-value pro-jections through 3D stacks of the GFP channel atthe times indicated (as the tdTomato channel doesnot distinguish between nuclei in the pLL and therest of the tissue, it has been omitted here for clarity).These have been cropped and rotated so that theprimordium migrates left-to-right across the field ofview. Thus the lateral field of view covers �1350 mmalong the anterior/posterior axis of the embryo inFigure 3a, albeit in 7 segments at different time-points. See Supplementary Video SV01 for the fulltime-lapse corresponding to Figure 3a, and SV02 & 03for another example of the use of SPIM for 4Dtime-lapse imaging of the developing zebrafish pLL.
Because it is difficult to see the smaller featuresof the data in the overview in Figure 3a, a sub-regioncontaining the primordium has been cropped anddisplayed at higher magnification in Figure 3b (vir-tual slices) and c (maximum-value projections). Inthese sub-figures both the GFP and tdTomato chan-nels are shown. The individual nuclei are visible inthe tdTomato channel, and the plasma membrane ofthe pLL cells is clearly seen in green.
Because it is difficult to get an overview of theentire embryo from the high-resolution sub-regionsthat are imaged with the SPIM, Figure 3d shows abright-field image of the embryo taken with a low-magnification stereo microscope after the comple-tion of the 36 hour imaging session that provided thedata for Figure 3a–c. The embryo was still alive andembedded in the cylinder of agarose gel. The posi-tions of the posterior tip of the primordium (0 to15 h 20 m) and the deposited proneuromast (21 h 20 mto 36 h) are indicated by colored arrowheads corre-sponding to those in Figure 3a. These positions areapproximate because the entire embryo and not justthe pLL developed over the 36 hour scan, but thebright-field image of course only represents the finaltime-point. Nevertheless, it is clear that the pLL de-velopment has been imaged during 36 hours overthe majority of its final extent.
3.2. Sample rotation optimizes imagingaccess
At the early stages of its migration, the primordiumin a zebrafish embryo is located in a concavity be-tween body and the bulge of the yolk sack [13]. Ithas been shown that performing multi-view recon-structions with SPIM data can yield improved imag-
ing in many situations [21–23]. However, for thesystem in this study this technique is not useful be-cause the organ of interest is a small bundle of cellsin a concavity on a much larger organism, and therange of angles from which useful views can be ob-tained is quite limited. Indeed, this can make evensingle-view imaging difficult if the sample is notproperly mounted, because either the body or theyolk may block the fluorescence excitation or emis-sion.
This issue can be overcome in the SPIM setupused in this study because the sample can be rotatedabout the vertical axis, as well as translated in thethree spatial dimensions. This allows one to preciselyrotate the sample while it is being imaged in theSPIM, to determine the optimal viewing angle [24].The process is illustrated in Figure 4, where 3D stacksof a live cldnB : lyn-GFP primordium have been ac-quired from 3 angles. Figure 4a shows slices fromeach stack; because of the rotation the slices showslightly different planes through the primordium, but
Figure 4 (online color at: www.biophotonics-journal.org)Sample rotation and access for imaging. (a) Slices fromSPIM stacks taken at �30�, 0�, and þ30� of a �28 hpfcldnB : lyn-GFP embryo. Illumination (ill.) and rotation(rot.) axes are indicated. (b) Expanded views of theregions indicated in (a). (c) Schematics of the imagingarrangement for the 3 viewing angles. Illumination and de-tection (det.) axes are indicated. m, muscle; y, yolk; p, pri-mordium. Scale bars: (a) 25 mm; (b) 10 mm.
J. Biophotonics 4, No. 1–2 (2011) 127
FULLFULLARTICLEARTICLE
# 2011 by WILEY-VCH Verlag GmbH & Co. KGaA, Weinheimwww.biophotonics-journal.org

all show the central rosette that is magnified inFigure 4b. Sketches (approximately to scale) of theimaging geometry perpendicular to the rotation axisare given in Figure 4c.
One can see that although the image at 0� isquite clear, when the sample was rotated by �30�
the illumination was blocked by substantial amountsof the muscle tissue resulting in horizontal shadowsin the image. Conversely, with a þ30� rotation muchof the fluorescence emission that would normallyhave been detected was blocked by the yolk sack,and the resulting image is both dimmer and less wellresolved. We estimate that for optimal imaging ofsuch a sample the orientation must be within �10�,which would place stringent requirements on thesample mounting procedure if it was not possible torotate the specimen within the microscope.
The use of a rotation stage for sample manipula-tion in microscopy is not unique to SPIM. However,most commercial microscopes (and many custombuilt ones) have their optical axis arranged vertically,which requires the rotation axis to be horizontal.Mounting a sample in agarose, as is done in thiswork, is beneficial because it minimizes refractive in-dex mismatches that can cause image distortions.However, in an arrangement in which the rotationaxis is horizontal the agarose gel tends to deform un-der rotation, due to forces exerted by gravity. There-fore microscope systems that employ a horizontal ro-tation axis typically have the sample either inside arigid glass capillary, e.g. [25], which will introduceaberrations in living samples that require an aqueousenvironment, or on the surface of such capillaries,which limits the viewing angle to a fraction of thefull 360� [26]. Since in SPIM the rotation axis is par-allel to the force of gravity, deformations of the agar-ose are minimized and accurate rotation and posi-tioning of the sample are possible.
3.3. 4D SPIM enables pLL cell lineagetracing
One currently exciting challenge in studying the or-ganogenesis of the pLL is to determine the origin ofthe sensory HC, and how their lineages diverge fromthe supporting cells of the mature neuromast. Oneapproach to this is to record a 4D data set in whichall of the cells can be individually identified, and inwhich the HC are specifically recognizable, at leastin the final frames. Once acquired, the time-lapsecan be played back in reverse, allowing retrospectiveback-tracking of the HC.
Three SPIM time-lapse data sets were capturedto explore the success of this approach. Figures 5and 6 show selected frames from a SPIM movie in
which several cells have been tracked throughout a28 hour period. The embryo was a cross of SqET4,which allows identification of HC progenitors by28 h, and cldnB : lyn-GFP to highlight cells in the pri-mordium and proneuromast. In addition, the embryowas injected with H2B-tdTomato mRNA (see Sec-tion 2.2 on sample preparation) to visualize the nu-clei for accurate identification of dividing cells.
Figure 5 shows the size and shape of the primor-dium (t < 16 h) and the deposited proneuromast.The data set followed the migration of the primor-dium until t � 16 h, and then allowed it to leave thefield of view and remained centred on the depositedneuromast. In Figure 5a the scale along the horizon-tal axis is absolute, and although the individual time-points do not cover the entire range, the time seriesas a whole followed the primordium’s migration over
Figure 5 (online color at: www.biophotonics-journal.org)Selected frames from a SPIM time-lapse experiment. (a)Maximum-value projections along the detection axis of theGFP channel. (b) Expanded views of the primordium andneuromast in (a). The locations of tracked cells are indi-cated by coloured circles; cell divisions by arrowheads; thepoint at which one tracked cell migrates out of the field ofview by a green asterisk. Coloured lines schematically re-present the temporal continuity of the cell tracking. Forclarity, the H2B-tdTomato channel has been omitted. Scalebars 50 mm. See also Supplementary Video SV04.
J. Swoger et al.: SPIM and cell tracking for organogenesis studies128
Journal of
BIOPHOTONICS
# 2011 by WILEY-VCH Verlag GmbH & Co. KGaA, Weinheim www.biophotonics-journal.org

�500 mm. Figure 5b depicts the same time-points,with the primordium shown on an expanded scale.
In Figure 5b, the locations of cells that weretracked in 4D are indicated by the coloured circlesand lines. Two lineages are present: C1, consisting ofC1.0 and its progeny, for which the final fate(s) arenot known; and C2 (C2.0, C2.1 and C2.2), whichwere HC progenitors.
Because the images in Figure 5 and Supplemen-tary Video SV04 are projections they give a goodoverview of the migration process, but in them thedetails of the development on a cellular level are notobvious. To illustrate this aspect of the data set, Fig-ure 6 shows several 2D slices extracted from the full4D time-lapse. Figure 6a and b consist of slices thatdepict the division of cells C2.0 and C1.2, respec-tively, at 18 h 34 m and 20 h 58 m. The condensedchromatin in the metaphase plate and the separationinto the two daughter cells can be clearly seen. Be-cause some of the most rapid rearrangements of thecells occur during mitosis, following these cellsthrough this process was among the more demand-ing stages of the tracking.
At later stages in the development of the neuro-mast, HC can be identified by their cilia alone, with-out requiring specific genetic markers. However,since this would require prohibitively long time-lapses we have taken advantage of the SqET4 trans-genic zebrafish line, which expresses eGFP ubiqui-tously in HC and their immediate progenitors. Fig-ure 6c shows two virtual slices from the final time-point that contain cells C2.1 and C2.2. These cellsclearly exhibit cytoplasmic GFP fluorescence, so thatthe time-lapse could be halted at this point with cer-tainty that the data set contained cells that wouldeventually become mature HC. It is known thatSqET4 cells expressing eGFP do not divide again, sofurther tracking of these cells is not required to cre-ate a complete lineage. The retrospective cell track-ing that was then performed indicated that C2.0 wasthe earliest ancestor of these progenitor cells thatthe time window of the data set contained. In con-trast, the tracking of the C1 lineage was prospective:cell C1.0 was chosen because it underwent mitosiswithin the first half-hour of the time-lapse, and itand its progeny were tracked “forward” in time.
Figures 5 and 6 depict various aspects of the pro-cess of tracking cells in a migrating primordium, butbecause the images are either 2D projections (Fig-ure 5) or slices (Figure 6), they do not really demon-strate the volumetric nature of the cell traces. To illus-trate this in a more concrete form, the 3D Cartesiancoordinates of the tracked cells are plotted vs. timein Figure 7. The anterior-posterior axis along whichthe primordium migrates was at an angle of �25� tothe x-axis, as indicated in the inset of Figure 7c.
From the Figure 7 various quantitative parametersdescribing the development of the pLL can be ex-
tracted. For instance when averaged over severalhours, the cells in the primordium migrated at afairly constant rate of �30 mm/h, with occasionalbursts of speed of up to 100 mm/h. Although the pro-neuromast separated from the primordium at 18 h, it
18h 28m 20h 52m
18h 32m
18h 36m
20h 56m
21h 00m
a) b)
C2.0
C1.2
C1.2.1C1.2.2C2.1
C2.2
C2.0
C1.2
C2.1
C2.2
28h 14mc)
Figure 6 (online color at: www.biophotonics-journal.org)(a), (b) Consecutive frames from the same SPIM time-lapse as Figure 5. Virtual slices showing planes of cell divi-sions of tracked cells are shown. The cell division at18 h 34 m (a) and 20 h 58 m (b) are shown. (c) Virtualslices at the end of the time-lapse indicating the HC pro-genitors expressing cytoplasmic GFP. Arrowheads indicatecells denoted by the same-coloured circles in Figure 5. Redfluorescence channel, H2B-tdTomato; green, GFP. Scalebar 20 mm.
J. Biophotonics 4, No. 1–2 (2011) 129
FULLFULLARTICLEARTICLE
# 2011 by WILEY-VCH Verlag GmbH & Co. KGaA, Weinheimwww.biophotonics-journal.org
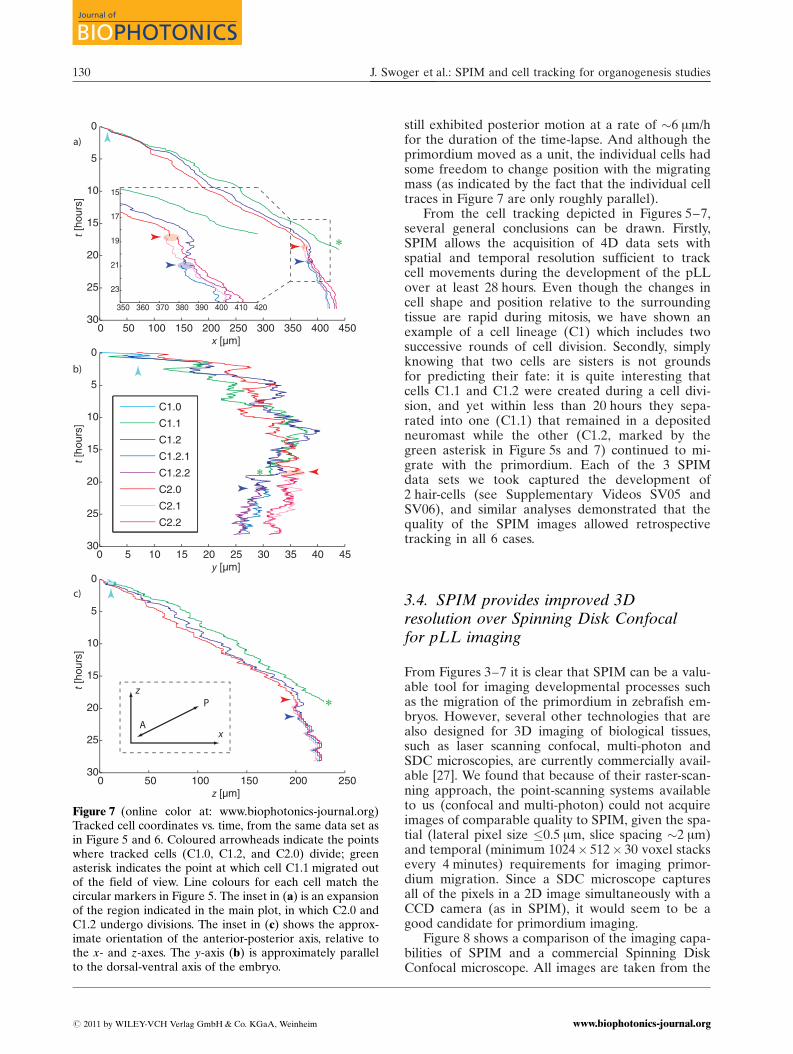
still exhibited posterior motion at a rate of �6 mm/hfor the duration of the time-lapse. And although theprimordium moved as a unit, the individual cells hadsome freedom to change position with the migratingmass (as indicated by the fact that the individual celltraces in Figure 7 are only roughly parallel).
From the cell tracking depicted in Figures 5–7,several general conclusions can be drawn. Firstly,SPIM allows the acquisition of 4D data sets withspatial and temporal resolution sufficient to trackcell movements during the development of the pLLover at least 28 hours. Even though the changes incell shape and position relative to the surroundingtissue are rapid during mitosis, we have shown anexample of a cell lineage (C1) which includes twosuccessive rounds of cell division. Secondly, simplyknowing that two cells are sisters is not groundsfor predicting their fate: it is quite interesting thatcells C1.1 and C1.2 were created during a cell divi-sion, and yet within less than 20 hours they sepa-rated into one (C1.1) that remained in a depositedneuromast while the other (C1.2, marked by thegreen asterisk in Figure 5s and 7) continued to mi-grate with the primordium. Each of the 3 SPIMdata sets we took captured the development of2 hair-cells (see Supplementary Videos SV05 andSV06), and similar analyses demonstrated that thequality of the SPIM images allowed retrospectivetracking in all 6 cases.
3.4. SPIM provides improved 3Dresolution over Spinning Disk Confocalfor pLL imaging
From Figures 3–7 it is clear that SPIM can be a valu-able tool for imaging developmental processes suchas the migration of the primordium in zebrafish em-bryos. However, several other technologies that arealso designed for 3D imaging of biological tissues,such as laser scanning confocal, multi-photon andSDC microscopies, are currently commercially avail-able [27]. We found that because of their raster-scan-ning approach, the point-scanning systems availableto us (confocal and multi-photon) could not acquireimages of comparable quality to SPIM, given the spa-tial (lateral pixel size �0.5 mm, slice spacing �2 mm)and temporal (minimum 1024� 512� 30 voxel stacksevery 4 minutes) requirements for imaging primor-dium migration. Since a SDC microscope capturesall of the pixels in a 2D image simultaneously with aCCD camera (as in SPIM), it would seem to be agood candidate for primordium imaging.
Figure 8 shows a comparison of the imaging capa-bilities of SPIM and a commercial Spinning DiskConfocal microscope. All images are taken from the
0 5 10 15 20 25 30 35 40 45
0
5
10
15
20
25
30
y [µm]
t [h
ours
]
0 50 100 150 200 250
0
5
10
15
20
25
30
z [µm]
t [h
ours
]
0 50 100 150 200 250 300 350 400 450
0
5
10
15
20
25
30
x [µm]
t [h
ours
]
350 360 370 380 390 400 410 420
15
17
19
21
23
∗
∗
∗
C1.0
C1.1
C1.2
C1.2.1
C1.2.2
C2.0
C2.1
C2.2
a)
b)
c)
x
z
A
P
Figure 7 (online color at: www.biophotonics-journal.org)Tracked cell coordinates vs. time, from the same data set asin Figure 5 and 6. Coloured arrowheads indicate the pointswhere tracked cells (C1.0, C1.2, and C2.0) divide; greenasterisk indicates the point at which cell C1.1 migrated outof the field of view. Line colours for each cell match thecircular markers in Figure 5. The inset in (a) is an expansionof the region indicated in the main plot, in which C2.0 andC1.2 undergo divisions. The inset in (c) shows the approx-imate orientation of the anterior-posterior axis, relative tothe x- and z-axes. The y-axis (b) is approximately parallelto the dorsal-ventral axis of the embryo.
J. Swoger et al.: SPIM and cell tracking for organogenesis studies130
Journal of
BIOPHOTONICS
# 2011 by WILEY-VCH Verlag GmbH & Co. KGaA, Weinheim www.biophotonics-journal.org
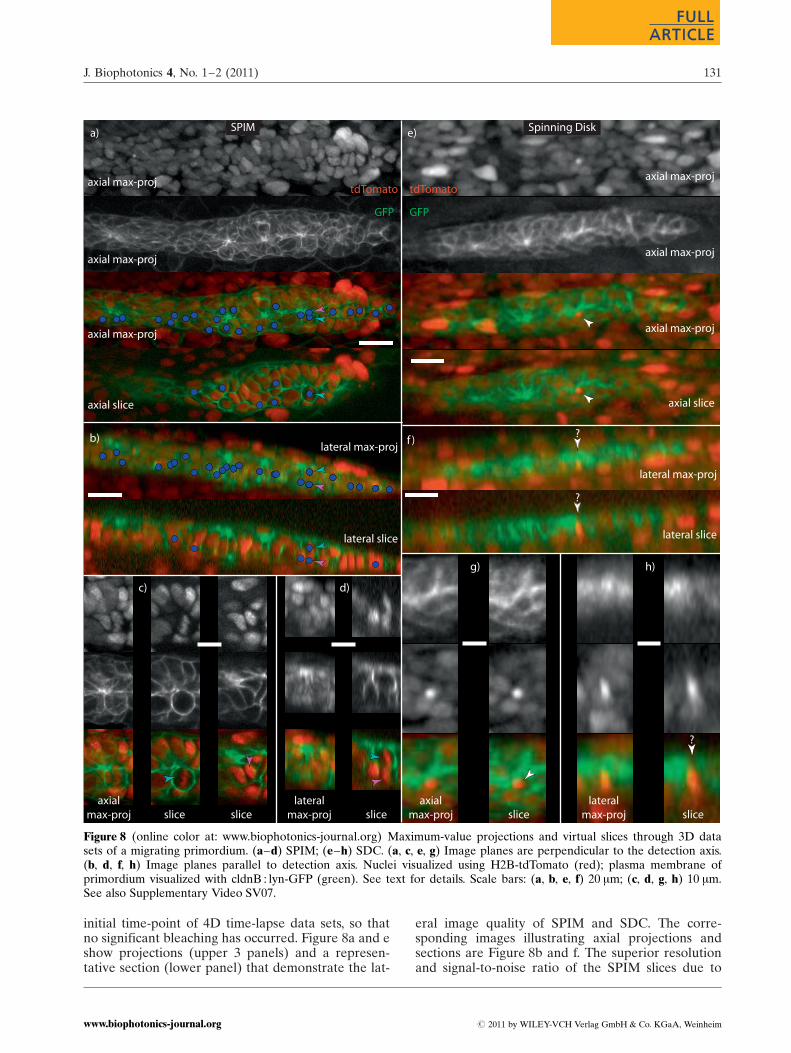
initial time-point of 4D time-lapse data sets, so thatno significant bleaching has occurred. Figure 8a and eshow projections (upper 3 panels) and a represen-tative section (lower panel) that demonstrate the lat-
eral image quality of SPIM and SDC. The corre-sponding images illustrating axial projections andsections are Figure 8b and f. The superior resolutionand signal-to-noise ratio of the SPIM slices due to
axial max-proj
axial max-proj
axial max-proj
axial slice
lateral max-proj
a)
axial max-proj
axial max-proj
axial max-proj
axial slice
?
?
lateral max-proj
lateral slice
b)
slice slice sliceaxial
max-proj
?
lateralmax-proj
axialmax-proj
lateralmax-proj
GFP
tdTomato
GFP
tdTomato
c) d)
e)
f )
g) h)
lateral slice
slice slice
SPIM Spinning Disk
Figure 8 (online color at: www.biophotonics-journal.org) Maximum-value projections and virtual slices through 3D datasets of a migrating primordium. (a–d) SPIM; (e–h) SDC. (a, c, e, g) Image planes are perpendicular to the detection axis.(b, d, f, h) Image planes parallel to detection axis. Nuclei visualized using H2B-tdTomato (red); plasma membrane ofprimordium visualized with cldnB : lyn-GFP (green). See text for details. Scale bars: (a, b, e, f) 20 mm; (c, d, g, h) 10 mm.See also Supplementary Video SV07.
J. Biophotonics 4, No. 1–2 (2011) 131
FULLFULLARTICLEARTICLE
# 2011 by WILEY-VCH Verlag GmbH & Co. KGaA, Weinheimwww.biophotonics-journal.org
the efficient illumination which allows increased in-focus excitation intensities with low photo-damage,is evident.
It was found that although the SPIM data is ofsufficient quality for the type of cell-tracking dis-cussed in Section 3.3, we were not able to perform asimilar analysis with the SDC data. The blue circlesin Figure 8a and b are annotations generated usingthe same software used for tracking in Section 3.3.These particular cells were selected as a surveyacross the pLL of the distribution of trackable cells.The results demonstrate that cells in all regions ofthe primordium are suitable, and that trackable cellsare not limited to cells of a particular size, shape, orstage of the cell cycle.
Two cells that exemplify the issues involvedwhen attempting to track cells in the primordiumare indicated by the cyan and magenta arrowheadsin Figure 8a and b. These are shown in greaterdetail in sub-regions of the 3D data that are dis-played in Figure 8c (with orientation as in 8a) and8d (orientation as 8b). These cells are close to beingaligned directly along the microscope detection axis.Since this is the axis with the poorest resolutionand the cells (cyan and magenta arrowheads) areclearly distinguishable along both the lateral andaxial directions, they demonstrate the advantages ofSPIM for the 3D tracking even cells in this challen-ging configuration.
The white arrowheads in Figure 8e–h indicate acell (or cells) in the SDC data that appears to beclearly identifiable in the axial projections and slices(8e and g). However, when viewed perpendicular tothe axis of the microscope (8f and h), it becomesclear that it is not possible to accurately localize thecell within the thickness of the primordium, or evenbe sure if there are multiple cells in this region. Thisdemonstrates the necessity of high 3D resolution ifcells are to be accurately tracked over extended per-iods of the primordium migration. 2D representa-tions of the primordium by means of maximum-value projections can be very valuable, e.g. [16, 28],but they do not allow reliable cell tracking in dy-namic 3D structures such as the zebrafish primor-dium.
The principle reason that SPIM performs betterthan the SDC microscope in this application is theefficient illumination strategy. In SPIM only the in-focus plane being imaged at a given time is illumi-nated, whereas in SDC microscopy the entire samplevolume must be illuminated even when imaging asingle plane. Both techniques achieve optical sec-tioning, but because SPIM does not excite out-of-focus fluorophores and then reject their emissionwith a pin-hole, much lower integrated exposuresare required per stack. Better signal-to-noise ratioscan therefore be obtained without exceeding photo-damage or -bleaching thresholds.
It is worth noting that in our hands, SPIM out-performs SDC even though the SPIM data was col-lected with an objective with a numerical aperture(NA) of 0.5, whereas the SDC used a NA ¼ 0.75 ob-jective. Since the theoretical lateral resolution of anobjective is proportional to the NA (and the axialresolution to NA2) [29], one would predict betterperformance for the SDC with the objectives used.There are several reasons why this is not seen in Fig-ure 8. Firstly, the resolving power of the microscopedoes not depend only on the NA of the objective;the signal-to-noise characteristics and pixel spacing(both of which are better in the SPIM system usedthan the SDC) both affect the resolution [30]. Sec-ondly, our SPIM system uses an objective designedfor water immersion, which minimizes optical aber-rations that can compromise resolution. The SDCobjective used was designed for use in air (neces-sarily, because of the geometry of its inverted mic-roscope platform), but used to image an aqueoussample through a glass-bottom petri dish, a config-uration known to induce spherical aberrations thatcan reduce resolution [31]. Thirdly, in SPIM the axialresolution is generally determined by the thicknessof the illumination light sheet rather than the detec-tion objective used [32], and thus the above consid-erations about the detection NA are not relevant, atleast when considering the resolution along the de-tection axis.
4. Conclusions
In this work we present an imaging approach whichreaches a new level of accuracy for retrospectivelineage tracing in an example of vertebrate organo-genesis. This advance arises from the combinationof: 1) choosing a specific lineage question in zebra-fish organogenesis, 2) a suitable triple combinationof fluorescent transgenic lines and molecular mar-kers, and 3) the use of SPIM technology for highquality and low photo-toxicity imaging. pLL organo-genesis has been chosen both because of its intrinsicinterest as a developmental and potentially medi-cally important system and because of its compatibil-ity with optical imaging techniques. The combinationof membrane-labelling cldnB : lyn-GFP and the nuc-lear label H2B-tdTomato allows clear identificationof the cells and nuclear structure within the primor-dium and neuromasts of the pLL; in addition, theGFP signal from the SqET4 transgenic line permitsearly identification of the cell type of interest – theHC. The intrinsic optical sectioning, low photo-bleach-ing and photo-damage, high signal-to-noise ratio,and flexible sample manipulation make SPIM wellsuited for capturing quantitative data sets of pLL de-velopment.
J. Swoger et al.: SPIM and cell tracking for organogenesis studies132
Journal of
BIOPHOTONICS
# 2011 by WILEY-VCH Verlag GmbH & Co. KGaA, Weinheim www.biophotonics-journal.org
Using this system we have demonstrated time-lapse imaging of primordium migration and proneur-omast development for up to 36 hours. The advan-tages of SPIM in terms of sample alignment havebeen illustrated, which are particularly importantwhen imaging the early stages of primordium migra-tion when the primordium is close to the bulge ofthe yolk sack. We have also shown that because ofits efficient illumination scheme SPIM can providesuperior 3D resolution and image quality comparedto SDC microscopy.
These features of the time-lapse data (clear iden-tification of cellular features, flexible sample mount-ing, and high image quality) are essential in thiswork because they allow us to retrospectively trackindividual cells during the development of the pLL.This 4D tracking provides cell lineages over severalcell cycles, on the order of tens of hours; such datasets open up the possibility of creating complete celllineages for the pLL. With some effort put into algo-rithms for cell segmentation and identification, thequality of the data sets described here should enableautomated lineage tracing of many/all cells in thezebrafish pLL. This information would be a valuableasset in the field of regenerative medicine because itwould help to determine why and how HC in fishare able to regenerate, whereas permanent total orpartial deafness is the result of damage to HC in hu-mans.
Acknowledgements M.M. was supported by grant M1F1-CT2006-041020 from the Marie Curie Fellows Association.HL-S gratefully acknowledges funding from the ERCStGgrant “SENSORINEURAL”. Thanks to T. Zimmerman &R. Garcıa for assistance with the Spinning Disk Confocalmicroscope.
Jim Swoger completed hisPh.D. at McMaster Univer-sity in Hamilton, Canadawith a thesis on semiconduc-tor laser physics in 1997. Hethen moved to the Light Mi-croscopy Group at the Euro-pean Molecular BiologyLaboratory in Heidelberg,Germany, working on opti-cal microscopy systems. In2005 he joined the Sharpelab at the Human GeneticsUnit of the Medical Research
Centre in Edinburgh, UK and spent a year investigat-ing 3D imaging of mouse embryology using opticalprojection tomography. Since 2006 he has been a staffscientist developing optical techniques for mesoscopicimaging in the Systems Analysis of Developmentgroup at the Centre for Genomic Regulation in Barce-lona, Spain.
Mariana Muzzopappa re-ceived her Ph.D. in Bio-logical Chemistry from theUniversity of Buenos Aires(UBA), Argentina. Shestarted doing research in thefield of Developmental Biol-ogy, studying the role of theF-box protein Slimb duringDrosophila oogenesis. In2006 she started as a post-doc in the Lopez-Schier lab
at the Centre for Genomic Regulation, Barcelona. Sheused the zebrafish lateral line as a model to study howvertebrate sensory organs acquire a particular architec-ture during development. At the CRG, she also workedin collaboration with Jim Swoger to image long-termorgan formation in fish using the SPIM.
Hernan Lopez-Schier com-pleted his Ph.D. at the Well-come/CR-UK Gurdon In-stitute and the Departmentof Genetics, University ofCambridge in the UK, grad-uating in 2001 with a thesison the genetic bases of cellpolarity in Drosophila. Hesubsequently moved to theLaboratory of Sensory Neu-roscience at the RockefellerUniversity in New York,
USA to work on lateral-line development and regen-eration in the zebrafish. Since 2006 he is the GroupLeader of the Laboratory of Sensory Cell Biology &Organogenesis at the CRG in Barcelona, Spain.
James Sharpe completed hisdegree in Biology at OxfordUniversity in1991, and thenundertook a Ph.D. in devel-opmental genetics at theMRC National Institute forMedical Research in Lon-don until 1997. After a brief
postdoc in Chile, he moved to Edinburgh under anMRC Training Fellowship at the Human Genetics Unitwith the goal of building computational models of limbdevelopment. In 2002 he invented the 3D imaging tech-nique Optical Projection Tomography (OPT). In 2006he moved to the new CRG institute in Bareclona, tobecome a senior group leader in the EMBL-CRG Sys-tems Biology Program, and ICREA Research Profes-sor.
J. Biophotonics 4, No. 1–2 (2011) 133
FULLFULLARTICLEARTICLE
# 2011 by WILEY-VCH Verlag GmbH & Co. KGaA, Weinheimwww.biophotonics-journal.org
References
[1] P. Q. Thomas, A. Brown, and R. S. P. Beddington,Development 125, 85–94 (1998).
[2] K. A. Lawson, J. J. Meneses, and R. A. Pedersen, De-velopment 113, 891–911 (1991).
[3] C. G. Arques, R. Doohan, J. Sharpe, and M. Torres,Development 134, 3713–3722 (2007).
[4] U. Deppe, E. Schierenberg, T. Cole, C. Krieg,D. Schmitt, B. Yoder, and G. von Ehrenstein, P.N.A.S.75(1), 376–380 (1978).
[5] R. Schnabel, H. Hutter, D. Moerman, and H. Schna-bel, Dev. Biol. 184, 234–265 (1997).
[6] Z. Bao, J. I. Murray, T. Boyle, S. L. Ooi, M. J. Sandel,and R. H. Waterston, PNAS 103(8), 2707–2712 (2006).
[7] J. Huisken, J. Swoger, F. del Bene, J. Wittbrodt, andE. H. K. Stelzer, Science 305, 1007–1009 (2004).
[8] J. Huisken and D. Y. R. Stainier, Development 136,1963–1975 (2009).
[9] J. A. N. Buytaert and J. J. J. Dirckx, Appl. Optics48(5), 941–948 (2009).
[10] T. F. Holekamp, D. Turaga, and T. E. Holy, Neuron57, 661–672 (2008).
[11] H.-U. Dodt, U. Leischner, A. Schierloh, N. Jahrling,C. P. Mausch, K. Deininger, J. M. Deussing, M. Eder,W. Zieglgansberg, and K. Becker, Nat. Methods 4(4),331–336 (2007).
[12] P. J. Keller, A. D. Schmidt, J. Wittbrodt, and E. H. K.Stelzer, Science 322, 1065–1069 (2008).
[13] L. Laguerre, A. Ghysen, and C. Dambly-Chaudiere,Dev. Dyn. 238, 1042–1051 (2009).
[14] J. Huisken and D. Y. R. Stainier, Opt. Letts. 32(17)2608–2610 (2007).
[15] K. Greger, J. Swoger, and E. H. K. Stelzer, Rev. Sci.Instr. 78, 023705-1-7 (2007).
[16] P. Haas and D. Gilmour, Dev. Cell 10(5), 673–680(2006).
[17] S. Parinov, I. Kondrichin, V. Korzh, and A. Emelyanov,Dev. Dyn. 231(2), 449–459 (2004).
[18] S. G. Megason and S. E. Fraser, Mech. Dev. 120(11),1407–1420 (2003).
[19] N. C. Shaner, R. E. Campbell, P. A. Steinbach, B. N. G.Giepmans, A. E. Palmer, and R. Y. Tsien, Nat. Bio-tech. 22(12), 1567–1572 (2004).
[20] P. J. Scherz, J. Huisken, P. Sahai-Hernadez, and D. Y. R.Stainier, Development 135, 1179–1187 (2008).
[21] P. J. Verveer, J. Swoger, F. Pampaloni, K. Greger,M. Marcello, and E. H. K. Stelzer, Nat. Methods 4(4),311–313 (2007).
[22] J. Swoger, P. Verveer, K. Greger, J. Huisken, andE. H. K. Stelzer, Opt. Express 15(13), 8029–8042(2007).
[23] S. Preibisch, S. Saalfeld, J. Schindelin, and P. Toma-nack, Nat. Methods 7(6), 418–419 (2010).
[24] J. Huisken, Ph.D. thesis, Albert-Ludwigs-UniversitatFreiburg im Breisgau (2004), p. 95.
[25] C. J. Cogswell, K. G. Larkin, and H. U. Klemm, Proc.SPIE 2655, 109–115 (1996).
[26] M. Kozubek, M. Skalnıkova, P. Matula, E. Bartova,J. Rauch, F. Neuhaus, H. Eipel, and M. Hausmann,Micron 33 655–665 (2002).
[27] J. B. Pawley (ed.), Handbook of Biological ConfocalMicroscopy, 3rd Ed. (Springer, Singapore, 2006).
[28] V. Lecaudey, G. Cakan-Akdogan, W. H. J. Norton,and D. Gilmour, Development 135, 2695–2705 (2008).
[29] S. Inoue, in: J. B. Pawley (ed.), Handbook of Biolo-gical Confocal Microscopy, 3rd ed. (Springer, Singa-pore, 2006), pp. 1–4.
[30] E. H. K. Stelzer, J. Microscopy 189(1), 15–24 (1998).[31] A. Egner and S. W. Hell, in: J. B. Pawley (ed.), Hand-
book of Biological Confocal Microscopy, 3rd ed.(Springer, Singapore, 2006), pp. 404–413.
[32] C. J. Engelbrecht and E. H. K. Stelzer, Opt. Lett.32(10), 1477–1479 (2006).
J. Swoger et al.: SPIM and cell tracking for organogenesis studies134
Journal of
BIOPHOTONICS
# 2011 by WILEY-VCH Verlag GmbH & Co. KGaA, Weinheim www.biophotonics-journal.org