fulcrum utility services limited annual report and .../media/files/f/fulcrum/... · fulcrum utility...
TRANSCRIPT

Fulcru
m U
tility Services Lim
ited A
nn
ual R
epo
rt and
Acco
un
ts 2015
Fulcrum Utility Services LimitedAnnual Report and Accounts 2015
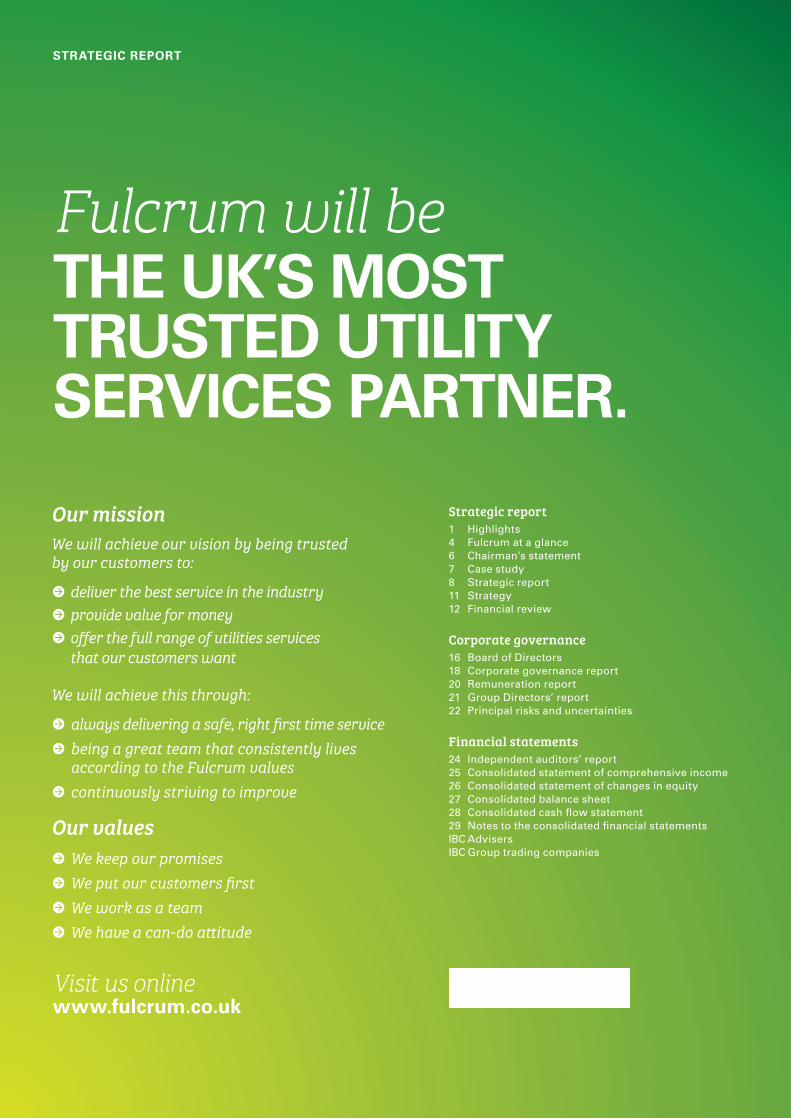
Fulcrum will be THE UK’S MOST TRUSTED UTILITY SERVICES PARTNER.
Our missionWe will achieve our vision by being trusted by our customers to:
z deliver the best service in the industryz provide value for moneyz offer the full range of utilities services
that our customers want
We will achieve this through:
z always delivering a safe, right first time service
z being a great team that consistently lives according to the Fulcrum values
z continuously striving to improve
Our valuesz We keep our promises
z We put our customers first
z We work as a team
z We have a can-do attitude
N Read more about our business from page 2
Strategic report 1 Highlights4 Fulcrum at a glance6 Chairman’s statement7 Case study8 Strategic report11 Strategy12 Financial review
Corporate governance 16 Board of Directors18 Corporate governance report20 Remuneration report21 Group Directors’ report22 Principal risks and uncertainties
Financial statements 24 Independent auditors’ report25 Consolidated statement of comprehensive income26 Consolidated statement of changes in equity27 Consolidated balance sheet28 Consolidated cash flow statement29 Notes to the consolidated financial statementsIBC AdvisersIBC Group trading companies
Visit us onlinewww.fulcrum.co.uk
STRATEGIC REPORT
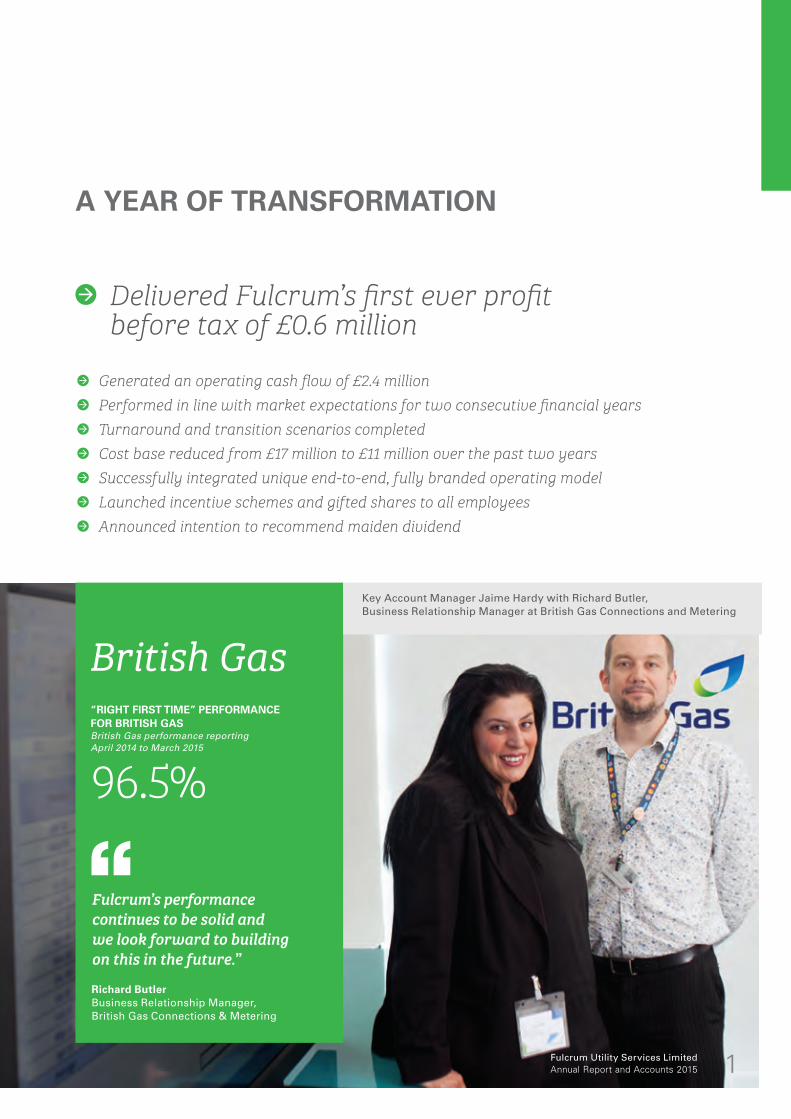
A YEAR OF TRANSFORMATION
z Generated an operating cash flow of £2.4 millionz Performed in line with market expectations for two consecutive financial yearsz Turnaround and transition scenarios completedz Cost base reduced from £17 million to £11 million over the past two yearsz Successfully integrated unique end-to-end, fully branded operating modelz Launched incentive schemes and gifted shares to all employeesz Announced intention to recommend maiden dividend
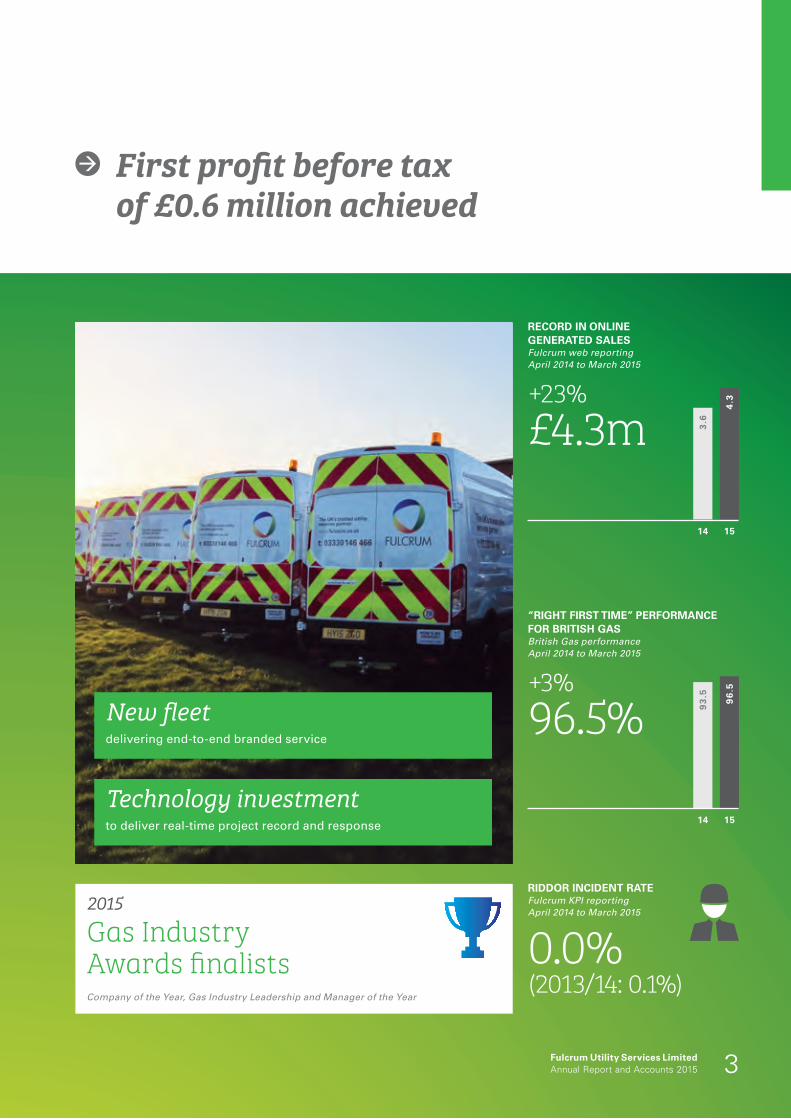
z Delivered Fulcrum’s first ever profit before tax of £0.6 million
Fulcrum’s performance continues to be solid and we look forward to building on this in the future.”
Richard ButlerBusiness Relationship Manager, British Gas Connections & Metering
British Gas
“RIGHT FIRST TIME” PERFORMANCE FOR BRITISH GASBritish Gas performance reporting April 2014 to March 2015
96.5%
Key Account Manager Jaime Hardy with Richard Butler, Business Relationship Manager at British Gas Connections and Metering
Fulcrum Utility Services LimitedAnnual Report and Accounts 2015 1

We have had... A TRANSFORMATIONAL YEAR
Over
six yearsincident freeOver six and a half years without a Lost Time Injury for Fulcrum people
2014
Utility WeekAwards finalistsCapital Project Management Award for the installation of the £7.6m, 16-mile Speyside gas pipeline 2015 Gas Industry
Awards winnerCarly Gilchrist, Young Person’s Achievement Award
Move to directly managed delivery doubles workforce
New online brand, FirstGas, launchedIntroduction of unique, click and connect online service
Greg Berry, Sales Executive, FirstGas
STRATEGIC REPORT
2 Fulcrum Utility Services LimitedAnnual Report and Accounts 2015
4.3
3.6
14 15
RECORD IN ONLINE GENERATED SALESFulcrum web reporting April 2014 to March 2015
+23%£4.3m
96
.5
93
.5
14 15
“RIGHT FIRST TIME” PERFORMANCE FOR BRITISH GASBritish Gas performance April 2014 to March 2015
+3%96.5%
RIDDOR INCIDENT RATEFulcrum KPI reporting April 2014 to March 2015
0.0%(2013/14: 0.1%)
z First profit before tax of £0.6 million achieved
Technology investment to deliver real-time project record and response
New fleetdelivering end-to-end branded service
2015
Gas IndustryAwards finalistsCompany of the Year, Gas Industry Leadership and Manager of the Year
Fulcrum Utility Services LimitedAnnual Report and Accounts 2015 3
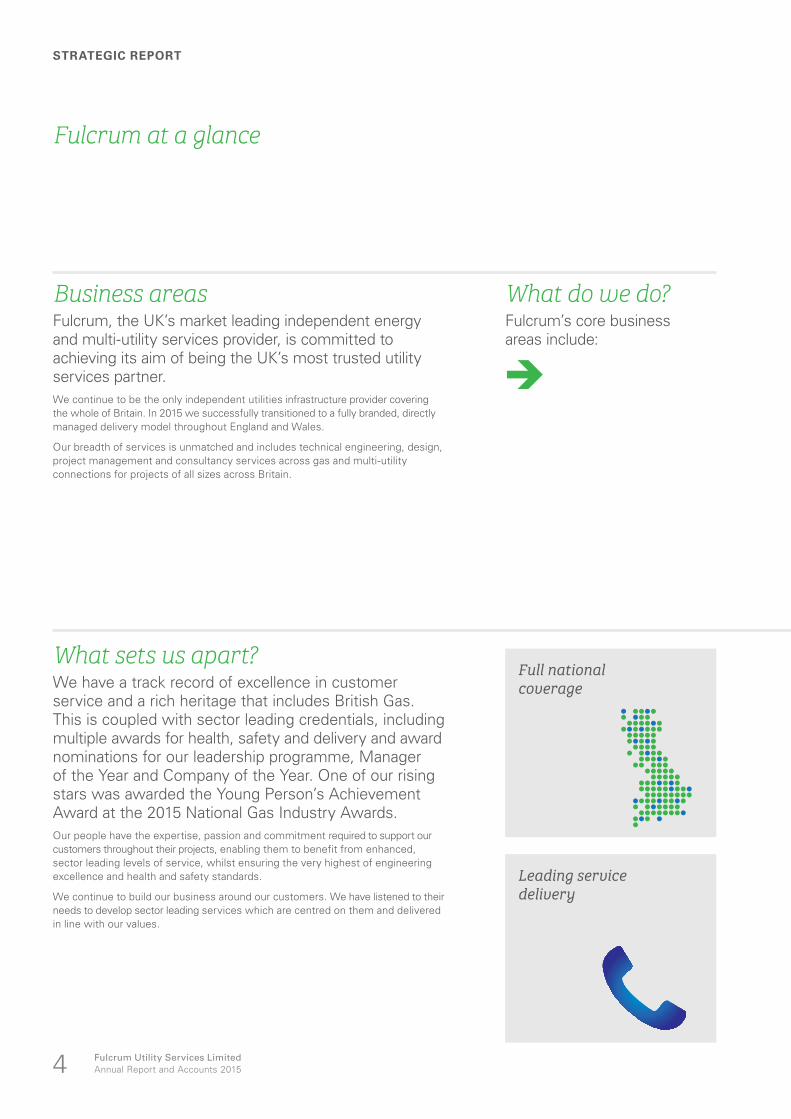
Fulcrum at a glance
Business areasFulcrum, the UK’s market leading independent energy and multi-utility services provider, is committed to achieving its aim of being the UK’s most trusted utility services partner.We continue to be the only independent utilities infrastructure provider covering the whole of Britain. In 2015 we successfully transitioned to a fully branded, directly managed delivery model throughout England and Wales.
Our breadth of services is unmatched and includes technical engineering, design, project management and consultancy services across gas and multi-utility connections for projects of all sizes across Britain.
What do we do?Fulcrum’s core business areas include:
J
What sets us apart?We have a track record of excellence in customer service and a rich heritage that includes British Gas. This is coupled with sector leading credentials, including multiple awards for health, safety and delivery and award nominations for our leadership programme, Manager of the Year and Company of the Year. One of our rising stars was awarded the Young Person’s Achievement Award at the 2015 National Gas Industry Awards.Our people have the expertise, passion and commitment required to support our customers throughout their projects, enabling them to benefit from enhanced, sector leading levels of service, whilst ensuring the very highest of engineering excellence and health and safety standards.
We continue to build our business around our customers. We have listened to their needs to develop sector leading services which are centred on them and delivered in line with our values.
Leading service delivery
Full national coverage
STRATEGIC REPORT
Fulcrum Utility Services LimitedAnnual Report and Accounts 20154
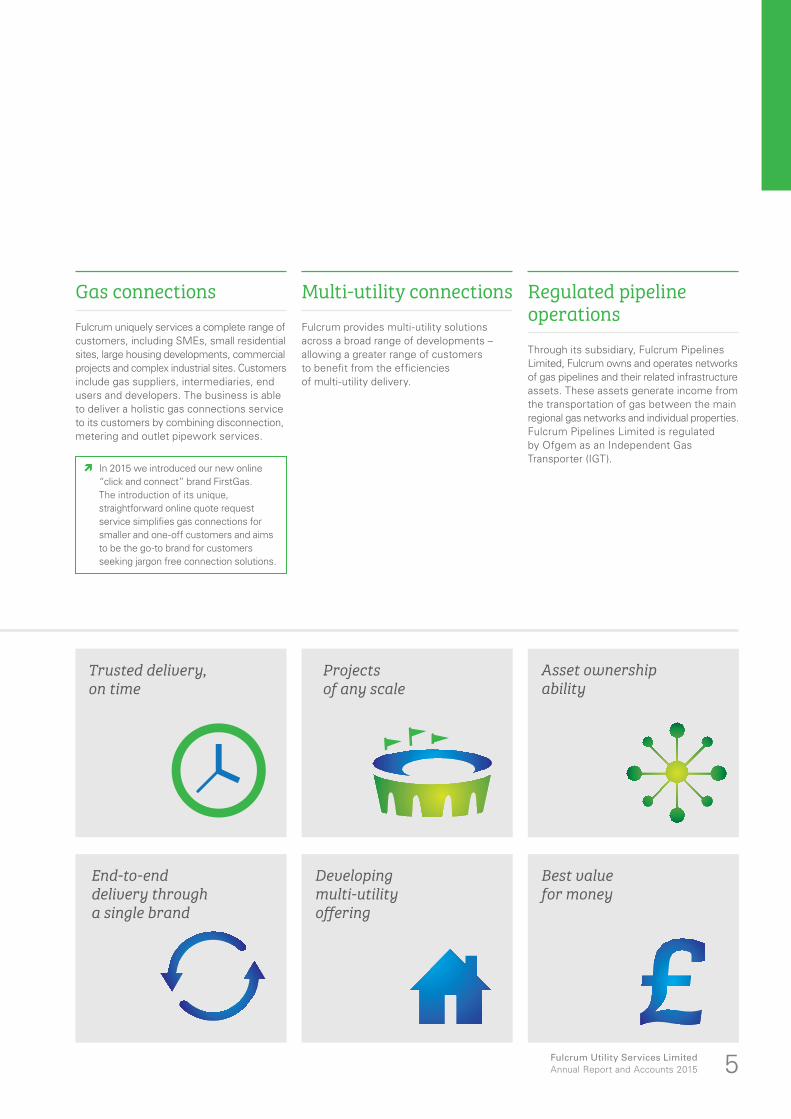
N In 2015 we introduced our new online “click and connect” brand FirstGas. The introduction of its unique, straightforward online quote request service simplifies gas connections for smaller and one-off customers and aims to be the go-to brand for customers seeking jargon free connection solutions.
Gas connectionsFulcrum uniquely services a complete range of customers, including SMEs, small residential sites, large housing developments, commercial projects and complex industrial sites. Customers include gas suppliers, intermediaries, end users and developers. The business is able to deliver a holistic gas connections service to its customers by combining disconnection, metering and outlet pipework services.
Regulated pipeline operationsThrough its subsidiary, Fulcrum Pipelines Limited, Fulcrum owns and operates networks of gas pipelines and their related infrastructure assets. These assets generate income from the transportation of gas between the main regional gas networks and individual properties. Fulcrum Pipelines Limited is regulated by Ofgem as an Independent Gas Transporter (IGT).
Multi-utility connectionsFulcrum provides multi-utility solutions across a broad range of developments – allowing a greater range of customers to benefit from the efficiencies of multi-utility delivery.
End-to-end delivery through a single brand
Trusted delivery, on time
Projects of any scale
Developing multi-utility offering
Best value for money
Asset ownership ability
Fulcrum Utility Services LimitedAnnual Report and Accounts 2015 5
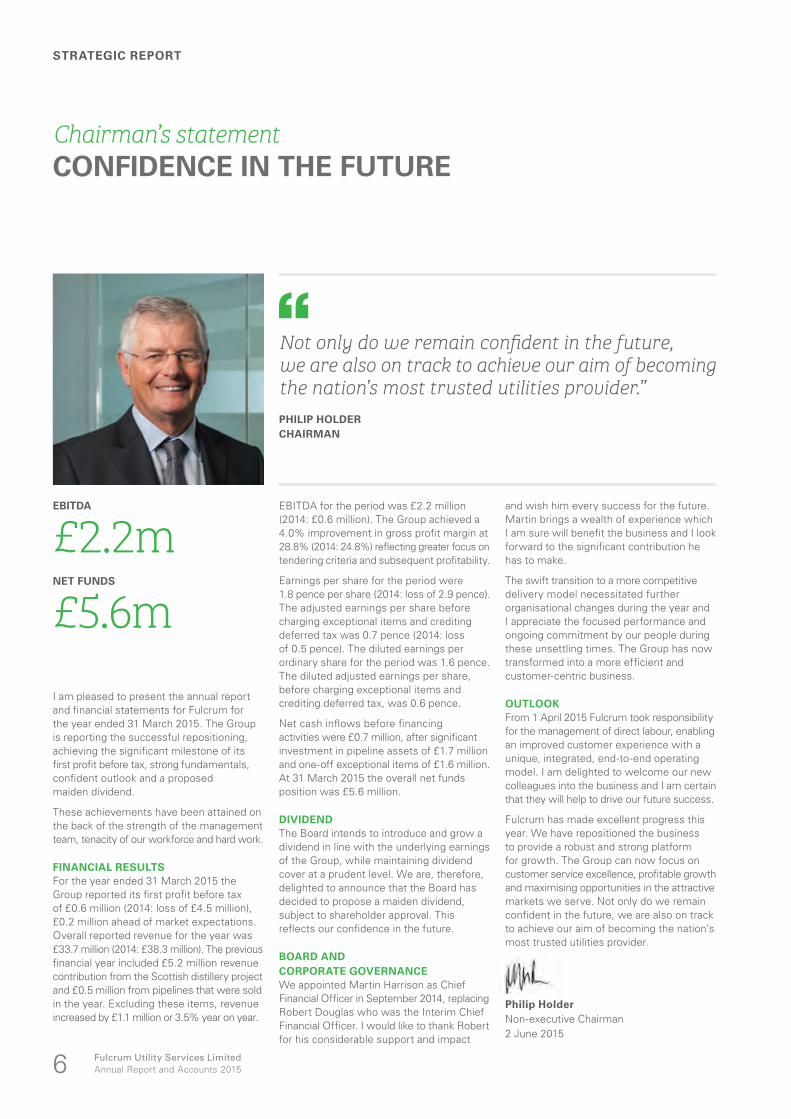
EBITDA for the period was £2.2 million (2014: £0.6 million). The Group achieved a 4.0% improvement in gross profit margin at 28.8% (2014: 24.8%) reflecting greater focus on tendering criteria and subsequent profitability.
Earnings per share for the period were 1.8 pence per share (2014: loss of 2.9 pence). The adjusted earnings per share before charging exceptional items and crediting deferred tax was 0.7 pence (2014: loss of 0.5 pence). The diluted earnings per ordinary share for the period was 1.6 pence. The diluted adjusted earnings per share, before charging exceptional items and crediting deferred tax, was 0.6 pence.
Net cash inflows before financing activities were £0.7 million, after significant investment in pipeline assets of £1.7 million and one-off exceptional items of £1.6 million. At 31 March 2015 the overall net funds position was £5.6 million.
DIVIDENDThe Board intends to introduce and grow a dividend in line with the underlying earnings of the Group, while maintaining dividend cover at a prudent level. We are, therefore, delighted to announce that the Board has decided to propose a maiden dividend, subject to shareholder approval. This reflects our confidence in the future.
BOARD AND CORPORATE GOVERNANCEWe appointed Martin Harrison as Chief Financial Officer in September 2014, replacing Robert Douglas who was the Interim Chief Financial Officer. I would like to thank Robert for his considerable support and impact
and wish him every success for the future. Martin brings a wealth of experience which I am sure will benefit the business and I look forward to the significant contribution he has to make.
The swift transition to a more competitive delivery model necessitated further organisational changes during the year and I appreciate the focused performance and ongoing commitment by our people during these unsettling times. The Group has now transformed into a more efficient and customer-centric business.
OUTLOOKFrom 1 April 2015 Fulcrum took responsibility for the management of direct labour, enabling an improved customer experience with a unique, integrated, end-to-end operating model. I am delighted to welcome our new colleagues into the business and I am certain that they will help to drive our future success.
Fulcrum has made excellent progress this year. We have repositioned the business to provide a robust and strong platform for growth. The Group can now focus on customer service excellence, profitable growth and maximising opportunities in the attractive markets we serve. Not only do we remain confident in the future, we are also on track to achieve our aim of becoming the nation’s most trusted utilities provider.
Philip Holder Non-executive Chairman2 June 2015
I am pleased to present the annual report and financial statements for Fulcrum for the year ended 31 March 2015. The Group is reporting the successful repositioning, achieving the significant milestone of its first profit before tax, strong fundamentals, confident outlook and a proposed maiden dividend.
These achievements have been attained on the back of the strength of the management team, tenacity of our workforce and hard work.
FINANCIAL RESULTSFor the year ended 31 March 2015 the Group reported its first profit before tax of £0.6 million (2014: loss of £4.5 million), £0.2 million ahead of market expectations. Overall reported revenue for the year was £33.7 million (2014: £38.3 million). The previous financial year included £5.2 million revenue contribution from the Scottish distillery project and £0.5 million from pipelines that were sold in the year. Excluding these items, revenue increased by £1.1 million or 3.5% year on year.
EBITDA
£2.2mNET FUNDS
£5.6m
Not only do we remain confident in the future, we are also on track to achieve our aim of becoming the nation’s most trusted utilities provider.”PHILIP HOLDERCHAIRMAN
Chairman’s statementCONFIDENCE IN THE FUTURE
STRATEGIC REPORT
Fulcrum Utility Services LimitedAnnual Report and Accounts 20156
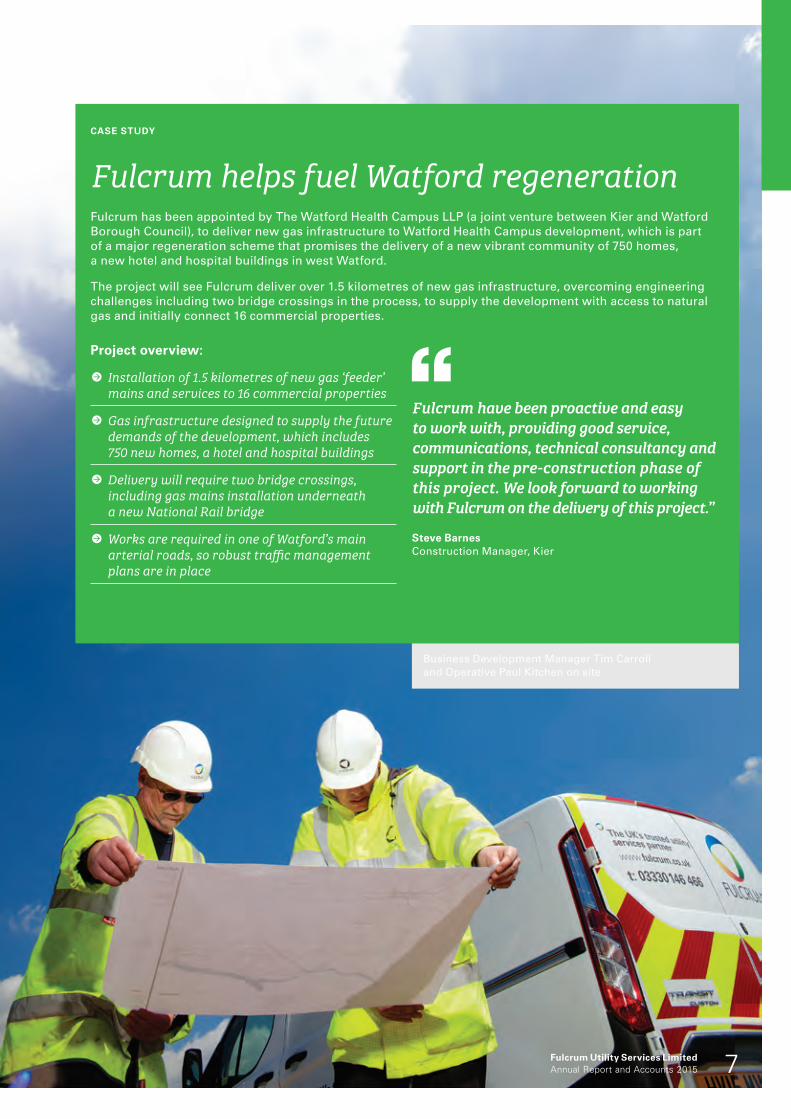
Fulcrum helps fuel Watford regenerationFulcrum has been appointed by The Watford Health Campus LLP (a joint venture between Kier and Watford Borough Council), to deliver new gas infrastructure to Watford Health Campus development, which is part of a major regeneration scheme that promises the delivery of a new vibrant community of 750 homes, a new hotel and hospital buildings in west Watford.
The project will see Fulcrum deliver over 1.5 kilometres of new gas infrastructure, overcoming engineering challenges including two bridge crossings in the process, to supply the development with access to natural gas and initially connect 16 commercial properties.
Project overview:
z Installation of 1.5 kilometres of new gas ‘feeder’ mains and services to 16 commercial properties
z Gas infrastructure designed to supply the future demands of the development, which includes 750 new homes, a hotel and hospital buildings
z Delivery will require two bridge crossings, including gas mains installation underneath a new National Rail bridge
z Works are required in one of Watford’s main arterial roads, so robust traffic management plans are in place
Fulcrum have been proactive and easy to work with, providing good service, communications, technical consultancy and support in the pre-construction phase of this project. We look forward to working with Fulcrum on the delivery of this project.”
Steve Barnes Construction Manager, Kier
CASE STUDY
Business Development Manager Tim Carroll and Operative Paul Kitchen on site
Fulcrum Utility Services LimitedAnnual Report and Accounts 2015 7
Strategic reportFOR THE YEAR ENDED 31 MARCH 2015
PRINCIPAL ACTIVITIESThe Group’s principal activities are the provision of unregulated utility connections and independent gas transportation services in the UK. Currently Fulcrum serves over 1,200 clients nationwide.
The Group designs and project manages connections to gas pipelines for customers seeking either a new connection or the alteration or refurbishment of an existing connection. These connections range from simple, single-site alterations to large, complex multi-site new connections. In either case, the Group’s teams of skilled design and engineering staff are required to design the connection to detailed specifications and to ensure the connection is appropriate and complies with extensive health and safety requirements.
In the year to 31 March 2015, Fulcrum contracted with third party organisations to physically construct these new or refurbished connections. From 1 April 2015 Fulcrum took the management of direct labour, supervision and subcontractors in-house.
The Group comprises two trading subsidiaries:
• Fulcrum Infrastructure Services Limited (providing utility infrastructure and connection services); and
• Fulcrum Pipelines Limited (the licensed asset owner for new gas connections and the gas transporter).
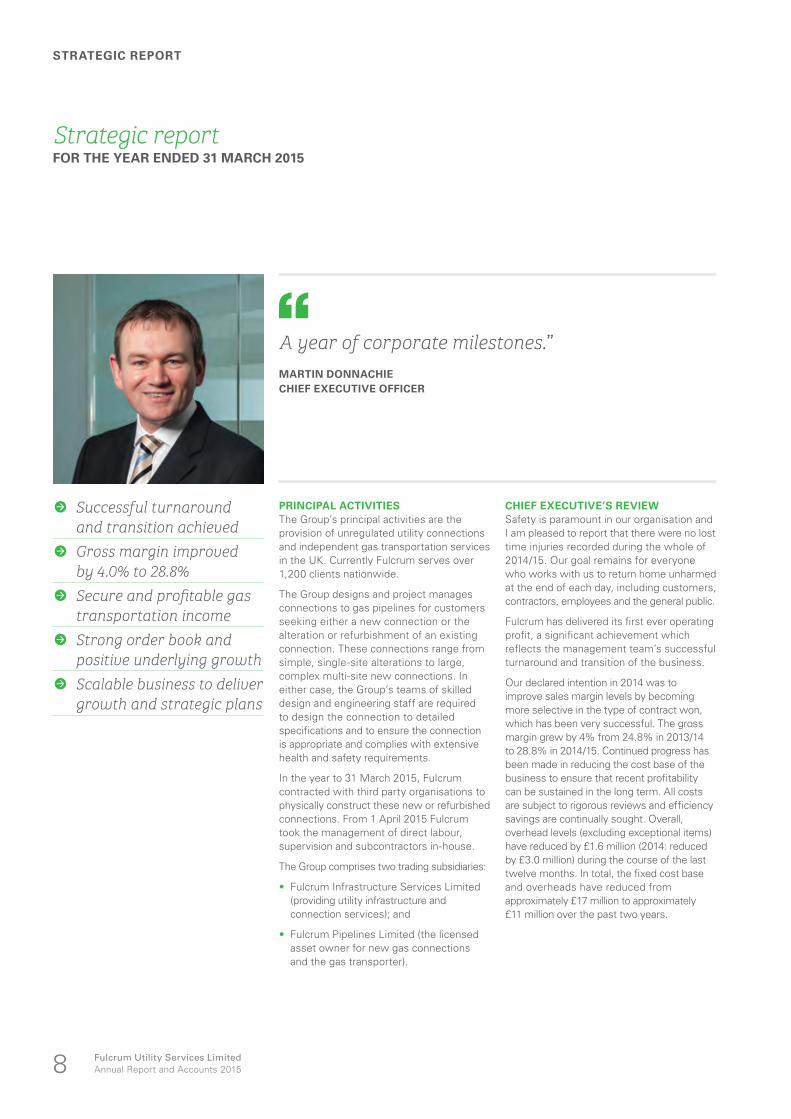
CHIEF EXECUTIVE’S REVIEWSafety is paramount in our organisation and I am pleased to report that there were no lost time injuries recorded during the whole of 2014/15. Our goal remains for everyone who works with us to return home unharmed at the end of each day, including customers, contractors, employees and the general public.
Fulcrum has delivered its first ever operating profit, a significant achievement which reflects the management team’s successful turnaround and transition of the business.
Our declared intention in 2014 was to improve sales margin levels by becoming more selective in the type of contract won, which has been very successful. The gross margin grew by 4% from 24.8% in 2013/14 to 28.8% in 2014/15. Continued progress has been made in reducing the cost base of the business to ensure that recent profitability can be sustained in the long term. All costs are subject to rigorous reviews and efficiency savings are continually sought. Overall, overhead levels (excluding exceptional items) have reduced by £1.6 million (2014: reduced by £3.0 million) during the course of the last twelve months. In total, the fixed cost base and overheads have reduced from approximately £17 million to approximately £11 million over the past two years.
A year of corporate milestones.”MARTIN DONNACHIE CHIEF EXECUTIVE OFFICER
z Successful turnaround and transition achieved
z Gross margin improved by 4.0% to 28.8%
z Secure and profitable gas transportation income
z Strong order book and positive underlying growth
z Scalable business to deliver growth and strategic plans
STRATEGIC REPORT
Fulcrum Utility Services LimitedAnnual Report and Accounts 20158
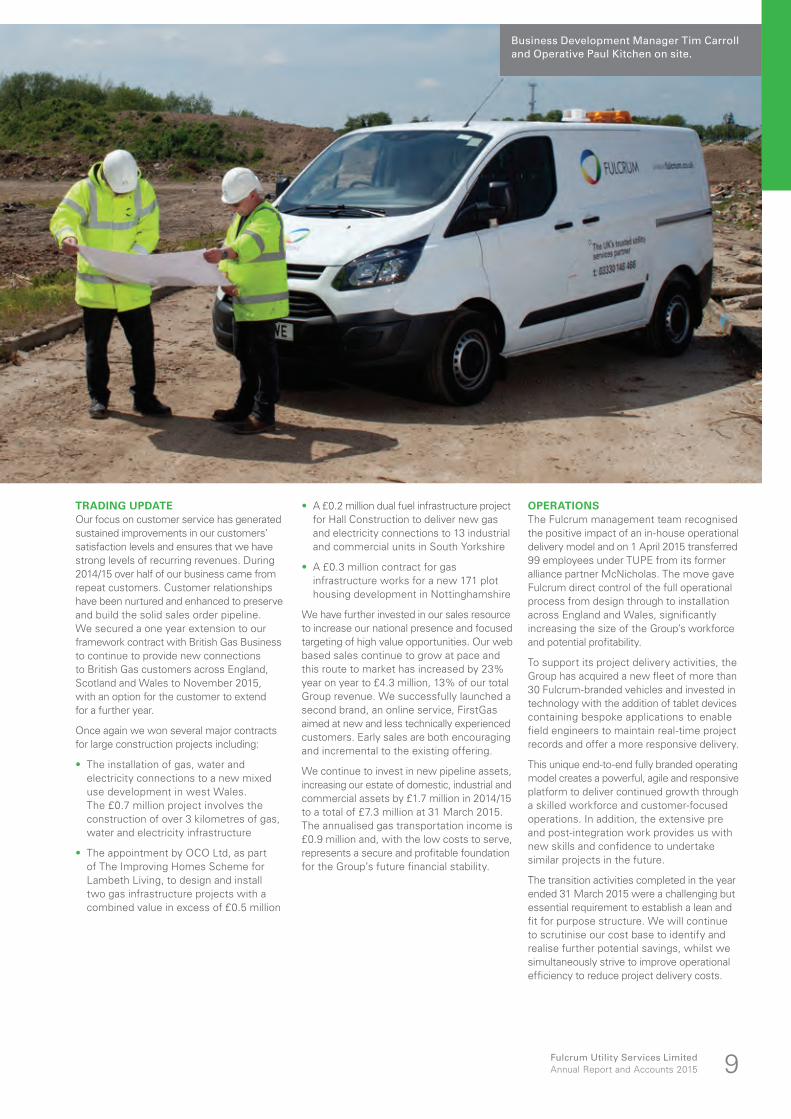
TRADING UPDATEOur focus on customer service has generated sustained improvements in our customers’ satisfaction levels and ensures that we have strong levels of recurring revenues. During 2014/15 over half of our business came from repeat customers. Customer relationships have been nurtured and enhanced to preserve and build the solid sales order pipeline. We secured a one year extension to our framework contract with British Gas Business to continue to provide new connections to British Gas customers across England, Scotland and Wales to November 2015, with an option for the customer to extend for a further year.
Once again we won several major contracts for large construction projects including:
• The installation of gas, water and electricity connections to a new mixed use development in west Wales. The £0.7 million project involves the construction of over 3 kilometres of gas, water and electricity infrastructure
• The appointment by OCO Ltd, as part of The Improving Homes Scheme for Lambeth Living, to design and install two gas infrastructure projects with a combined value in excess of £0.5 million
• A £0.2 million dual fuel infrastructure project for Hall Construction to deliver new gas and electricity connections to 13 industrial and commercial units in South Yorkshire
• A £0.3 million contract for gas infrastructure works for a new 171 plot housing development in Nottinghamshire
We have further invested in our sales resource to increase our national presence and focused targeting of high value opportunities. Our web based sales continue to grow at pace and this route to market has increased by 23% year on year to £4.3 million, 13% of our total Group revenue. We successfully launched a second brand, an online service, FirstGas aimed at new and less technically experienced customers. Early sales are both encouraging and incremental to the existing offering.
We continue to invest in new pipeline assets, increasing our estate of domestic, industrial and commercial assets by £1.7 million in 2014/15 to a total of £7.3 million at 31 March 2015. The annualised gas transportation income is £0.9 million and, with the low costs to serve, represents a secure and profitable foundation for the Group’s future financial stability.
OPERATIONSThe Fulcrum management team recognised the positive impact of an in-house operational delivery model and on 1 April 2015 transferred 99 employees under TUPE from its former alliance partner McNicholas. The move gave Fulcrum direct control of the full operational process from design through to installation across England and Wales, significantly increasing the size of the Group’s workforce and potential profitability.
To support its project delivery activities, the Group has acquired a new fleet of more than 30 Fulcrum-branded vehicles and invested in technology with the addition of tablet devices containing bespoke applications to enable field engineers to maintain real-time project records and offer a more responsive delivery.
This unique end-to-end fully branded operating model creates a powerful, agile and responsive platform to deliver continued growth through a skilled workforce and customer-focused operations. In addition, the extensive pre and post-integration work provides us with new skills and confidence to undertake similar projects in the future.
The transition activities completed in the year ended 31 March 2015 were a challenging but essential requirement to establish a lean and fit for purpose structure. We will continue to scrutinise our cost base to identify and realise further potential savings, whilst we simultaneously strive to improve operational efficiency to reduce project delivery costs.
Business Development Manager Tim Carroll and Operative Paul Kitchen on site.
Fulcrum Utility Services LimitedAnnual Report and Accounts 2015 9
PEOPLEOur people are a significant asset. Throughout difficult periods of recent change, they have continued to maintain and build on excellent levels of both external and internal customer service, visibly demonstrating our values.
Our commitment to workforce development and customer service excellence has been recognised with Carly Gilchrist, our Head of Commercial, winning the Young Person’s Achievement award at the prestigious Gas Industry Awards.
In addition, we received a nomination for the innovative and bespoke staff development programme, “Leading the Way”, a clear endorsement of the significant transformation we have delivered at Fulcrum. This personal development programme has been instrumental in our recent financial and award successes. Our staff now have the confidence to deal with change so that the business can continue to be flexible in the face of future opportunities and challenges.
GOING CONCERNAs highlighted in the Financial Review, the Group had net funds at 31 March 2015 of £5.6 million. The Group had not drawn on its available financing facilities.
As a matter of course the Directors regularly prepare financial forecasts for the business and these are reviewed and adopted by the Board.
These forecasts are subject to “stress testing” with appropriate sensitivity analysis and scenario planning to ensure that any adverse impact can be managed and mitigated such that the business can continue to operate within its existing financing facilities.
The Group’s forecasts and projections, after taking account of sensitivity analysis of changes in trading performance and corresponding mitigating actions, show that the Group has adequate cash resources for the foreseeable future.
Therefore after making enquiries, the Directors have a reasonable expectation that the Group has adequate resources to continue in operational existence for the foreseeable future. Accordingly they continue to adopt the going concern basis in preparing the annual report and financial statements.
OUTLOOKFulcrum entered the current financial year with an established customer base and a solid order book, underpinned by favourable market dynamics. By targeting higher margin business, broadening its service offering and consolidating its direct labour workforce, the Group is well positioned to drive performance and deliver improved returns.
The business is scalable to deliver future sales growth with minimal requirement for additional overhead investment and from this stable platform we can now consider the next stage of Fulcrum’s corporate development and longer-term strategic options to further strengthen our position.
Martin Donnachie Chief Executive Officer2 June 2015
Fulcrum enters 2015/16 with an established customer base and a solid order book, underpinned by favourable market dynamics.”MARTIN DONNACHIE CHIEF EXECUTIVE OFFICER
Strategic report continuedFOR THE YEAR ENDED 31 MARCH 2015
STRATEGIC REPORT
Fulcrum Utility Services LimitedAnnual Report and Accounts 201510
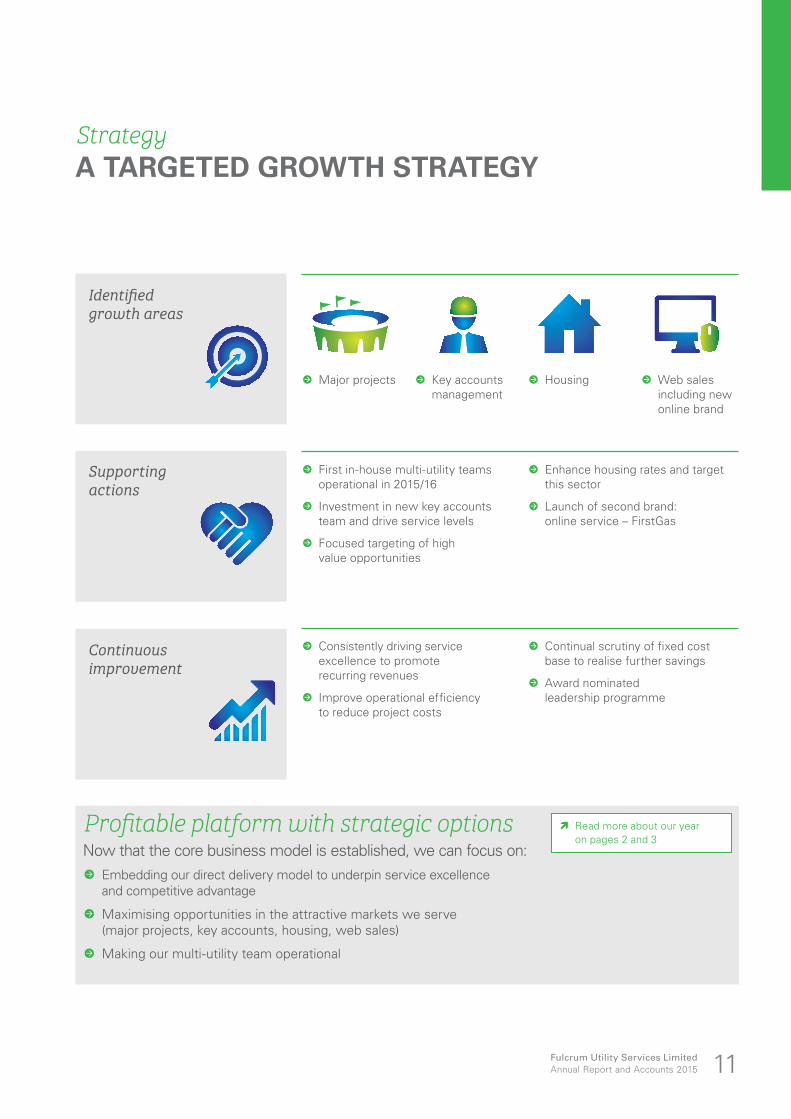
StrategyA TARGETED GROWTH STRATEGY
N Read more about our year on pages 2 and 3
Profitable platform with strategic optionsNow that the core business model is established, we can focus on:
z Embedding our direct delivery model to underpin service excellence and competitive advantage
z Maximising opportunities in the attractive markets we serve (major projects, key accounts, housing, web sales)
z Making our multi-utility team operational
Fulcrum Utility Services LimitedAnnual Report and Accounts 2015 11
Supporting actions
z First in-house multi-utility teams operational in 2015/16
z Investment in new key accounts team and drive service levels
z Focused targeting of high value opportunities
z Enhance housing rates and target this sector
z Launch of second brand: online service – FirstGas
Continuous improvement
z Consistently driving service excellence to promote recurring revenues
z Improve operational efficiency to reduce project costs
z Continual scrutiny of fixed cost base to realise further savings
z Award nominated leadership programme
Identified growth areas
z Major projects z Key accounts management
z Housing z Web sales including new online brand
In conjunction with the Chairman’s Statement and the Strategic Report, this report provides further information on key aspects of the financial position of the Group.
The Group’s annual consolidated financial statements have been prepared in accordance with International Financial Reporting Standards. There have been no significant changes to the accounting policies applied by the Group during the year ended 31 March 2015.
An operating profit before exceptional items of £1.1 million (2014: £0.7 million loss) was recorded for the year. The underlying financial performance, together with a comparison with the previous year is summarised in the table above.
REVENUEOverall reported revenue for the year was £33.7 million against £38.3 million in the prior year. The previous financial year
contained £5.2 million from the Speyside distillery project and £0.5 million income from domestic pipelines that were sold in October 2013. Excluding these items, revenue increased by £1.1 million or 3.5% year on year.
Revenues from infrastructure services amounted to £34.5 million (2014: £38.3 million), and £0.8 million (2014: £1.1 million) from pipeline operations. Intercompany trading of £1.6 million (2014: £1.1 million) was eliminated on consolidation.
GROSS MARGINDespite the overall reduction in revenue, our determination to be more selective in our tendering and concentrate on more profitable business meant the Group increased its gross profit margin to 28.8% compared to 24.8% in 2014, a £0.2 million improvement to £9.7 million, compared to the prior year of £9.5 million.
Financial strength and future confidence.”MARTIN HARRISON CHIEF FINANCIAL OFFICER
Financial reviewSTRONG UNDERLYING CASH GENERATION
RESULTS AND COMPARISON WITH PREVIOUS YEAR
Year ended Year ended Year on31 March 2015 31 March 2014 year change
£m £m £m
Revenue 33.7 38.3 (4.6)Gross profit 9.7 9.5 0.2Gross margin (%) 28.8% 24.8% 4.0%Administrative expenses before exceptional items (8.6) (10.2) 1.6Underlying EBITDA(1) 2.2 0.6 1.6Operating profit/(loss) before exceptional items 1.1 (0.7) 1.8Profit/(loss) before taxation 0.6 (4.5) 5.1Net funds 5.6 4.9 0.7(1) Earnings before interest, tax, depreciation, amortisation, share based payments and exceptional items.
z Underlying EBITDA significantly increased to £2.2m from £0.6m
z PBT up to £0.6m from £(4.5)mz Net funds up to £5.6m
and debt freez Full year maiden
dividend proposed
Fulcrum Utility Services LimitedAnnual Report and Accounts 201512
STRATEGIC REPORT
ADMINISTRATIVE EXPENSESAdministrative expenses before exceptional items reported for the year totalled £8.6 million (2014: £10.2 million), a year on year reduction of 16.7%, and the direct result of the turnaround and transition activities completed in the financial year.
Included within administrative expenses are share based payment charges of £74,000 (2014: £115,000) associated with the Company’s equity based option schemes. During the majority of the year there had been two schemes in operation, the “EMI option plan” which was extended to further eligible employees in January 2015 and the Management Participation Shares plan. A further Employee Shareholder Status arrangement was added on 27 March 2015 and had negligible impact on the payments. In the prior year there were four schemes in operation, two of which have been cancelled.
EBITDA AND OPERATING PROFIT/(LOSS)Underlying EBITDA, before exceptional items and share based payments, was £2.2 million for the year (2014: £0.6 million), a £1.6 million increase against the prior period.
The operating profit reported for the year was £0.6 million, after charging exceptional items of £0.5 million (2014: loss of £4.5 million, after charging exceptional items of £3.7 million).
EXCEPTIONAL ITEMSExceptional items for the full year were £0.5 million (2014: £3.7 million) reflecting a charge of £0.9 million for costs associated with changing the operating model and a credit of £0.4 million arising from the reassessment of dilapidations costs. Exceptional items related to the first half of the financial year only.
FINANCE EXPENSEFinance expense for the year was £49,000 (2014: £105,000) which reflects interest payable during the year on the IT lease financing arrangement.
TAXATIONDuring the year the Group incurred profits for corporation tax purposes of approximately £0.2 million (2014: £3.1 million loss). With total accumulated tax losses of £21.4 million (2014: £21.6 million) there is no corporation tax payable.
Deferred tax assets totalling £2.7 million have been recognised at 31 March 2015 (2014: £0.5 million) in anticipation of improved business profitability in future periods. The total sum of accumulated unrecognised losses carried forward amounts to £7.9 million as at 31 March 2015 (2014: £18.9 million).
Deferred tax liabilities totalling £0.6 million have been recognised at 31 March 2015 (2014: £0.6 million) in respect of the
revaluation of the industrial and commercial pipeline assets completed in 2013/14. There is currently no intention to sell these assets and the Group expects to recover their valuation through use; therefore, no tax is currently expected to be payable in respect of the revaluation.
DIVIDEND POLICYThe Board has conducted a review of the business plan for the next three years including evaluating the cash needs for increased investment in organic growth and has concluded that the business has reached the point where we have sufficient confidence in its ongoing cash generation capabilities to commence paying a dividend to shareholders.
As a result the Board has proposed a maiden dividend for the 12 months ended 31 March 2015 of 0.4 pence per share which, subject to shareholder approval at the Annual General Meeting, is expected to be paid in October 2015.
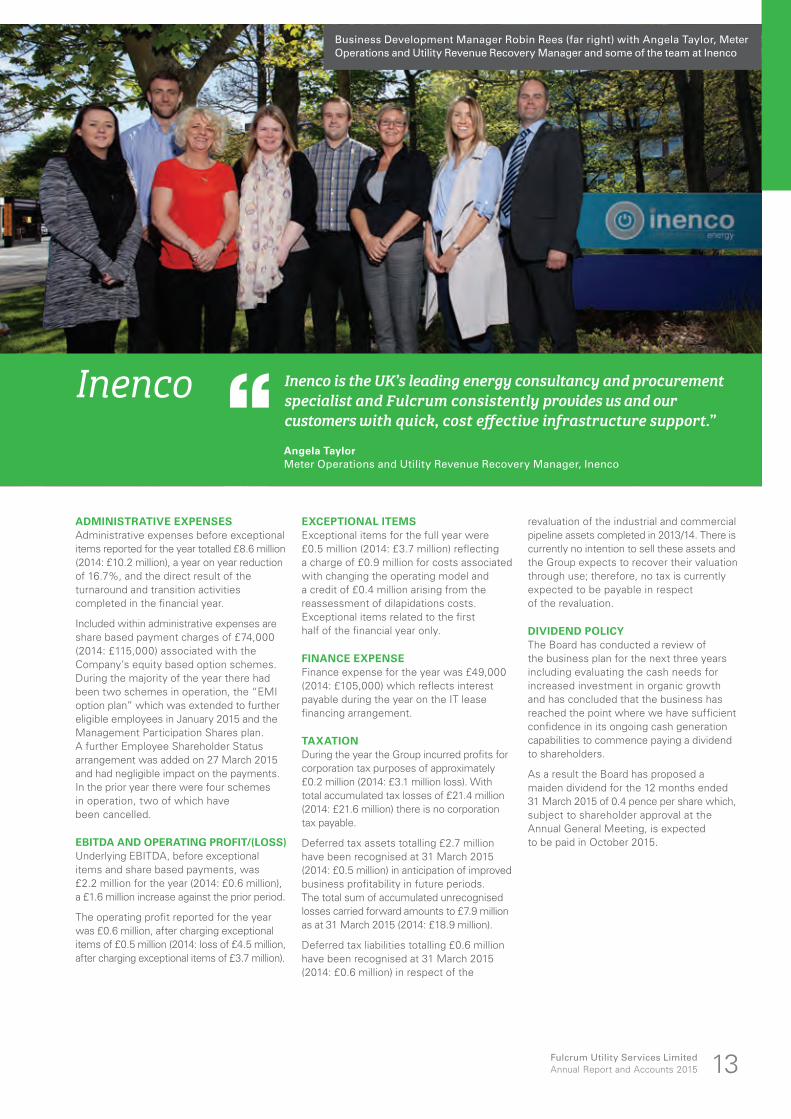
Inenco Inenco is the UK’s leading energy consultancy and procurement specialist and Fulcrum consistently provides us and our customers with quick, cost effective infrastructure support.”
Angela TaylorMeter Operations and Utility Revenue Recovery Manager, Inenco
Business Development Manager Robin Rees (far right) with Angela Taylor, Meter Operations and Utility Revenue Recovery Manager and some of the team at Inenco
Fulcrum Utility Services LimitedAnnual Report and Accounts 2015 13
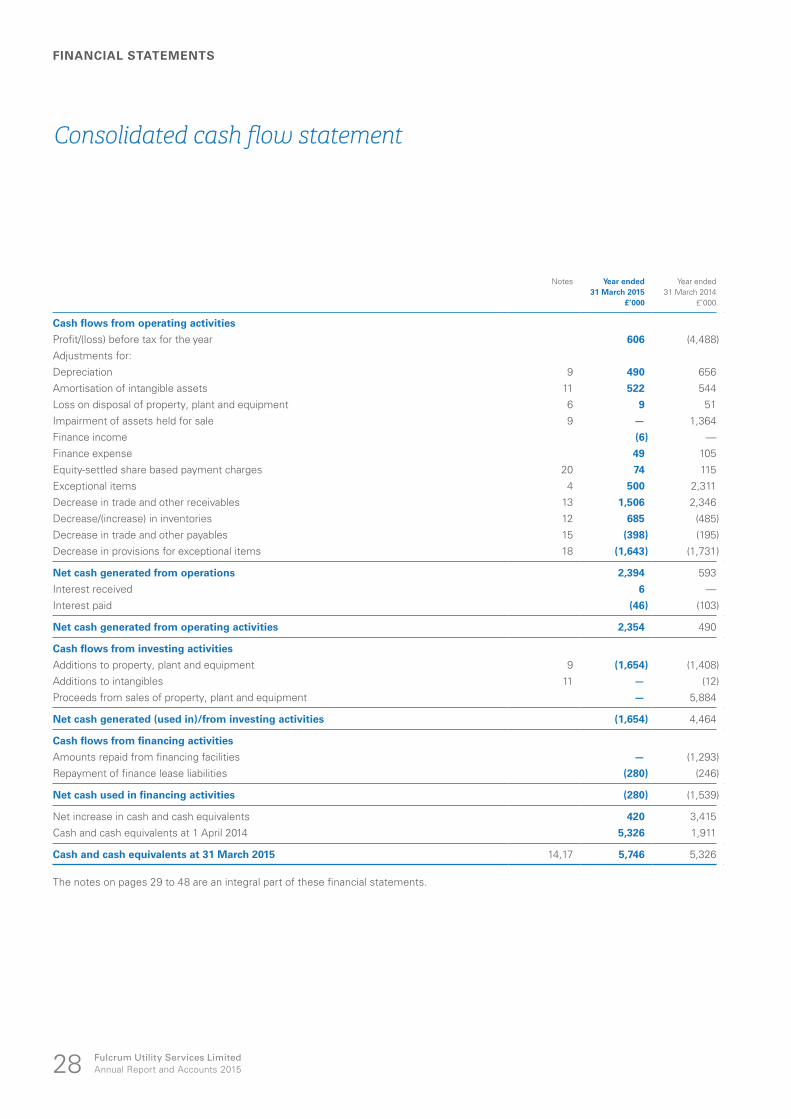
CASH FLOW AND FINANCINGOPERATING CASH FLOWNet cash generated from operations in the period was £2.4 million (2014: £0.6 million) and comprised the following:
• EBITDA for the period of £2.2 million (2014: £0.6 million)
• exceptional items cash costs totalling £1.6 million (2014: £1.7 million)
• working capital inflows in the year total £1.8 million (2014: £1.7 million) and reflect:
• a decrease in work in progress of £0.7 million (2014: increase of £0.5 million)
• a decrease in trade receivables of £1.9 million (2014: increase of £1.0 million)
• other working capital outflows of £0.8 million (2014: inflow of £3.2 million)
INVESTING ACTIVITIESCapital expenditure for the period amounted to £1.7 million (2014: £1.4 million), principally in respect of investment in pipeline assets.
CASH AND BORROWINGSAs at 31 March 2015 the Group held cash balances of £5.7 million (2014: £5.3 million). Amounts outstanding on finance leases at 31 March 2015 were £0.1 million (2014: £0.4 million).
There were no disposals of domestic pipeline during the year (2014: net proceeds of £5.9 million).
The overall net funds position of the Group, after the finance lease liability, at 31 March 2015 was £5.6 million (2014: £4.9 million).
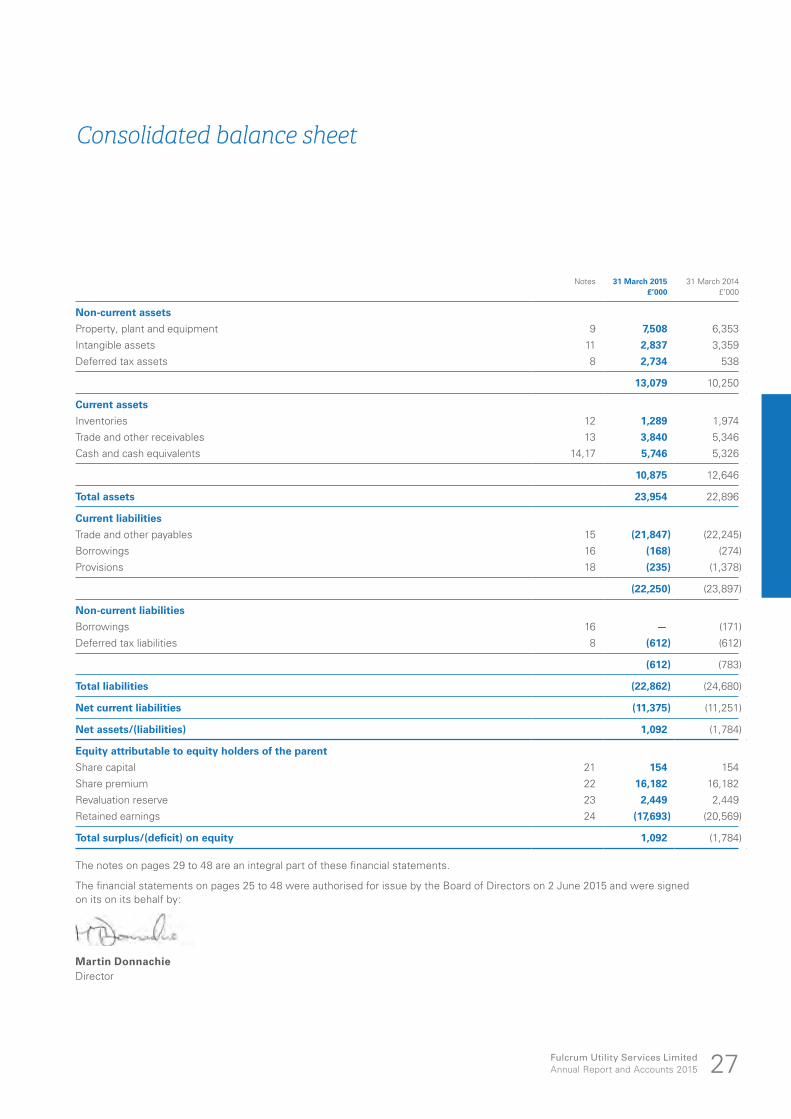
BALANCE SHEETTotal net assets at 31 March 2015 were £1.1 million (2014: net liabilities £1.8 million) and included intangible assets of £2.8 million (2014: £3.4 million).
FORWARD-LOOKING STATEMENTSCertain statements in this annual report are forward-looking. Although the Group believes that the expectations reflected in these forward-looking statements are reasonable, it can give no assurance that these expectations will prove to be correct. Because these statements involve risks and uncertainties, actual results may differ materially from those expressed or implied by these forward-looking statements.
The Group undertakes no obligation to update any forward-looking statements whether as a result of new information, future events or otherwise.
Martin Harrison Chief Financial Officer2 June 2015
Substantial investment in high yield pipeline assets.” MARTIN HARRISON CHIEF FINANCIAL OFFICER
Financial review continued
z Net cash generated from operations £2.4m
z Net assets £1.1m
Fulcrum Utility Services LimitedAnnual Report and Accounts 201514
STRATEGIC REPORT
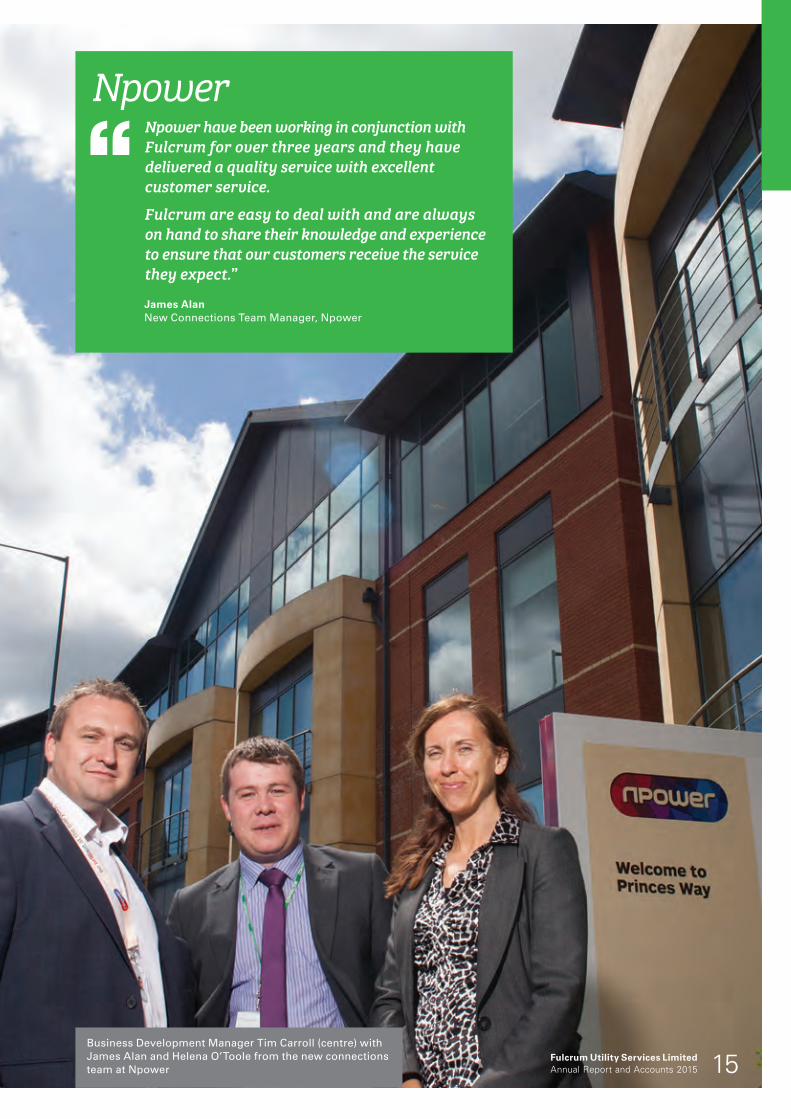
Npower Npower have been working in conjunction with
Fulcrum for over three years and they have delivered a quality service with excellent customer service.
Fulcrum are easy to deal with and are always on hand to share their knowledge and experience to ensure that our customers receive the service they expect.”
James Alan New Connections Team Manager, Npower
Fulcrum Utility Services LimitedAnnual Report and Accounts 2015 15
Business Development Manager Tim Carroll (centre) with James Alan and Helena O’Toole from the new connections team at Npower
Board of DirectorsA STRONG LEADERSHIP TEAM
Dear shareholders,2015 was truly a landmark year for the Fulcrum Group, with important strategic and operational milestones achieved. The strong performance reflects the successful turnaround and business transition, which pays tribute to all the hard work and dedication from the management and staff, for which I would like to convey my heartfelt thanks.
Fulcrum’s enlarged status and newly launched brand and service initiatives should provide our customers with ever increasing efficiency of delivery and quality of service. Such initiatives as the online FirstGas service, along with our commitment to the provision of multi-utility service capability and increased investment in pipeline assets, mark the future direction of the Group. We will continue to focus on providing best-in-class services.
Our robust position, coupled with the management initiatives, should provide an excellent platform for growth. I personally, along with the rest of the Fulcrum Board, are very confident in our future and our delivery of further stakeholder value.
Philip Holder Chairman2 June 2015
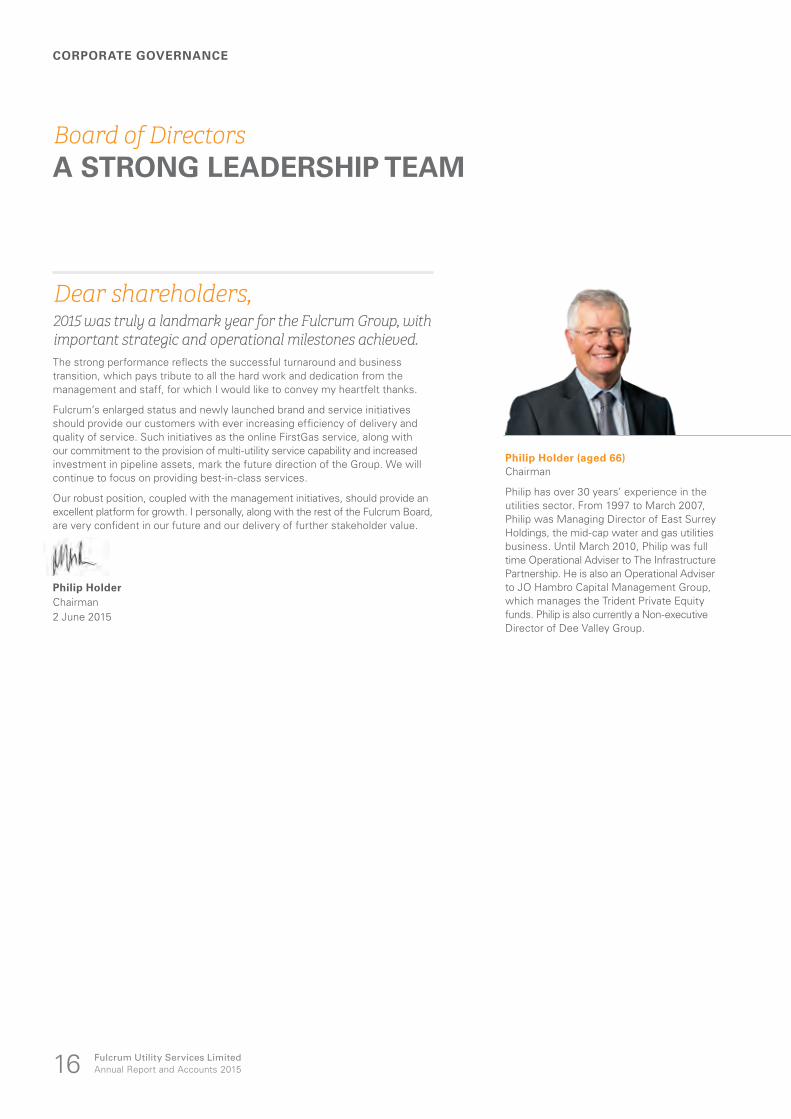
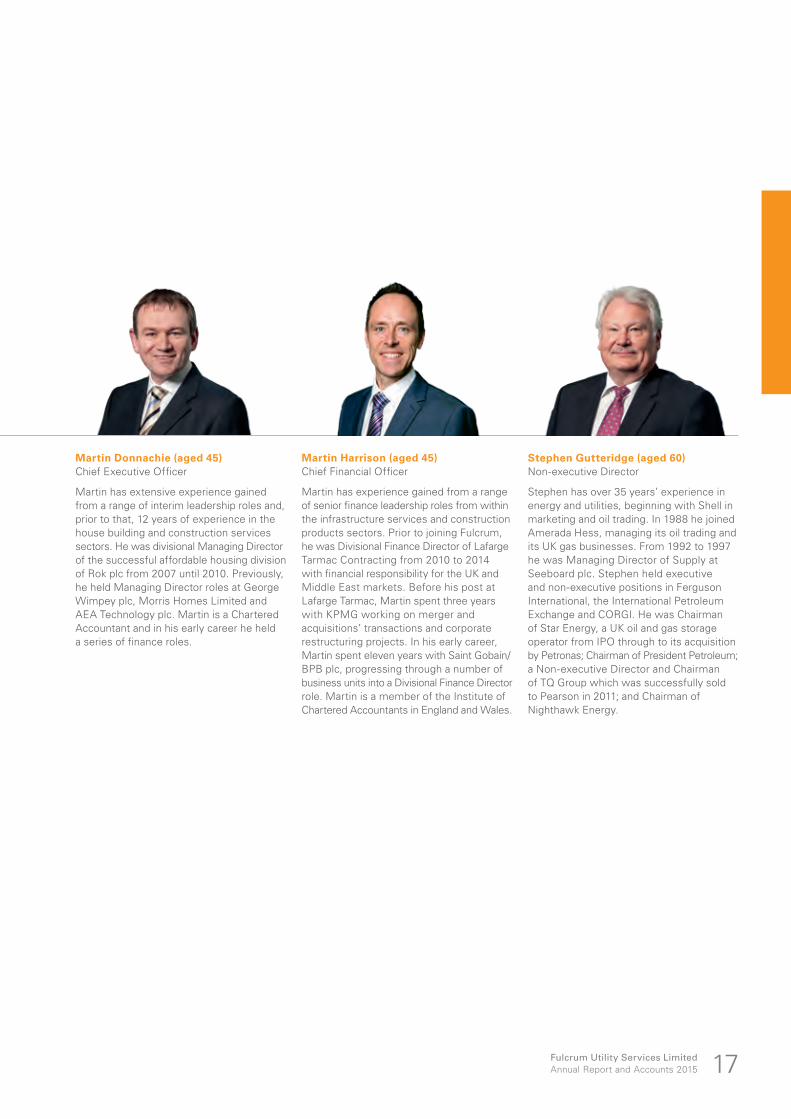
Philip Holder (aged 66)Chairman
Philip has over 30 years’ experience in the utilities sector. From 1997 to March 2007, Philip was Managing Director of East Surrey Holdings, the mid-cap water and gas utilities business. Until March 2010, Philip was full time Operational Adviser to The Infrastructure Partnership. He is also an Operational Adviser to JO Hambro Capital Management Group, which manages the Trident Private Equity funds. Philip is also currently a Non-executive Director of Dee Valley Group.
Fulcrum Utility Services LimitedAnnual Report and Accounts 201516
CORPORATE GOVERNANCE
Stephen Gutteridge (aged 60)Non-executive Director
Stephen has over 35 years’ experience in energy and utilities, beginning with Shell in marketing and oil trading. In 1988 he joined Amerada Hess, managing its oil trading and its UK gas businesses. From 1992 to 1997 he was Managing Director of Supply at Seeboard plc. Stephen held executive and non-executive positions in Ferguson International, the International Petroleum Exchange and CORGI. He was Chairman of Star Energy, a UK oil and gas storage operator from IPO through to its acquisition by Petronas; Chairman of President Petroleum; a Non-executive Director and Chairman of TQ Group which was successfully sold to Pearson in 2011; and Chairman of Nighthawk Energy.
Martin Harrison (aged 45)Chief Financial Officer
Martin has experience gained from a range of senior finance leadership roles from within the infrastructure services and construction products sectors. Prior to joining Fulcrum, he was Divisional Finance Director of Lafarge Tarmac Contracting from 2010 to 2014 with financial responsibility for the UK and Middle East markets. Before his post at Lafarge Tarmac, Martin spent three years with KPMG working on merger and acquisitions’ transactions and corporate restructuring projects. In his early career, Martin spent eleven years with Saint Gobain/BPB plc, progressing through a number of business units into a Divisional Finance Director role. Martin is a member of the Institute of Chartered Accountants in England and Wales.
Martin Donnachie (aged 45)Chief Executive Officer
Martin has extensive experience gained from a range of interim leadership roles and, prior to that, 12 years of experience in the house building and construction services sectors. He was divisional Managing Director of the successful affordable housing division of Rok plc from 2007 until 2010. Previously, he held Managing Director roles at George Wimpey plc, Morris Homes Limited and AEA Technology plc. Martin is a Chartered Accountant and in his early career he held a series of finance roles.
Fulcrum Utility Services LimitedAnnual Report and Accounts 2015 17
Corporate governance reportCOMMITTED TO HIGH STANDARDS OF CORPORATE GOVERNANCE
STATEMENT BY THE DIRECTORS ON COMPLIANCE WITH THE CODE OF BEST PRACTICEAs an AIM listed company, Fulcrum Utility Services Limited is not required to comply with the provisions of the Combined Code on Corporate Governance (“the Combined Code”) that applies to companies with a premium London Stock Exchange listing. However, the Board recognises the importance and value of good corporate governance procedures and accordingly have selected those elements of the Combined Code that they consider relevant and appropriate to the Group, given its size and structure. An overview of the Group’s corporate governance procedures is given opposite.
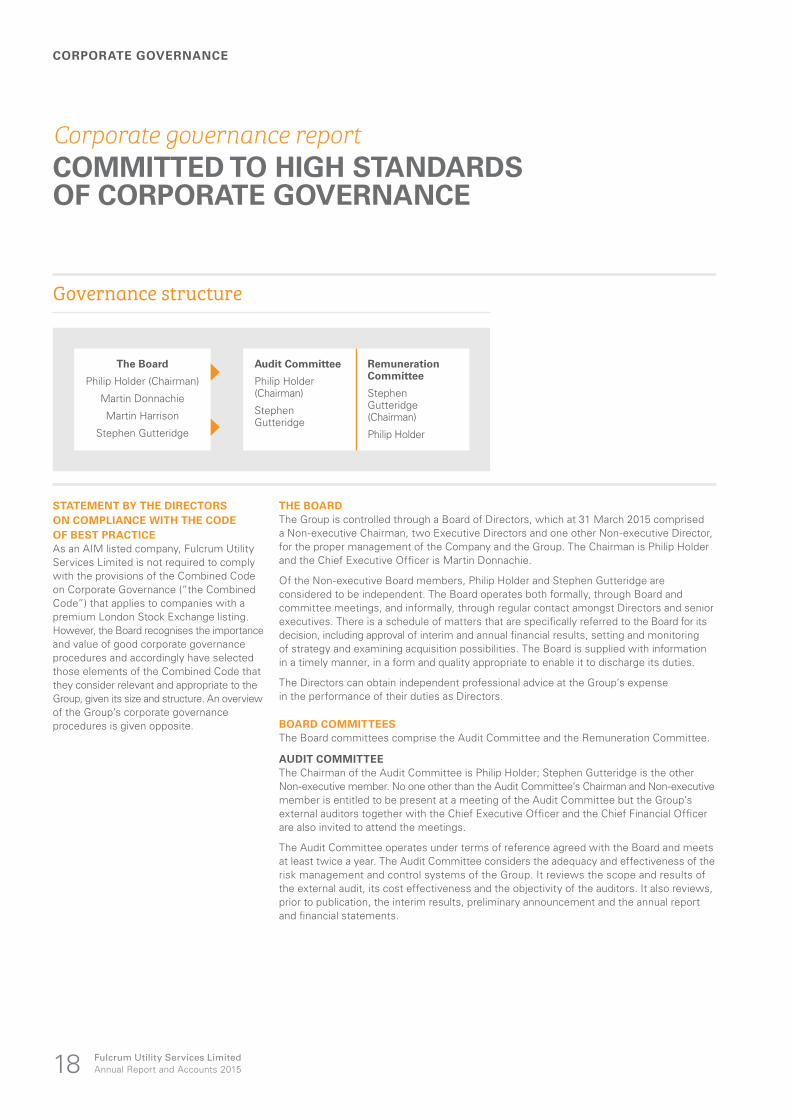
THE BOARDThe Group is controlled through a Board of Directors, which at 31 March 2015 comprised a Non-executive Chairman, two Executive Directors and one other Non-executive Director, for the proper management of the Company and the Group. The Chairman is Philip Holder and the Chief Executive Officer is Martin Donnachie.
Of the Non-executive Board members, Philip Holder and Stephen Gutteridge are considered to be independent. The Board operates both formally, through Board and committee meetings, and informally, through regular contact amongst Directors and senior executives. There is a schedule of matters that are specifically referred to the Board for its decision, including approval of interim and annual financial results, setting and monitoring of strategy and examining acquisition possibilities. The Board is supplied with information in a timely manner, in a form and quality appropriate to enable it to discharge its duties.
The Directors can obtain independent professional advice at the Group’s expense in the performance of their duties as Directors.
BOARD COMMITTEESThe Board committees comprise the Audit Committee and the Remuneration Committee.
AUDIT COMMITTEEThe Chairman of the Audit Committee is Philip Holder; Stephen Gutteridge is the other Non-executive member. No one other than the Audit Committee’s Chairman and Non-executive member is entitled to be present at a meeting of the Audit Committee but the Group’s external auditors together with the Chief Executive Officer and the Chief Financial Officer are also invited to attend the meetings.
The Audit Committee operates under terms of reference agreed with the Board and meets at least twice a year. The Audit Committee considers the adequacy and effectiveness of the risk management and control systems of the Group. It reviews the scope and results of the external audit, its cost effectiveness and the objectivity of the auditors. It also reviews, prior to publication, the interim results, preliminary announcement and the annual report and financial statements.
Governance structure
The Board
Philip Holder (Chairman)
Martin Donnachie
Martin Harrison
Stephen Gutteridge
Audit Committee
Philip Holder (Chairman)
Stephen Gutteridge
Remuneration Committee
Stephen Gutteridge (Chairman)
Philip Holder
Fulcrum Utility Services LimitedAnnual Report and Accounts 201518
CORPORATE GOVERNANCE
REMUNERATION COMMITTEEThe Chairman of the Remuneration Committee is Stephen Gutteridge with Philip Holder as the other Non-executive member. The committee meets periodically as required and is responsible for overseeing the policy regarding executive remuneration and for approving the remuneration packages for the Group’s Executive Directors and management including all personnel receiving remuneration exceeding £75,000 per annum. It is also responsible for reviewing incentive schemes for the Group as a whole.
NOMINATIONS COMMITTEEAs the Board is small, there is and will be no separate Nominations Committee and the appointment of new Directors is considered by the Board as a whole.
BOARD AND COMMITTEE MEETING ATTENDANCEThe table below sets out the attendance at Board and committee meetings by presence or by telephone of individual Directors.
Full Board
Audit Committee
Remuneration Committee
Martin Donnachie 11 of 11 2 of 2 4 of 4
Stephen Gutteridge 11 of 11 2 of 2 4 of 4
Philip Holder 11 of 11 2 of 2 4 of 4
Martin Harrison 4 of 5 1 of 1 —
Mark Watts (resigned) 2 of 2 1 of 1 —
SHAREHOLDER COMMUNICATIONThe Board is committed to maintaining good communication with shareholders. The Executive Directors maintain a regular dialogue with the analysts and institutional investors to discuss the Group’s performance and future prospects.
The Group responds formally to all queries and requests for information from existing and prospective shareholders. In addition, the Group seeks to regularly update shareholders through stock exchange announcements and wider press releases on its activities.
The Annual General Meeting will provide an opportunity for shareholders to address questions to the Chairman and the Board directly. Published information, including regulatory news, is available on the Group’s website, www.fulcrumutilityserviceslimited.co.uk.
RISK MANAGEMENT AND INTERNAL CONTROLS The Directors are responsible for the Group’s system of internal control and for reviewing its effectiveness, whilst the role of management is to implement Board policies on risk management and control. It should be recognised that the Group’s system of internal control is designed to manage, rather than eliminate, the risk of failure to achieve the Group’s business objectives and can only provide reasonable, and not absolute, assurance against material misstatement or loss.
The Group operates a series of controls to meet its needs. These controls include, but are not limited to, a clearly defined organisational structure, written policies, a comprehensive annual strategic planning and budgeting process and detailed monthly reporting.
The annual budget is approved by the Board as part of its normal responsibilities. In addition, the budget figures are regularly reforecast to facilitate the Board’s understanding of the Group’s overall position throughout the year and this reforecast is reported to the Board in addition to the reporting of actual results during the year.
The Audit Committee receives reports from management and the external auditors, concerning the system of internal control and any material control weaknesses. Any significant risk issues are referred to the Board for consideration.
The Board has considered the need for an internal audit function, but has concluded that, at this stage in the Group’s development, the internal control systems in place are appropriate for the size and complexity of the Group.
Fulcrum Utility Services LimitedAnnual Report and Accounts 2015 19
Remuneration reportFOR THE YEAR ENDED 31 MARCH 2015
REMUNERATION COMMITTEEThe Remuneration Committee reviews the performance of each Executive Director and sets the scale and structure of their remuneration and the basis of their service agreement with due regard to the interests of shareholders. To ensure that the Group’s remuneration practices are market competitive, the committee takes advice from various independent sources.
The Board determines the remuneration of each of the Non-executive Directors with the support of external professional advice if required. No Director participates in any discussion regarding his own remuneration.
POLICY ON EXECUTIVE DIRECTORS’ REMUNERATIONThe policy of the Board is to provide an executive remuneration package designed to attract, motivate, reward and retain the Executive Directors. The aim of the Group’s remuneration policy is to ensure that the key Executives are appropriately rewarded for their individual contribution to the Group’s performance, commensurate with their duties and responsibilities.
The Remuneration Committee believes that shareholders’ interests are best served by providing Executives with remuneration packages which have a significant emphasis on performance related pay, through long-term incentive schemes. The Board considers that packages of this nature are consistent with prevailing practice and are necessary to retain and reward Executives of the calibre the Group requires.
The main components of Executive Directors’ remuneration, which can be mirrored with certain senior executives, are basic salary, annual performance related bonus and share options.
BASIC ANNUAL SALARYEach Executive Director’s basic salary is reviewed regularly by the committee. In deciding upon an appropriate level of remuneration, the committee believes that the Group should offer levels of base pay that reflects individual responsibilities compared to similar jobs in comparable companies.
ANNUAL BONUS PAYMENTSThe committee establishes the objectives that must be met for an annual cash bonus to be paid.
SHARE OPTION INCENTIVESThe Group operates an Enterprise Management Incentive (EMI) plan, and an Employee Shareholder Status (ESS) plan, and a Management Participation Shares plan (see note 20). The committee has responsibility for supervising the schemes and the grant of share options under the schemes.
ADDITIONAL BENEFITSEach Executive Director receives private medical insurance and life assurance cover, pension contributions and a company car or car allowance.
DIRECTORS’ INTERESTS IN SHARE OPTIONSMartin Donnachie owns 3,571,414 EMI options and 428,586 unapproved options in the EMI share option plan and 3,567,988 ESS options in the ESS share option plan. Martin Harrison owns 3,000,000 EMI options and 2,432,719 ESS options in the ESS share option plan.
DIRECTORS’ EMOLUMENTSThe remuneration of each of the Directors for the year ended 31 March 2015 is set out as follows:
Salary, fees and bonus
£’000
Other benefits
£’000Pension
£’000
2015 total
£’000
2014 total
£’000
Executive
Martin Donnachie 242 1 16 259 128
Martin Harrison 82 1 2 85 —
Non-executive
Philip Holder 60 — — 60 60
Stephen Gutteridge 30 — — 30 30
Mark Watts (resigned) — — — — 30
Total 414 2 18 434 248
Fulcrum Utility Services LimitedAnnual Report and Accounts 201520
CORPORATE GOVERNANCE
Group Directors’ reportFOR THE YEAR ENDED 31 MARCH 2015
The Directors present their annual report and the audited consolidated financial statements of the Group for the year ended 31 March 2015.
REGISTERED OFFICEThe registered office of Fulcrum Utility Services Limited is PO Box 309, Ugland House, Grand Cayman, KY1-1 104, Cayman Islands.
DIVIDENDSThe Board has proposed a maiden dividend in respect of 2014/15 of 0.4 pence per share, subject to shareholder approval at the AGM.
DIRECTORSThe Directors of the Group during the year and up to the date of signing the financial statements were:
MT Donnachie
MJ Harrison (appointed 29 September 2014)
PB Holder
S Gutteridge
MIJ Watts (resigned 3 June 2014)
EMPLOYEESThe Group’s executive management regularly delivers company-wide briefings on the Group’s strategy and performance. These briefings contain details of the Group’s financial performance where appropriate. In addition, monthly “Reach” briefings contain detailed information on the Group’s operational performance for the previous month, as well as updates on customer activity.
The Group remains committed to fair treatment of people with disabilities in relation to job applications, training, promotion and career development. Every effort is made to find alternative jobs for those who are unable to continue in their existing job due to disability.
The Group takes a positive approach to equality and diversity. The Group promotes equality in the application of reward policies, employment and development opportunities, and aims to support employees in balancing work and personal lifestyles.
ANNUAL GENERAL MEETINGThe Annual General Meeting of the Group is to be held on 30 September 2015.
The notice of meeting appears in the document accompanying this report and financial statements.
DIRECTORS’ INDEMNITIES AND INSURANCEFulcrum Utility Services Limited indemnifies its officers and officers of its subsidiary companies against liabilities arising from the conduct of the Group’s business, to the extent permitted by law, by the placing of directors’ and officers’ insurance.
The insurance policy indemnifies individual Directors’ and officers’ personal legal liability and cost for claims arising out of actions taken in connection with Group business.
STATEMENT OF DIRECTORS’ RESPONSIBILITIESThe Directors of Fulcrum Utility Services Limited (“the Directors”) have accepted responsibility for the preparation of these non-statutory accounts for the year ended 31 March 2015 which are intended by them to give a true and fair view of the state of affairs of the Group and of the profit or loss for that period. They have prepared the non-statutory accounts in accordance with International Financial Reporting Standards (IFRSs) as adopted by the EU.
In preparing these non-statutory accounts, the Directors have:
• selected suitable accounting policies and applied them consistently;
• made judgements and estimates that are reasonable and prudent;
• stated whether they have been prepared in accordance with IFRSs as adopted by the EU; and
• prepared the non-statutory accounts on the going concern basis as they believe that the Group will continue in business.
The Directors have general responsibility for taking such steps as are reasonably open to them to safeguard the assets of the Group and to prevent and detect fraud and other irregularities.
The Company is incorporated in the Cayman Islands and registered in the Cayman Islands and in England and Wales. The Company is not required to prepare audited financial statements under Cayman Island company law; however, the Company is required under AIM rule 19 to provide shareholders with annual audited consolidated financial statements for the year ended 31 March 2015. The Directors have requested KPMG LLP (KPMG) to undertake a non-statutory audit of the Company’s consolidated financial statements in order to discharge their obligations under AIM Rule 19. The audit report issued by KPMG has therefore been addressed to the Company and not the members, as would be the case with a statutory audit.
STATEMENT OF DISCLOSURE OF INFORMATION TO AUDITORSAs at the date this report was signed, so far as each of the Directors is aware, there is no relevant information of which the auditors are unaware and each Director has taken all steps that he ought to have taken as a Director in order to make himself aware of any relevant audit information and to establish that the auditors are aware of that information.
On behalf of the Board
Martin DonnachieChief Executive Officer2 June 2015
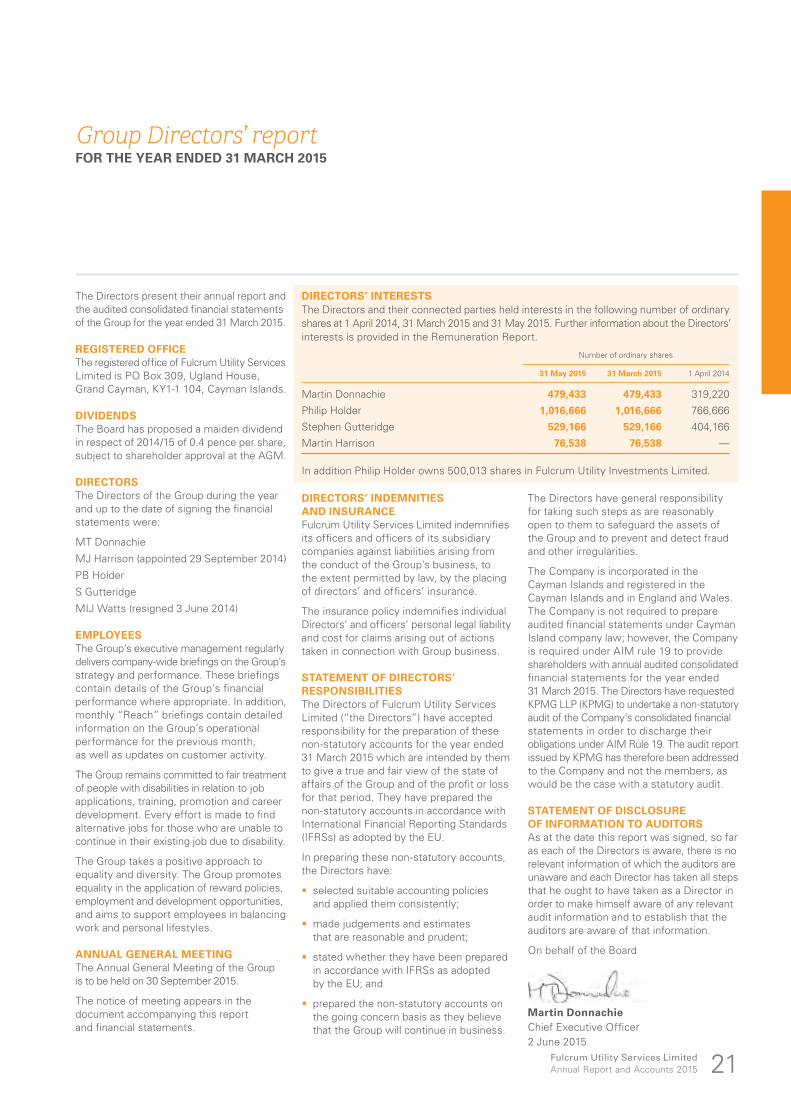
DIRECTORS’ INTERESTSThe Directors and their connected parties held interests in the following number of ordinary shares at 1 April 2014, 31 March 2015 and 31 May 2015. Further information about the Directors’ interests is provided in the Remuneration Report.
Number of ordinary shares
31 May 2015 31 March 2015 1 April 2014
Martin Donnachie 479,433 479,433 319,220
Philip Holder 1,016,666 1,016,666 766,666
Stephen Gutteridge 529,166 529,166 404,166
Martin Harrison 76,538 76,538 —
In addition Philip Holder owns 500,013 shares in Fulcrum Utility Investments Limited.
Fulcrum Utility Services LimitedAnnual Report and Accounts 2015 21
Principal risks and uncertainties
Description Mitigating actions
Growth and strategy executionIt is possible that the growth of the business could take longer than expected, or that the anticipated improvements in financial performance may not be realised in full.
To mitigate this risk, the Group operates comprehensive annual strategic planning and budgeting processes together with regular financial reforecasts. Detailed monthly reporting and analysis of actual performance against the business plan ensures that corrective actions can be taken on a timely basis if necessary.
Dependence on key executives and personnelIn common with many smaller companies, the Group’s future success is substantially dependent upon recruiting, retaining and motivating key executives with relevant industry experience.
The Group has put in place suitable executive and senior management incentive schemes linked to the successful delivery of our strategy. Appropriate staff development programmes are in place to assess, manage and develop the leadership skills of all staff throughout the organisation. In addition, a regular talent management/succession planning exercise is completed for the key members of our teams.
Risks relating to operating in a competitive marketThe business strategy relies fundamentally on the ability to increase revenues and ensuring that the cost base is kept under control. However, the markets in which the Group operates are competitive. The Group faces significant competition, including from organisations that may be larger and/or have greater capital resources.
The Group cannot predict the pricing or promotional activities of its competitors or their effect on its ability to market and sell its services. In order to ensure that its services remain competitive, the Group may be required to reduce its prices as a result of price reductions by its competitors. This could adversely affect the Group’s results.
There are no assurances that the strength of the Group’s competitors will not improve or that the Group will win any additional market share from its competitors, or maintain its existing market share. Existing and/or increased competition could adversely affect the Group’s market share and materially affect its business, financial condition and operating results.
These risks are managed through the corporate planning and review processes as outlined in the growth and strategy execution section above.
Risks relating to the gas connections marketOperating in the gas industry carries with it inherent risks, such as reliance on ageing infrastructure, potential injury to, or loss of, human life or equipment, as well as the risk of downtime or low productivity caused by weather interruptions or equipment failures. Losses could result from litigation or interruption of the Group’s business should these risks materialise.
There are also associated regulatory risks relating to the Group’s reliance on a number of different licences which it requires in order to carry out the design and project management of connections to gas pipelines. In addition, Fulcrum Pipelines Limited is specifically licensed by Ofgem as an Independent Gas Transporter (IGT). This brings with it the risk that the regulatory environment could change, which may have a direct and significant impact on the Group’s regulated activities.
The Group seeks to reduce the risk of losses arising from these circumstances through careful planning, robust operational guidelines, the sharing of risk with client and supplier organisations and by putting in place suitable insurance arrangements.
The Board considers risk assessment, identification of mitigating actions and internal control to be fundamental to achieving the Group’s strategic objectives. The Corporate Governance Report on pages 18 to 19 describes the systems and processes through which the Directors manage and mitigate risks. The principal risks to achieving the Group’s objectives are set out below. The Board recognises that the nature and scope of the risks can change and so regularly reviews the risks faced by the Group as well as the systems and processes in place to mitigate them.
Fulcrum Utility Services LimitedAnnual Report and Accounts 201522
CORPORATE GOVERNANCE
Description Mitigating actions
Reliance on key customersA relatively small number of long-term commercial contracts exist between the Group and its customers.
The relationship between the Group and many of its customers is not regulated by a contract. Instead, the majority of the Group’s business with customers is based on purchase orders and an implied acceptance by customers of the Group’s standard terms and conditions.
The drive for customer service excellence will help to promote recurring customer revenues, further complemented by our established national position with a broad service offering and in-house design and build expertise.
Reliance on significant suppliersThe physical installation works required to install gas connections managed by the Group have historically been carried out by an alliance subcontract partner on behalf of the Group. The move to the in-house management of operational delivery from 1 April 2015 has eliminated this reliance on the alliance partner. The Group does continue to rely upon one nominated subcontractor for the operational delivery in the South of England and as such the Group is exposed to the risk that the financial performance of this supplier may fluctuate or deteriorate in the future and that this could have an adverse impact on the operational or financial performance of the Group.
In order to manage this risk, the Group will regularly and jointly review the performance of the subcontractor against the contract and will implement a suite of defined key performance indicators (KPIs).
Continuity of financing facilitiesDuring 2012/13 the business entered into an asset backed financing agreement with Lloyds Commercial Finance. At the year end, this facility was not utilised.
Sustained improvement in financial performance, the provision of regular management information and maintaining good working relationships with the Group’s bankers will remain important in the future.
Changing mix of salesA changing mix of new contract sales, moving away from payments in advance toward credit terms, may place a strain on working capital as the volume of credit sales increases.
In granting commercial credit terms careful attention is paid to the timing of cash receipts and payments over the period of contract delivery. Where necessary a deposit is requested from customers prior to commencing work and invoicing milestones with customers are matched where possible to the invoicing patterns with contractors. Matching of credit terms through the supply chain will be necessary to ensure the working capital impact of this change in sales mix can be managed effectively.
Management of financial resources including liquidity risk and capital risk managementDisclosure of all the treasury risks can be found in note 26 to the financial statements.
N Read more about our strategy on page 11
N Read more about our business on pages 4 and 5
Fulcrum Utility Services LimitedAnnual Report and Accounts 2015 23
FINANCIAL STATEMENTS
Fulcrum Utility Services LimitedAnnual Report and Accounts 201524
Independent auditors’ report TO FULCRUM UTILITY SERVICES LIMITED
We have audited the non-statutory consolidated financial statements of Fulcrum Utility Services Limited for the year ended 31 March 2015 set out on pages 25 to 48. These non-statutory consolidated financial statements have been prepared for the reasons set out in note 1 to the non-statutory consolidated financial statements and on the basis of the financial reporting framework of International Financial Reporting Standards (IFRSs) as adopted by the EU.
Our report has been prepared for the Group solely in connection with the preparation by the Directors of non-statutory consolidated financial statements prepared to support compliance with the AIM Rules for Companies (“AIM Rules”). It has been released to the Group on the basis that our report shall not be copied, referred to or disclosed, in whole (save for the Group’s own internal purposes) or in part, without our prior written consent.
Our report was designed to meet the agreed requirements of the Group determined by the Group’s needs at the time. Our report should not therefore be regarded as suitable to be used or relied on by any party wishing to acquire rights against us other than the Group for any purpose or in any context. Any party other than the Group who obtains access to our report or a copy and chooses to rely on our report (or any part of it) will do so at its own risk. To the fullest extent permitted by law, KPMG LLP will accept no responsibility or liability in respect of our report to any other party.
RESPECTIVE RESPONSIBILITIES OF DIRECTORS AND AUDITORAs explained more fully in the Directors’ Responsibilities Statement set out on page 21, the Directors are responsible for the preparation of the non-statutory consolidated financial statements, which are intended by them to give a true and fair view. Our responsibility is to audit, and express an opinion on, the non-statutory accounts in accordance with the terms of our engagement letter dated 26 November 2014 and International Standards on Auditing (UK and Ireland). Those standards require us to comply with the Auditing Practices Board’s Ethical Standards for Auditors.
SCOPE OF THE AUDIT OF THE NON-STATUTORY ACCOUNTSAn audit involves obtaining evidence about the amounts and disclosures in the non-statutory accounts sufficient to give reasonable assurance that the non-statutory accounts are free from material misstatement, whether caused by fraud or error. This includes an assessment of: whether the accounting policies are appropriate to the Group and Group’s circumstances and have been consistently applied and adequately disclosed; the reasonableness of significant accounting estimates made by the Directors; and the overall presentation of the non-statutory accounts.
In addition we read all the financial and non-financial information in the annual report to identify material inconsistencies with the audited non-statutory accounts and to identify any information that is apparently materially incorrect based on, or materially inconsistent with, the knowledge acquired by us in the course of performing the audit. If we become aware of any apparent material misstatements or inconsistencies we consider the implications for our report.
OPINION ON NON-STATUTORY ACCOUNTSIn our opinion the non-statutory accounts:
• give a true and fair view of the state of the Group’s affairs as at 31 March 2015 and of its profit for the year then ended; and
• have been properly prepared in accordance with IFRSs as adopted by the EU.
David Morritt (Senior Statutory Auditor) for and on behalf of KPMG LLPChartered Accountants1 The Embankment, Neville Street, Leeds LS1 4DW2 June 2015
Fulcrum Utility Services LimitedAnnual Report and Accounts 2015 25
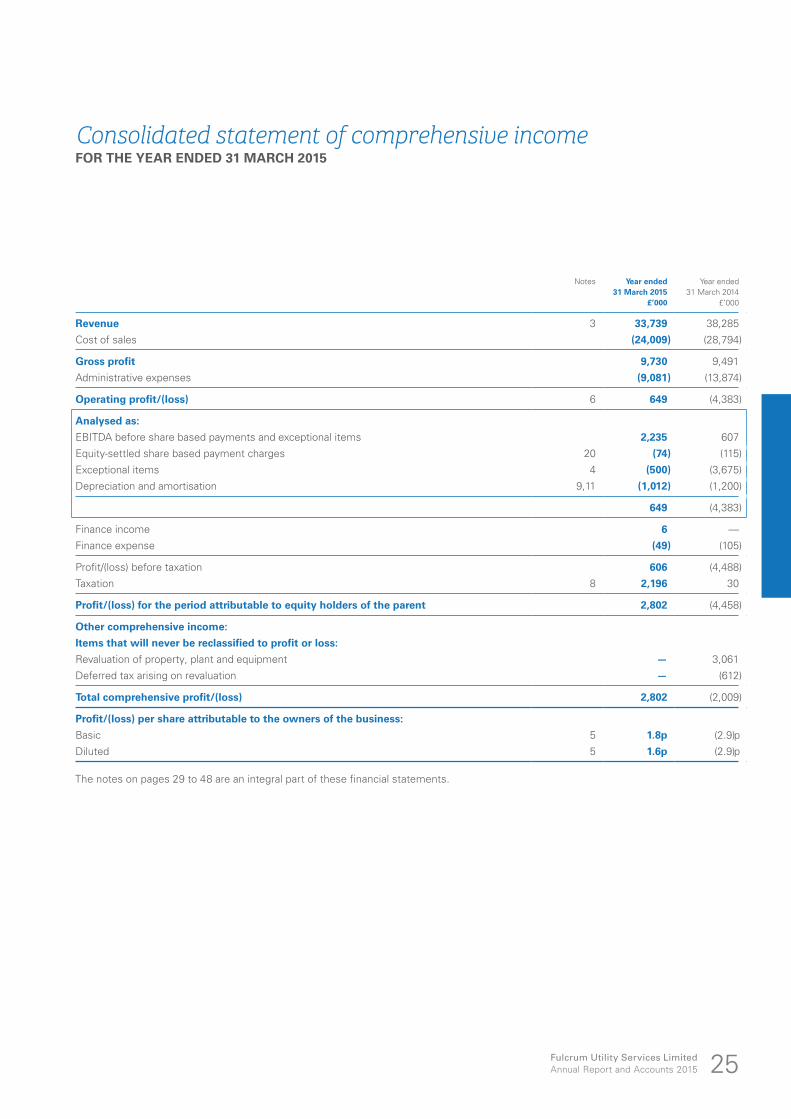
Consolidated statement of comprehensive incomeFOR THE YEAR ENDED 31 MARCH 2015
Notes Year ended 31 March 2015
Year ended 31 March 2014
£’000 £’000
Revenue 3 33,739 38,285
Cost of sales (24,009) (28,794)
Gross profit 9,730 9,491
Administrative expenses (9,081) (13,874)
Operating profit/(loss) 6 649 (4,383)
Analysed as:
EBITDA before share based payments and exceptional items 2,235 607
Equity-settled share based payment charges 20 (74) (115)
Exceptional items 4 (500) (3,675)
Depreciation and amortisation 9,11 (1,012) (1,200)
649 (4,383)
Finance income 6 —
Finance expense (49) (105)
Profit/(loss) before taxation 606 (4,488)
Taxation 8 2,196 30
Profit/(loss) for the period attributable to equity holders of the parent 2,802 (4,458)
Other comprehensive income:
Items that will never be reclassified to profit or loss:
Revaluation of property, plant and equipment — 3,061
Deferred tax arising on revaluation — (612)
Total comprehensive profit/(loss) 2,802 (2,009)
Profit/(loss) per share attributable to the owners of the business:
Basic 5 1.8p (2.9)p
Diluted 5 1.6p (2.9)p
The notes on pages 29 to 48 are an integral part of these financial statements.
FINANCIAL STATEMENTS
Fulcrum Utility Services LimitedAnnual Report and Accounts 201526
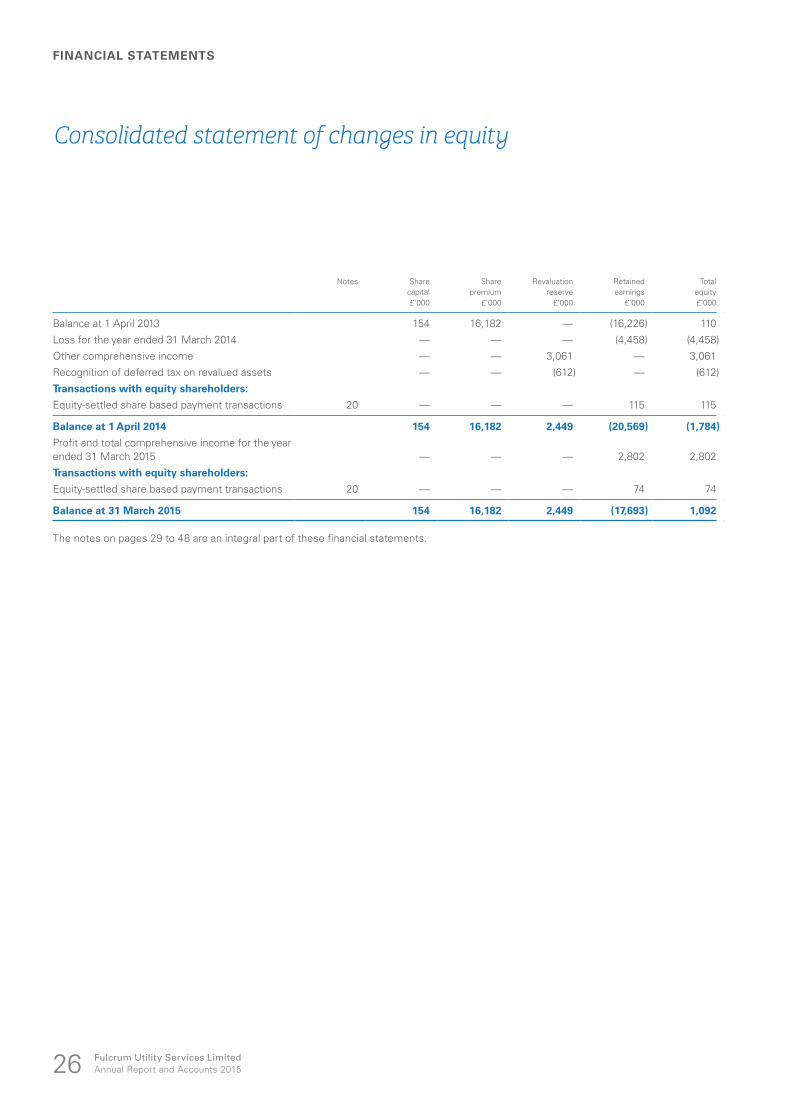
Consolidated statement of changes in equity
Notes Sharecapital
Sharepremium
Revaluationreserve
Retainedearnings
Totalequity
£’000 £’000 £’000 £’000 £’000
Balance at 1 April 2013 154 16,182 — (16,226) 110
Loss for the year ended 31 March 2014 — — — (4,458) (4,458)
Other comprehensive income — — 3,061 — 3,061
Recognition of deferred tax on revalued assets — — (612) — (612)
Transactions with equity shareholders:
Equity-settled share based payment transactions 20 — — — 115 115
Balance at 1 April 2014 154 16,182 2,449 (20,569) (1,784)
Profit and total comprehensive income for the year ended 31 March 2015 — — — 2,802 2,802
Transactions with equity shareholders:
Equity-settled share based payment transactions 20 — — — 74 74
Balance at 31 March 2015 154 16,182 2,449 (17,693) 1,092
The notes on pages 29 to 48 are an integral part of these financial statements.
Fulcrum Utility Services LimitedAnnual Report and Accounts 2015 27
Consolidated balance sheet
Notes 31 March 2015£’000
31 March 2014£’000
Non-current assets
Property, plant and equipment 9 7,508 6,353
Intangible assets 11 2,837 3,359
Deferred tax assets 8 2,734 538
13,079 10,250
Current assets
Inventories 12 1,289 1,974
Trade and other receivables 13 3,840 5,346
Cash and cash equivalents 14,17 5,746 5,326
10,875 12,646
Total assets 23,954 22,896
Current liabilities
Trade and other payables 15 (21,847) (22,245)
Borrowings 16 (168) (274)
Provisions 18 (235) (1,378)
(22,250) (23,897)
Non-current liabilities
Borrowings 16 — (171)
Deferred tax liabilities 8 (612) (612)
(612) (783)
Total liabilities (22,862) (24,680)
Net current liabilities (11,375) (11,251)
Net assets/(liabilities) 1,092 (1,784)
Equity attributable to equity holders of the parent
Share capital 21 154 154
Share premium 22 16,182 16,182
Revaluation reserve 23 2,449 2,449
Retained earnings 24 (17,693) (20,569)
Total surplus/(deficit) on equity 1,092 (1,784)
The notes on pages 29 to 48 are an integral part of these financial statements.
The financial statements on pages 25 to 48 were authorised for issue by the Board of Directors on 2 June 2015 and were signed on its on its behalf by:
Martin DonnachieDirector
FINANCIAL STATEMENTS
Fulcrum Utility Services LimitedAnnual Report and Accounts 201528
Consolidated cash flow statement
Notes Year ended 31 March 2015
Year ended 31 March 2014
£’000 £’000
Cash flows from operating activities
Profit/(loss) before tax for the year 606 (4,488)
Adjustments for:
Depreciation 9 490 656
Amortisation of intangible assets 11 522 544
Loss on disposal of property, plant and equipment 6 9 51
Impairment of assets held for sale 9 — 1,364
Finance income (6) —
Finance expense 49 105
Equity-settled share based payment charges 20 74 115
Exceptional items 4 500 2,311
Decrease in trade and other receivables 13 1,506 2,346
Decrease/(increase) in inventories 12 685 (485)
Decrease in trade and other payables 15 (398) (195)
Decrease in provisions for exceptional items 18 (1,643) (1,731)
Net cash generated from operations 2,394 593
Interest received 6 —
Interest paid (46) (103)
Net cash generated from operating activities 2,354 490
Cash flows from investing activities
Additions to property, plant and equipment 9 (1,654) (1,408)
Additions to intangibles 11 — (12)
Proceeds from sales of property, plant and equipment — 5,884
Net cash generated (used in)/from investing activities (1,654) 4,464
Cash flows from financing activities
Amounts repaid from financing facilities — (1,293)
Repayment of finance lease liabilities (280) (246)
Net cash used in financing activities (280) (1,539)
Net increase in cash and cash equivalents 420 3,415
Cash and cash equivalents at 1 April 2014 5,326 1,911
Cash and cash equivalents at 31 March 2015 14,17 5,746 5,326
The notes on pages 29 to 48 are an integral part of these financial statements.
Fulcrum Utility Services LimitedAnnual Report and Accounts 2015 29
Notes to the consolidated financial statements
1. ACCOUNTING POLICIESThe principal accounting policies adopted in the preparation of these financial statements are set out below.
BASIS OF ACCOUNTINGFulcrum Utility Services Limited (“the Company”) is incorporated in the Cayman Islands and registered in the Cayman Islands and in England and Wales. The Company is not required to prepare audited financial statements under Cayman Island company law; however, the Company is required under AIM Rule 19 to provide shareholders with audited consolidated financial statements for the year ended 31 March 2015. Parent company information is not required and has not been presented.
These consolidated financial statements have been prepared in accordance with International Financial Reporting Standards as adopted by the European Union (IFRSs as adopted by the EU) and IFRIC Interpretations applicable to companies reporting under IFRS. The consolidated financial statements have been prepared under the historical cost convention.
The preparation of consolidated financial statements in conformity with IFRS requires the use of certain critical accounting estimates. It also requires management to exercise its judgement in the process of applying the Group’s accounting policies. The areas involving a higher degree of judgement or complexity, or areas where assumptions and estimates are significant to the financial statements, are highlighted on page 33.
SUBSIDIARIESSubsidiaries are entities controlled by the Company. Control exists when the Company has the power to govern the financial and operating policies of an entity so as to obtain benefits from its activities. In assessing control, the Company takes into consideration potential voting rights that are currently exercisable. The acquisition date is the date on which control is transferred to the acquirer. The financial information of subsidiaries is included in the consolidated financial statements from the date that control commences until the date that control ceases.
Inter-company transactions, balances and unrealised gains on transactions between Group companies are eliminated. Unrealised losses are also eliminated.
REVENUEUtility infrastructure and gas connection activities are recognised as “services revenue”. The majority of projects are completed in a short time frame and, as such, revenue is recognised on project completion. For longer projects, the stage of completion of the works is assessed when considering recognition of revenue. Services revenue is recognised excluding VAT and other indirect taxes. An accrual is made for services revenue in respect of work completed where invoices are yet to be generated. When payment is received in advance of the provision of services, these receipts are recorded as deferred income.
Conveyance of gas is recognised as “transportation revenue” from the date the meter is connected and made available for use and is based on gas volumes.
LEASESAssets held by the Group under lease which transfer to the Group substantially all of the risks and rewards of ownership are classified as finance leases. On initial recognition, the leased asset is measured at an amount equal to the lower of its fair value and the present value of the minimum lease payments. Subsequent to initial recognition, the asset is accounted for in accordance with the accounting policy applicable to that asset.
Assets held under other leases are classified as operating leases and are not recognised in the Group balance sheet.
Payments made under operating leases are recognised in profit or loss on a straight-line basis over the term of the lease. Minimum lease payments made under finance leases are apportioned between the finance expense and the reduction of the outstanding liability. The finance expense is allocated to each period so as to produce a constant periodic rate of interest on the remaining balance of the liability.
IMPAIRMENTFINANCIAL ASSETS (INCLUDING RECEIVABLES)A financial asset not carried at fair value through profit or loss is assessed at each reporting date to determine whether there is objective evidence that it is impaired. A financial asset is impaired if objective evidence indicates that a loss event has occurred after the initial recognition of the asset, and that the loss event had a negative effect on the estimated future cash flows of that asset that can be estimated reliably.
An impairment loss in respect of a financial asset measured at amortised cost is calculated as the difference between its carrying amount and the present value of the estimated future cash flows discounted at the asset’s original effective interest rate and is taken through comprehensive income. When a subsequent event causes the amount of impairment loss to decrease, the decrease in impairment loss is reversed through comprehensive income as an exceptional item.
FINANCIAL STATEMENTS
Fulcrum Utility Services LimitedAnnual Report and Accounts 201530
1. ACCOUNTING POLICIES continued
IMPAIRMENT continued
NON-FINANCIAL ASSETSFor the purpose of impairment testing, assets that cannot be tested individually are grouped together into the smallest group of assets that generates cash inflows from continuing use that are largely independent of the cash inflows of other assets or groups of assets (the “cash-generating unit” or “CGU”). CGUs have been determined to correspond with operating segments.
An impairment loss is recognised if the carrying amount of an asset or its CGU exceeds its estimated recoverable amount. Impairment losses are recognised in comprehensive income. Impairment losses recognised in respect of CGUs are allocated to reduce the carrying amounts of the assets in the unit (or group of units) allocating firstly to goodwill and then to the remaining assets on a pro-rata basis.
The recoverable amount of an asset or cash-generating unit is the greater of its value in use and its fair value less costs to sell. In assessing value in use, the estimated future cash flows are discounted to their present value using a pre-tax discount rate that reflects current market assessments of the time value of money and the risks specific to the asset.
Impairment losses recognised in prior periods are assessed at each reporting date for any indications that the loss has decreased or no longer exists. An impairment loss is reversed if there has been a change in the estimates used to determine the recoverable amount. An impairment loss is reversed only to the extent that the asset’s carrying amount does not exceed the carrying amount that would have been determined, net of depreciation or amortisation, if no impairment loss had been recognised.
EMPLOYEE BENEFITSPENSION PLANSThe Group operates a defined contribution pension plan for the benefit of its employees. Substantially all of the Group’s employees are members of this scheme. The Group pays fixed contributions to a separate entity, and the Group has no further obligations once the contributions have been paid. The contributions are recognised as an employment expense when they are due.
SHORT-TERM BENEFITSShort-term employee benefit obligations are measured on an undiscounted basis and are expensed as the related service is provided. A liability is recognised for the amount expected to be paid under short-term cash bonus or profit-sharing plans if the Group has a present legal or constructive obligation to pay this amount as a result of past service provided by the employee and the obligation can be estimated reliably.
SHARE BASED PAYMENT TRANSACTIONSWhere the Company grants rights to acquire its equity instruments, these equity-settled share based payments are measured at fair value at the date of grant using an appropriate valuation model. The fair value determined at the grant date of equity-settled share based payments is expensed on a straight-line basis over the vesting period, based on an estimate of the number of shares that will eventually vest, with a corresponding entry to equity. At each balance sheet date the estimate of the number of options that are expected to vest is revised. The impact of the revision, if any, is recognised in the statement of comprehensive income with a corresponding entry to equity. Where options are no longer expected to vest because the option holder is no longer employed by the Group, these are treated as forfeitures and a true-up of the charge is recognised. Cancellations or settlements of share based payment transactions during the vesting period by the entity or by the counterparty are accounted for as accelerated vesting; therefore, the amount that otherwise would have been recognised for services received is recognised immediately.
PROVISIONSA provision is recognised in the balance sheet when a present legal or constructive obligation arises as a result of a past event, that can be reliably measured and it is probable that an outflow of economic benefits will be required to settle the obligation.
EXCEPTIONAL ITEMSExceptional items are those that in management’s judgement need to be disclosed separately by virtue of their size or incidence in order to provide greater visibility of the underlying results of the business and which management believes provide additional meaningful information in relation to ongoing operational performance.
Notes to the consolidated financial statements continued
Fulcrum Utility Services LimitedAnnual Report and Accounts 2015 31
1. ACCOUNTING POLICIES continued
TAXATIONTax on the profit or loss for the period comprises current and deferred tax. Tax is recognised in the statement of comprehensive income except to the extent that it relates to items recognised directly in equity, in which case it is recognised in equity.
Current tax is the expected tax payable or receivable on the taxable income or loss for the period, using tax rates enacted or substantively enacted at the balance sheet date, and any adjustment to tax payable in respect of previous years.
Deferred tax is provided on temporary differences between the carrying amounts of assets and liabilities for financial reporting purposes and the amounts used for taxation purposes. The following temporary differences are not provided for: the initial recognition of goodwill; the initial recognition of assets or liabilities that affect neither accounting nor taxable profit other than in a business combination; and differences relating to investments in subsidiaries to the extent that they will probably not reverse in the foreseeable future. The amount of deferred tax provided is based on the expected manner of realisation or settlement of the carrying amount of assets and liabilities, using future tax rates enacted or substantively enacted at the balance sheet date.
A deferred tax asset is recognised only to the extent that it is probable that future taxable profits will be available against which the temporary difference can be utilised. Forecasts are prepared for five years, with future profits being adjusted for the risk and probability of their realisation.
OPERATING SEGMENTSIn accordance with IFRS 8, the Group determines its operating segments in a manner consistent with the internal reporting provided to the “chief operating decision-maker”, who is responsible for allocating resources and assessing performance of the operating segments. The “chief operating decision-maker” has been identified as the Board of Directors.
An operating segment is a component of the Group that engages in business activities from which it may earn revenues and incur expenses, including revenues and expenses that relate to transactions with any of the Group’s other components and for which discrete financial information is available. An operating segment’s trading results are reviewed regularly by the Board of Directors to make decisions about resources to be allocated to the segment and assess its performance.
The Group’s primary format for segment reporting is based on business segments. The business segments are determined based on the Group’s management and internal reporting structure and the aggregation criteria set out in IFRS 8.
Segment results that are reported to the Board of Directors include items directly attributable to a segment as well as those that can be allocated on a reasonable basis.
PROPERTY, PLANT AND EQUIPMENTProperty, plant and equipment excluding pipelines are stated at cost less accumulated depreciation and accumulated impairment losses. Cost includes the original purchase price of the asset and the costs attributable to bringing the asset into working condition for its intended use.
Pipeline assets are initially recognised at the value of the future discounted cash flows expected to be generated from the operation of the pipelines. Domestic pipelines are recognised at this amount, less accumulated depreciation. Industrial and commercial pipelines are subsequently shown at fair value based on independent valuations by external independent valuers, less subsequent depreciation. Valuations are performed with sufficient regularity to ensure that the fair value of a revalued asset does not differ materially from its carrying amount. Any accumulated depreciation at the date of revaluation is restated to the revalued amount of the asset.
Depreciation is charged to the statement of comprehensive income on a straight-line basis over the estimated useful lives of each part of an item of property, plant and equipment. Leased assets are depreciated over the shorter of the lease term and their useful lives unless it is reasonably certain that the Group will obtain ownership by the end of the lease term. The estimated useful lives are as follows:
Pipelines 20 and 40 yearsFixtures and fittings 5 yearsComputer equipment 3 and 5 years
Depreciation methods, useful lives and residual values are reviewed at each balance sheet date.
Gains and losses on disposal are determined by comparing the proceeds with the carrying amount of the asset and are recognised within the statement of comprehensive income.
FINANCIAL STATEMENTS
Fulcrum Utility Services LimitedAnnual Report and Accounts 201532
Notes to the consolidated financial statements continued
1. ACCOUNTING POLICIES continued
BUSINESS ACQUISITIONS AND GOODWILLThe acquisition method of accounting is used to account for the acquisition of subsidiaries from unrelated parties. The cost of an acquisition is measured as the fair value of the consideration given, shares issued or liabilities undertaken at the date of acquisition. The excess of the cost of acquisition over the acquirer’s interest in the fair value of the acquiree’s identifiable assets, liabilities and contingent liabilities is recognised as goodwill and carried at cost less accumulated impairment losses.
All goodwill is considered to have an indefinite life and is tested for impairment annually with any resulting goodwill impairment charge recorded in the statement of comprehensive income.
When evaluating goodwill for a potential impairment, the Group estimates the recoverable amount based on the “value in use” of the cash-generating unit containing the goodwill. If the carrying amount exceeds the recoverable amount, an impairment loss for the difference is recognised.
INTANGIBLE ASSETS OTHER THAN GOODWILLIntangible assets that are acquired by the Group are stated at cost less accumulated amortisation and accumulated impairment losses.
Amortisation is charged to the statement of comprehensive income on a straight-line basis over the estimated useful lives of intangible assets from the date they are available for use. The estimated useful lives are as follows:
Software 3 and 5 years
INVENTORIESWork-in-progress balances reflect direct works costs including direct labour and other attributable variable costs relating to jobs classed as incomplete. Work in progress is valued at the lower of cost and net realisable value.
Net realisable value is the estimated selling price in the ordinary course of business less applicable costs to complete and variable selling expenses.
NON-DERIVATIVE FINANCIAL INSTRUMENTSNon-derivative financial instruments comprise trade and other receivables, cash and cash equivalents, trade and other payables, and loans and other borrowings.
TRADE AND OTHER RECEIVABLESTrade and other receivables are recognised initially at fair value. Subsequent to initial recognition they are measured at amortised cost using the effective interest method, less any impairment losses.
CASH AND CASH EQUIVALENTSCash and cash equivalents comprise cash balances and short-term deposits.
TRADE AND OTHER PAYABLESTrade and other payables are recognised initially at fair value. Subsequent to initial recognition they are measured at amortised cost using the effective interest method.
LOANS AND OTHER BORROWINGSLoans and other borrowings comprise finance lease liabilities and invoice discounting liabilities.
CLASSIFICATION OF FINANCIAL INSTRUMENTSFollowing the adoption of IAS 32, financial instruments issued by the Group are treated as equity only to the extent that they meet the following two conditions:
• they include no contractual obligations upon the Group to deliver cash or other financial assets or to exchange financial assets or financial liabilities with another party under conditions that are potentially unfavourable to the Group; and
• where the instrument will or may be settled in the Company’s own equity instruments, it is either a non-derivative that includes no obligation to deliver a variable number of the Company’s own equity instruments or is a derivative that will be settled by the Company exchanging a fixed amount of cash or other financial assets for a fixed number of its own equity instruments.
To the extent that this definition is not met, the proceeds of issue are classified as a financial liability. Where the instrument so classified takes the legal form of the Company’s own shares, the amounts presented in the financial statements for called-up share capital and share premium account exclude amounts in relation to those shares.
Fulcrum Utility Services LimitedAnnual Report and Accounts 2015 33
1. ACCOUNTING POLICIES continued
CHANGES IN ACCOUNTING POLICY AND DISCLOSURES
NEW STANDARDS, AMENDMENTS AND INTERPRETATIONS THAT ARE IN ISSUE BUT NOT YET EFFECTIVEThe following adopted IFRSs have been issued but have not been applied by the Group in these financial statements. Their adoption is not expected to have a material effect on the financial statements unless otherwise indicated:
• IFRS 9 Financial Instruments (effective date 1 January 2018);
• Accounting for Acquisitions of Interests in Joint Operations – amendments to IFRS 11 (effective date 1 January 2016);
• IFRS 14 Regulatory Deferral Accounts (effective date 1 January 2016);
• IFRS 15 Revenue from Contract with Customers (effective date 1 January 2017);
• Sale or Contribution of Assets between an Investor and its Associate or Joint Venture – amendments to IFRS 10 and IAS 28 (effective date 1 January 2016);
• Annual Improvements to IFRSs – 2010–2012 Cycle;
• Annual Improvements to IFRSs – 2011–2013 Cycle; and
• Annual Improvements to IFRSs – 2012–2014 Cycle.
The Directors anticipate that the adoption of these standards and amendments in future periods will not have a material impact on the financial statements, but may give rise to additional disclosure.
ACCOUNTING ESTIMATES AND JUDGEMENTSThe preparation of financial statements requires management to make estimates and assumptions that affect the reported amounts of assets and liabilities, disclosures of contingent assets and liabilities and the reported amounts of revenue and expenses during the reporting period. Actual results could differ from these estimates. Information about such judgements and estimations is contained in the accounting policies or the notes to the financial statements, and the key areas are summarised below.
Areas of judgement that have the most significant effect on the amounts recognised in the financial statements are as follows:
• Recoverability of deferred tax assets – accounting policies and note 8.
Key sources of estimation uncertainty that have significant risk of causing a material adjustment to the carrying amounts of assets and liabilities within the next financial period are as follows:
• Impairment reviews of tangible and intangible fixed assets The Group tests annually whether tangible and intangible fixed assets have suffered any impairment, based on discounted future cash flows of the assets and the total business of the Group. These calculations require the use of estimates, as detailed in note 10.
• Revenue recognition For longer projects, the stage of completion of the works is assessed when considering recognition of revenue. Use of this percentage completion method requires the Group to estimate the services performed to date as a proportion of the total services to be performed.
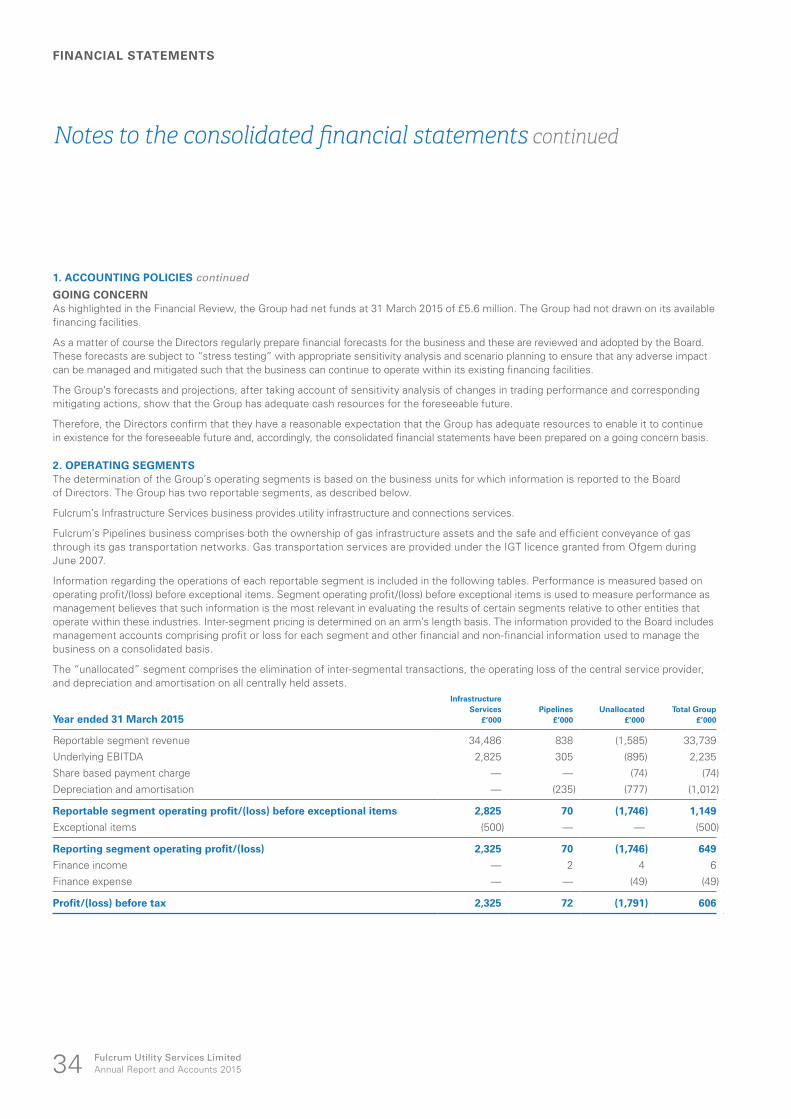
FINANCIAL STATEMENTS
Fulcrum Utility Services LimitedAnnual Report and Accounts 201534
Notes to the consolidated financial statements continued
1. ACCOUNTING POLICIES continued
GOING CONCERNAs highlighted in the Financial Review, the Group had net funds at 31 March 2015 of £5.6 million. The Group had not drawn on its available financing facilities.
As a matter of course the Directors regularly prepare financial forecasts for the business and these are reviewed and adopted by the Board. These forecasts are subject to “stress testing” with appropriate sensitivity analysis and scenario planning to ensure that any adverse impact can be managed and mitigated such that the business can continue to operate within its existing financing facilities.
The Group’s forecasts and projections, after taking account of sensitivity analysis of changes in trading performance and corresponding mitigating actions, show that the Group has adequate cash resources for the foreseeable future.
Therefore, the Directors confirm that they have a reasonable expectation that the Group has adequate resources to enable it to continue in existence for the foreseeable future and, accordingly, the consolidated financial statements have been prepared on a going concern basis.
2. OPERATING SEGMENTSThe determination of the Group’s operating segments is based on the business units for which information is reported to the Board of Directors. The Group has two reportable segments, as described below.
Fulcrum’s Infrastructure Services business provides utility infrastructure and connections services.
Fulcrum’s Pipelines business comprises both the ownership of gas infrastructure assets and the safe and efficient conveyance of gas through its gas transportation networks. Gas transportation services are provided under the IGT licence granted from Ofgem during June 2007.
Information regarding the operations of each reportable segment is included in the following tables. Performance is measured based on operating profit/(loss) before exceptional items. Segment operating profit/(loss) before exceptional items is used to measure performance as management believes that such information is the most relevant in evaluating the results of certain segments relative to other entities that operate within these industries. Inter-segment pricing is determined on an arm’s length basis. The information provided to the Board includes management accounts comprising profit or loss for each segment and other financial and non-financial information used to manage the business on a consolidated basis.
The “unallocated” segment comprises the elimination of inter-segmental transactions, the operating loss of the central service provider, and depreciation and amortisation on all centrally held assets.
Year ended 31 March 2015
InfrastructureServices Pipelines Unallocated Total Group
£’000 £’000 £’000 £’000
Reportable segment revenue 34,486 838 (1,585) 33,739
Underlying EBITDA 2,825 305 (895) 2,235
Share based payment charge — — (74) (74)
Depreciation and amortisation — (235) (777) (1,012)
Reportable segment operating profit/(loss) before exceptional items 2,825 70 (1,746) 1,149
Exceptional items (500) — — (500)
Reporting segment operating profit/(loss) 2,325 70 (1,746) 649
Finance income — 2 4 6
Finance expense — — (49) (49)
Profit/(loss) before tax 2,325 72 (1,791) 606
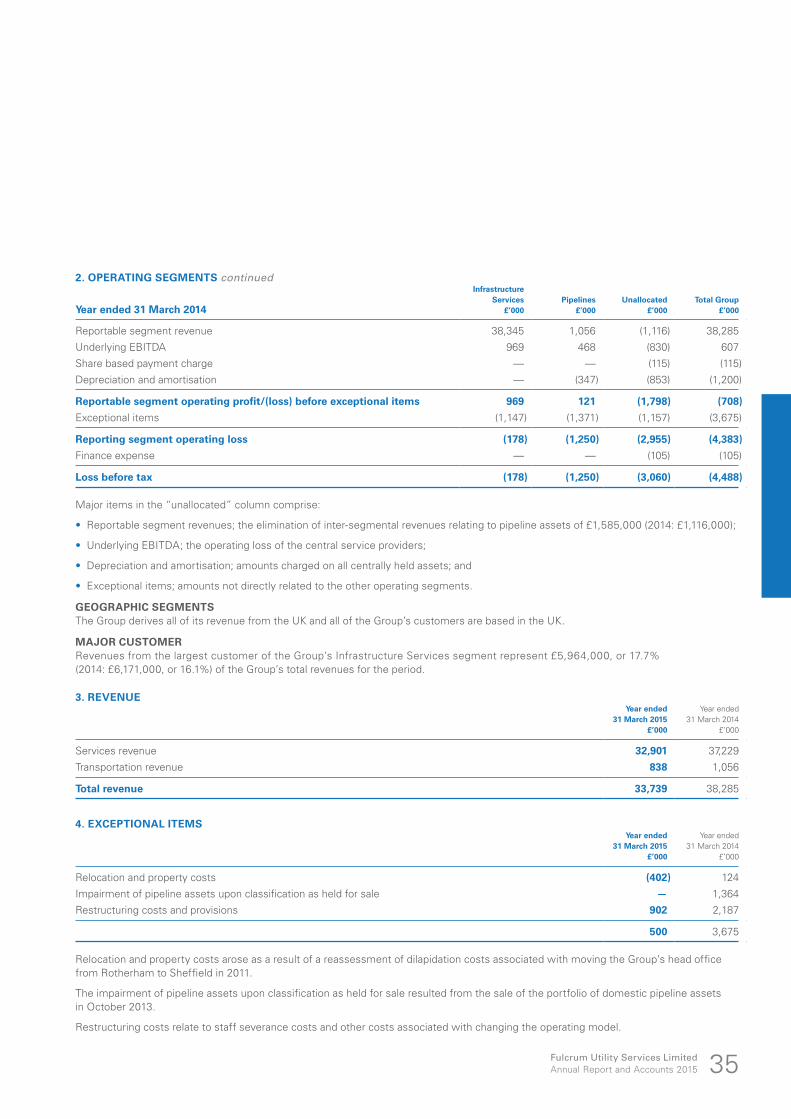
Fulcrum Utility Services LimitedAnnual Report and Accounts 2015 35
2. OPERATING SEGMENTS continued
Year ended 31 March 2014
InfrastructureServices Pipelines Unallocated Total Group
£’000 £’000 £’000 £’000
Reportable segment revenue 38,345 1,056 (1,116) 38,285
Underlying EBITDA 969 468 (830) 607
Share based payment charge — — (115) (115)
Depreciation and amortisation — (347) (853) (1,200)
Reportable segment operating profit/(loss) before exceptional items 969 121 (1,798) (708)
Exceptional items (1,147) (1,371) (1,157) (3,675)
Reporting segment operating loss (178) (1,250) (2,955) (4,383)
Finance expense — — (105) (105)
Loss before tax (178) (1,250) (3,060) (4,488)
Major items in the “unallocated” column comprise:
• Reportable segment revenues; the elimination of inter-segmental revenues relating to pipeline assets of £1,585,000 (2014: £1,116,000);
• Underlying EBITDA; the operating loss of the central service providers;
• Depreciation and amortisation; amounts charged on all centrally held assets; and
• Exceptional items; amounts not directly related to the other operating segments.
GEOGRAPHIC SEGMENTSThe Group derives all of its revenue from the UK and all of the Group’s customers are based in the UK.
MAJOR CUSTOMERRevenues from the largest customer of the Group’s Infrastructure Services segment represent £5,964,000, or 17.7% (2014: £6,171,000, or 16.1%) of the Group’s total revenues for the period.
3. REVENUEYear ended
31 March 2015Year ended
31 March 2014£’000 £’000
Services revenue 32,901 37,229
Transportation revenue 838 1,056
Total revenue 33,739 38,285
4. EXCEPTIONAL ITEMSYear ended
31 March 2015Year ended
31 March 2014£’000 £’000
Relocation and property costs (402) 124
Impairment of pipeline assets upon classification as held for sale — 1,364
Restructuring costs and provisions 902 2,187
500 3,675
Relocation and property costs arose as a result of a reassessment of dilapidation costs associated with moving the Group’s head office from Rotherham to Sheffield in 2011.
The impairment of pipeline assets upon classification as held for sale resulted from the sale of the portfolio of domestic pipeline assets in October 2013.
Restructuring costs relate to staff severance costs and other costs associated with changing the operating model.
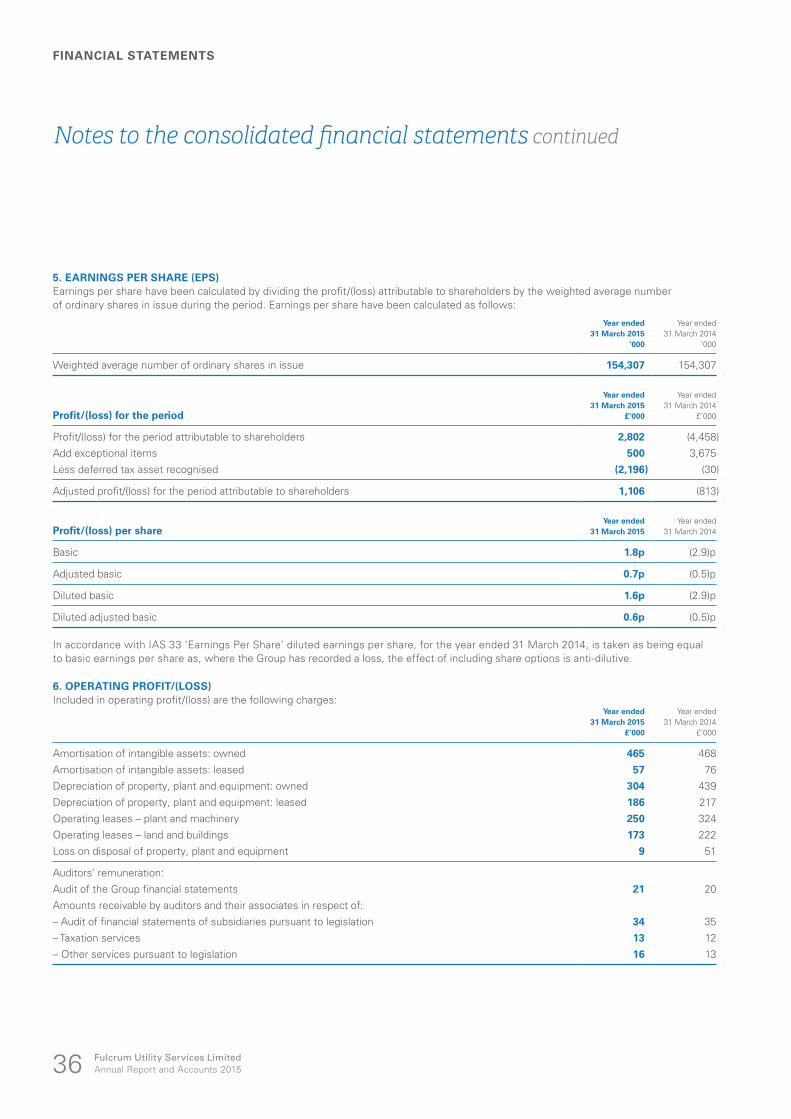
FINANCIAL STATEMENTS
Fulcrum Utility Services LimitedAnnual Report and Accounts 201536
Notes to the consolidated financial statements continued
5. EARNINGS PER SHARE (EPS)Earnings per share have been calculated by dividing the profit/(loss) attributable to shareholders by the weighted average number of ordinary shares in issue during the period. Earnings per share have been calculated as follows:
Year ended 31 March 2015
Year ended 31 March 2014
‘000 ‘000
Weighted average number of ordinary shares in issue 154,307 154,307
Profit/(loss) for the period
Year ended 31 March 2015
Year ended 31 March 2014
£’000 £’000
Profit/(loss) for the period attributable to shareholders 2,802 (4,458)
Add exceptional items 500 3,675
Less deferred tax asset recognised (2,196) (30)
Adjusted profit/(loss) for the period attributable to shareholders 1,106 (813)
Profit/(loss) per shareYear ended
31 March 2015Year ended
31 March 2014
Basic 1.8p (2.9)p
Adjusted basic 0.7p (0.5)p
Diluted basic 1.6p (2.9)p
Diluted adjusted basic 0.6p (0.5)p
In accordance with IAS 33 ‘Earnings Per Share’ diluted earnings per share, for the year ended 31 March 2014, is taken as being equal to basic earnings per share as, where the Group has recorded a loss, the effect of including share options is anti-dilutive.
6. OPERATING PROFIT/(LOSS)Included in operating profit/(loss) are the following charges:
Year ended 31 March 2015
Year ended 31 March 2014
£’000 £’000
Amortisation of intangible assets: owned 465 468
Amortisation of intangible assets: leased 57 76
Depreciation of property, plant and equipment: owned 304 439
Depreciation of property, plant and equipment: leased 186 217
Operating leases – plant and machinery 250 324
Operating leases – land and buildings 173 222
Loss on disposal of property, plant and equipment 9 51
Auditors’ remuneration:
Audit of the Group financial statements 21 20
Amounts receivable by auditors and their associates in respect of:
– Audit of financial statements of subsidiaries pursuant to legislation 34 35
– Taxation services 13 12
– Other services pursuant to legislation 16 13
Fulcrum Utility Services LimitedAnnual Report and Accounts 2015 37
7. STAFF NUMBERS AND COSTSThe average monthly number of persons employed by the Group (including Directors) during the period, analysed by category, was as follows:
Number of employees 2015 2014
Administration 129 205
The aggregate payroll costs of these persons were as follows:Year ended
31 March 2015Year ended
31 March 2014£’000 £’000
Wages and salaries 4,627 6,680
Social security costs 531 721
Other pension costs 304 531
Share based payments 74 41
5,536 7,973
Payroll costs set out above exclude staff severance costs resulting from the Group’s strategy to realign its cost base. These costs have been treated as exceptional and are disclosed in note 4.
8. TAXATIONYear ended
31 March 2015Year ended
31 March 2014£’000 £’000
Current tax — —
Deferred tax – origination and reversal of timing differences 2,196 30
Total tax credit 2,196 30
Deferred tax has been recognised in respect of tax losses carried forward that are expected to be utilised against future taxable profits. The rate of UK corporation tax changed from 21% to 20% on 1 April 2015. As deferred tax balances are measured at the rates that are expected to apply in the periods of the reversal, deferred tax assets at 31 March 2015 have been calculated using a long-term rate of 20%.
The Group has a further £21.4 million (2014: £21.6 million) of tax losses of which a deferred tax asset of only £2.7 million has been recognised due to insufficient certainty surrounding the timing of their utilisation.
RECONCILIATION OF EFFECTIVE TAX RATEYear ended
31 March 2015Year ended
31 March 2014£’000 £’000
Profit/(loss) before taxation 606 (4,488)
Tax using the UK corporation tax rate of 21% (2014: 23%) (127) 1,032
Non-deductible expenses (19) (368)
Capital allowances in excess of depreciation 108 42
Unrecognised tax losses 38 (706)
Recognition of tax effect of previously unrecognised tax losses 2,196 30
Total tax credit 2,196 30
The Group incurred corporation tax profits in the period of approximately £0.2 million (2014: tax losses of £3.1 million).
FINANCIAL STATEMENTS
Fulcrum Utility Services LimitedAnnual Report and Accounts 201538
Notes to the consolidated financial statements continued
8. TAXATION continued
MOVEMENT IN DEFERRED TAX BALANCES31 March 2015 31 March 2014
Deferred tax assets
Deferred tax liabilities
Deferred tax assets
Deferred tax liabilities
£’000 £’000 £’000 £’000
At 1 April 2014 538 (612) 508 —Recognised in profit or loss
Tax losses carried forward 2,196 — 30 —Recognised in other comprehensive income
Revaluation of property, plant and equipment — — — (612)
At 31 March 2015 2,734 (612) 538 (612)
9. PROPERTY, PLANT AND EQUIPMENT
PipelinesFixtures and
fittingsComputer
equipment Total£’000 £’000 £’000 £’000
Cost
At 1 April 2013 10,163 235 1,156 11,554Additions 1,408 — — 1,408Revaluation 3,061 — — 3,061Disposals (8,703) (42) (127) (8,872)
At 31 March 2014 5,929 193 1,029 7,151
Additions 1,622 — 32 1,654
Reinstatement 350 125 — 475Disposals — — (311) (311)
At 31 March 2015 7,901 318 750 8,969
Accumulated depreciation
At 1 April 2013 (1,146) (98) (489) (1,733)Depreciation charge for the period (347) (51) (258) (656)Impairment (1,364) — — (1,364)Disposals 2,821 25 109 2,955
At 31 March 2014 (36) (124) (638) (798)
Depreciation charge for the period (236) (40) (214) (490)Reinstatement (350) (125) — (475)Disposals — — 302 302
At 31 March 2015 (622) (289) (550) (1,461)
Net book value
At 31 March 2015 7,279 29 200 7,508
At 31 March 2014 5,893 69 391 6,353
At 1 April 2013 9,017 137 667 9,821
There were no commitments to purchase any property, plant and equipment at 31 March 2015 or 31 March 2014.
At 31 March 2015 the net book value of leased plant and equipment was £172,000 (2014: £367,000).
The cost and accumulated depreciation above were reinstated during the year following an exercise to revisit the Group’s underlying fixed asset records. The adjustment has no impact on net book value.
Fulcrum Utility Services LimitedAnnual Report and Accounts 2015 39
10. IMPAIRMENT TESTING
PIPELINE ASSETSFor the assets within the pipeline operating segment, the recoverable amount of these assets has been calculated with reference to their value in use. The key features of this calculation are shown below:
Year ended31 March 2015
Year ended31 March 2014
Period on which management approved forecasts are based 20 years 20 years
Discount rate 9.0% 9.0%
Conversion of domestic customers for existing assets 99% 99%
Conversion of non-domestic customers for existing assets 50% 50%
The forecasts include assumptions about reductions in network income as imposed by Ofgem and also assume that cash flows will stop after 20 years. A forecast period of 20 years has been used as the business expects to generate income from these assets for a minimum of 20 years, with the amount of income being prescribed by the Regulatory Price Control mechanism.
Conversion percentage is an assumption on pipeline assets becoming cash generating on connection.
The assumptions outlined above are consistent with management’s experience of these items over the period since the Group was formed.
GOODWILLAll of the goodwill held by the Group is considered to fall in the CGU of Infrastructure Services.
Management has performed an impairment review for Infrastructure Services. The recoverable amount of these assets has been calculated with reference to their value in use.
The key features of this calculation are shown below:Year ended
31 March 2015Year ended
31 March 2014
Period on which management approved forecasts are based 3 years 3 years
Growth rate applied beyond approved forecast period 1.5% 1.5%
Discount rate 11.0% 11.0%
The value in use calculation is based on pre-tax cash flow projections based on financial budgets approved by management covering a three year period. Cash flows beyond the three year period are extrapolated using a conservative estimated growth rate of 1.5%. Management determined budgeted pre-tax cash flows based on past performance.
DISCOUNT RATES USEDThe discount rates used for both impairment reviews are based upon the pre-tax weighted average cost of capital expected to be relevant for the profile of the assets involved. The lower discount rate used for the pipeline assets compared with that used for the business as a whole reflects the lower risk associated with the income from pipeline assets.
Whilst it is conceivable that a key assumption in the calculations could change, no reasonably foreseeable change to key assumptions is considered to result in an impairment.
FINANCIAL STATEMENTS
Fulcrum Utility Services LimitedAnnual Report and Accounts 201540
Notes to the consolidated financial statements continued
11. INTANGIBLE ASSETSGoodwill Software Total
£’000 £’000 £’000
Cost
At 1 April 2013 2,225 2,448 4,673
Additions — 12 12
Disposals — (72) (72)
At 31 March 2014 2,225 2,388 4,613
Disposals — (94) (94)
At 31 March 2015 2,225 2,294 4,519
Accumulated amortisation and impairment
At 1 April 2013 — (764) (764)
Amortisation for the period — (544) (544)
Disposals — 54 54
At 31 March 2014 — (1,254) (1,254)
Amortisation for the period — (522) (522)
Disposals — 94 94
At 31 March 2015 — (1,682) (1,682)
Net book value
At 31 March 2015 2,225 612 2,837
At 31 March 2014 2,225 1,134 3,359
At 1 April 2013 2,225 1,684 3,909
The amortisation charge is recognised in administrative expenses in the Consolidated Statement of Comprehensive Income.
At 31 March 2015 the net book value of leased software was £8,000 (2014: £65,000).
12. INVENTORIES31 March 2015 31 March 2014
£’000 £’000
Work in progress 1,289 1,974
Inventories recognised as cost of sales in the period amounted to £22,776,000 (2014: £26,271,000). The write-down of inventories to net realisable value amounted to £nil (2014: £nil). Any write-down is included in cost of sales in the Consolidated Statement of Comprehensive Income.
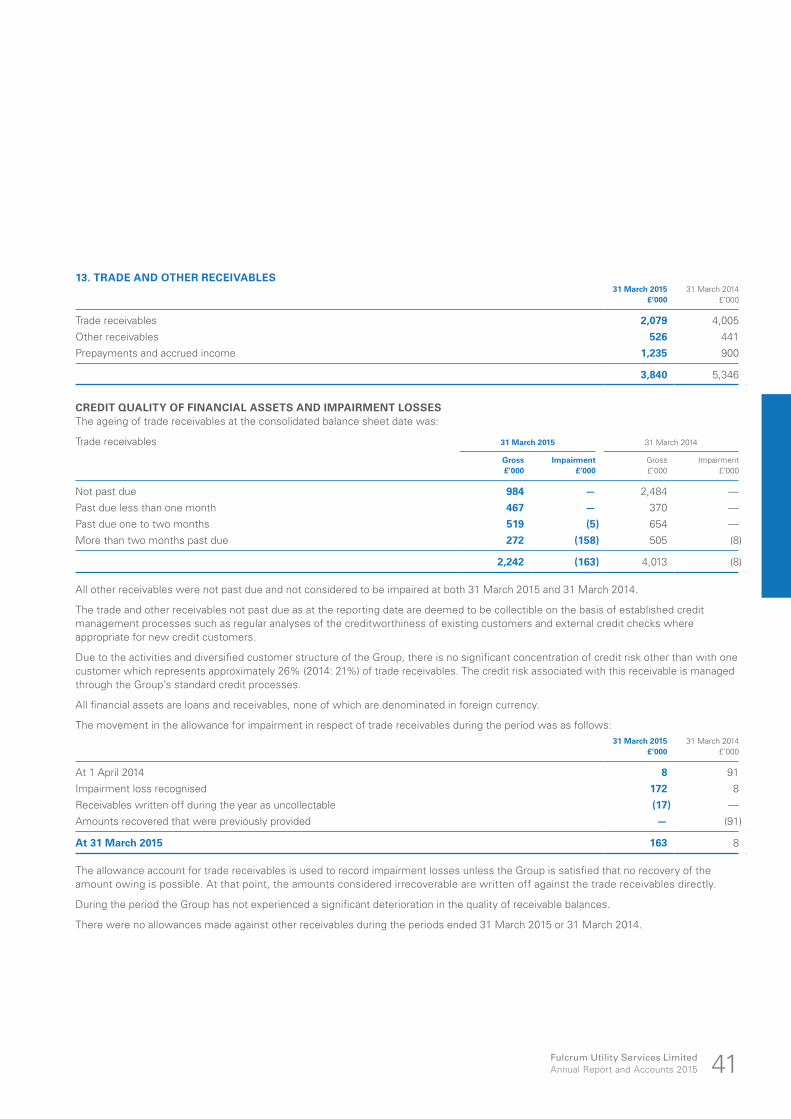
Fulcrum Utility Services LimitedAnnual Report and Accounts 2015 41
13. TRADE AND OTHER RECEIVABLES31 March 2015 31 March 2014
£’000 £’000
Trade receivables 2,079 4,005
Other receivables 526 441
Prepayments and accrued income 1,235 900
3,840 5,346
CREDIT QUALITY OF FINANCIAL ASSETS AND IMPAIRMENT LOSSESThe ageing of trade receivables at the consolidated balance sheet date was:
Trade receivables 31 March 2015 31 March 2014
Gross Impairment Gross Impairment£’000 £’000 £’000 £’000
Not past due 984 — 2,484 —
Past due less than one month 467 — 370 —
Past due one to two months 519 (5) 654 —
More than two months past due 272 (158) 505 (8)
2,242 (163) 4,013 (8)
All other receivables were not past due and not considered to be impaired at both 31 March 2015 and 31 March 2014.
The trade and other receivables not past due as at the reporting date are deemed to be collectible on the basis of established credit management processes such as regular analyses of the creditworthiness of existing customers and external credit checks where appropriate for new credit customers.
Due to the activities and diversified customer structure of the Group, there is no significant concentration of credit risk other than with one customer which represents approximately 26% (2014: 21%) of trade receivables. The credit risk associated with this receivable is managed through the Group’s standard credit processes.
All financial assets are loans and receivables, none of which are denominated in foreign currency.
The movement in the allowance for impairment in respect of trade receivables during the period was as follows:31 March 2015 31 March 2014
£’000 £’000
At 1 April 2014 8 91
Impairment loss recognised 172 8
Receivables written off during the year as uncollectable (17) —
Amounts recovered that were previously provided — (91)
At 31 March 2015 163 8
The allowance account for trade receivables is used to record impairment losses unless the Group is satisfied that no recovery of the amount owing is possible. At that point, the amounts considered irrecoverable are written off against the trade receivables directly.
During the period the Group has not experienced a significant deterioration in the quality of receivable balances.
There were no allowances made against other receivables during the periods ended 31 March 2015 or 31 March 2014.
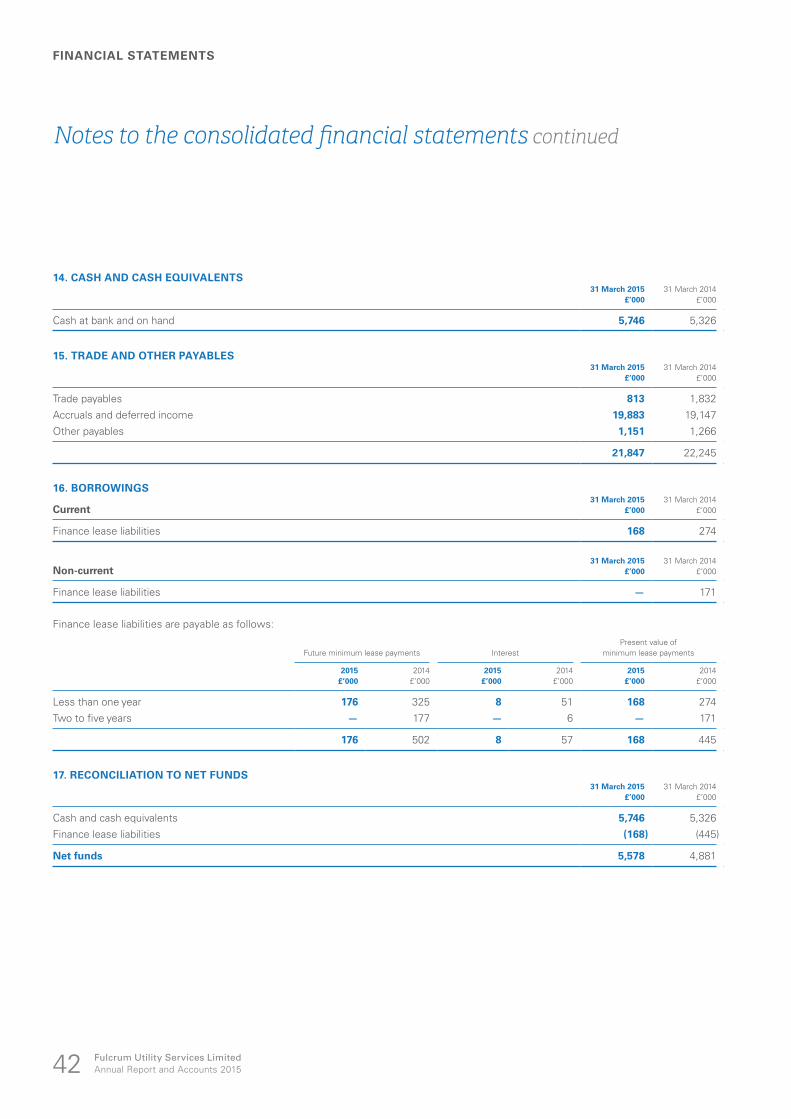
FINANCIAL STATEMENTS
Fulcrum Utility Services LimitedAnnual Report and Accounts 201542
Notes to the consolidated financial statements continued
14. CASH AND CASH EQUIVALENTS31 March 2015 31 March 2014
£’000 £’000
Cash at bank and on hand 5,746 5,326
15. TRADE AND OTHER PAYABLES31 March 2015 31 March 2014
£’000 £’000
Trade payables 813 1,832
Accruals and deferred income 19,883 19,147
Other payables 1,151 1,266
21,847 22,245
16. BORROWINGS
Current31 March 2015 31 March 2014
£’000 £’000
Finance lease liabilities 168 274
Non-current31 March 2015 31 March 2014
£’000 £’000
Finance lease liabilities — 171
Finance lease liabilities are payable as follows:
Future minimum lease payments InterestPresent value of
minimum lease payments
2015 2014 2015 2014 2015 2014£’000 £’000 £’000 £’000 £’000 £’000
Less than one year 176 325 8 51 168 274
Two to five years — 177 — 6 — 171
176 502 8 57 168 445
17. RECONCILIATION TO NET FUNDS31 March 2015 31 March 2014
£’000 £’000
Cash and cash equivalents 5,746 5,326
Finance lease liabilities (168) (445)
Net funds 5,578 4,881
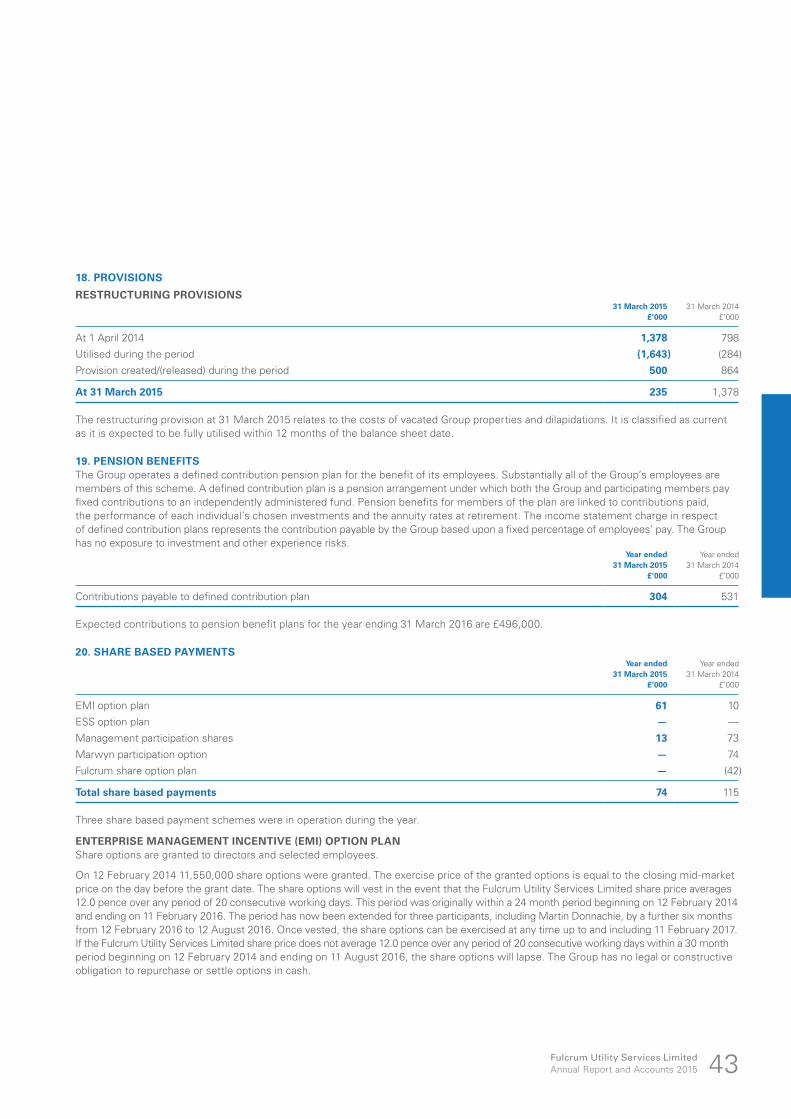
Fulcrum Utility Services LimitedAnnual Report and Accounts 2015 43
18. PROVISIONS
RESTRUCTURING PROVISIONS31 March 2015 31 March 2014
£’000 £’000
At 1 April 2014 1,378 798
Utilised during the period (1,643) (284)
Provision created/(released) during the period 500 864
At 31 March 2015 235 1,378
The restructuring provision at 31 March 2015 relates to the costs of vacated Group properties and dilapidations. It is classified as current as it is expected to be fully utilised within 12 months of the balance sheet date.
19. PENSION BENEFITSThe Group operates a defined contribution pension plan for the benefit of its employees. Substantially all of the Group’s employees are members of this scheme. A defined contribution plan is a pension arrangement under which both the Group and participating members pay fixed contributions to an independently administered fund. Pension benefits for members of the plan are linked to contributions paid, the performance of each individual’s chosen investments and the annuity rates at retirement. The income statement charge in respect of defined contribution plans represents the contribution payable by the Group based upon a fixed percentage of employees’ pay. The Group has no exposure to investment and other experience risks.
Year ended 31 March 2015
Year ended 31 March 2014
£’000 £’000
Contributions payable to defined contribution plan 304 531
Expected contributions to pension benefit plans for the year ending 31 March 2016 are £496,000.
20. SHARE BASED PAYMENTSYear ended
31 March 2015Year ended
31 March 2014£’000 £’000
EMI option plan 61 10
ESS option plan — —
Management participation shares 13 73
Marwyn participation option — 74
Fulcrum share option plan — (42)
Total share based payments 74 115
Three share based payment schemes were in operation during the year.
ENTERPRISE MANAGEMENT INCENTIVE (EMI) OPTION PLANShare options are granted to directors and selected employees.
On 12 February 2014 11,550,000 share options were granted. The exercise price of the granted options is equal to the closing mid-market price on the day before the grant date. The share options will vest in the event that the Fulcrum Utility Services Limited share price averages 12.0 pence over any period of 20 consecutive working days. This period was originally within a 24 month period beginning on 12 February 2014 and ending on 11 February 2016. The period has now been extended for three participants, including Martin Donnachie, by a further six months from 12 February 2016 to 12 August 2016. Once vested, the share options can be exercised at any time up to and including 11 February 2017. If the Fulcrum Utility Services Limited share price does not average 12.0 pence over any period of 20 consecutive working days within a 30 month period beginning on 12 February 2014 and ending on 11 August 2016, the share options will lapse. The Group has no legal or constructive obligation to repurchase or settle options in cash.
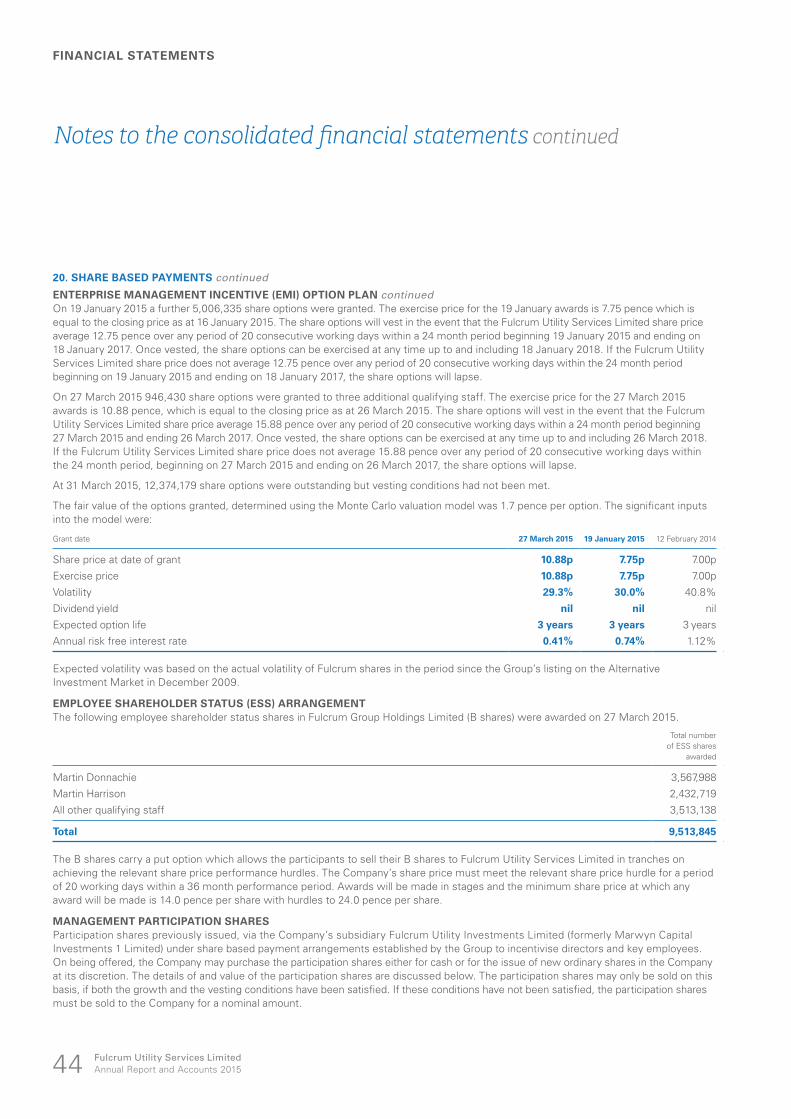
FINANCIAL STATEMENTS
Fulcrum Utility Services LimitedAnnual Report and Accounts 201544
Notes to the consolidated financial statements continued
20. SHARE BASED PAYMENTS continued
ENTERPRISE MANAGEMENT INCENTIVE (EMI) OPTION PLAN continuedOn 19 January 2015 a further 5,006,335 share options were granted. The exercise price for the 19 January awards is 7.75 pence which is equal to the closing price as at 16 January 2015. The share options will vest in the event that the Fulcrum Utility Services Limited share price average 12.75 pence over any period of 20 consecutive working days within a 24 month period beginning 19 January 2015 and ending on 18 January 2017. Once vested, the share options can be exercised at any time up to and including 18 January 2018. If the Fulcrum Utility Services Limited share price does not average 12.75 pence over any period of 20 consecutive working days within the 24 month period beginning on 19 January 2015 and ending on 18 January 2017, the share options will lapse.
On 27 March 2015 946,430 share options were granted to three additional qualifying staff. The exercise price for the 27 March 2015 awards is 10.88 pence, which is equal to the closing price as at 26 March 2015. The share options will vest in the event that the Fulcrum Utility Services Limited share price average 15.88 pence over any period of 20 consecutive working days within a 24 month period beginning 27 March 2015 and ending 26 March 2017. Once vested, the share options can be exercised at any time up to and including 26 March 2018. If the Fulcrum Utility Services Limited share price does not average 15.88 pence over any period of 20 consecutive working days within the 24 month period, beginning on 27 March 2015 and ending on 26 March 2017, the share options will lapse.
At 31 March 2015, 12,374,179 share options were outstanding but vesting conditions had not been met.
The fair value of the options granted, determined using the Monte Carlo valuation model was 1.7 pence per option. The significant inputs into the model were:
Grant date 27 March 2015 19 January 2015 12 February 2014
Share price at date of grant 10.88p 7.75p 7.00p
Exercise price 10.88p 7.75p 7.00p
Volatility 29.3% 30.0% 40.8%
Dividend yield nil nil nil
Expected option life 3 years 3 years 3 years
Annual risk free interest rate 0.41% 0.74% 1.12%
Expected volatility was based on the actual volatility of Fulcrum shares in the period since the Group’s listing on the Alternative Investment Market in December 2009.
EMPLOYEE SHAREHOLDER STATUS (ESS) ARRANGEMENTThe following employee shareholder status shares in Fulcrum Group Holdings Limited (B shares) were awarded on 27 March 2015.
Total numberof ESS shares
awarded
Martin Donnachie 3,567,988
Martin Harrison 2,432,719
All other qualifying staff 3,513,138
Total 9,513,845
The B shares carry a put option which allows the participants to sell their B shares to Fulcrum Utility Services Limited in tranches on achieving the relevant share price performance hurdles. The Company’s share price must meet the relevant share price hurdle for a period of 20 working days within a 36 month performance period. Awards will be made in stages and the minimum share price at which any award will be made is 14.0 pence per share with hurdles to 24.0 pence per share.
MANAGEMENT PARTICIPATION SHARESParticipation shares previously issued, via the Company’s subsidiary Fulcrum Utility Investments Limited (formerly Marwyn Capital Investments 1 Limited) under share based payment arrangements established by the Group to incentivise directors and key employees. On being offered, the Company may purchase the participation shares either for cash or for the issue of new ordinary shares in the Company at its discretion. The details of and value of the participation shares are discussed below. The participation shares may only be sold on this basis, if both the growth and the vesting conditions have been satisfied. If these conditions have not been satisfied, the participation shares must be sold to the Company for a nominal amount.
Fulcrum Utility Services LimitedAnnual Report and Accounts 2015 45
20. SHARE BASED PAYMENTS continued
GROWTH CONDITIONThe growth condition is that the compound annual growth of the Company’s equity value must be at least 12.5% per annum. The growth condition takes into account new shares issued, dividends and capital returned to shareholders.
VESTING CONDITIONThe vesting condition is that the participation shares may only be sold in the time period that begins on the third anniversary following admission to trading (i.e. 8 July 2013) and ends on the fifth anniversary following admission to trading, or on a sale, change of control or winding up of the Company. If the growth condition is not met by the fifth anniversary of admission to trading (i.e. 8 July 2015), then the participation shares shall be sold back to the Company for a nominal amount.
VALUESubject to the growth and vesting conditions detailed above, the management participation shares can be sold for a value equal to 10% of the increase in “shareholder value” in the Company. Shareholder value is broadly defined as the increase in market capitalisation of all ordinary shares of the Company issued up to the date of sale, allowing for any dividends and other capital movements.
21. SHARE CAPITAL31 March 2015 31 March 2014
£’000 £’000
Authorised
500,000,000 ordinary shares of £0.001 each 500 500
Allotted, issued and fully paid
154,306,667 ordinary shares of £0.001 each 154 154
22. SHARE PREMIUM31 March 2015 31 March 2014
£’000 £’000
At start and end of period 16,182 16,182
23. REVALUATION RESERVE31 March 2015 31 March 2014
£’000 £’000
At 1 April 2014 2,449 —Revaluation in the period — 3,061Recognition of deferred tax liability — (612)
At 31 March 2015 2,449 2,449
24. RETAINED EARNINGS31 March 2015 31 March 2014
£’000 £’000
At 1 April 2014 (20,569) (16,226)Retained profit/(loss) in the period 2,802 (4,458)Equity-settled share based payment transactions 74 115
At 31 March 2015 (17,693) (20,569)
FINANCIAL STATEMENTS
Fulcrum Utility Services LimitedAnnual Report and Accounts 201546
Notes to the consolidated financial statements continued
25. FINANCIAL INSTRUMENTS
FAIR VALUES OF FINANCIAL INSTRUMENTS
FAIR VALUE HIERARCHYThe Group does not have any financial instruments that are measured at fair value on a recurring basis.
CARRYING VALUES AND FAIR VALUES The fair values of all financial instruments are equal to their book values. The carrying value less impairment provision of trade receivables and other receivables, and the carrying value of trade payables, is assumed to approximate their fair values.
31 March 2015 31 March 2014
Loans and receivables £’000 £’000
Assets as per the balance sheet
Trade receivables 2,079 4,005
Other receivables 526 441
Cash and cash equivalents 5,746 5,326
8,351 9,772
31 March 2015 31 March 2014
Other financial liabilities £’000 £’000
Liabilities as per the balance sheet
Trade payables 813 1,832
Other payables 1,151 1,266
Loans and borrowings 168 445
2,132 3,543
26. FINANCIAL RISK MANAGEMENTThe Group’s overall risk management programme seeks to minimise potential adverse effects on its financial performance.
The Group’s activities expose it to credit risk, liquidity risk and capital management risk. These risks are managed by the Chief Financial Officer under policies approved by the Board and the Audit Committee, which are summarised below.
CREDIT RISK MANAGEMENTCredit risk is the risk of financial loss to the Group if a customer or counterparty to a financial instrument fails to meet its contractual obligations, and arises principally from the Group’s receivables from customers and deposits with financial institutions.
The Group’s treasury policy and objectives in relation to credit risk is to minimise the likelihood that the Group will experience financial loss due to counterparty failure. It is considered that the failure of any single counterparty would not materially impact the financial wellbeing of the Group, other than one customer, for which the risk of failure is considered to be minimal based on current market conditions and performance.
TRADE, OTHER RECEIVABLES AND ACCRUED INCOMEThe Group’s exposure to credit risk is influenced mainly by the individual characteristics of each customer. However, management also considers the demographics of the Group’s customer base. Management considers that there is no geographical concentration of credit risk other than the UK where all customers are based.
The Group has established a credit policy under which each new customer is analysed individually for creditworthiness before the Group’s standard payment and delivery terms and conditions are offered/terms are adjusted accordingly. Purchase limits are established for each customer, which represents the maximum open amount without requiring approval.
In accordance with the Group’s revenue policy, an accrual is estimated for services revenue in respect of work where invoices are yet to be issued to customers. These arrangements are included within the Group’s credit policies.
Fulcrum Utility Services LimitedAnnual Report and Accounts 2015 47
26. FINANCIAL RISK MANAGEMENT continued
CREDIT RISK MANAGEMENT continued
EXPOSURE TO CREDIT RISKThe carrying amount of financial assets represents the maximum credit exposure. Therefore, the maximum exposure to credit risk at the balance sheet date was the carrying amount of financial assets.
LIQUIDITY RISK MANAGEMENTLiquidity risk is the risk that the Group will not be able to meet its financial obligations as they fall due.
The Group’s approach to managing liquidity is to ensure, as far as possible, that it will always have sufficient liquidity to meet its liabilities when due, without incurring unacceptable losses or risking damage to the Group.
The Group forecasts on a regular basis the expected cash flows that will occur on a daily, weekly and monthly basis. This information is used in conjunction with the weekly reporting of actual cash balances at bank in order to calculate the level of funding that will be required in the short and medium term.
The carrying amount of all non-derivative financial liabilities shown in the balance sheets at 31 March 2015 and 31 March 2014 is the same as the contractual cash flows. All contractual cash flows are due within one year.
CASH FLOW RISK MANAGEMENTThe Group does not have any cash flow hedges.
MARKET RISK MANAGEMENTMarket risk is the risk that changes in market prices, such as foreign exchange rates, interest rates and equity prices will affect the Group’s income or the value of its holdings of financial instruments.
MARKET RISK – FOREIGN CURRENCY RISKThe Group has no exposure to foreign currency risk as all the Group’s trading transactions and its assets and liabilities are denominated in Sterling.
MARKET RISK – INTEREST RATE RISKOther than cash, the Group had no interest-bearing financial instruments. Cash is held in an interest-bearing current account which has a floating rate and is therefore exposed to changes in market interest rate. The Group monitors market interest rates to ensure that the return on the cash balance is maximised.
MARKET RISK – EQUITY PRICE RISKThe Group has no equity investments and therefore has no exposure to equity price risk.
CAPITAL RISK MANAGEMENTThe Group defines capital as total equity. The Group’s objectives when managing capital are to safeguard its ability to continue as a going concern in order to provide returns for shareholders and benefits for other stakeholders and to maintain a capital structure which optimises the cost of capital. In order to maintain or adjust the capital structure, the Group may adjust the amount of dividends paid to shareholders, return capital to shareholders or issue new shares.
27. OPERATING LEASESNon-cancellable operating lease rentals are payable as follows:
Land and buildings Other operating leases
2015 2014 2015 2014£’000 £’000 £’000 £’000
Less than one year 246 173 85 80
Between one and five years 64 216 141 129
310 389 226 209
Operating lease rentals relate to property rents and short-term plant hire.
FINANCIAL STATEMENTS
Fulcrum Utility Services LimitedAnnual Report and Accounts 201548
Notes to the consolidated financial statements continued
28. RELATED PARTIES
KEY MANAGEMENT COMPENSATIONThe key management group is defined as the Board of Directors. Their compensation amounted to £491,000 (2014: £775,000) for the period as follows:
Year ended 31 March 2015
Year ended 31 March 2014
£’000 £’000
Short-term employee benefits 434 734
Share related awards 57 41
491 775
TRANSACTIONS WITH OTHER RELATED PARTIESMarwyn Capital LLP and Marwyn Management Partners LP are considered to be related parties as Mark Watts is a managing partner of both of these organisations, as well as being a Non-executive Director of the Group until his resignation on 3 June 2014.
The Group paid Marwyn Capital LLP a fee of £44,000 (2014: £135,000) for the year pursuant with the corporate finance advisory agreement which was ended during the year. An amount of £nil (2014: £21,000) was owed to Marwyn Capital LLP at 31 March 2015.
The Group entered into an agreement with Marwyn Management Partners LP under which Marwyn Management Partners LP was granted an option to subscribe for ordinary shares subject to growth and vesting conditions being met. Under this agreement, the value of this benefit has been recognised as £nil (2014: £74,000) in the period.
All of the transactions above have been entered into on arm’s length commercial terms, are unsecured, are expected to be settled in cash and are not covered by any guarantee.
There were no amounts due from related parties on any trading accounts at 31 March 2015.
Advisers
Group trading companies
NOMINATED ADVISER AND BROKERCENKOS SECURITIES PLC6-8 Tokenhouse YardLondonEC2R 7AS
FINANCIAL PR ADVISERCAPITAL MARKET COMMUNICATIONS (CAMARCO) LIMITED107 CheapsideLondonEC2V 6DN
AUDITORKPMG LLP1 The EmbankmentNeville StreetLeedsLS1 4DW
SOLICITORS TO THE COMPANY AS TO ENGLISH LAWWEIGHTMANS LLP100 Old Hall StreetLiverpoolL3 9QJ
SOLICITORS TO THE COMPANY AS TO CAYMAN ISLANDS LAWMAPLES AND CALDERLevel 11200 Aldersgate StreetLondonEC1A 4HD
REGISTRARSCAPITA REGISTRARS (GUERNSEY) LIMITEDLonque Hougue HouseSt. SampsonGuernseyGY2 4JNChannel Islands
BANKERSLLOYDS BANKING GROUP1st Floor14 Church StreetSheffieldS1 1HP
UTILITY INFRASTRUCTURE PROVIDER (UIP)Fulcrum Infrastructure Services Limited
INDEPENDENT GAS TRANSPORTER (IGT)Fulcrum Pipelines Limited
GROUP SHARED SERVICE PROVIDERFulcrum Group Holdings Limited

Fulcru
m U
tility Services Lim
ited A
nn
ual R
epo
rt and
Acco
un
ts 2015
FULCRUM2 Europa View Sheffield Business Park Sheffield South Yorkshire S9 1XH
Tel: 03330 146 466 Email: [email protected]
Websites: www.fulcrum.co.uk www.fulcrumutilityserviceslimited.co.uk www.firstgasconnections.co.uk