fugro seacore; airlift pump modelling proposal
TRANSCRIPT

University of Plymouth
PEARL https://pearl.plymouth.ac.uk
The Plymouth Student Scientist - Volume 09 - 2016 The Plymouth Student Scientist - Volume 9, No. 2 - 2016
2016
Fugro Seacore: airlift pump modelling
proposal
Hobson, M.
Hobson, M. (2016) 'Fugro Seacore: airlift pump modelling proposal', The Plymouth Student
Scientist, 9(2), p. 95-122.
http://hdl.handle.net/10026.1/14130
The Plymouth Student Scientist
University of Plymouth
All content in PEARL is protected by copyright law. Author manuscripts are made available in accordance with
publisher policies. Please cite only the published version using the details provided on the item record or
document. In the absence of an open licence (e.g. Creative Commons), permissions for further reuse of content
should be sought from the publisher or author.

The Plymouth Student Scientist, 2016, 9, (2), 95-122
[95]
Fugro Seacore; airlift pump modelling
proposal
Matthew Hobson
Project Advisor: Daniel Hatton, School of Marine Science and Engineering, Plymouth
University, Drake Circus, Plymouth, PL4 8AA, UK
Abstract This paper reviews options available to Fugro Seacore (fugro), an over water drilling contractor, for predicting the operability of Airlift pumps. This is a particular problem during projects conducted from Jack-Up Barges in areas with large tidal ranges. By reviewing literature and attempting to construct both mathematical and computational fluid dynamic (CFD) models it is concluded that CFD is too complex for the speed of calculation Fugro require when tendering for projects. In literature a mathematical model is found; however, further work will be needed to ensure this can be applied to Fugro’s large scale pumps. This is because while Fugro operate in water considered shallow in the offshore industry, the depth of the pump means that the pressure range over its height is far greater than which can be replicated in a laboratory where experimental data for the model has been generated.

The Plymouth Student Scientist, 2016, 9, (2), 95-122
[96]
Nomenclature
Symbol Definition
Cd Drag Coefficient
D Riser Diameter
H Riser Height
H/L Submergence Ratio
L Vertical Distance From Air Inlet to Water Level
P Pressure
Qg Gas Volume Flow Rate
Ql Liquid Volume Flow Rate
R Gas Constant
S Slip Ratio
T Temperature
V Volume
g Gravitational Constant
m Moller Mass
y Vertical Distance to Domain Origin
∆t Time Step
ε Surface Roughness
μ Dynamic Viscosity
ρ Density
Abbreviations
ANSYS CFX Computational Fluid Dynamics Software
CEL CFX Expression Language
CFD Computational Fluid Dynamics
DNS Direct Numerical Simulation
Eq Equation
K-ϵ Turbulence Model for Free Flow Regions (ANSYS, 2012a)
K-ω Turbulence Model for Near Boundary Regions (ANSYS, 2012a)
LES Large Eddy Simulation
LitXXXX Literature Identification Format
MUSIG Turbulence Model
NRS Nuclear Reactor Safety
RANS Reynold Averaged Navier Stokes
REV Revision
SI units Standard International Units
SST Shear Stress Transport Turbulence Model
TYP Typical
Yalt Vertical Distance From the Domain Origin to Water Level
3D Three Dimensional

The Plymouth Student Scientist, 2016, 9, (2), 95-122
[97]
1. Project Definition This section explains the project reasoning for research, relating the project aims and objectives to industry.
1.1 What are Airlift pumps Airlift pumps lift particles within liquid. Compressed air is injected into the riser base forming bubbles. These bubbles travel up the riser carrying liquid due to interfacial friction (Pougatch & Salcudean, 2008). As more air travels up the riser, the pressure becomes less than at the bottom of the pipe. This pressure difference allows particles to be sucked into and then lifted up the riser (Reinemann, et al., 1990) (Pougatch & Salcudean, 2008). Airlift pumps key characteristics are reliability, low maintenance and the ability to pump particles within the water (Kassaba, et al., 2009). Fugro use Airlift Pumps to remove drill cuttings from the seabed created during; seabed mining, bridge construction and site surveys. Stenning and Martin in 1968 state; Airlift pumps are used for underwater geotechnical surveys by raising particles to the surface (Tighzert, et al., 2013). Figure 1 shows a basic Airlift pump with key dimensions labelled.
Figure 1: Basic Airlift Pump With Labels
Injected air travels up the riser from the base due to it being less dense than the liquid. This lowers the density of the liquid and air now in the riser (Hanafizadeh, et al., 2011). When the pressure conditions in Figure 2 are met cuttings are dragged into the riser’s lower entrance by the pressure difference. This allows them to be lifted up the riser (Reinemann, et al., 1990). The pressure difference caused by a less dense object creating uplift is discussed by (Kinsky, 1982). This was used when producing Figure 2. Later Figure 3 will show that from Jack Up Barges total height remains constant while the submergence ratio varies with tide changing P4.

The Plymouth Student Scientist, 2016, 9, (2), 95-122
[98]
Figure 2: Airlift Pumps Create Pressure Difference
1.2 Who are Fugro GeoServices Seacore, now Fugro GeoServices, are a geotechnical survey company specializing in overwater drilling and marine construction, established over 35 years ago (Fugro, 2015b) (AquaMarine Power, 2014). They drill holes into the sea ranging from 15 cm to 6 m in diameter with rotating drill heads. The cuttings created have to be removed by Airlift pumps in protected areas. Fugro drill holes for the following reasons and more:
1.2.1 Near Shore Site Surveys and Construction This covers any shallow water construction project. For projects ranging from bridges to harbours, pipelines, wind farms and submerged roadways. Holes are drilled in the seabed to survey geology and then to create suitable foundations for construction. For example Fugro have recently conducted a site survey for the 18 km long Fehmarn belt project; a submerged road and railway between Germany and Denmark (Maclean, 2015) (Fugro, 2015f).
1.2.2 Seabed Mining Drilling may also be required to locate and extract resources such as oil, gas and minerals. Extracting these resources requires larger platforms needing site surveys and foundations. In 2007 Seacore was acquired by Fugro specializing in geotechnical, surveys, subsea and, geosciences services (Fugro, 2015a) but still carry out the same work. Fugro GeoServices conduct a large amount of this work from jack-up barges.
These vessels are the most popular type of drilling platform globally (Rigzone.com, 2015) making this a common problem. The barge floats onto location before jacking up so that the hull is fully out of the water. The legs support all of the barges weight
The Plymouth Student Scientist, 2016, 9, (2), 95-122
[99]
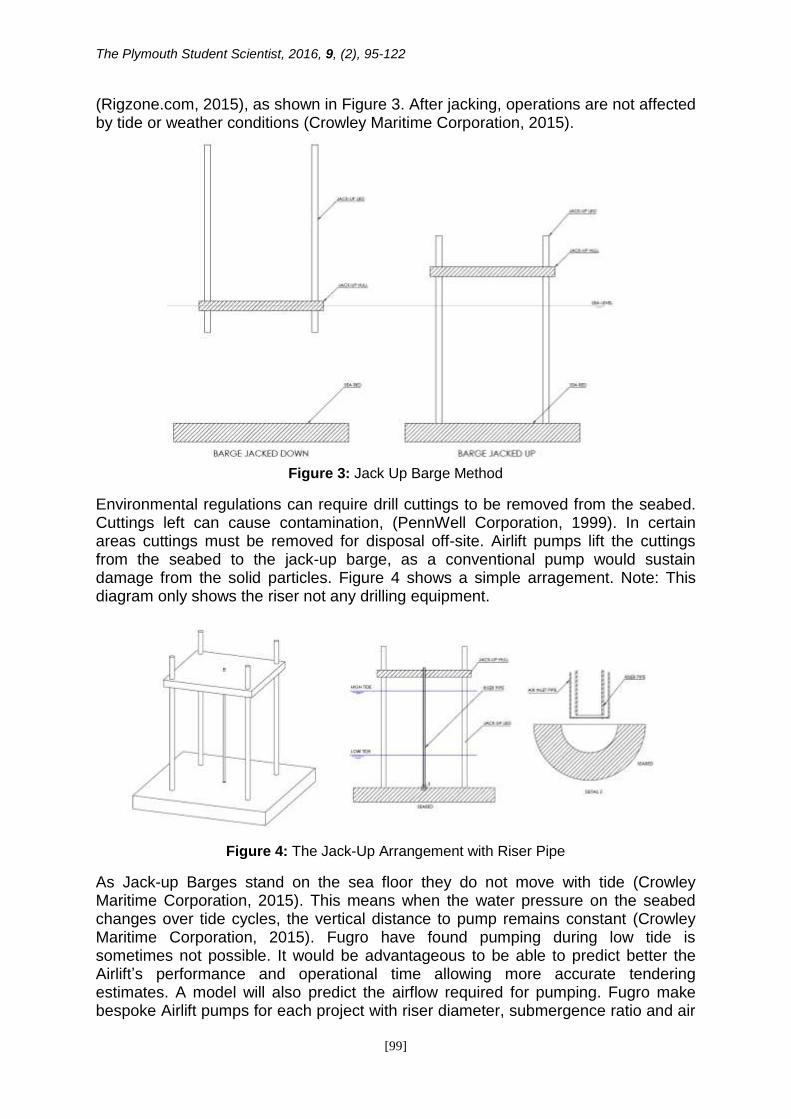
(Rigzone.com, 2015), as shown in Figure 3. After jacking, operations are not affected by tide or weather conditions (Crowley Maritime Corporation, 2015).
Figure 3: Jack Up Barge Method
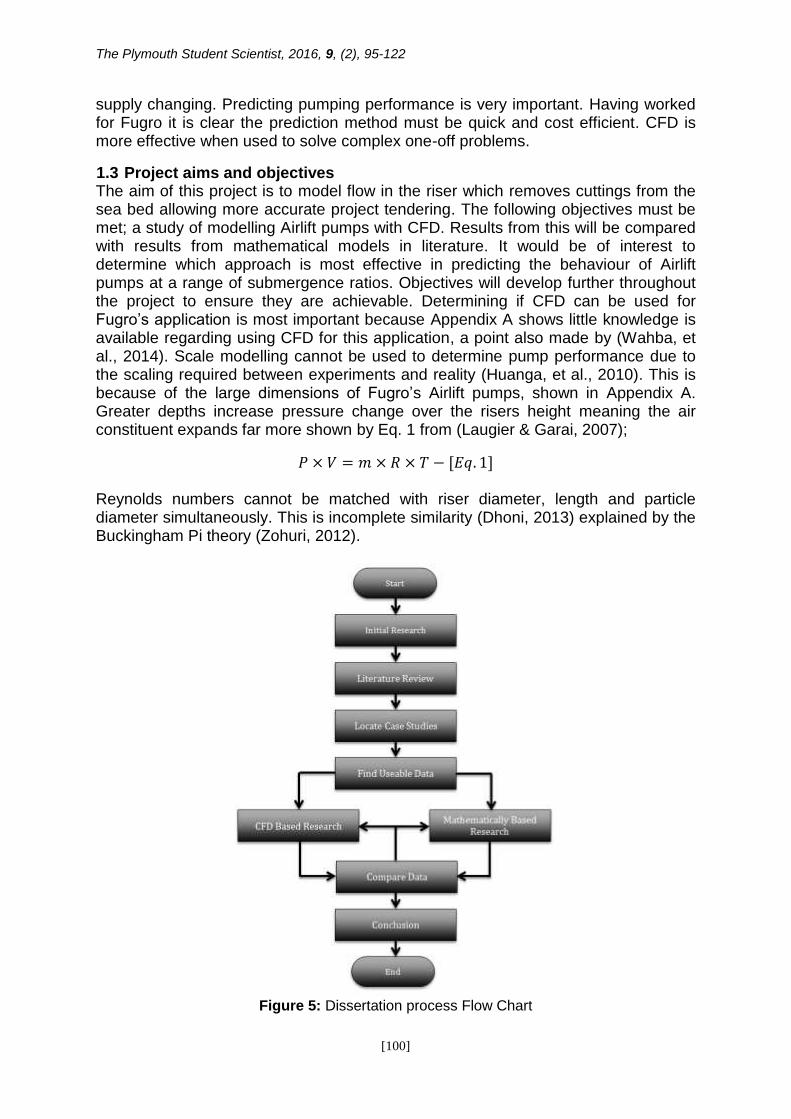
Environmental regulations can require drill cuttings to be removed from the seabed. Cuttings left can cause contamination, (PennWell Corporation, 1999). In certain areas cuttings must be removed for disposal off-site. Airlift pumps lift the cuttings from the seabed to the jack-up barge, as a conventional pump would sustain damage from the solid particles. Figure 4 shows a simple arragement. Note: This diagram only shows the riser not any drilling equipment.
Figure 4: The Jack-Up Arrangement with Riser Pipe
As Jack-up Barges stand on the sea floor they do not move with tide (Crowley Maritime Corporation, 2015). This means when the water pressure on the seabed changes over tide cycles, the vertical distance to pump remains constant (Crowley Maritime Corporation, 2015). Fugro have found pumping during low tide is sometimes not possible. It would be advantageous to be able to predict better the Airlift’s performance and operational time allowing more accurate tendering estimates. A model will also predict the airflow required for pumping. Fugro make bespoke Airlift pumps for each project with riser diameter, submergence ratio and air
The Plymouth Student Scientist, 2016, 9, (2), 95-122
[100]
supply changing. Predicting pumping performance is very important. Having worked for Fugro it is clear the prediction method must be quick and cost efficient. CFD is more effective when used to solve complex one-off problems.
1.3 Project aims and objectives The aim of this project is to model flow in the riser which removes cuttings from the sea bed allowing more accurate project tendering. The following objectives must be met; a study of modelling Airlift pumps with CFD. Results from this will be compared with results from mathematical models in literature. It would be of interest to determine which approach is most effective in predicting the behaviour of Airlift pumps at a range of submergence ratios. Objectives will develop further throughout the project to ensure they are achievable. Determining if CFD can be used for Fugro’s application is most important because Appendix A shows little knowledge is available regarding using CFD for this application, a point also made by (Wahba, et al., 2014). Scale modelling cannot be used to determine pump performance due to the scaling required between experiments and reality (Huanga, et al., 2010). This is because of the large dimensions of Fugro’s Airlift pumps, shown in Appendix A. Greater depths increase pressure change over the risers height meaning the air constituent expands far more shown by Eq. 1 from (Laugier & Garai, 2007);
𝑃 × 𝑉 = 𝑚 × 𝑅 × 𝑇 − [𝐸𝑞. 1]
Reynolds numbers cannot be matched with riser diameter, length and particle diameter simultaneously. This is incomplete similarity (Dhoni, 2013) explained by the Buckingham Pi theory (Zohuri, 2012).
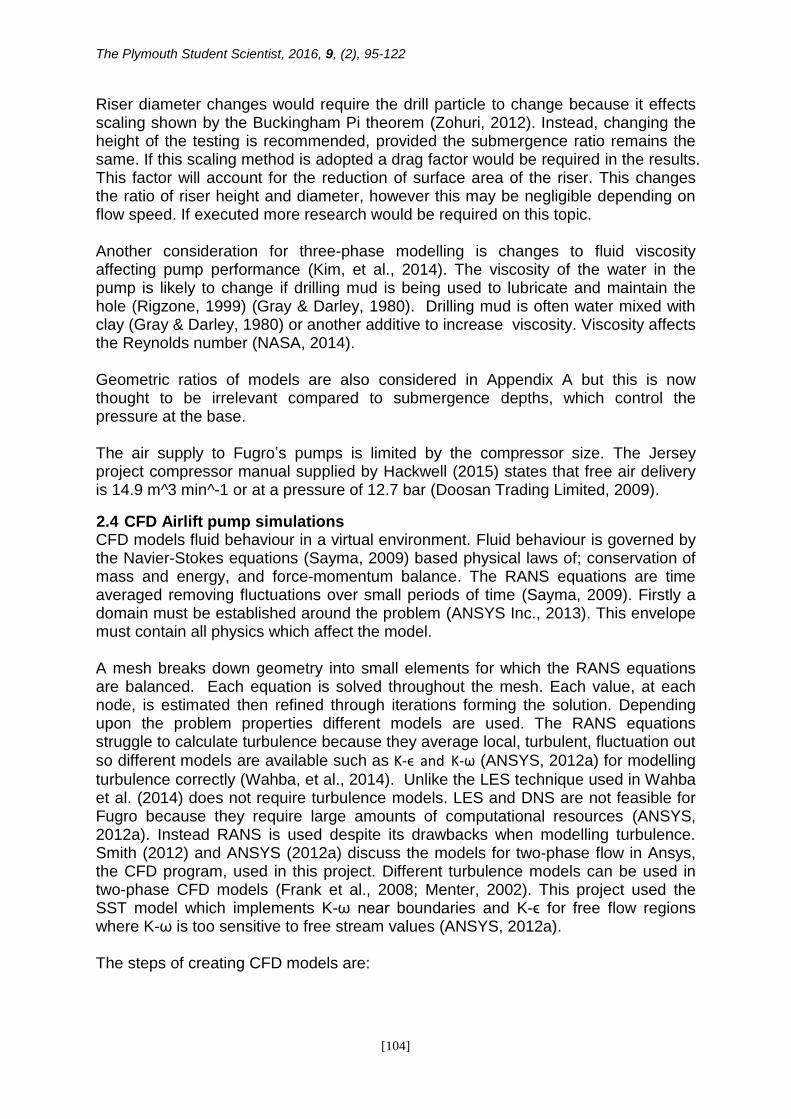
Figure 5: Dissertation process Flow Chart

The Plymouth Student Scientist, 2016, 9, (2), 95-122
[101]
Figure 5 shows the planned process for the report. Any data will only determine if CFD or formula are the most effective method for predicting Airlift behaviour. This means data used can be less accurate than if required to conduct full validation. Firm data analysis is of vital importance for CFD (Tayebi, et al., 2007). Best practice is to use physically similar (Menter, 2002), (Frank, et al., 2008) (SAS IP, 2013) and (Wahba, et al., 2014). For this reason a CFD model will be constructed to mimic (Stenning & Martin, 1968)’s experiments with results compared for validation. Should this prove successful, the model will be geometrically changed to represent a Fugro pump. Studying modelling for Fugro’s specific requirements makes the project unique. CFD is studied as it is a rapidly developing tool for which little work on modelling Airlift pumps for simple predictions has been undertaken.
2. Review of literature In considering the dissertation aims this section is separated into three topic areas. This helps to; identify current knowledge, locate mathematical and CFD models to base the project on.
2.1 Airlift two-phase pumps Two-phase flow focuses on; pumps comprising only water and air, the factors related to pressure sizes shown in Figure 2 must be understood allowing theoretical models for the pump to be produced. The early models consider buoyancy force of air to be the driving factor taking into account riser diameter, the air/water ratio and submergence ratio of the riser (Wahba, et al., 2014). Due to these models being simple it is proposed to use one to verify the CFD results during testing. It is proposed to use Stenning and Martin’s model. This one dimensional model was developed from results of physical tests (Stenning & Martin, 1968) and is referenced in many works since (Wahba, et al., 2014; Kassaba, et al., 2009). The experiment used a riser with a height of 168 inches and diameter of 1 inch (Stenning & Martin, 1968). Using Bernoulli’s equation to calculate pressures, the equation in equation 17 of Stenning & Martin (1968), was derived from the results. As this formula is in forty three peer-reviewed journals and further research has been based on it, e.g. Wahba, et al., (2014), it is felt the model can be trusted.
More complete, specific, models have since been developed for scenarios. For example, Reinemann et al. (1990) work on surface tension effects, which govern pumps with small diameter risers (Wahba, et al., 2014). This research physically tests pumps of 3 to 25 mm diameter finding that in riser diameters less than 20 mm the bubble rises more slowly due to surface tension. This is another reason that laboratory scale experiments cannot be used to predict the performance of larger Airlift pumps. Capillary numbers (Sadooni & Ebrahimi, 2012) would also have to be matched; this is mentioned in Jamaloeia et al. (2012). Both papers show that scaling is important to gain trustworthy results. Fan et al. (2013) show that riser diameters and inlet geometry must be considered in investigations of efficiency. Increasing riser diameter reduces contact area and

The Plymouth Student Scientist, 2016, 9, (2), 95-122
[102]
therefore friction for the same volumetric flow rate. This highlights issues with comparing different pumps. Despite this, Reinemann et al. (1990) could still be used to validate the CFD using physical test results. Submergence ratios change during the tide. For two-phase pumping this is investigated physically by Kassaba et al. (2009), who improve on the Stenning and Martin Model, finding a more accurate slip ratio equation (Wahba, et al., 2014). The efficiency of airlift pumping increases up to submergence ratios of 75% (Tighzert, et al., 2013). This research used experimental testing of a 3.1 m riser of33 mm diameter. The article also considered effects of the fraction of air in the riser, in relation to efficiency which changed more over risers with greater submergence (Eq. 1 from Laugier & Garai (2007). The air volume determines if slugging of bubbles occur (Tighzert, et al., 2013). This paper corroborates Rienemann et al’s work.
2.2 Airlift three-phase pumps Despite large amounts of research on two-phase Airlift pumps, a further complexity is added when considering three-phase flow. The third phase is solids traveling up the riser (Fujimoto, et al., 2004). Fujimoto et al. (2004) investigates the effects of bends in the riser. Different sized aluminium balls are lifted making the experiment three-phase (Yoshinaga & Sato, 1996). When air is injected after the bend, the bend has little effect on pumping. Only increased wall frication due to increased wall length is noticed despite the same riser height (Fujimoto, et al., 2004). This flow is described as almost entirely turbid.
Research on how the flow is modelled is of more use than studies determining if a factor affects Airlift pumps. Also of importance is when the pumping starts, T.Yoshinaga and Y.Sato considered this when studying Airlift pumps’ potential for extracting manganese from deep-sea mines (Yoshinaga & Sato, 1996). These experiments tested spherical uniform and non-uniform particles while systematically changing the submergence ratio (Yoshinaga & Sato, 1996). Results show strong relations between flow rate, the size of particles discharged and the amount of air supplied as suggested earlier by Stenning & Martin (1968).
Lung Cheng et al also research the use of risers of varying diameter with a height of 250 cm and changing submergence ratios (Cheng, et al., 1997). Although specialized to three-phase internal loop reactors, it does show theoretical formulas can be used to determine the characteristics of an Airlift pump.
Pumping rates are affected by particle’s size and form (Mahrous, 2012). Mahrous investigates findings of other research papers concluding larger diameter particles have a detrimental effect on pump performance. The possibility of treating two and three-phase pumps as homogenous mixtures, akin to Boës et al’s findings, is referenced by Mahrous (2012). Yoshinaga et al.’s work commented on showing a reduction of gas and liquid phase speeds during decreasing submergence ratio. Problematic questions, arise for this research when it is considered that drilling creates large varieties of solid particle shapes and sizes, all of which, require different flow rates to lift. This suggests only creating a useable two-phase CFD

The Plymouth Student Scientist, 2016, 9, (2), 95-122
[103]
model will be possible with coefficients added from further tests accounting for particle sizes.
2.3 Airlift Fugro GeoServices case study Many factors affect Airlift systems making it essential that simulations are designed to relate closely to the problem in-hand. It may be possible to use data from Fugro to validate the CFD model as no model currently exists to predict this Airlift scenario. Fugro GeoServices were asked for drawings of a real Airlift project. Using engineering drawings ensures the geometry is accurate for the Airlift pump. As part of Hackwell (2015), Fugro provided a diagram which shows the information Fugro have when planning a project. This must be the only required inputs to any prediction model (discussed in Appendix H). Figure 6 shows how submergence changed with depth drilled.
Figure 6: Submergence Ratio Vs Hole Depth calculated from Hackwell’s (2015) data
This case shows the problem which the model should predict. There is little point in experimenting with submergence ratios higher or lower than this because Fugro is only interested in predicting submergence ratios that the pump will stop working at. Therefore the model must only be verified to work immediately around the point at which pumping stops working. This simplifies requirements by reducing the range of physics it will have to cope with. Dimensions which can change are identified to simplify testing. It is decided because of a potential change in airflow characteristics; from bubbles to slug flow, when reducing the pipe diameter (Reinemann, et al., 1990), Physical and model diameters should be kept the same. Frank et al. (2005) state that the type of flow is dictated by the gaseous phase changing from bubbly, slug, churn turbulent, annular, and finally droplet flow as air volume is increased. This is also increased by large pressure changes (Appendix H).
Figure 7 of Kim et al. (2014) shows different bubble patterns from gas void fractions due to gas flow rate (Frank, et al., 2005). Very high gas fractions shown in risers C and D are not suitable for three-phase flow because liquid flow is too small to suck particles into the riser.
The Plymouth Student Scientist, 2016, 9, (2), 95-122
[104]
Riser diameter changes would require the drill particle to change because it effects scaling shown by the Buckingham Pi theorem (Zohuri, 2012). Instead, changing the height of the testing is recommended, provided the submergence ratio remains the same. If this scaling method is adopted a drag factor would be required in the results. This factor will account for the reduction of surface area of the riser. This changes the ratio of riser height and diameter, however this may be negligible depending on flow speed. If executed more research would be required on this topic. Another consideration for three-phase modelling is changes to fluid viscosity affecting pump performance (Kim, et al., 2014). The viscosity of the water in the pump is likely to change if drilling mud is being used to lubricate and maintain the hole (Rigzone, 1999) (Gray & Darley, 1980). Drilling mud is often water mixed with clay (Gray & Darley, 1980) or another additive to increase viscosity. Viscosity affects the Reynolds number (NASA, 2014). Geometric ratios of models are also considered in Appendix A but this is now thought to be irrelevant compared to submergence depths, which control the pressure at the base. The air supply to Fugro’s pumps is limited by the compressor size. The Jersey project compressor manual supplied by Hackwell (2015) states that free air delivery is 14.9 m^3 min^-1 or at a pressure of 12.7 bar (Doosan Trading Limited, 2009).
2.4 CFD Airlift pump simulations CFD models fluid behaviour in a virtual environment. Fluid behaviour is governed by the Navier-Stokes equations (Sayma, 2009) based physical laws of; conservation of mass and energy, and force-momentum balance. The RANS equations are time averaged removing fluctuations over small periods of time (Sayma, 2009). Firstly a domain must be established around the problem (ANSYS Inc., 2013). This envelope must contain all physics which affect the model. A mesh breaks down geometry into small elements for which the RANS equations are balanced. Each equation is solved throughout the mesh. Each value, at each node, is estimated then refined through iterations forming the solution. Depending upon the problem properties different models are used. The RANS equations struggle to calculate turbulence because they average local, turbulent, fluctuation out
so different models are available such as K-ϵ and K-ω (ANSYS, 2012a) for modelling
turbulence correctly (Wahba, et al., 2014). Unlike the LES technique used in Wahba et al. (2014) does not require turbulence models. LES and DNS are not feasible for Fugro because they require large amounts of computational resources (ANSYS, 2012a). Instead RANS is used despite its drawbacks when modelling turbulence. Smith (2012) and ANSYS (2012a) discuss the models for two-phase flow in Ansys, the CFD program, used in this project. Different turbulence models can be used in two-phase CFD models (Frank et al., 2008; Menter, 2002). This project used the SST model which implements K-ω near boundaries and K-ϵ for free flow regions where K-ω is too sensitive to free stream values (ANSYS, 2012a). The steps of creating CFD models are:

The Plymouth Student Scientist, 2016, 9, (2), 95-122
[105]
These steps are not fixed (Appendix C). Setup changes throughout Appendix C improve model accuracy, shown in Appendix G. Once physically correct independence studies, mentioned by SAS IP (2013), can be executed before model validation using experimental data (Menter, 2002), (Frank, et al., 2008) (SAS IP, 2013). This is found not to be possible due to the computational resources available. Wahba et al. (2014) and Huanga et al. (2010) show validated CFD Airlift pump models. Validation best practice is discussed by Menter (2002), Frank et al. (2008) and SAS IP (2013) stating experimental results from tests of similar physical properties are used. CFD is used for complex projects, like Kelly et al. (2016), predicting fight deck airflow of the Queen Elizabeth Class aircraft carriers. This airflow informs flight simulators allowing virtual landings on the aircraft carriers. This is a far more computationally expensive project than the Airlift proposal however it is viable due to long lead times and financial benefit on the work. Fugro’s proposed application of CFD is not similar. Two-phase capable models are explained by Smith (2012) and ANSYS Inc. (2013) suggesting either the Mixture or Eulerian model. The Eulerian model predicts velocity
The Plymouth Student Scientist, 2016, 9, (2), 95-122
[106]
for each phase whereas the Mixture model calculates average flow before adjusting this to find flows for each phase, shown by formulae in Smith (2012). Riser dimensions in Appendix B form domain geometry. For accurate modelling areas around the inlets, outlets and openings are added in Appendix B ensuring flows in the riser are not controlled by opening constraints; it is bad practice to impose conditions which constrain flow patterns. Extending these areas ensure physics around openings are close to reality. The problem is two-phases meaning transient runs must be used (ANSYS, 2012b). Unlike steady state runs, which locate balanced solutions, transient runs differ over time (ANSYS Inc., 2013). This is achieved by solving the model for every time step (ANSYS, 2012b). Steady state models cannot achieve convergence on an Airlift pump, because flow is never steady due to its two-phase composition. The results of steady state flows are often used as initial values for transient runs (ANSYS, 2012b). This allows stable starting points for runs. Stenning & Martin (1968) and Kassaba et al. (2009) use S to estimates bubble movement though liquid. This controls gas hold up, therefore pressure difference. Ansys requires a predicted of Cd for bubbles (ANSYS Inc., 2013) accounting for S. A main component of this is bubble size (Frank, et al., 2005), controlled by how easily bubbles are formed or broken, due to lateral forces on them (Frank, et al., 2005). Lateral forces increase with the presence of particles increases. Complexity is added as bubble volume increases as pressure decreases, shown by Eq.1 (Laugier & Garai, 2007) and Figure 2 of Tayebi et al. (2007). When mass flow rate is not specified at an outlet, the system is sensitive to the CFD’s initial guess (ANSYS Inc., 2013). To resolve this, initial conditions are implemented as shown in Appendix C.
3. Main Body of Research (Methodology) The models created will require validation. Here the techniques used to locate validation data are described. The reminder of this project focuses on two-phase flow, instead of more complex three-phase flow. From two-phase models the principles of all Airlift pumps can be understood (Kim, et al., 2014). Particulates carried in flow are difficult to model in CFD (Linfield & Murdry, 2008). This is split into the following sections;
5.1 Locating Raw Data for validation of mathematical and CFD models
5.2 Research driven by Literature equations
5.3 Research driven by CFD

The Plymouth Student Scientist, 2016, 9, (2), 95-122
[107]
3.1 Locating raw data for mathematical and CFD models
3.1.1 Data collection methodology
Figure 7: Raw Data Harvesting Process
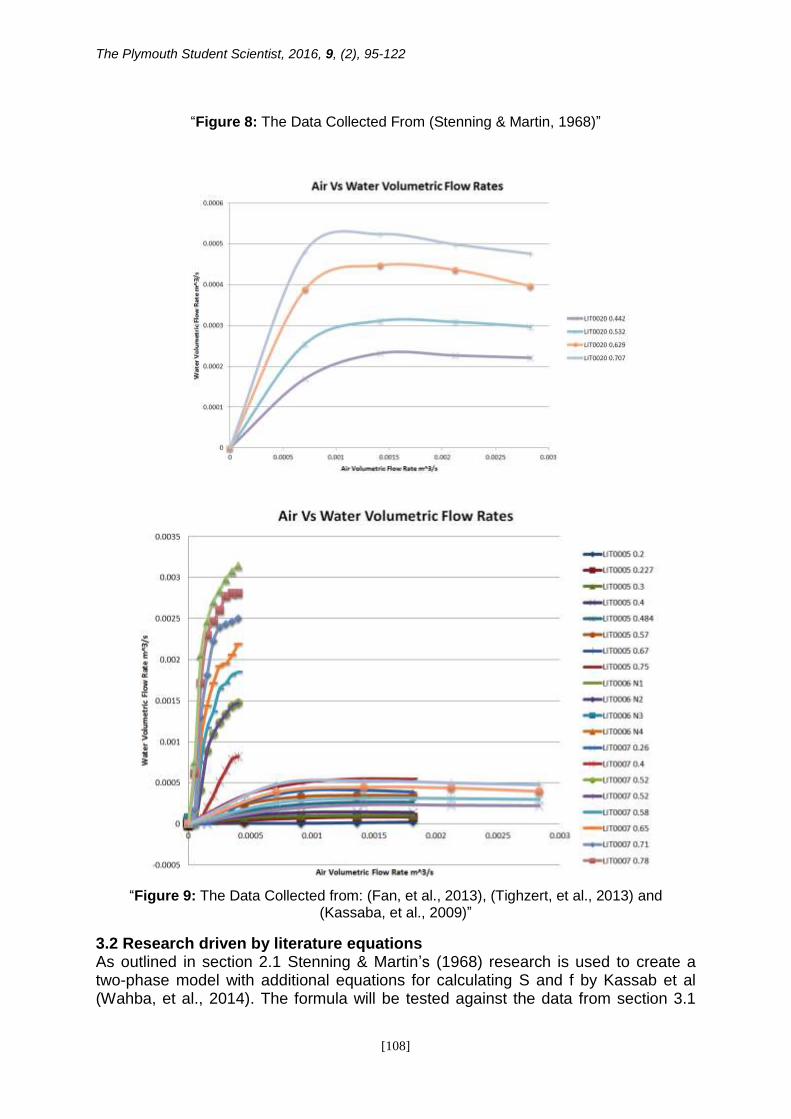
Figure 7 shows how raw data, to be used for validation, was collected. All validation data is taken from peer-reviewed literature ensuring that it is reliable. Dimensional ratios are considered in the interim report ensuring a range of these are considered. The data is tabulated by reading literature graphs. Reading errors are checked by putting the data back into graph form showing outlying data. This process is of limited accuracy but because it is only used to investigate if CFD can or cannot be used means that full validation accuracy is not required. Stenning & Martin’s (1968) experimental data is used for the testing. This allows results from both their mathematical model and experimental data to be compared directly to CFD results. Figure 8 shows this data with fully tabulated results, as seen in Appendix F, also containing calculations converting data to the units required by the CFD or mathematical model. Before errors associated with data extraction are considered it should be noted that the experimental data is only accurate to + or – 2% (Stenning & Martin, 1968). If further validation is required, results have been taken from Fan et al. (2013), Tighzert et al. (2013) and Kassaba et al. (2009). Model geometry will be changed to allow validation using these results. These have been chosen to broaden the dimensional range that the models have been tested on. Results are shown in Figure 9. From these the extended Tighzert et al. (2013) results can be seen to differ due to negative submergence ratios.
The Plymouth Student Scientist, 2016, 9, (2), 95-122
[108]
“Figure 8: The Data Collected From (Stenning & Martin, 1968)”
“Figure 9: The Data Collected from: (Fan, et al., 2013), (Tighzert, et al., 2013) and
(Kassaba, et al., 2009)”
3.2 Research driven by literature equations As outlined in section 2.1 Stenning & Martin’s (1968) research is used to create a two-phase model with additional equations for calculating S and f by Kassab et al (Wahba, et al., 2014). The formula will be tested against the data from section 3.1

The Plymouth Student Scientist, 2016, 9, (2), 95-122
[109]
ensuring the equation has been correctly implemented. Clarification of this section is available in Appendix H.
3.2.1 Literature driven research methodology The following steps are taken;
Figure 10: The steps for obtaining data
Firstly model inputs are considered. From Appendix C, H and J it is concluded the model will require;
Riser Height – Determined by jack-up height
Submergence Ratio – Determined by water depth
Riser Diameter – Determined by the drill
Riser Roughness – Found from the material of the riser
Liquid Density
Liquid Dynamic Viscosity
Both Stenning & Martin (1968) and Kassaba et al. (2009) use this model to good effect however it is stated that the model is only usable for small pressure changes due to the gas phase changing size. This distance can be found using Eq.1. Eq.2 shows this is not the case for Fugro’s submergence depths. This is shown in Appendix H.
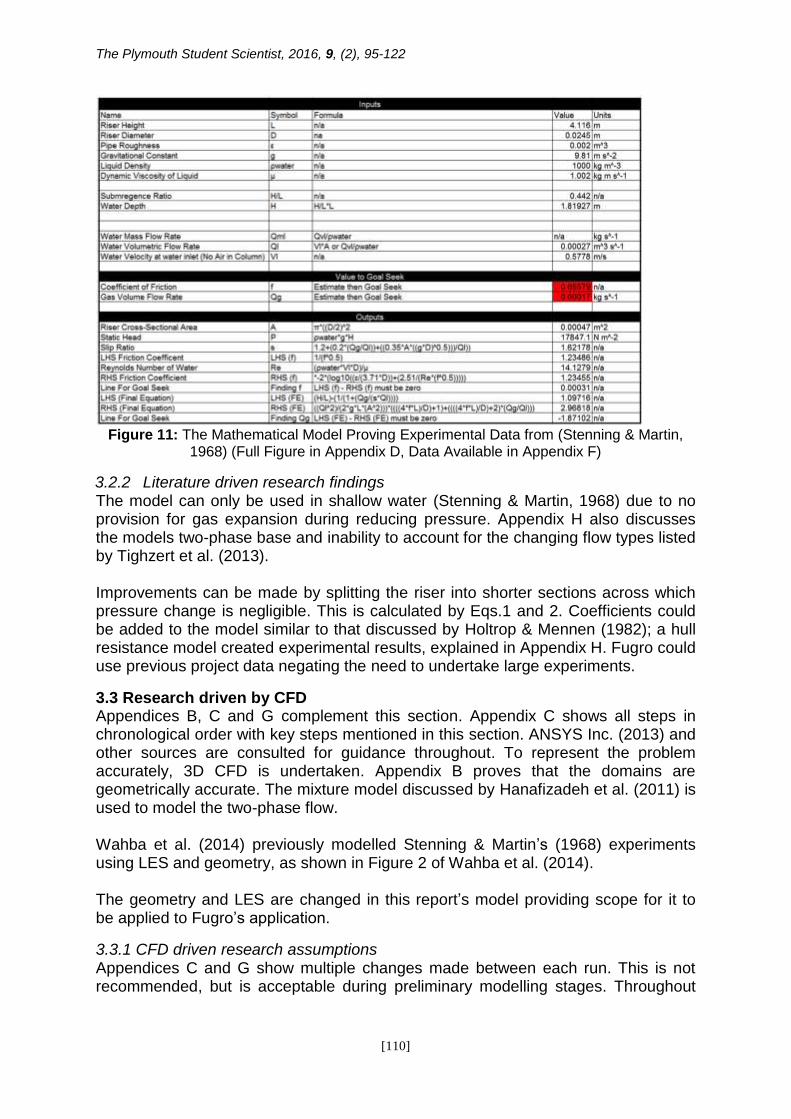
𝑃 = 𝜌𝑤𝑎𝑡𝑒𝑟 × 𝑔 × 𝐻 − [𝐸𝑞. 2] In Appendix H the model is constructed using the guide from Kassaba et al. (2009) adjusted to locating Qf not Ql. The Ql required can be pre-set as the minimum speed cuttings are drawn into the riser. f and Qg are found using goal seek with other steps solved parametrically. Figure 11 shows the model from Appendix H and D. As a test it has been populated with data from Appendix F returning the correct result.
The Plymouth Student Scientist, 2016, 9, (2), 95-122
[110]
Figure 11: The Mathematical Model Proving Experimental Data from (Stenning & Martin,
1968) (Full Figure in Appendix D, Data Available in Appendix F)
3.2.2 Literature driven research findings The model can only be used in shallow water (Stenning & Martin, 1968) due to no provision for gas expansion during reducing pressure. Appendix H also discusses the models two-phase base and inability to account for the changing flow types listed by Tighzert et al. (2013). Improvements can be made by splitting the riser into shorter sections across which pressure change is negligible. This is calculated by Eqs.1 and 2. Coefficients could be added to the model similar to that discussed by Holtrop & Mennen (1982); a hull resistance model created experimental results, explained in Appendix H. Fugro could use previous project data negating the need to undertake large experiments.
3.3 Research driven by CFD Appendices B, C and G complement this section. Appendix C shows all steps in chronological order with key steps mentioned in this section. ANSYS Inc. (2013) and other sources are consulted for guidance throughout. To represent the problem accurately, 3D CFD is undertaken. Appendix B proves that the domains are geometrically accurate. The mixture model discussed by Hanafizadeh et al. (2011) is used to model the two-phase flow. Wahba et al. (2014) previously modelled Stenning & Martin’s (1968) experiments using LES and geometry, as shown in Figure 2 of Wahba et al. (2014). The geometry and LES are changed in this report’s model providing scope for it to be applied to Fugro’s application.
3.3.1 CFD driven research assumptions Appendices C and G show multiple changes made between each run. This is not recommended, but is acceptable during preliminary modelling stages. Throughout

The Plymouth Student Scientist, 2016, 9, (2), 95-122
[111]
Appendix C assumptions are made. These are made where the model is not running as expected. The key assumptions from Appendix C:
Assumption 2 – Pipe openings cannot be controlled by boundary setting resulting in additional geometry,
Assumption 4 – Pressure must change with domain height,
Assumption 5 – The problem is transient,
Assumption 7 – Air should be changed to a compressible gas,
Assumption 8 – A smaller time step is needed increasing stability,
Assumption 12 – Airflow should increase gradually from a flow rate of 0 a known balanced flow point for validation.
3.3.1.1 Assumption 2 As stated in Appendix C, this leads to geometry revisions shown in Appendix B. Figure 12 shows the domain in 8ths with these additions. 8ths reduce the number of elements therefore computational resources required.
Figure 12: Diagram of the CFD Domain REV C for (Stenning & Martin, 1968) Testing
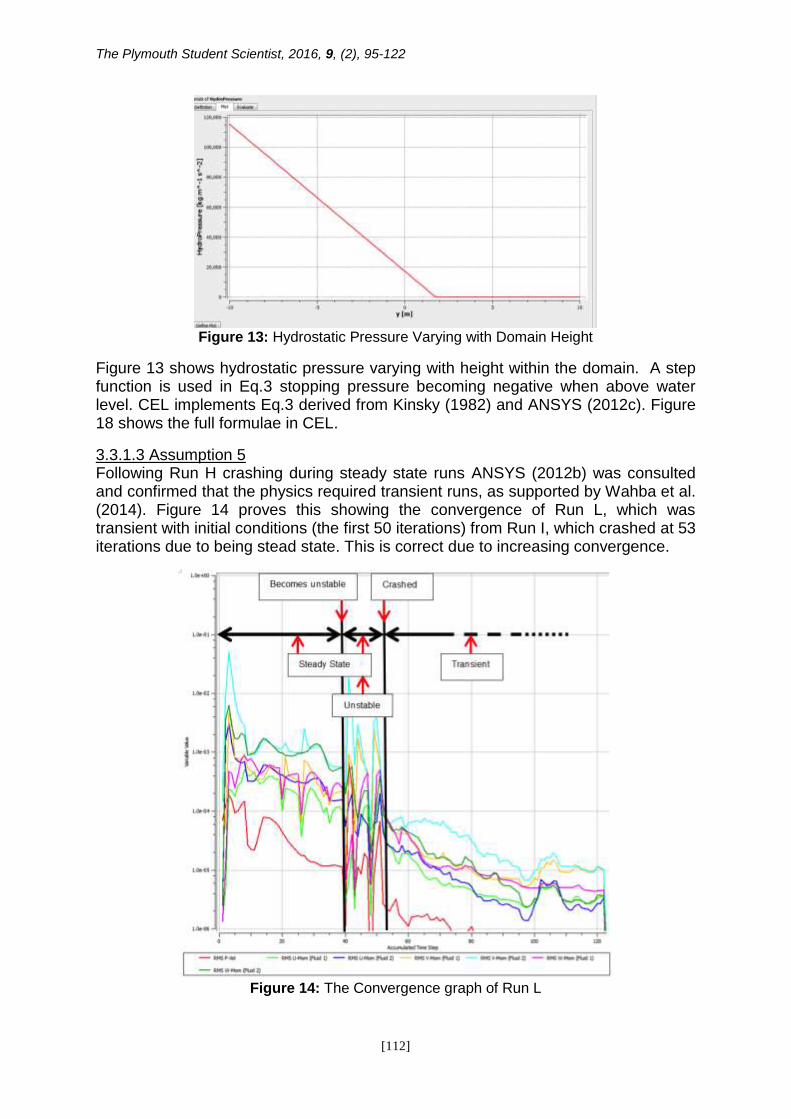
3.3.1.2 Assumption 4 From Kinsky (1982) pressure changes over water height is clear. Figure 2 shows how this affects Airlift pumps. Eq.3 demonstrates how this is applied.
𝐻𝑦𝑑𝑟𝑜 𝑆𝑡𝑎𝑡𝑖𝑐 𝑃𝑟𝑒𝑠𝑠𝑢𝑟𝑒 = 𝜌𝑤𝑎𝑡𝑒𝑟 × 𝑔 × (𝑌𝑎𝑙𝑡 − 𝑦) × 𝑆𝑡𝑒𝑝(𝑌𝑎𝑙𝑡 − 𝑦) − [𝐸𝑞. 3]
The Plymouth Student Scientist, 2016, 9, (2), 95-122
[112]
Figure 13: Hydrostatic Pressure Varying with Domain Height
Figure 13 shows hydrostatic pressure varying with height within the domain. A step function is used in Eq.3 stopping pressure becoming negative when above water level. CEL implements Eq.3 derived from Kinsky (1982) and ANSYS (2012c). Figure 18 shows the full formulae in CEL.
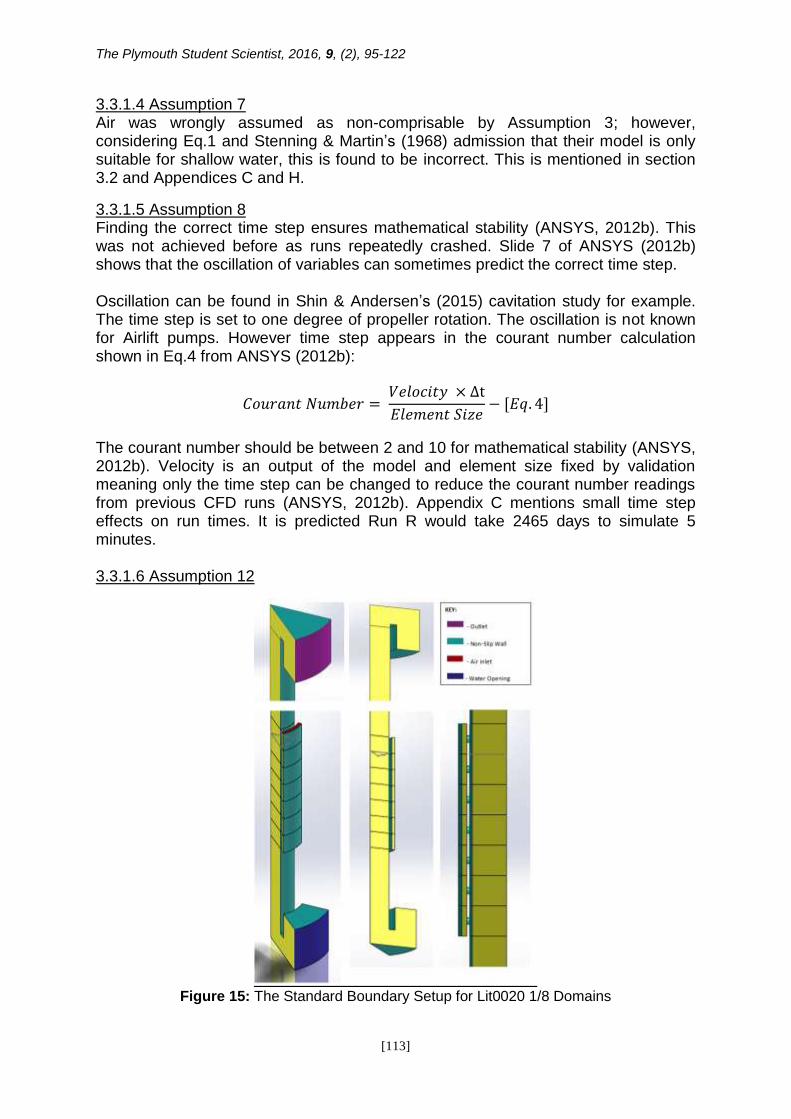
3.3.1.3 Assumption 5 Following Run H crashing during steady state runs ANSYS (2012b) was consulted and confirmed that the physics required transient runs, as supported by Wahba et al. (2014). Figure 14 proves this showing the convergence of Run L, which was transient with initial conditions (the first 50 iterations) from Run I, which crashed at 53 iterations due to being stead state. This is correct due to increasing convergence.
Figure 14: The Convergence graph of Run L
The Plymouth Student Scientist, 2016, 9, (2), 95-122
[113]
3.3.1.4 Assumption 7 Air was wrongly assumed as non-comprisable by Assumption 3; however, considering Eq.1 and Stenning & Martin’s (1968) admission that their model is only suitable for shallow water, this is found to be incorrect. This is mentioned in section 3.2 and Appendices C and H.
3.3.1.5 Assumption 8 Finding the correct time step ensures mathematical stability (ANSYS, 2012b). This was not achieved before as runs repeatedly crashed. Slide 7 of ANSYS (2012b) shows that the oscillation of variables can sometimes predict the correct time step. Oscillation can be found in Shin & Andersen’s (2015) cavitation study for example. The time step is set to one degree of propeller rotation. The oscillation is not known for Airlift pumps. However time step appears in the courant number calculation shown in Eq.4 from ANSYS (2012b):
𝐶𝑜𝑢𝑟𝑎𝑛𝑡 𝑁𝑢𝑚𝑏𝑒𝑟 = 𝑉𝑒𝑙𝑜𝑐𝑖𝑡𝑦 × ∆t
𝐸𝑙𝑒𝑚𝑒𝑛𝑡 𝑆𝑖𝑧𝑒− [𝐸𝑞. 4]
The courant number should be between 2 and 10 for mathematical stability (ANSYS, 2012b). Velocity is an output of the model and element size fixed by validation meaning only the time step can be changed to reduce the courant number readings from previous CFD runs (ANSYS, 2012b). Appendix C mentions small time step effects on run times. It is predicted Run R would take 2465 days to simulate 5 minutes. 3.3.1.6 Assumption 12
Figure 15: The Standard Boundary Setup for Lit0020 1/8 Domains
The Plymouth Student Scientist, 2016, 9, (2), 95-122
[114]
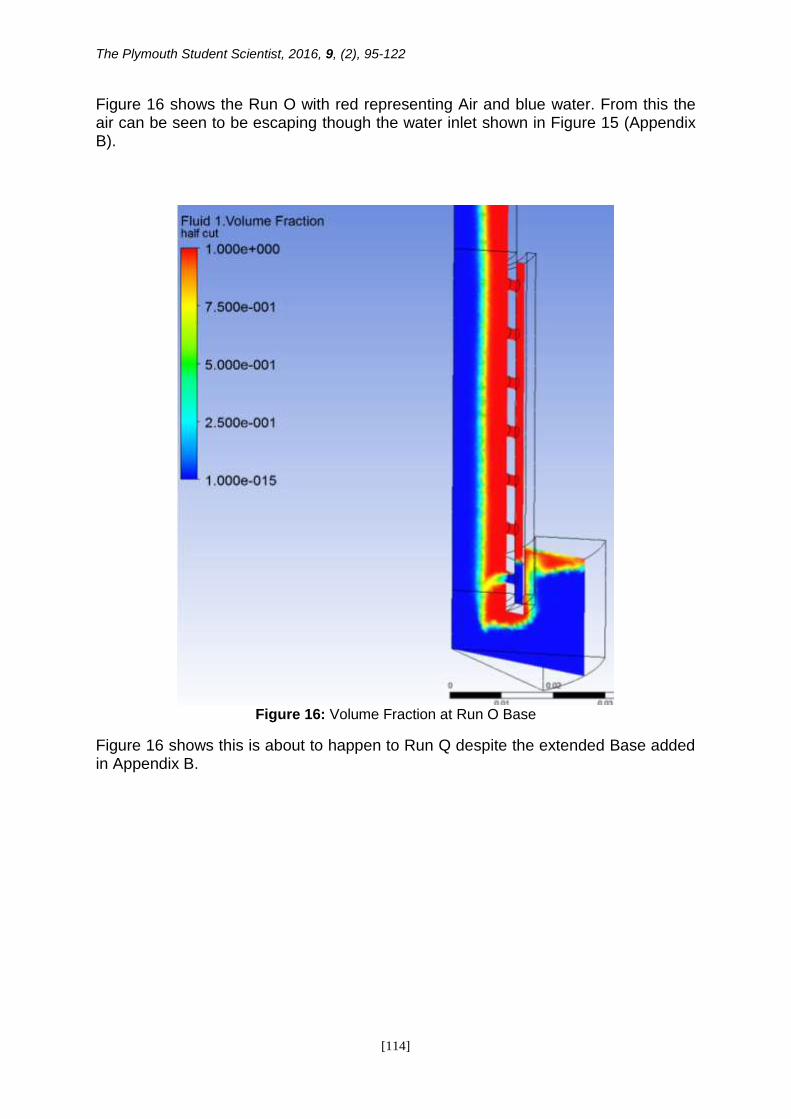
Figure 16 shows the Run O with red representing Air and blue water. From this the air can be seen to be escaping though the water inlet shown in Figure 15 (Appendix B).
Figure 16: Volume Fraction at Run O Base
Figure 16 shows this is about to happen to Run Q despite the extended Base added in Appendix B.
The Plymouth Student Scientist, 2016, 9, (2), 95-122
[115]
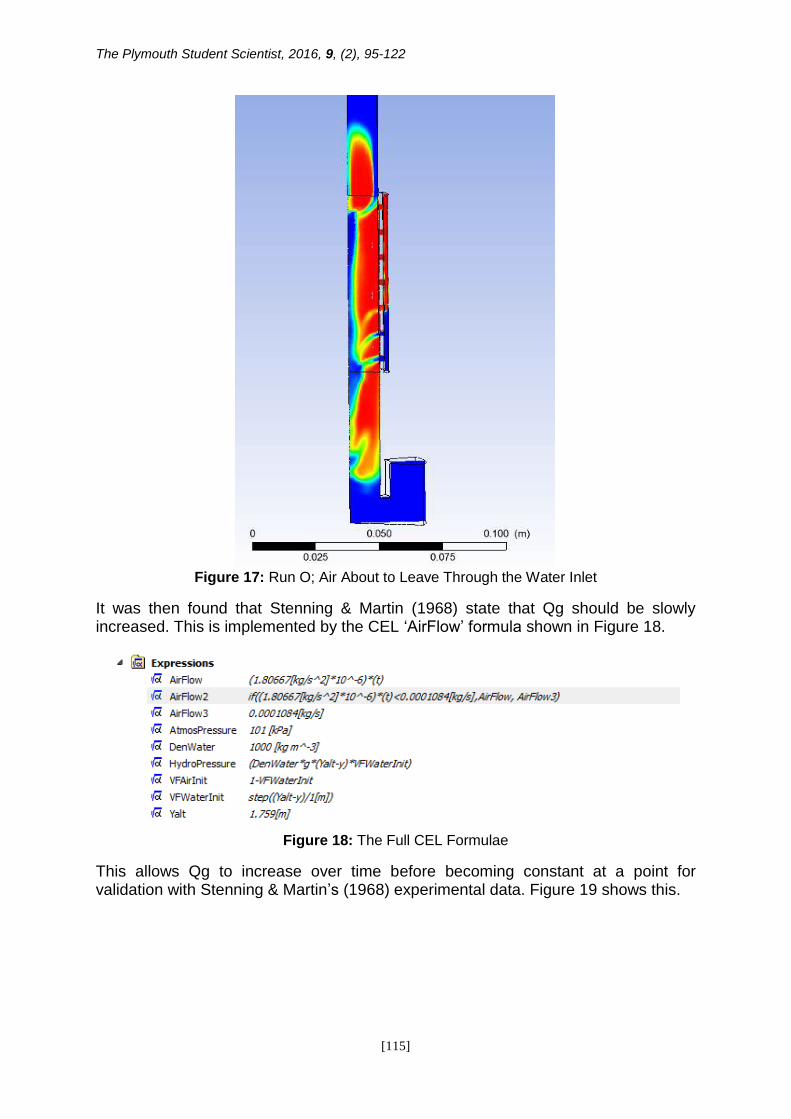
Figure 17: Run O; Air About to Leave Through the Water Inlet
It was then found that Stenning & Martin (1968) state that Qg should be slowly increased. This is implemented by the CEL ‘AirFlow’ formula shown in Figure 18.
Figure 18: The Full CEL Formulae
This allows Qg to increase over time before becoming constant at a point for validation with Stenning & Martin’s (1968) experimental data. Figure 19 shows this.

The Plymouth Student Scientist, 2016, 9, (2), 95-122
[116]
Figure 19: Qg against Time
Limits of CFD research At this point Run R was run for over 6 days. Due to the same time step required it was calculated the run would take 2465 days to complete (Appendix C). This is clearly not viable. Considering Eq.4 the time step can be reduced if the element size is increased. However Figure 20 shows the mesh is too coarse because its geometry is affecting the liquid/gas boundary.
Figure 20: Run Q Volume Fraction With the Mesh Overlaid
Unfortunately this means that Frank et al’s. (2008) validation techniques and independence studies of the geometry and mesh cannot be applied because runs are already taking too long to complete.
3.3.2 CFD driven research findings The findings of the CFD investigation are that it is not a suitable method for Fugro to model Airlift pumps. This is because of already excessive predicted run times despite the mesh being too coarse. The model could be improved by using adaptive meshing to reduce element size at phase boundaries during runs. However any
The Plymouth Student Scientist, 2016, 9, (2), 95-122
[117]
improvements would add further computational expense to an already non-viable model. For this reason it is concluded CFD is not a workable solution for the fast prediction of performance of Airlift pumps. Limitations of setting such as turbulence models cannot be undertaken whilst unable to complete runs.
4. Conclusions Throughout the report many factors have been considered in identifying a solution to Fugro’s problem. CFD is better used for problems requiring one-off answers. If a prediction is required regularly, as with Fugro’s requirements, conventional mathematical models are required. More complex CFD investigations shown by Kelly et al. (2016) are possible under different circumstances. This is shown by long run times and difficulty creating physically accurate models in Section 3.3 resulting in an incomplete CFD model requiring excessive computational resources not currently viable for fast calculations. The mathematical model was however far more easily implemented. Despite this more work would be required to ensure it is capable of predicting Airlift pumps which operate over larger pressure changes. This is discussed in section 3.2 and Appendix H. However it is felt that this option would provide the best solution to the specific problem identified by Fugro, despite full understanding and optimisation of Airlift pumps requiring CFD.
5. Recommendations for further research
5.1 Further mathematical modelling recommendation Firstly the model created should be validated against Fugro’s actual project results. This will provide an initial estimate along with Eq.1 as to the full effect of not accounting for gas expansion. Further literature may provide models which already account for this and can be implemented. It is then suggested a model could be made applying data collected from similar projects as mentioned in Appendix H and achieved by Holtrop & Mennen (1982) style modelling. The most crucial piece of information to be uncovered would be the water speed required lifting drill cuttings into the riser and this will affect pumping speeds. As drill cutting geometry is random, this could only be achieved by studying real projects.
5.2 Further CFD modelling recommendations From the results of section 3.3 there is much more work to be done developing the CFD before a validation stage including mesh and domain independence studies. The mesh is known to be too coarse from Figure 20. Domain independence will be required for the Base and Outlet geometries. However these steps can only be achieved with greater computational resources, a simplified mesh or decreased time steps per second. This would require the assistance of a CFD consultancy.
5.3 Other thoughts During this project how to improve Airlift pump deign has been considered. For example journals recommend tapered risers accounting for gas expansion as pressure reduces.
The Plymouth Student Scientist, 2016, 9, (2), 95-122
[118]
The closing thought on Airlift pumping design stems from consideration of the initial conditions of the pump: To start pumping, the riser could be pressurised, with air, from above, pushing the riser water level below that is outside it. This pressure is suddenly released having the effect of CFD with no inlet conditions mentioned in Appendix C. The pulse inflow, caused when pressure is released and water reacts to balance this, is used to ‘kick start’ the Airlift pumping operation. Although this is probably not feasible it is a potential development in airlift pumping which could be implemented using equipment already on the barge.
6. Project Time Management Appendix E shows Gantt charts and a full discussion. Due to the complexity and change in project scope after the interim report project management was important with revisions to time management plans. To ensure both models are presented at the same level of maturity more time was spent on the CFD model representing approximately a 1:5 split. Despite this it is felt the project has met its key aims and objectives. It has also allowed the following skills to be learnt:
ANSYS
General CFD
Logbook Keeping
Project Management Skills
Meeting Skills
Academic Poster Presentation Skills
Bibliography ANSYS Inc., 2013. ANSYS CFX-Solver Modeling Guide. [Online] Available at: http://148.204.81.206/Ansys/150/ANSYS%20CFX-Solver%20Modeling%20Guide.pdf. [Accessed 11 04 2016]. ANSYS, 2012a. Lecture 07 Turbulence, s.l.: s.n. ANSYS, 2012b. Lecture 11 Transient Flows, s.l.: s.n. ANSYS, 2012c. Workshop 07 Tank Flush, s.l.: s.n. AquaMarine Power, 2014. About us: Partners and funders. [Online] Available at: http://www.aquamarinepower.com/about-us/partners-and-funders/fugro-seacore.aspx. [Accessed 06 04 2016]. Brkic, D., 2011. New explicit correlations for turbulent flow friction factor. Nuclear Engineering and Design, p. 4055–4059. Cheng, L., Shyh, J. & Hwang, Y., 1997. Gas holdup and liquid velocity in three-phase internal-loop airlift reactors. Chemical Engineering Science, Volume 52, pp. 3949 -960. Crowley Maritime Corporation, 2015. Marine Solutions. [Online] Available at: http://www.crowley.com/What-We-Do/Marine-Solutions/Vessel-Specifications/Barges/Jack-Up-Barges. [Accessed 04 11 2015].

The Plymouth Student Scientist, 2016, 9, (2), 95-122
[119]
Dhoni, M., 2013. Fluid mechanics. [Online] Available at: http://www.slideshare.net/accelerate786/fluid-mechanics-cengel [Accessed 16 04 2016]. Doosan Trading Limited, 2009. 12/50 Operation and Maintenance Manual. s.l.:s.n. Energy 365, 2015. Fugro to provide marine drill coring system to JOGMEC for Methane Hydrate investigations. [Online] Available at: http://www.energy-pedia.com/news/general/fugro-to-provide-marine-drill-coring-system-to-jogmec-for-methane-hydrate-investigations [Accessed 13 06 2015]. Faber, 1995. Fluid Dynamics For Physisits. Cambidge: Cambridge University Press. Fan, W. et al., 2013. Experimental study on the performance of an air-lift pump for artificial upwelling. Ocean Engineering, Volume 59, p. 47–57. Frank, T. et al., 2008. Validation of CFD models for mono- and polydisperse air–water two-phase flows in pipes. Nuclear Engineering and Design, 03.pp. 647-659. Frank, T. et al., 2005. Inhomogeneous MUSIG Model – a Population Balance. Bled, s.n., pp. 067.1-067.12. Fugro, 2015a. About Us. [Online] Available at: http://www.fugro.com/about-fugro. [Accessed 13 06 2015]. Fugro, 2015b. about-us. [Online] Available at: http://www.seacore.com [Accessed 13 06 2015]. Fugro, 2015c. Cone Penertration Testing (CPT). [Online] Available at: http://www.fes.co.uk/services/CPT/. [Accessed 15 06 2015]. Fugro, 2015d. about-us. [Online] Available at: http://www.fes.co.uk/about-us/ [Accessed 13 06 2015]. Fugro, 2015e. Fugro at a glance. [Online] Available at: http://www.fugro.com/about-fugro/group-overview/fugro-at-a-glance [Accessed 13 06 2015]. Fugro, 2015f. Fugro wins early geotechnical investigation in one of europe’s largest infrastructure projects. [Online] Available at: http://www.fugro.com/media-centre/press-releases/fulldetails/2015/07/16/fugro-wins-early-geotechnical-investigation-in-one-of-europe-s-largest-infrastructure-projects. [Accessed 06 04 2016]. Fujimoto, H., Murakami, S., Omura, A. & Takuda, H., 2004. Effect of local pipe bends on pump performance of a small air-lift system in transporting solid particles. International Journal of Heat and Fluid Flow, pp. 996-1005.
The Plymouth Student Scientist, 2016, 9, (2), 95-122
[120]
Gray, G. & Darley, H., 1980. Composition and Properties of Oil Well Drilling Fluids. 4 ed. Houston: Gulf Publishing. Hackwell, 2015 Private Communications with Fugro GeoSevices, Project Design Engineer. Hanafizadeh, P., Karimi, A. & Saidi, M., 2011. Effect of Step Geometry on the Performance of the Airlift Pump. International Journal of Fluid Mechanics Research, 38(5), pp. 387-408. Holtrop, J. & Mennen, G., 1982. An Approximate Power Prediction Method. Int. Shipbuild Progress, Volume 29, pp. 166-171. Huanga, Q., Yanga, C., Yua, G. & Mao, Z.-S., 2010. CFD simulation of hydrodynamics and mass transfer in an internal airlift loop reactor using a steady two-fluid model. Chemical Engineering Science, p. 5527–5536. Jamaloeia, B. Y., Asgharia, K. & Kharratb, R., 2012. The investigation of suitability of different capillary number definitions for flow behavior characterization of surfactant-based chemical flooding in heavy oil reservoirs. Journal of Petroleum Science and Engineering, Volume 90–91, p. 48–55. Kassaba, S. Z., Kandila, H. A., Wardaa, H. A. & Ahmedb, W. H., 2009. Air-lift pumps characteristics under two-phase flow conditions. International Journal of Heat and Fluid Flow, 02, 30(1), p. 88–98. Kelly, M., White, M. & Owen, I., 2016. Using airwake simulation to inform flight trials for the Queen Elizabeth Class Carrier. London, The Institute of Marine Engineering, Science and Technology, pp. 24-36. Kim, S.-H., Sohn, C.-H. & Hwang, J.-Y., 2014. Effects of tube diameter and submergence ratio on bubble pattern and performance of air-lift pump. International Journal of Multiphase Flow, p. 195–204. Kinsky, R., 1982. Applied Fluid Dynamics. 1 ed. Sydney: McGraw-Hill Book Company. Laugier, A. & Garai, J., 2007. Derivation of the Ideal Gas Law. Journal of Chamical Education, 11, 84(11), pp. 1832-1833. Linfield, K. & Murdry, R., 2008. Pros and Cons of CFD and Physical Flow Modeling. [Online] Available at: http://www.airflowsciences.com/sites/default/files/docs/Pros-and-Cons-of-CFD-and-Physical-Flow-Modeling.pdf. [Accessed 13 08 2016]. Maclean, R., 2015. Jack-up rig is demobilised. [Online] Available at: http://www.falmouthpacket.co.uk/in_port/13874565.Jack_up_rig_is_demobilised/ [Accessed 06 04 2016].

The Plymouth Student Scientist, 2016, 9, (2), 95-122
[121]
Mahrous, A. F., 2012. Numerical Study of Solid Particles-Based Airlift Pump Performance. WSEAS Transactions on Applied and Theoretical Mechanics, 7.7(3). Menter, F., 2002. CFD best practice guidelines (BPG) for CFD code validation for reactor safety applications. EC Project ECORA, Volume EVOL-ECORA-D01, pp. 1-47. NASA, 2014. Reynold Number. [Online] Available at: https://www.grc.nasa.gov/www/BGH/reynolds.html [Accessed 03 12 2015]. PennWell Corporation, 1999. Research focusing on degree of contamination from cuttings piles. [Online] Available at: http://www.offshore-mag.com/articles/print/volume-59/issue-8/departments/international-focus/research-focusing-on-degree-of-contamination-from-cuttings-piles.html. [Accessed 04 11 2015]. Pougatch, K. & Salcudean, M., 2008. Numerical modelling of deep sea air-lift. Ocean Engineering, 35(11-12), p. 1173–1182. Ragner, C. L., 2008. The Northen Sea Route. [Online]. Available at: http://norden.se. [Accessed 15 06 2015]. Reinemann, D. J., Parlange, J. Y. & Timmons, B. M., 1990. Theory of Small-Diameter Airlift Pumps. International Journal for Multiphase Flow, Volume 16, pp. 113-122. Rigzone.com, 2015. How Do Jackups Work?. [Online] Available at: http://www.rigzone.com/training/insight.asp?insight_id=339&c_id=24 [Accessed 04 11 2015]. Rigzone, 1999. How Do Drilling Fluids Work?. [Online] Available at: http://www.rigzone.com/training/insight.asp?insight_id=291&c_id=24 [Accessed 10 04 2016]. Sadooni, M. & Ebrahimi, M., 2012. Investigating the Effect of Capillary Number on Performance Prediction of an Iranian Fractured Gas Condensate Reservoir. Petroleum Science and Technology, 30(19), pp. 2076-2087. SAS IP, 2013. ANSYS Fluid Dynamics Verification Manual. [Online] Available at: http://148.204.81.206/Ansys/150/Fluid%20Dynamics%20Verification%20Manual.pdf [Accessed 12 04 2016]. Sayma, A., 2009. Computational Fluid Dynamics. s.l.:Ventus Publishing. Shin, K. & Andersen, P., 2015. CFD analysis of cloud cavitation on three tip-modified. s.l., IOP Publishing, pp. 1-4.
The Plymouth Student Scientist, 2016, 9, (2), 95-122
[122]
Smith, C., 2012. A Solution for Every Multiphase Challenge. [Online] Available at: https://support.ansys.com/staticassets/ANSYS/Conference/Confidence/Phoenix/Downloads/solution-every-multiphase-challenge.pdf. [Accessed 10 04 2016]. Stenning, A. H. & Martin, C. B., 1968. An Analytical and Experimental Study of Air-Lift Pumpo Performance. A Journal of Engineering for Power, pp. 106 - 110. subseaworldnews, 2015. fugro completes hornsea project one geotechnical campaign. [Online] Available at: http://subseaworldnews.com/2015/04/23/fugro-completes-hornsea-project-one-geotechnical-campaign/. [Accessed 16 06 2015]. Tayebi, D., Svendsen, H., Jakobsen, H. & Grisligas, A., 2007. Measurement techniques and data interpretations for validating cfd multi phase reactor models. Chemical Engineering Communications, 10, 186(1), pp. 56-169. Tighzert, H., Brahimi, M., Kechroud, N. & Benabbas, F., 2013. Effect of submergence ratio on the liquid phase velocity, efficiency and void fraction in an air-lift pump. Journal of Petroleum Science and Engineering, 10, 110(1), p. 155–161. Towle, P. & Fishwick, M., 2015. Reeds Nautical Almanac 2016 (Reed's Almanac). Aberdeen: Harold Brunton-Reed. Wahba, E. M. et al., 2014. On the Performance of Air-Lift Pumps: From Analytical Models to Large Eddy Simulation. Journal of Fluids Engineering, pp. on-line. Yoshinaga, T. & Sato, Y., 1996. Performance of an air-lift pump for conveying coarse p articles. PInt. J. Multiphase Flow Vol. 22, No. 2, pp. 223-238, 1996, 22(2), pp. 223-238. Zohuri, B., 2012. Dimensional Analysis and Self-Similarity Methods for Engineers and Scientists. s.l.:Springer. Appendices for this work can be retrieved within the Supplementary Files folder which is located in the Reading Tools menu adjacent to this PDF window.