fueling profits - consumer fed
TRANSCRIPT

FUELING PROFITS:INDUSTRY CONSOLIDATION, EXCESS PROFITS & FEDERAL NEGLECT
DOMESTIC CAUSES OF RECENT GASOLINE AND NATURAL GAS PRICE SHOCKS
DR. MARK N. COOPER
May 2004

ContentsEXECUTIVE SUMMARY ..................................................................................................... 1RECORD HIGH PRICES; RECORD HIGH PROFITS .......................................................................... 1CONCENTRATION AND MARKET POWER AFTER A WAVE OF MERGERS .......................................... 2THE FAILURE OF PUBLIC POLICY ................................................................................................ 4CHANGING DIRECTION IN PUBLIC POLICY ................................................................................... 5
I. INTRODUCTION............................................................................................................... 7“THE GAS MORASS OF ‘04”1...................................................................................................... 7PURPOSE AND OUTLINE................................................................................................................ 7
II. DOMESTIC ENERGY PRICE SHOCKS ...................................................................... 8METHODOLOGY ........................................................................................................................... 8DOMESTIC PRICE RATCHETS ......................................................................................................11THE ROLE OF CRUDE ................................................................................................................ 14HOUSEHOLD IMPACTS ................................................................................................................ 18PROFITING FROM PRICE INCREASES IN CONCENTRATED MARKETS ............................................ 20
III. THE CAUSES OF DOMESTIC PRICE SHOCKS .................................................... 21THE MERGER WAVE ................................................................................................................. 22EXERCISING MARKET POWER OVER PRICE ............................................................................... 25GASOLINE SUPPLY ..................................................................................................................... 27NATURAL GAS SUPPLY ............................................................................................................... 32
IV. WEAK MARKET FUNDAMENTALS PUT ENERGY CONSUMERSAT INCREASED RISK................................................................................................... 36
ANTITRUST AND PUBLIC POLICY ................................................................................................ 36DEMAND IS INELASTIC ............................................................................................................... 38SUPPLY IS INELASTIC ................................................................................................................. 39THE GAS GUZZLER PROBLEM ................................................................................................... 41CONCENTRATION IN THE PETROLEUM INDUSTRY CREATES MARKET POWER............................... 43
V. PUBLIC POLICY ............................................................................................................ 48POLICY ORIENTATION MATTERS ................................................................................................ 48THE WRONG EXPLANATIONS LEAD TO THE WRONG POLICY ...................................................... 49POLICY THAT REFLECTS THE DOMESTIC REALITY ...................................................................... 52
ENDNOTES ........................................................................................................................... 55

1
EXECUTIVE SUMMARY
RECORD HIGH PRICES; RECORD HIGH PROFITS
With energy prices making front-page headlines and taking center stage in electionyear debates, policymakers are arguing over whom to blame and scrambling for explanations.This paper analyzes the record gasoline and natural gas prices in the period from January 2000to March 2004 by decomposing the increases into three components – shifts in the domesticmarket structure, price increases paid to foreign energy producers when the international priceof crude increases, and price increases paid to domestic energy resource producers whendomestic prices follow international prices upward.
• Total price increases for gasoline at the pump and natural gas at the wellhead have beenover $300 billion over the past four years, resulting in record profits for the industry.
Domestic petroleum companies account for about $250 billion. Changes in domesticmarket structure accounted for the largest part of this total.
• The gasoline refining and marketing segments of the domestic industry have increasedpump prices by $55 billion, exclusive of crude oil price increases.
• Similar changes in the domestic market structure added another $5 billion to the cost ofother domestic petroleum products that are used by residential consumers, such as heatingoil and propane.
• Natural gas wellhead prices increased by almost $100 billion, separate and apart fromanything that OPEC has done, wit $90 billion going to domestic sellers of natural gas.
Another $100 billion went to domestic producers by simply following the global priceof energy up. About $60 billion went to foreign producers of energy resources.
Taken together, in 1999, averaged across all households, expenditures for gasoline,heating oil and natural gas accounted for about $1400 per year of total householdexpenditures.
• Price increases over the past four years associated with the price shock for these residentialitems added about $350 per household per year (including all factors). Thus, domesticenergy price shocks have increased household energy bills by 25 percent.
• A comparison between 1999 and 2003 is even more dramatic, a $500 increase in averageannual household expenditures for these petroleum products, which represents a jump ofover 35 percent.
Since these price increases were not caused by cost increases, petroleum industryprofits have risen to record highs over the period.

2
• Domestic petroleum companies enjoyed an increase in 2000 to 2003 of $50 to $80 billionof after-tax windfall profits compared to the 1995-1999 period. Before tax profits were up$70 to $110 billion.
• Domestic petroleum industry profits are headed for another record. First quarter 2004filings show domestic refining and marketing profits up about 50 percent compared to thefirst quarter of 2003, while company-wide profits are up about 17 percent.
CONCENTRATION AND MARKET POWER AFTER A WAVE OF MERGERS
The story that does not get coverage behind the headlines reporting record prices andprofits is the merger wave that swept through the petroleum industry between 1997 and 2002.
0
10
20
30
40
50
60
70
80
90
JA -9
5
MY S
JA-9
6
MY S
JA-9
7
MY S
JA-9
8
MY S
JA-9
9
MY S
JA-0
0
MY S
JA -0
1
MY S
JA -0
2
MY S
JA-0
3
MY S
JA-0
4
CEN
TS/
GA
LLO
N
ACTUAL HISTORIC AVERAG E TRENDED
E xhib it E S-1: D om estic G asoline Spread , A ctual and Projected
Source: See text for m ethodology, U .S . D epartm ent of Energy, Energy Inform ation A dm inistration, M onthly Energy Review , W eekly Petroleum Status Report, various issues and database.
D om estic Price Shift

3
It concentrated the petroleum industry into the hands of a small number of giant, verticallyintegrated companies that gained market power over prices.
• The Department of Energy identified a total of major 34 oil and gas companies thatmerged into 13 over this period, and an 15 refining companies that had shrunk to seven.
• Of the 31 companies listed in the oil and gas sector by Business Week in 1995, 21 engagedin mergers with other companies between 1997 and 2002. Of the 21 listed by BusinessWeek in 2003, 15 had engaged in mergers in the previous five years.
With increasing concentration, long-term strategic decisions by the industry tightenproduction capacity interacted with short-term (mis)management of stocks to create a tightsupply situation that provides ample opportunities to push prices up quickly.
0
1
2
3
4
5
6
7
8
9JA
-95
MY S
JA-9
6
MY S
JA-9
7
MY S
JA-9
8
MY S
JA-9
9
MY S
JA-0
0
MY S
JA -0
1
MY S
JA -0
2
MY S
JA-0
3 M S
JA-0
4
$/M
CF
A C T U A L H IS T O R IC C R U D E C R U D E + S E A S O N A LIT Y T R E N D
E xh ib it E S -2: N atu ral G as W ellh ead P rices, A ctua l an d P rojected
Source: S ee tex t for m ethodology, U .S . D epartm ent of E nergy, E nergy Inform ation A dm inistration , M onthly E nergy R eview , W eekly P etroleum Sta tus R eport, various issues and database.
D om estic P rice S hift

4
• In the 1990s alone, approximately 50 refineries were closed. Since 1995, over 20 refinerieshave been shut down.
• Operating stocks to meet demand and cushion price swings have declined to very lowlevels. They generally are in the range of a couple of days, compared to four or five daysin the early 1990s and over a week in the 1980s.
The move of the majors into natural gas production in the 1990s changed the nature ofthat sector. Decisions about which wells to produce and which wells to cap, how much toinject into storage, how to use pipeline capacity and ultimately, how to report prices arebusiness decisions that affect the price paid at the wellhead.
• Consolidation came hand in hand with the shift to acquisition of resources through merger(rather than exploration) and a shift of drilling away from exploration.
• The trading markets that drive wellhead natural gas price are quite new and lack pricetransparency. Enron played a large roll in these markets and when it collapsed, so too didmuch private trading. The evidence is mounting that manipulation and abusive practiceshave been part of these markets since 2000.
• The long-term trend to much lower stocks relative to demand is clear in natural gas aswell. Compared to the decade of 1985-1994, stocks were about 25 percent lower in the1995-1999 period. During the price spikes of the new millennium, stocks were 40 to 50percent lower than the 1985-1994 period and 25 percent lower than the 1995-1999 period.
THE FAILURE OF PUBLIC POLICY
Excessive industry concentration and anti-consumer pricing behavior is the result oflax antitrust law enforcement by both the Clinton and Bush Administrations allowed too manymergers because they did not take the unique characteristics of the energy industry intoaccount. The Federal Trade Commission has failed to recognize the inability of supply anddemand to respond to price signals, which allows market power to be abused at much lowerlevels of concentration than is the case in most other industries.
Because there are few firms in the market and because consumers cannot easily cutback on energy consumption, prices hold above competitive levels for significant periods oftime. The problem is not a conspiracy, but the self-intrested action of large companies withmarket power. With weak competitive market forces, individual companies have flexibilityfor strategic actions that raise prices and profits.
• Individual companies can let supplies become tight in their area and keep stocks low, sincethere are few competitors who might counter this strategy, and push prices up whendemand increases because they have no fear that competitors will not raise prices to stealcustomers.

5
• Every accident or blip in the market triggers a price shock that leads to additional profits.Moreover, operating complex energy systems at very high levels of capacity places strainson the physical infrastructure and renders it susceptible to accidents.
The explanation for the high and volatile price of gasoline offered by the industry andthe Bush Administration emphasizes that “overdependence on any one source of energy,especially a foreign source, leaves us vulnerable to price shocks, supply interruptions and inthe worst case, blackmail.” The explanation is so oversimplified and incomplete that it mustbe considered at best misleading and it leads to a policy that incorrectly overemphasizesdomestic production.
The central premise of the energy bill pushed by the administration is that energycompanies need more money to boost production of domestic energy supplies. To that end, agrab bag of subsidies – totaling over $20 billion – was earmarked for the oil and gas industry,while other expensive alternatives also would receive assistance. On the natural gas side, thebill promotes costly backstop technologies, like liquefied natural gas imports and an Alaskanatural gas pipeline, that will lock in high gas prices.
Further boosting the profitability of the petroleum industry with subsidies and accessto resources in environmentally sensitive areas would not increase production a great deal, norwill it decrease prices to consumers. Over the past four years, the domestic oil and gasindustry has enjoyed a huge increase in profitability, but the pricing abuse has gotten worse,not abated.
• Because domestic resources represent a very small share of the global resources base andare relatively expensive to develop, the increase in the amount of oil and gas produced inAmerica will not be sufficient to put downward pressure on world prices.
• Even if the U.S. could affect the market price of basic energy resources, which is veryunlikely, that would not solve the structural problem in domestic markets.
Tight markets in the U.S. can best be addressed by relieving pressure on the demandside, yet the energy bill being considered by Congress does little to relieve that pressure. Thelegislation fails to take serious measures to reduce demand by boosting the efficiencyrequirements for the most important energy consuming equipment – like automobiles and airconditioners.
CHANGING DIRECTION IN PUBLIC POLICY
The current uncompetitive and anti-consumer market conditions grew up over decadesand they can only be reversed by a long-term policy that seeks to reduce the consumption ofpetroleum products and relieve the pressures on domestic markets. Vigorous and broad basedpublic policies should be pursued to implement permanent institutional changes that lowerthechances that markets will be tight and reduce the exposure of consumers to the opportunistic

6
exploitation of markets when they become tight. To achieve this reduction of risk, publicpolicy should be focused on achieving several interrelated goals.
• • • • • Easing tight markets: Increasing fuel efficiency in the decade ahead at the rate achieved inthe 1980s would save about 1.5 million barrels per day. Increasing refinery capacity by 10percent, either through expansion at existing refineries or redevelopment of less than onehalf of the refineries closed in the past decade, would add another 1.5 million barrels perday.
• • • • • Increase market flexibility: Expanding stocks – with tax incentives to hold and drawdown supplies in the fact of price increases, mandatory stocks requirements as apercentage of sales, and/or government owned/privately operated supplies – couldalleviate the chronic problem of inadequate short-term shortages.
• • • • • Promote a more competitive industry: Further concentration of the petroleum industryshould be resisted by vigorous enforcement of the Department of Justice MergerGuidelines. Restrictive marketing practices, such as zonal pricing and franchiserestrictions on supply acquisition should be investigated and discouraged.
• • • • • Deter private actions that make markets tight or exploit market disruptions.Withholding of supply should draw immediate and intense public and governmentalscrutiny through a joint federal state task force of attorney’s general. Manipulation ofcommodity markets should be prevented. The incentives to manipulate markets can bereduced by imposing a windfall profits tax that triggers under specific circumstances ofprice and profit increases.

7
I. INTRODUCTION
“THE GAS MORASS OF ‘04”1
The issue of energy prices has moved to the front pages of the nation’s newspapers andcenter stage in election year policy debates. For example, on May 4, 2004, The New YorkTimes ran a front-page business section story under the headline, “Drivers Tend to Shrug OffHigh Gas Prices, for Now.”2 It reported that consumers had not yet reacted strongly to recordhigh prices, in part because the tax cut had cushioned the blow. It cited figures that indicated“the tax cut gave consumers about $70 billion in additional spending power this year, whilethe rise in crude oil prices… has so far cost Americans only about $35 billion.” On the verysame day, The Washington Post saw more pain in high gasoline prices under the headline“Caught Over a Barrel: Soaring Gas Prices Have Motorists’ Wallets Running on Empty.”3 Itrecounted the lengths to which consumers were going to “save a nickel a gallon.”
Public officials appear to be at least as confused as the newspaper headlines. At arecent hearing on gasoline and natural gas prices, for example, the General Counsel of theFederal Trade Commission (FTC) testified that 85 percent of the increase in gasoline priceswas caused by increases in crude oil prices.4 Less than a week later, however, another branchof the federal government contradicted the claim by the FTC. A spokesman for the EnergyInformation Administration (EIA) observed that 60 percent of recent price increases werecaused by the domestic refining sector.5 By the EIA count, the increase attributable to crude isless than half as much as the FTC claimed at the hearing. A couple of weeks later, however,the EIA spokesperson changed his tune, now claiming that “OPEC production cuts rankedhigher as a cause for increased gas prices than tightness in the United States refining market.”6
The energy price problem is not confined to gasoline markets. It afflicts natural gas aswell. A December 2003 report from the Industrial Energy Consumers of America concludedthat a “41 month natural gas crisis has cost U.S. consumers over $111 billion.”7 The bad newscontinued in the winter, summarized in headlines like “Natural Gas Prices Surge and Fingersare Pointing”8 and “Heating Costs Going Through the Roof.”9
PURPOSE AND OUTLINE
This paper seeks to fill the gap between the statements by the FTC and the EIA andchart a course through the morass of energy price headlines. It provides a detailed accountingof the sources of recent gasoline and natural gas price increases.10 It explains the structuralcauses of those changes.
Section II describes the cost to consumers of the dramatic shift in domestic pricingbehavior. It shows that shifts in the domestic market structure have played as large a role inthe recent price spikes as increases in the world price of crude. Further, it shows that priceincreases paid to domestic energy resource producers, when domestic prices follow

8
international prices upward have been far larger than price increases paid directly to foreignenergy producers when the international price of crude increases.
Section III explains why domestic producers were able to increase their take indomestic energy markets. It shows that a merger wave in the late 1990s dramatically changedthe industry structure, concentrating the petroleum industry into the hands of a small numberof giant, vertically integrated companies.11 The business decisions of these companiesrestricted capacity, undermined independents and rendered many markets uncompetitive andvulnerable to manipulation.
Section IV explains why the FTC under both the Clinton and Bush administrationsfailed to stop energy industry mergers and failed to recommend or take policy action againstclearly abusive practices in the energy industries. The FTC has failed to recognize that weakmarket forces (demand and supply that cannot respond easily to price changes) allow firms toexercise market power at lower levels of concentration than in other industries.
Section V explains why the policies embodied in the pending energy bill are misguidedand proposes an alternative set of policies. It argues that increased profitability for oilcompanies through subsidies and permission to drill in environmentally sensitive areas willnot produce enough new resources to reduce pressures on the world oil market. Because thesame companies that have market power will likely control the additional output, it will dolittle to alleviate problems in domestic markets. Alternative policies to reduce demand,increase domestic market flexibility, and prevent market manipulation are suggested.
II. DOMESTIC ENERGY PRICE SHOCKS
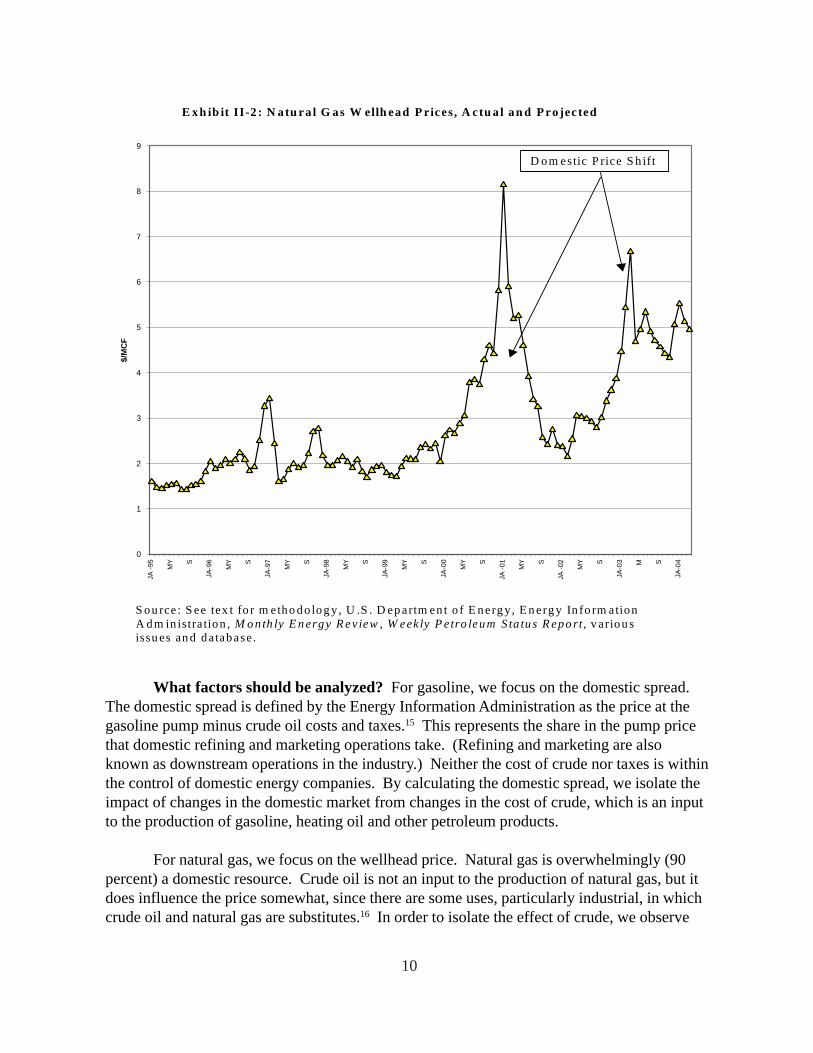
A quick glance at the testimony of the FTC General Counsel reveals the source of hisoverestimation of the role of crude oil price increases. The FTC witness relied on an early1999 analysis and seems to have looked at a long-term trend of prices, rather than looking atthe recent and current situation.12 Exhibits II-1 and II-2, which focus on the price increasesresulting from shifts in domestic gasoline and natural gas market structures, show that indoing so he ignored a dramatic change in the pricing pattern of domestic energy sources:energy prices began to destabilize in the spring of 2000 and took off in early 2001.
METHODOLOGY
To gauge the magnitude of the domestic price shifts, we have compared the recentprice increases to several baseline estimates. As is evident in the disagreement between theFTC and the EIA, the choice of baseline and the period over which one makes comparisons isextremely important. A series of questions must be answered.

9
How far back should the analysis go? For purposes of this analysis we go back toJanuary 1995. January 1995 was the implementation date of the Clean Air Act Amendments.13
The Clean Air Act Amendments affected refinery operations and, in turn, gasoline prices. TheClean Air Act Amendments and electricity restructuring, which began in the mid-1990s,affected natural gas markets as well.14 Moreover, a merger wave hit the industry in the secondhalf of the 1990s. As discussed below, there is documentary evidence from the mid-1990s thatoil industry executives contemplated tightening the supply side of the oil market through themerger wave. Longer-term comparisons would make the recent pricing abuse appeareven greater.
At what date does the change in behavior take place? The data itself provides aneasy answer. There appears to have been a sharp break in the pricing behavior of domesticenergy markets in early 2000. This change in behavior escalated sharply in 2001.
0
1 0
2 0
3 0
4 0
5 0
6 0
7 0
8 0
9 0
JA -9
5
MY S
JA-9
6
MY S
JA-9
7
MY S
JA-9
8
MY S
JA-9
9
MY S
JA-0
0
MY S
JA -0
1
MY S
JA -0
2
MY S
JA-0
3
MY S
JA-0
4
CEN
TS/
GA
LLO
N
E x h ib it I I -1 : D o m e s t ic G a s o lin e S p r e a d S o u rc e : S e e te x t fo r m e th o d o lo g y , U .S . D e p a r tm e n t o f E n e rg y , E n e rg y In fo rm a tio n A d m in is tra t io n , M o n th ly E n e r g y R e v ie w , W e e k ly P e tr o le u m S ta tu s R e p o r t , v a rio u s is s u e s a n d d a ta b a s e .
D o m e s tic P r ic e S h if t
10
What factors should be analyzed? For gasoline, we focus on the domestic spread.The domestic spread is defined by the Energy Information Administration as the price at thegasoline pump minus crude oil costs and taxes.15 This represents the share in the pump pricethat domestic refining and marketing operations take. (Refining and marketing are alsoknown as downstream operations in the industry.) Neither the cost of crude nor taxes is withinthe control of domestic energy companies. By calculating the domestic spread, we isolate theimpact of changes in the domestic market from changes in the cost of crude, which is an inputto the production of gasoline, heating oil and other petroleum products.
For natural gas, we focus on the wellhead price. Natural gas is overwhelmingly (90percent) a domestic resource. Crude oil is not an input to the production of natural gas, but itdoes influence the price somewhat, since there are some uses, particularly industrial, in whichcrude oil and natural gas are substitutes.16 In order to isolate the effect of crude, we observe
0
1
2
3
4
5
6
7
8
9JA
-95
MY S
JA-9
6
MY S
JA-9
7
MY S
JA-9
8
MY S
JA-9
9
MY S
JA-0
0
MY S
JA -0
1
MY S
JA -0
2
MY S
JA-0
3 M S
JA-0
4
$/M
CF
E xh ib it II-2 : N atu ra l G as W ellh ead P rices , A ctu a l an d P ro jec ted S ou rce : S ee tex t fo r m etho do log y, U .S . D ep artm en t o f E nerg y, E n erg y In fo rm ation A dm in istra tion , M o nth ly E n ergy R e v iew , W e ek ly P e tro leum S ta tu s R epo rt, v ariou s issu es an d da tabase.
D om estic P rice S h ift

11
that between January 1995 and December 1999, natural gas averaged about 67 percent of thecost of crude. We use this as the historic average.
After isolating the effect of crude prices in this way, we compare crude pricemovements to domestic energy price movements. We examine the relationship of crude to thedomestic factors isolated.
How should baseline prices be calculated? In order to estimate the magnitude of ashift in pricing behavior, we must have some estimate of what prices would have been absentthe shift. For purposes of this analysis, and given the context of the debate over current prices,we have chosen two baseline methods.
Above we noted the estimate of the Industrial Energy Consumers of America (IECA)of a $111 billion increase in natural gas wellhead prices. This is based on a simplecomparison of prices before and after a specific date (in their case June 2000). While such anestimate presents a baseline, it does not take into account factors such as the cost of crude,seasonality of demand or the general trend of increasing demand. Therefore, we havecalculated the price increases using two more sophisticated methods. The results are lowerthan those calculated by the IECA.
For the domestic gasoline spread, we use the historic average from January 1995 toJanuary 2000 as one baseline. For a more refined estimate, we use a trend line based on theseasonality of demand and the increasing trend of demand.17
For natural gas, we base the historic average on the relationship between the price ofnatural gas and the price of crude oil in the January 1995 to December 1999 period.18 For thetrend line we add in a seasonality factor to the crude-driven price.19
Exhibits II-3 and II-4 above include these baseline estimates and indicate that they aregood predictors of prices in the period prior to January 2000.
DOMESTIC PRICE RATCHETS
Exhibit II-3 above shows the domestic spread on gasoline. Throughout the second halfof the 1990s, the domestic spread fluctuated seasonally within a narrow range of 32 to 48cents per gallon. The average domestic spread was about 39 cents per gallon over the period.The domestic spread jumped in mid-2000 and skyrocketed in early 2001. It then plummetedback to historic levels during the winter recession of 2001-2002. It began to rise again in late2002 and has been above historic levels almost continually ever since. The average spreadfrom January 2000 to March 2004 has been about 51 cents per gallon.
Compared to the historic average, the increased cost to consumers since January 2001has been about $63 billion. Compared to the trended base line, the increase has been about$48 billion. Only 5 percent of gasoline is imported as product.

12
The picture is similar for natural gas, which is overwhelmingly produced fromdomestic sources (see Exhibit II-4). There was a run-up in prices in mid-2000 and a peak inearly 2001, reinforcing the sense of an energy crisis. Prices tumbled during the 2001-2002recession, but have mounted again and stabilized at over twice the level of the late 1990s. Thetotal increase in the wellhead price of natural gas above the historic relationship to crude wasabout $98 billion ($99 billion compared to historic and $97.6 billion compared to trended).Of this total, about $15 billion goes to foreign suppliers of natural gas, since the U.S. importsabout 15 percent of its total supply.
0
10
20
30
40
50
60
70
80
90
JA -9
5
MY S
JA-9
6
MY S
JA-9
7
MY S
JA-9
8
MY S
JA-9
9
MY S
JA-0
0
MY S
JA -0
1
MY S
JA -0
2
MY S
JA-0
3
MY S
JA-0
4
CEN
TS/
GA
LLO
N
ACTUAL HISTORIC AVERAGE TRENDED
Exhibit II-3: Domestic Gasoline Spread, Actual and Projected Source: See text for methodology, U.S. Department of Energy, Energy Information Administration, Monthly Energy Review, Weekly Petroleum Status Report, various issues and database.
Domestic Market Shift

13
The domestic price shift was much larger after December 2000. The increase in thedomestic spread has been much larger since 2001. The increase in 2000 averaged between $.6billion per month (trended) and $1.0 billion per month (historic average). Since January 2001,the increase has averaged between $1 billion per month (trended) and $1.3 billion per month(historic average). Virtually all of the increase took place after wellhead prices skyrocketed inearly 2001.
Exhibit II-5 shows the domestic spread on heating oil. The pattern parallels gasoline,with the winter season being the peak for the domestic heating oil spread. In the January 1995to December 1999 period, the heating oil domestic spread varied in the narrow range of 40cents to 60 cents per gallon and averaged 48 cents. Since January 2000 it has varied in a much
0
1
2
3
4
5
6
7
8
9JA
-95
MY S
JA-9
6
MY S
JA-9
7
MY S
JA-9
8
MY S
JA-9
9
MY S
JA-0
0
MY S
JA -0
1
MY S
JA -0
2
MY S
JA-0
3 M S
JA-0
4
$/M
CF
ACTUAL HISTO RIC CRUDE CRUDE + SEASONALITY TREND
Exhibit II-4: Natural G as W ellhead Prices, Actual and Projected Source: See text for m ethodology, U .S. Departm ent of Energy, Energy Inform ation A dm inistration, M onthly Energy Review, W eekly Petroleum Status Report, various issues and database.
D om estic Price Shift

14
wider range (40 cents to 80 cents) and averaged 62 cents. This increased costs to consumersby $2 to $3 billion per year. The other fuel used by residential consumers – propane –exhibited a similar pattern. The spread moved up in 2000 and peaked in 2001. It moderatedsomewhat in 2002, but rose again and remained well above historic averages in 2003 and2004.
THE ROLE OF CRUDE
Exhibit II-6 plots crude oil costs and the domestic spread on the same axes. It isinteresting to note that prior to January 2000, there was virtually no relationship between thedomestic spread and the price of crude. Nor is there any reason to believe that there shouldhave been. In fact, the regression coefficient for January 1995 to January 2000 was slightlynegative, though not statistically significant. After January 2000, there was a positive andstatistically significant relationship. The domestic spread rose with crude prices.
Thus, the record prices we see today are the result of the combination of historichighs in both crude oil prices and the domestic spread.
0
1 0
2 0
3 0
4 0
5 0
6 0
7 0
8 0
9 0
JA -9
5
MY S
JA-9
6
MY S
JA-9
7
MY S
JA-9
8
MY S
JA-9
9
MY S
JA-0
0
MY S
JA -0
1
MY S
JA -0
2
MY S
JA-0
3
MY S
JA-0
4
CEN
TS/
GA
LLO
N
E x h ib it I I -5 : D o m e s t ic H e a tin g O il S p r e a d S o u rc e : E n e r g y In fo rm a t io n A d m in is tra t io n , P e tr o le u m M a r k e t in g M o n th ly a n d M o n th ly E n e r g y R e v ie w , v a r io u s is s u e s a n d d a ta b a s e .

15
Exhibit II-7 plots crude oil costs and natural gas wellhead prices. Again, prior toJanuary 2000 the relationship between natural gas and crude oil prices was weak andstatistically not significant. While natural gas averaged about 67 percent of crude, it did notfollow the price movements of crude very closely. Since January 2000, the relationship hasbeen larger (the regression coefficient is four times as large) and statistically significant. SinceJanuary 2000, the natural gas wellhead price has been about 90 percent of the price of crude.Since January 2001, it has been 93 percent.
It would appear that the domestic industry seized the opportunity of rising crude pricesto increase their share of the delivered price of energy. In order to accomplish this, of course,
0
10
20
30
40
50
60
70
80
90JA
-95
MY S
JA-9
6
MY S
JA-9
7
MY S
JA-9
8
MY S
JA-9
9
MY S
JA-0
0
MY S
JA -0
1
MY S
JA -0
2
MY S
JA-0
3
MY S
JA-0
4
CEN
TS/
GA
LLO
N
REFINER M ARKETER DOM ESTIC SPREAD CRUDE OIL
Exhibit II–6: H igh Crude Oil Prices and H igh Domestic Gasoline Spreads Combine to Produce Record Prices at the Pump
Source: U .S. Departm ent of Energy, Energy Inform ation Adm inistration, Monthly Energy Review, Petroleum M arketing Monthly, Weekly Petroleum Status Report, various issues and database.

16
the firms in the industry had to have market power. The next section argues that theconsolidation resulting from the 1997-2002 merger wave created that market power.
With both resource costs and domestic pricing practices leading to price increases, caremust be exercised in estimating the various components of recent price increases. As with thediscussion of the domestic causes of the price increases, how much is attributed to foreignresource prices and how much to domestic factors depends on how far back we look and howwe calculate the baseline. Moreover, it is important to separate out domestic price followingbehavior from the market structure changes described above.
When international prices go up, Americans pay more to foreign producers of energyresources. To the extent that the price of domestic raw materials follows the internationalprice up, consumers also pay more to domestic producers of energy resources. When the
0
1
2
3
4
5
6
7
8
9
JA -9
5
MY S
JA-9
6
MY S
JA-9
7
MY S
JA-9
8
MY S
JA-9
9
MY S
JA-0
0
MY S
JA -0
1
MY S
JA -0
2
MY S
JA-0
3
MY S
JA-0
4
M O N T H S AN D Y E AR
$/M
CF
N A TU R A L G A S C R U D E O IL
E xh ib it II-7 : W ellh ead Price o f N atural G as an d C ru de O il Source: U .S . D epartm ent o f E nergy, E nerg y In form ation A dm in istration , M onth ly E nergy R eview , W eekly P etro leu m S ta tus R eport, various issues and database .

17
domestic price of crude follows the foreign price of crude (“price following”), the increaseends up in the pockets of domestic resource owners. In one sense, the complaints of the largeindustrial consumers who are losing business to foreign firms or shifting their operations tooverseas locations that have not suffered natural gas price increases, remind us that all pricesdo not follow international prices, penny-for-penny. Domestic market conditions affect howprices follow. When the domestic price rises more than the foreign price or change theirrelationship to the final price, because of increases in the domestic spread or a shift in naturalgas pricing behavior, that is a “domestic price shift.”
If we use January 1995 to December 1999 as the base period, as was done above, theaverage price of crude was $17.40 per barrel. The total increase in the cost of crude oil as aninput for gasoline since December 1999 would be approximately $49 billion (see Exhibit II-8). This should be compared to the estimate based on the historic average prices since it isbased on the same average historic cost approach. The domestic price shift ($63 billion) islarger than the crude increase. Of the total increase in crude costs of $49 billion, about $20
0
5 0
1 0 0
1 5 0
2 0 0
2 5 0
3 0 0
3 5 0
G a s o lin e N a tu ra l G a s (W e llh e a d ) T o ta l
Bill
ions
of D
olla
rs
D o m e s t ic M a rk e t S t ru c tu re D o m e s tic P r ic e F o llo w in g F o re ig n R e s o u rc e P r ic e
E x h ib it I I -8 : D o m e s t ic a n d F o r e ig n C a u s e s o f R e c e n t P r ic e I n c r e a s e s (B a s e C r u d e C o s t = $ 1 7 .4 0 )
S o u rc e : S e e te x t fo r c a lc u la t io n s .

18
billion went to domestic crude producers. Combining market structure changes and domesticprice following, we find that 75 percent of the total ($83 billion) went to domestic companies.
Applying the same crude oil price assumptions to natural gas, we find an increase ofabout $98 billion, equal to the increase we have estimated for the domestic shift.Approximately 85 percent went to domestic companies.
Combining these two estimates, we conclude that of the $310 billion increase,approximately 45 percent was caused by the domestic price shift and 34 percent by domesticprice following. Thus, of the total, 79 percent went to domestic companies and 21 percentwent to foreign energy suppliers.
Although the above approach is consistent with the overall analysis, it is possible toconstruct other scenarios in which the raw material costs play a larger role. For example, onemight take as the base price the lowest price of crude in the post-January 2000 period (lessthan $16.50 per barrel), which occurred in December 2001. The domestic spread was at thehistoric level. Natural gas was close to its historic level. Since then, crude oil prices haveincreased dramatically. The domestic spread has increased as well. Natural gas prices havestayed much closer to crude prices than they did historically. Taking this view, the total dollarincrease is smaller (about $239 billion), but occurred over a shorter period of time. Thedomestic share of the increase is smaller, about 72 percent. The most important part of theincrease in this view is price following, at 43 percent of the total, rather than the marketstructural changes, at 29 percent of the total.
The bottom line is clear. The domestic price shifts are important under any scenario.The domestic share of the total, combining domestic price shifts and price following, aredominant. Foreign crude price changes are certainly also important.
HOUSEHOLD IMPACTS
Part of the increase in energy prices is paid by businesses. They may seek to recoverthese cost increases from consumers in the prices of goods and services they sell. However, asubstantial part of the energy price increases are paid directly by consumers for theirhousehold energy costs – gasoline and heating oil, natural gas, for heating, cooking and hotwater, and electricity, which is increasingly produced with natural gas.
The average price increase for gasoline was over $.30 per gallon, or over 25 percent.The average price increase at the wellhead was $2.10 per MCF, or over 30 percent of thedelivered price to residential consumers.
Taken together, in 1999, household expenditures for gasoline, heating oil and naturalgas accounted for about $1400 per year of total household expenditures as reported by theBureau of Labor Statistics Consumer Expenditure Survey (see Exhibit II-9).20 This is theaverage for all households, which includes households that do not own cars and “all electricresidences” that use none of these fuels, as well as some that only use gas for cooking, but not

19
heating. On average, price increases over the past four years associated with the price shockfor these residential items added about $350 per household per year (including all factors).Thus, domestic energy price shocks have increased household energy bills by 25 percent. Thecomparison between 1999 and 2003 is even more dramatic, a $500 increase which representsa jump of over 35 percent.
Thus, not only is the figure large, but also it imposes a substantial direct and indirectburden on residential consumers. Large industrial consumers of natural gas have sufferedsevere disruptions, plant shut downs and job losses.
0
200
400
600
800
1000
1200
1400
1600
1800
2000
1997 1998 1999 2000 2001 2002 2003
Dol
lars
Per
Yea
r
G asoline Fuel O il and O ther Natura l G as B LS A ll HHN atura l G as RE CS A ll H H Total H H Petro leum -B ased
E xhibit II-9: H ousehold E nergy E xpenditures
Sources: Bureau of Labor S tatistics, C onsum er Expenditures, various years; Energy Inform ation A dm inistration, Residential Energy C onsum ption Surveys, 1997, 2001.

20
PROFITING FROM PRICE INCREASES IN CONCENTRATED MARKETS
If price increases are not caused by cost increases, they result in profit increases. Thus,after price, the second important indicator to which economic analysts look for signs of theexercise of market power and market failure is profits.
Tracking profits from publicly available sources is difficult because some of thecompanies do not break out domestic operations, while mergers make long term trendsdifficult to see and the allocation of one-time charges to specific lines of business arefrequently not identified.21 Very recent data gathered by the Department of Energy are notavailable, but general filings from the Securities and Exchange Commission are.
The bottom line for the domestic downstream industry, literally and figuratively, was asharp run up in oil company profits from refining and marketing in 2000 and 2001 (seeExhibit II-10). Net operating income (income before special items and taxes) tripled from
0
2 0 0 0
4 0 0 0
6 0 0 0
8 0 0 0
1 0 0 0 0
1 2 0 0 0
1 4 0 0 0
1 6 0 0 0
1 8 0 0 0
2 0 0 0 0
1 9 9 5 1 9 9 6 1 9 9 7 1 9 9 8 1 9 9 9 2 0 0 0 2 0 0 1 2 0 0 2 2 0 0 3
Y E A R
MIL
LIO
NS
OF
$
E x h ib it II -9 : R ef in in g /M a rk etin g N et O p e ra tin g In co m e S o u rce : E n e rg y In fo rm a tio n A d m in is tra tio n , P erfo rm a n ce P ro files o f M a jo r E n erg y P ro d u cers: 1 9 9 9 (W ash in g to n , D .C .: J an u ary 2 0 0 1 ); P erfo rm a n ce P ro file s o f M a jo r en erg y P ro d u cers: 2 0 0 1 (W ash in g to n , D .C .: J an u a ry 2 0 0 3 ); P erfo rm a n ce P ro files o f M a jo r E n erg y P ro d u cers: 2 0 0 2 (W ash in g to n , D .C .: F eb ru a ry 2 0 0 4 ).

21
1997-1999 to 2001. While profits were down in 2002, due to very low prices early in the yearas a result of the severe economic downturn and travel slowdown following September 11,they were still just above the levels of the late 1990s. They have skyrocketed since.
It should be noted that although 1999 was a slightly below average year, 2000 was anextremely good year. Fortune reported return on equity of 25 percent for the petroleumindustry in 2000,22 while Business Week reported 22 percent.23 This was almost twice thehistoric average for the industry and about 50 percent more than other large corporationsachieved.24 The extremely high profits for 2001 were not sustainable in the face of the weakeconomy of early 2002. Prices declined and profits fell early in 2002. By the end of 2002,profits had increased dramatically. The sharp price increases in 2003 produced another year ofrecord high profits.25
These profits are continuing. Although 2003 was a record year for both downstreamoperations and total industry profits, the first quarter of 2004 saw large increases in profits,especially in downstream operations. Including BP, which does not break out domestic U.S.operations, downstream profits were up 35 percent, while upstream profits were flat and totalindustry profits were up 17 percent. If we examine only domestic U.S. operations forcompanies that have both upstream and downstream operations, we find that downstream,domestic U.S. sector profits increased over 50 percent, while domestic upstream U.S. profitsincreased just under 10 percent. If the primary problem were foreign owners of energyresources pushing up the price, profit margins on domestic downstream operations would notbe soaring.
If we compare the annual after-tax profits of the companies listed by Business Week inthe oil and gas industry in the first four years of the new millennium to the last five years ofthe 1990s, we find a huge increase in profits (see Exhibit II-11). After-tax profits increased byover $50 billion, the equivalent of about $75 billion in pre-tax dollars. Exhibit II-8 is basedonly on the companies included in the Business Week survey, which account for less than halfof all domestic natural gas and crude oil production and about 80 percent of all refinerycapacity. Thus, on an industry-wide basis, the increase in after-tax profits in the 2000-2003period could be as high as $80 billion. Before taxes, the figure could be as much as $110billion. In all likelihood, that number will grow dramatically in 2004.
III. THE CAUSES OF DOMESTIC PRICE SHOCKS
To what can we attribute the dramatic shift in domestic pricing behavior? This chapterargues that concentration in the industry created the conditions for the exercise of marketpower over price by the petroleum industry. That concentration was the result of lax antitrustlaw enforcement by both the Clinton and Bush Administrations. They allowed too manymergers because they did not take the unique characteristics of the energy industry intoaccount. There are indications that the Clinton Administration began to recognize the mistake

22
in allowing industry structure to become so concentrated and began to criticize the industryand take steps against it. Thereafter, the Bush Administration was much more friendly to theindustry and showed little inclination to criticize it, not to mention to take steps to reign in itsmarket power. A price explosion followed.
THE MERGER WAVE
It was becoming obvious in mid-2000 was that the industry was becoming sufficientlyconcentrated in several parts of the country that competitive market forces were weak. Theproblem afflicts both the production of oil and gas and the downstream operations of the oilindustry.
The Department of Energy analyzes major U.S.-based energy producing companies ina program called the Federal Reporting System (FRS). Tracking the “Recent MergersAffecting Oil and Gas Producers,” the FRS report identified a total of 34 companies thatmerged into 13 (see Exhibit III-1) from 1997 to 2002.26 The previous year, the reportidentified 15 refining companies that had shrunk to seven (see Exhibit III-2).27
0
5
1 0
1 5
2 0
2 5
3 0
1 9 9 5 1 9 9 6 1 9 9 7 1 9 9 8 1 9 9 9 2 0 0 0 2 0 0 1 2 0 0 2 2 0 0 3
RET
UR
N O
N E
QU
ITY
B u s in e s s W e e k 9 0 0 O il a n d G a s
E x h ib it I I -1 0 : R e tu r n o n E q u ity : O il a n d G a s C o m p a n ie s S o u rc e : B u s in e s s W e e k 9 0 0 , a n n u a l r e s u l ts .

23
Exhibit III-1: Recent Mergers Affecting Frs Oil And Gas Producers Source: Energy Information Administration, Performance Profiles of Major energy Producers: 2002 (Washington, D.C.: February 2004), p. 20.

24
Exhibit III-2: Genealogy Of The 2001 FRS Refiners
Source: Energy Information Administration, Performance Profiles of Major energy Producers: 2001 (Washington, D.C.: January 2003), p. 78.

25
Of the 31 companies listed in the sector by Business Week in 1995, 21 engaged inmergers with other companies between 1997 and 2002. Of the 21 listed by Business Week in2003, 15 had engaged in mergers in the previous five years. Almost all of the mergersinvolved large companies that had previously been listed in the sector. The big got bigger anddomestic prices started ratcheting up soon thereafter.
EXERCISING MARKET POWER OVER PRICE
With increasing concentration, long-term strategic decisions by the industry aboutproduction capacity interact with short-term (mis)management of stocks to create a tightsupply situation that provides ample opportunities to push prices up quickly. Because thereare few firms in the market and because consumers cannot easily cut back on energyconsumption, prices hold above competitive levels for significant periods of time.
The problem is not a conspiracy, but the self-interested action of large companies withmarket power. With weak competitive market forces and high barriers to entry, individualcompanies have flexibility for strategic actions that raise prices and profits.28
• Individual companies can let supplies become tight in their area and keep stockslow, since there are few competitors who might counter this strategy.
• Companies can simply push prices up when demand increases because they haveno fear that competitors will not raise prices to steal customers.
• Individual companies do not feel compelled to quickly increase supplies withimports, because their control of refining and distribution ensures that competitorswill not be able to deliver supplies to the market in their area.
• Because there are so few suppliers and capacity is so tight, it is easy to keep trackof potential threats to this profit-maximizing strategy.
• Every accident or blip in the market triggers a price shock and leads to increasedprofits.
• Moreover, operating the complex system at very high levels of capacity placesstrains on the physical infrastructure and renders it susceptible to accidents.
It has become evident that stocks of product are the key variable that determines priceshocks.29 In other words, stocks are not only the key variable; they are also a strategicvariable. The industry does a miserable job of managing stocks and supplying product fromthe consumer point of view. Policymakers have done nothing to force them to do a better job.
If the industry were vigorously competitive, each firm would have to worry a greatdeal more about being caught with short supplies or inadequate capacity and would hesitate to

26
raise prices for fear of losing sales to competitors. Oil companies do not behave this waybecause they have power over price and can control supply. The capacity and stocks ofproduct on hand are no longer dictated by market forces, they can be manipulated by the oilindustry oligopoly to maximize profits.
A March 2001 FTC report, authored by Chairman Robert Pitofsky in response to thefirst post-2000 price spike, noted that by withholding supply, industry was able to drive pricesup, and thereby maximize profits.30 The FTC identified the complex factors in the spike andissued a warning:
The spike appears to have been caused by a mixture of structural and operatingdecisions made previously (high capacity utilization, low inventory levels, thechoice of ethanol as an oxygenate), unexpected occurrences (pipeline breaks,production difficulties), errors by refiners in forecasting industry supply(misestimating supply, slow reactions), and decisions by firms to maximizetheir profits (curtailing production, keeping available supply off the market).The damage was ultimately limited by the ability of the industry to respond tothe price spike within three or four weeks with increased supply of products.However, if the problem was short-term, so too was the resolution, and similarprice spikes are capable of replication. Unless gasoline demand abates orrefining capacity grows, price spikes are likely to occur in the future in theMidwest and other areas of the country.31
A 2003 RAND study of the refinery sector reaffirmed the importance of the decisionsto restrict supply. It pointed out a change in attitude in the industry, wherein “[i]ncreasingcapacity and output to gain market share or to offset the cost of regulatory upgrades is nowfrowned upon.”32 In its place we find a “more discriminating approach to investment andsupplying the market that emphasized maximizing margins and returns on investment ratherthan product output or market share.”33 The central tactic is to allow markets to become tightby “relying on… existing plant and equipment to the greatest possible extent, even if thatultimately meant curtailing output of certain refined product.”34
Indeed, many Rand discussants openly questioned the once-universalimperative of a refinery not “going short” – that is not having enough productto meet market demand. Rather than investing in and operating refineries toensure that markets are fully supplied all the time, refiners suggested that theywere focusing first on ensuring that their branded retailers are adequatelysupplied by curtailing sales to wholesale markets if needed.35
The RAND study drew a direct link between long-term structural changes and thebehavioral changes in the industry, drawing the connection between business strategies toincrease profitability and pricing volatility. It issued the same warning that the FTC hadoffered two years earlier:

27
For operating companies, the elimination of excess capacity represents asignificant business accomplishment: low profits in the 1980s and 1990s wereblamed in part on overcapacity in the sector. Since the mid-1990s, economicperformance industry-wide has recovered and reached record levels in 2001.On the other hand, for consumers, the elimination of spare capacity generatesupward pressure on prices at the pump and produces short-term marketvulnerabilities. Disruptions in refinery operations resulting from scheduledmaintenance and overhauls or unscheduled breakdowns are more likely to leadto acute (i.e., measured in weeks) supply shortfalls and price spikes.36
The structural conditions in the domestic gasoline industry have only gotten worse asdemand continues to grow and mergers have been consummated. The increases in prices andindustry profits should come as no surprise. The spikes in the refiner and marketer take at thepump in 2002, 2003, and early 2004 were larger than the 2000 spike that was studied by theFTC. The weeks of elevated prices now stretch into months. The market does not correctitself. The roller coaster has become a ratchet.
Increases in natural gas wellhead prices follow a similar pattern. The increases in mid-2000 were small compared to the much larger increases in 2001, 2003 and 2004. Thecombination of structural changes and business strategies has cost consumers hundreds ofbillions of dollars.
GASOLINE SUPPLY
There are two clearly identifiable trends affecting the supply side of the gasolinemarket – a reduction in capacity relative to demand and an increase in concentration. Thesetrends result from the business decisions of oil companies. Even the National Energy PolicyDevelopment Group recognized that the reduction in capacity was the result of businessdecisions of oil companies. Government did not choose to close refineries and carry muchlower stocks, private businesses did.37
Ongoing industry consolidation, in an effort to improve profitability, inevitablyleads to the sale or closure of redundant facilities by the new combinedownership. This has been particularly true of terminal facilities, which can leadto reductions in inventory and system flexibility. While excess capacity mayhave deterred some new capacity investments in the past, more recently otherfactors, such as regulations, have deterred investment.38
The prominent role of business decisions in reducing capacity raises the concern thatthese decisions are intended to reduce competitive market forces and secure market power formajor industry players. While mergers and acquisitions or facility closings are nominallyjustified by claims of efficiency gains, 39 they have a real economic effect of reducingcompetition.

28
Documents from the mid-1990s indicate that industry officials and corporate officerswere concerned about how to reduce capacity, with observations such as “if the U.S.petroleum industry doesn’t reduce its refining capacity, it will never see any substantialincrease in refinery profits,” from a Chevron Corporation document written in November1995. A Texaco official, in a March 1996 memorandum, said refinery overcapacity was “themost critical factor” facing the industry and was responsible for “very poor refining financialresults.”40
With oil companies merging and eliminating “redundant” capacity, it should not besurprising to find that capacity has not kept up. Refinery capacity has not expanded to keep upwith the growth in demand. Exhibit III-3 shows the relationship between refinery output anddemand. In 1985, refinery capacity equaled daily consumption of petroleum products. By2002, daily consumption exceeded refinery capacity by almost 20 percent.
0
5 0 0 0
1 0 0 0 0
1 5 0 0 0
2 0 0 0 0
2 5 0 0 0
1 9 7 5 1 9 8 0 1 9 8 5 1 9 9 0 1 9 9 5 2 0 0 0 2 0 0 1 2 0 0 2 2 0 0 3
Y E A R
THO
USA
ND
BA
RR
ELS
PER
DA
Y
R E F I N E R Y C A P A C I T Y P E T R O L E U M P R O D U C T S U P P L I E S
E x h i b i t I I I - 3 : R e f i n e r y C a p a c i t y a n d P r o d u c t S u p p l i e d
S o u r c e : U . S . D e p a r t m e n t o f E n e r g y , E n e r g y I n f o r m a t i o n A d m i n i s t r a t i o n , P e t r o l e u m S u p p l y A n n u a l , v a r i o u s i s s u e s , T a b l e s S 1 , 3 6 ; W e e k l y P e t r o l e u m S t a t u s R e p o r t , v a r i o u s i s s u e s .

29
In the early1980s, a public policy providing support for small refineries wasterminated. This accounted for the loss of about 100 refineries between 1980 and 1985 (SeeExhibit III-4). Since then, scores of other refineries have been shut down. Government did notclose refineries, private businesses did. In the 1990s alone, approximately 50 refineries wereclosed. Since 1995, over 20 refineries have been shut down. The number of operatingrefineries has been reduced by 13 percent since 1995. The refineries get larger, but smaller innumber and are owned by fewer and fewer entities. Over the last two decades of the twentiethcentury, the number of firms engaged in refining in the United States declined by two-thirds.41
Once these trends become clear, the complaint that no new refineries have been built inrecent years loses its compelling public policy impact.42 Similarly, blaming the decline ofcapacity relative to demand on the Clean Air Act does not stand close scrutiny. Consolidationof the refinery industry is a business decision that began long before changes in the Clean AirAct amendments of 1990 and continued after the adjustment to changes in gasolineformulation.
E x h i b i t I I I - 4 : R e f i n e r i e s a n d R e f i n e r y C a p a c i t y
0
5 0
1 0 0
1 5 0
2 0 0
2 5 0
3 0 0
3 5 0
1 9 7 0 1 9 7 5 1 9 8 0 1 9 8 5 1 9 9 0 1 9 9 5 2 0 0 0 2 0 0 3
NU
MB
ER O
F R
EFIN
ERIE
S
0
2
4
6
8
1 0
1 2
1 4
1 6
1 8
2 0
OPE
RA
BLE
REF
INER
Y C
APA
CIT
Y (0
00 B
AR
REL
S PE
R D
AY)
R E F I N E R I E S R E F I N E R Y C A P A C I T Y
S o u r c e : U . S . D e p a r t m e n t o f E n e r g y , E n e r g y I n f o r m a t i o n A d m i n i s t r a t i o n , P e t r o l e u m S u p p l y A n n u a l , v a r i o u s i s s u e s , T a b l e s S 1 , 3 6 .

30
Decisions about stockpiling of product is a business decision. Exhibit III-5 shows therelationship between stocks and demand for gasoline. Stocks are measured as the number ofdays of demand for gasoline held in storage. The exhibit shows that the amount of stockabove what is considered the lower operational inventory has declined. Because of the natureof operations of gasoline delivery systems, a certain level of stock is needed to keep thesystem running in real time (the lower operational level).43 Operations are subject todisruption should stocks fall below this level.44 It is the stocks above this level that areavailable to respond to shifts in demand or price. The reserves above the lower operationalinventory level have declined to very low levels. They generally are in the range of a coupleof days, compared to four or five days in the early 1990s and over a week in the 1980s.
Every investigation of every product price spike in the past several years points to“unusually low stock” as a primary driver.45 But stock levels are no accident; they are theresult of business decisions.
In analyzing the Midwest price spike of 2000, the Department of Energy again foundstocks to be the culprit, starting an analysis entitled Supply of Chicago/Milwaukee GasolineSpring 2000 as follows:
E x h ib it I I I -5 : G a s o l in e S to c k s O n H a n d S o u rc e : U . S . D e p a r tm e n t o f E n e r g y , E n e r g y In fo r m a t io n A d m in is t r a t io n , M o n th ly E n e r g y R e v ie w , v a r io u s i s s u e s a n d d a ta b a s e .
0
1
2
3
4
5
6
7
1 9 8 5 1 9 8 6 1 9 8 7 1 9 8 8 1 9 8 9 1 9 9 0 1 9 9 1 1 9 9 2 1 9 9 3 1 9 9 4 1 9 9 5 1 9 9 6 1 9 9 7 1 9 9 8 1 9 9 9 2 0 0 0 2 0 0 1 2 0 0 2 2 0 0 3
DA
YS S
UPP
LY
ON
HA
ND
A B O V E L O W E R O P E R A T IO N A L IN V E N T O R Y

31
This summer’s run-up in Midwest gasoline prices, like other recent pricespikes, stemmed from a number of factors. The stage was set for gasolinevolatility as a result of tight crude oil supplies, which led to low product stocksand relatively high crude oil prices. With little stock cushion to absorbunexpected events, Midwest gasoline prices surged when a number of supplyproblems developed, including pipeline and refinery supply problems, and anunexpectedly difficult transition to summer-grade Phase II reformulatedgasoline.46
In explaining the early spring price run-up in 2001, inventories were the starting point:“Low petroleum inventories set the stage for our current situation, as they did last year bothfor heating oil and for gasoline.”47
After the recession of 2001/2002, industry experts and Department of Energy officialsagain had to wring their hands in 2003 about tight supplies, refineries that are running atcapacity and difficult transitions to new fuels, but deny any wrongdoing.48 The explanationsthey offer are more like excuses than analysis. For example, the following excerpt from theEnergy Information Administration Summer 2003 Motor Gasoline Outlook gives a flavor ofthe effort to gloss over fundamental problems:
This summer, motor gasoline markets are expected to be tighter than lastsummer. Total spreads (retail price, excluding taxes, minus crude oil prices)are expected to average 55 cents per gallon compared to 41 cents per gallon in2002. This results primarily from higher refinery utilization brought about bythe increase in demand combined with low beginning-of-season inventorylevels. But the projected spread is less than the 58 cents observed in thesummer of 2001, when stocks were at record low levels and the Midwestsuffered from ethanol-related blending problems.49
The EIA tried to soften the blow of a very high spread by comparing it to theastronomical level of 2001, rather than the level of 2002, which was itself significantly higherthan the 1995-1999 average. The summer did not go as the EIA expected. The only thing thatseems to be predictable is that we will not have enough stocks on hand to deal with theinevitable accidents and incidents that seem to drive up prices.
The tight supply-demand balance that results from industry decisions to closerefineries may also contribute directly to the occurrence of accidents. The extremely highcapacity utilization that creates high levels of profit also puts additional stress on equipment.50
Over the course of the last decade, the number of gasoline stations has declined aswell, while the number of vehicles that need to be supported has grown. The number ofgasoline stations has declined by 16 percent, from 210 thousand to 176 thousand. The numberof motor vehicles has increased by 11 percent, from 189 million to 210 million. As aconsequence, the number of motor vehicles per station has increased by 32 percent. Eachstation pumps more gas, but there are fewer competitors.

32
NATURAL GAS SUPPLY
Behavior patterns in natural gas raise similar concerns. They cast doubt on the recentclaim of the National Petroleum Council that the perception of the natural gas resource basehas suddenly changed.51 First, as a factual matter, non-industry analysts disagree.52 Second, tothe extent that there is a change in resource recovery, it reflects business decisions made over anumber of years.
The move of the majors into gas changed the nature of the sector.53 Decisions by themajors to acquire reserves through mergers and acquisitions, rather than exploration, shiftedresources.54 Decisions about which types of wells to drill may change replacement rates.55
Exhibit III-6 shows another coincidence that cannot be ignored. The consolidation in theindustry came hand-in-hand with the shift to acquisition of resources through merger (ratherthan exploration) and a shift of drilling away from exploration. A couple of years later theNPC concludes that a change in the resource base is evident. Decisions about which well toproduce and which well to cap, how much to inject into storage, how to use pipeline capacityand, ultimately, how to report prices are affected by business decisions.
Standard and Poor’s has recently noted that this trend has continued and raisedquestions about it:
It is unclear that producers are investing enough to grow production materially– and this follows a year [2003] in which the domestic gas production(including acquisitions) of integrated producers appears to have declined…
[M]ajor integrated companies, which appear to be reinvesting only 30 to 40percent of their domestic cash flow in the United States, have made strategicdecisions to allow their shallow-water and onshore natural gas production todeplete to redeploy capital to international (mainly oil) projects.56
It is also important to recognize in the case of natural gas that the trading markets thatdrive the wellhead price are quite new. Most were set up in the 1990s, as part of therestructuring of the natural gas industry.57 Enron played a large role in these markets andwhen it collapsed, so too did much private trading.58 Today, the markets are “very thin” andthat raises concerns about trading,59 but the evidence is mounting that manipulation andabusive practices have long been part of these markets.60
Thus, it should not be surprising to find that capacity has not kept up and stockpilesare chronically low, causing markets to be tight; that was the outcome the industry sought toachieve with its wave of mergers and consolidation.
For natural gas we find a concern about stocks that is similar to the issue in gasolinemarkets. Here the question of stocks is very much influenced by the need to build stockpilesto meet the inevitable surge in demand during the winter heating season.61 One recent study

33
found the volatility of natural gas prices to be greater than oil prices because of the nature ofthe infrastructure required to deliver natural gas to consumers:
The dependence of natural gas on more inflexible sources of supply and thegreater role of transportation opens the window to profiteering. It appears thatvolatility in natural gas returns is more persistent than volatility in oil returns.By itself, this result suggests that there may be a ‘larger window of profitopportunity’ for investors in natural gas than in oil….
PERCENT OF NATURAL GAS WELLS DRILLED FOR EXPLORATION
0
2
4
6
8
10
12
14
1993 1994 1995 1996 1997 1998 1999 2000 2001 2002
PEC
ENT
OF
WEL
LS
CO
MPL
ETED
Exhibit III-6: Shifts In O rientation O f FRS C om panies In Acquisition And Developm ent O f Natural Gas Resources
Source: Energy Inform ation Adm inistration, Perform ance Profiles of M ajor Energy Producers: 2002, February 2004, p. 82; Table B-16, Performance Profiles of M ajor Energy Producers: 1999, January 2001, B-16.

34
[N]atural gas return volatility responds more to unanticipated events (e.g.supply interruptions, changes in reserves and stocks, etc.), regardless of whichmarket they originate in… For example, a major event-causing shock will leadto an immediate increase in volatility in natural gas returns and culminate in a(relatively) prolonged period of volatility. If prices and thus returns rise inresponse to volatility, there may be immediate profit opportunities in naturalgas following shocks in either market.62
The long-term trend to much lower stocks relative to demand is clear in natural gas aswell (see Exhibit III-7 and III-8). Compared to the decade of 1985-1994, stocks were about 25percent lower in the 1995-1999 period. During the price spikes of the new millennium, thesecond half of 2000 and the first half of 2001 and 2003, stocks were 40 to 50 percent lower
Exhibit III-7: Natural Gas Storage Since 1985
Source: Energy Information Administration, Natural Gas Storage: Historical Data, database
0
500,000
1,000,000
1,500,000
2,000,000
2,500,000
3,000,000
3,500,000
4,000,000
Mill
ion
Cub
ic F
eet
April May June JulyAugust September October NovemberDecember January February March

35
than in the 1985-1994 period and 25 percent lower than in the 1995-1999 period. Thesedeclines came during a period of a small increase in consumption. Exhibit III-8 can be used tomake another point. By the fall of 2003, stocks of natural gas had rebounded to typical levelsof previous years, yet prices did not moderate. This set off another round of complaints aboutmarket manipulation.63 There are now investigations into the misreporting of gas in storage.64
Exhibit III-8: Working Gas Stocks Since 1995
Source: Energy Information Administration, Natural Gas Storage: Historical Data, database
0
500
1000
1500
2000
2500
3000
3500
Jan.
95
Jan.
96
Jan.
97
Jan.
98
Jan.
99
Jan.
00
Jan.
01
Jan.
02
Jan.
03
Jan.
04
BIL
LIO
NS
OF
CU
BIC
FEE
T
Price Spikes

36
IV. WEAK MARKET FUNDAMENTALS PUT ENERGYCONSUMERS AT INCREASED RISK
Aside from Chairman Pitofsky’s analysis of the 2000 gasoline price spike in the upperMidwest, which came after his agency had approved a large part of the mergers that made upthe wave, the FTC has generally been uncritical of conditions in the industry. In part thisstems from the fact that the FTC views the situation through the very narrow lens of antitrust.In the case of a price spike, it is looking for collusive behavior that drives prices up, but thesemarkets do not require collusion to be manipulated.
When Pitofsky finds that unilateral strategic actions in the long term have tightened themarket and short-term tactics take advantage of this tightness, he identifies a public policyproblem that is not strictly an antitrust problem at one level. Things may be bad, but there isnothing antitrust authorities can do about it. At another level, however, there is a fundamentalflaw in the approach taken by the FTC. As the agency responsible for evaluating mergers inthe industry, it has allowed the concentration to take place. Applying routine antitruststandards in its review, it could find no individual mergers it felt violated the antitrust laws. Afew minor divestitures were ordered, but the merger wave was allowed to unfold largelyunimpeded.
The problem is that the FTC has failed to recognize the unique conditions of theenergy industries. Because of the unique conditions of supply and demand in energy markets,market power can be abused at much lower levels of concentration than is normally the case.The Merger Guidelines invite just such an analysis; the FTC has failed to consider thepossibility. Confronted with a market structure in which consumers are being abused, insteadof taking a narrow view, the FTC should consider how to address the problem.
ANTITRUST AND PUBLIC POLICY
Antitrust practice is based on the structure, conduct, performance paradigm (SCP),which has been the dominant approach for almost three-quarters of a century.65 In SCPanalysis the central concern is with market performance, since that is the outcome that affectsconsumers most directly. The concept of performance is multidimensional. The measures ofperformance to which we traditionally look are pricing, quality and profits. Pricing and profitsaddress both efficiency and fairness. They are the most direct measure of how society’swealth is being allocated and distributed. The performance of industries is determined by anumber of factors, most directly the conduct of market participants. Do they compete? Whatlegal tactics do they employ? How do they advertise and price their products?
Conduct is affected and circumscribed by market structure. Market structure includesan analysis of the number and size of the firms in the industry, their cost characteristics andbarriers to entry. Basic conditions of supply and demand also deeply affect market structure.

37
The focal point of market structure analysis is to assess the ability of markets tosupport competition, which “has long been viewed as a force that leads to an ideal solution ofthe economic performance problem.”66 Pure and perfect competition is rare, but thecompetitive goal is important.67 Therefore, a great deal of attention has been focused on therelative competitiveness of markets and the conditions that make markets more competitive orworkably competitive.68 Further, specific measures of the extent of market power based onelasticities of supply and demand and market concentration (measured by the market shares offirms) have been developed.69
The multidimensional view of markets offered by the SCP framework fits thefundamental economic traits of energy production and consumption well. Energy markets arehighly complex. Their volatility poses particular challenges for policy and economic analysis.
Contrasting energy commodities to financial instruments like stocks and bonds, arecent book entitled Energy Risk identified the uniqueness of energy markets. The keyelements are the supply-side difficulties of production, transportation and storage, and thedemand-side challenges of providing for a continuous flow of energy to meet inflexibledemand, which is subject to seasonal consumption patterns.
[T]he deliverables in money markets consist of a “piece of paper” or itselectronic equivalent, which are easily stored and transferred and areinsensitive to weather conditions. Energy markets paint a more complicatedpicture. Energies respond to the dynamic interplay between producing andusing; transferring and storing; buying and selling – and ultimately “burning”actual physical products. Issues of storage, transport, weather andtechnological advances play a major role here.
In energy markets, the supply side concerns not only the storage and transfer ofthe actual commodity, but also how to get the actual commodity out of theground. The end user truly consumes the asset. Residential users need energyfor heating in the winter and cooling in the summer, and industrial users’ ownproducts continually depend on energy to keep the plants running and to avoidthe high cost of stopping and restarting them. Each of these energy participants– be they producers or end users – deals with a different set of fundamentaldrivers, which in turn affect the behavior of energy markets…
What makes energies so different is the excessive number of fundamental pricedrivers, which cause extremely complex price behavior.70
Prices run up quickly because of even slight disruptions in the supply-demand balanceand producers are slow to react because they do not fear that others can bring product tomarket and steal their business. Consequently, prices are said to be “sticky downward.”71 Themajority of published studies find support for the “rockets and feathers” view.72 Prices riselike rockets and float down like feathers.73 When energy markets become as concentrated asthey are in America, the feathers do not float all the way down.

38
DEMAND IS INELASTIC
The continuous flow of large quantities of product to meet highly seasonal demand isthe central characteristic of the demand side of the market. In order to design proper policiesto deal with energy demand and how it affects the market, we must have an appreciation forwhy people use energy as they do. Examining price and income elasticities leads to theconclusion that energy is a necessity of daily life. Recognizing this fact leads to policychoices that can have the greatest impact while imposing the least cost and inconvenience onconsumers.
Energy consumption is determined by the physical and economic structure of daily life.People need to drive on a daily basis because of the way our communities are built and ourtransportation systems designed. Stores are far from homes. Homes are far from work.Social and after-school activities are dispersed. In most communities, mass transit is scarceand inconvenient. It is necessary to drive to get from here to there. We own more cars anddrive more miles on a household basis over time. These trends and patterns have becomestronger and more deeply entrenched as our society has become wealthier and the tendency fortwo-earner households has grown. For the past three decades there has been an almost perfect,one-to-one correspondence between economic growth and the growth of total miles driven.74
People consume natural gas for heating primarily and, increasingly, indirectly forelectricity. The amount they consume is dictated in large part by the kinds of buildings inwhich they live and work and the energy efficiency of the appliances they use. Natural gas hasbecome the fuel of choice in many residential uses. It has been the favorite of the electricityindustry for about a decade.
The result of the underlying socioeconomic determinants of automobile travel is torender gasoline demand “inelastic.” The demand elasticity for gasoline has been studiedhundreds of times in the U.S. and abroad. The best estimate of short-term elasticity (usuallymeasured by demand response in a period of about a year) is -.2.75 In other words, whenprices increase by 10 percent, demand declines by only 2 percent. The best estimate of thelong-term elasticity is about -.4.76 Both of these are quite low.
While fewer estimates of the elasticity of demand for natural gas have been made, theresults are similar.77 Short-term elasticities are in the range of .3, long-term elasticities are inthe range of .6. An occasional estimate of long-term elasticity is in the neighborhood of 1.0,which is not sufficient to discipline market power.
Demand is generally predictable in a seasonal pattern (as shown in Exhibits IV-1 andIV-2). With demand quite predictable and inelastic, price is determined by the supply side.The flow of product and stockpiles are critical. Supplies must be adequate to deal with shiftsin demand. Demand may help to set the stage, but it is supply that provides the action.

39
The low elasticity of demand is the critical factor in rendering the energy marketvolatile and vulnerable to abuse. When demand is inelastic, consumers are vulnerable to priceincreases, since they cannot cut back on or find substitutes for their use of the commodity.When the most important market force in disciplining market power, demand elasticity, is aslow as observed for gasoline and natural gas, there are many opportunities to exercise marketpower.
SUPPLY IS INELASTIC
Short-term supply in the energy industry is also extremely inelastic. That is, it cannotbe quickly increased. The key elements are the supply-side difficulties of production,transportation and storage for providing for a continuous flow of energy.78
Because of the nature of the underlying molecules, the production, transportation anddistribution networks are extremely demanding, real time systems. Energy is handled at highpressure, high temperature and under other physical conditions that are, literally, explosive.These systems require perfect integrity and real time balancing much more than other
0
1 00 0
2 00 0
3 00 0
4 00 0
5 00 0
6 00 0
7 00 0
8 00 0
9 00 0
10 00 0
JA -9
5
MY S
JA -9
6
MY S
JA -9
7
MY S
JA -9
8
MY S
JA -
99 MY S
JA -
00 MY S
JA -0
1
MY S
JA -0
2
MY S
JA-0
3
MY S
JA-0
4
M O N T H S A N D Y E AR
THO
USA
ND
BA
RR
ELS
PER
DA
Y
E x h ib it IV -1 : G a so lin e C o n su m p tion S o u rce : U .S . D epa rtm en t o f E ne rg y, E n erg y In fo rm atio n A dm in is tra tio n , M on th ly E nerg y R eview , v ario us issu es an d d a tab ase .

40
commodities. Transportation and distribution infrastructure is extremely capital intensive andinflexible. Many sources of energy are located far from consumers, requiring transportationover long distances. The commodities are expensive to transport and store. They aredelivered over a network that is sunk in place with limited ability to expand in the short andmedium term.
Refineries, storage facilities and pipelines are not only capital intensive, but they takelong lead times to build. They have significant environmental impacts. In the short term, theircapacity is relatively fixed. Refineries must be reconfigured to change the yield of products.Although pipelines have largely depreciated their historic, sunk costs, expansion would becapital intensive. Thus, pipeline capacity is generally a fixed capacity as well.
Accidents have a special role in networks such as these. Because of the demandingphysical nature of the network, accidents are prone to happen. Because of the volatile nature
0
5 0 0
1 0 0 0
1 5 0 0
2 0 0 0
2 5 0 0
3 0 0 0
JA -9
5
MY S
JA-9
6
MY S
JA-9
7
MY S
JA-9
8
MY S
JA-9
9
MY S
JA-0
0
MY S
JA -0
1
MY S
JA -0
2 M S
JA-0
3 M S
JA-0
4
MC
F
A L L U S A G E A L L T R E N D
E x h ib it IV -2 : S e a s o n a lity o f N a tu r a l G a s C o n su m p tio n S o u rc e : U .S . D e p a r tm e n t o f E n e rg y , E n e rg y In fo rm a tio n A d m in is tra t io n , M o n th ly E n e rg y R e v ie w , v a r io u s is su e s a n d d a ta b a s e .

41
of the commodity, accidents tend to be severe. Because of the integrated nature of the networkand demanding real time performance, accidents are highly disruptive and difficult to fix.
These physical and economic characteristics render the supply-side of the marketinelastic.79 Given the basic infrastructure of supply in the industry, the availability of excesscapacity and stocks to meet changes in demand is the critical factor in determining theflexibility of supply. Since output is slow to respond to price, stockpiles, storage andimportation of product become critical elements of the gasoline market.80
Stocks are the key factor in policy responses to market power where supply is inelastic.
Economic frictions (including transportation, storage, and search costs) whichimpede the transfer of the underlying commodity among different partiesseparated in space or time can create the conditions that the large trader canexploit in order to cause a supracompetitive price…
Although the formal analysis examines transportation costs as the source offriction, the consumption distortion results suggest that any friction that makesit costly to return a commodity to its original owners (such as storage costs orsearch costs) may facilitate manipulation.
The extent of market power depends on supply and demand conditions,seasonal factors, and transport costs. These transport cost related frictions arelikely to be important in many markets, including grains, non-precious metals,and petroleum products.
Transportation costs are an example of an economic friction that isolatesgeographically dispersed consumers. The results therefore suggest that anyform of transaction costs that impedes the transfer of a commodity amongconsumers can make manipulation possible…
All else equal, the lower the storage costs for a commodity, the more elastic itsdemand.81
THE GAS GUZZLER PROBLEM
The ability of producers to exercise market power on the supply side is magnifiedimmensely when the supply-demand balance is tight. High levels of demand strain resourcesand make it difficult to keep stock up. During the 1990s, America shot itself in thepocketbook by building two fleets of gas guzzlers that are helping to keep energy markets tight– low mileage Sport Utility Vehicles/light trucks and natural gas-fired power plants.
Exhibit IV-3 shows that improvement in average gas mileage stopped in the 1990s,primarily because of the increasing use of light trucks, whose fuel efficiency has declined.Overall, average mileage has declined because of the increased use of less efficient SUVs andlight trucks.

42
If the rate of improvement in the fleet fuel efficiency had been maintained at historicallevels throughout the 1990s, America would be consuming over one million barrels per dayless of gasoline.82 Gasoline savings of that magnitude would have offset the entire decline ofdomestic production during the 1990s,83 a figure that would have alleviated the tight gasolinemarkets and made them much less vulnerable to price shocks. Determined efforts can achievea much higher level of efficiency in the automobile fleet.
Exhibit IV-4 shows the consumption of natural gas. Overall consumption grewbecause of the increased consumption in the electricity sector. This increased consumption bygas fired generating plants shifted the pattern of demand more heavily into the summermonths. As a result, it has become more difficult to put gas in storage in preparation for thewinter heating season. The increase in natural gas consumption in the electricity sector is
0
5
1 0
1 5
2 0
2 5
1973
1975
1977
1979
1981
1983
1985
1987
1989
1991
1993
1995
1997
1999
2001
Y E AR
MIL
ES P
ER G
ALL
ON
P A S S E N G E R C A R SL IG H T T R U C K SA LL V E H IC L E S (Inc lud es A ll T rucks)
E xh ib it IV -3: M otor V eh ic le F u el E fficien cy
S ource: U . S . D epartm en t of E nerg y, E nergy In fo rm ation A dm inistration , M onthly E nergy R eview , T able 1 .10 .

43
equal to about ten percent of total production and 50 percent of natural gas imports.84 Heretoo, vigorous promotion of efficiency could substantially reduce consumption and alleviatepressure on natural gas markets.85
CONCENTRATION IN THE PETROLEUM INDUSTRY CREATES MARKET POWER
Antitrust authorities have traditionally used two measures of market concentration.The four firm concentration ratio is equal to the market share of the four largest firms. If thefour largest firms control 60 percent or more of the market, the market is a tight oligopoly.86
The HHI (Hirshman Herfindahl Index), used by the Department of Justice, is the sum of the
0
5000
10000
15000
20000
25000
1985
1986
1987
1988
1989
1990
1991
1992
1993
1994
1995
1996
1997
1998
1999
2000
2001
2002
TRIL
LIO
N
CU
BIC
FEE
T
TOTAL TOTAL MINUS ELECTRICITY
Exhibit IV-4: Natural Gas Consumption
Source: U. S. Department of Energy, Energy Information Administration, Monthly energy Review, Table 4.4.

44
square of the market shares of all firms in a market. Under its Merger Guidelines, the DOJconsiders a market with an HHI of 1000 or less to be unconcentrated. Such a market wouldhave the equivalent of ten equal-sized competitors. In such a market, the four firmconcentration ratio would be 40 percent. Any market with a concentration above this level isdeemed to be a source of concern. The DOJ considers an HHI of 1800 as the point at which amarket is highly concentrated. This level falls between five and six equal-sized competitors.
The fallacy of blindly applying the statistical formula for market structure analysis waspointed out over two decades ago by two prominent conservative economists. William Landesand Richard Posner use the Lerner index,87 which measures the amount by which prices can beset above costs as the result of the exercise of market power, and is directly related to theHHI.88
Landes and Posner underscore the importance of the elasticity of demand.89 Theypoint out that when demand elasticities are low, market power becomes a substantial problem.In their words, the Lerner Index “comes apart.”
[T]he formula “comes apart” when the elasticity of demand is 1 or less. Theintuitive reason is that a profit-maximizing firm would not sell in the inelasticregion of its demand curve, because it could increase its revenues by raisingprice and reducing quantity. Suppose, for example, that the elasticity of demandwere .5. This would mean that if the firm raised its price by one percent, thequantity demanded of its product would fall by only one-half of one percent.Thus its total revenues would be higher, but its total costs would be lowerbecause it would be making fewer units of its product.
Raising price in these circumstances necessarily increases the firm’s profits,and this is true as long as the firm is in the inelastic region of its demand curve,where the elasticity of demand is less than 1.
If the formula comes apart when the elasticity of demand facing the firm is l orless, it yields surprising results when the elasticity of demand is just a littlegreater than 1. For example, if the elasticity of demand is 1.01, equation (la)implies that the firm’s price will be 101 times its marginal cost. There is asimple explanation: a firm will produce where its demand elasticity is close toone only if its marginal cost is close to zero, and hence a relatively low pricewill generate a large proportional deviation of price from marginal cost.90
Leonard Waverman notes that by comparison to most industries and standard antitrustpractice, the elasticity of demand in energy industries is quite low:
Arguing that a CED [cross elasticity of demand] of 1 is ‘high’ is equivalent toarguing that an own-price elasticity of 1.0 is high, an argument which wouldnot generally be made. In anti-trust economics own price elasticities wellabove one are considered as connoting a lack of market power. In his survey of

45
the empirical literature in the field of industrial organization, “a firm with suchan elastic demand curve [elasticity of demand about 12] has little marketpower.”91
A second problem with the myopic FTC approach stems from the narrow search forcollusion. The Merger Guidelines recognize that market power can be exercised withcoordinated, or parallel, activities and even unilateral actions in situations where there aresmall numbers of market players.92 The area of noncollusive, oligopoly behavior has receiveda great deal of attention. A variety of models have been developed in which it is demonstratedthat small numbers of market participants interacting in the market, especially on a repeatedbasis, can learn to signal, anticipate, and parallel one another to achieve outcomes that capturea substantial share of the potential monopoly profits.93
Nevertheless, even by traditional standards, the wave of industry mergers noted abovehas resulted in a level of concentration that creates the basis for business behaviors andstrategies that can exploit market power. Several major mergers between vertically integratedcompanies in the top tier of the oil industry have pushed petroleum product markets to levelsof concentration that are a serious concern.
Exhibit IV-5 shows the two measures of market concentration. Over the past decadewhen a host of mergers were approved, antitrust authorities did not take the fundamentalssufficiently into account in reviewing mergers. They have prevented a few local markets frombecoming highly concentrated, but that was far too lenient a standard. Because supply anddemand are so inelastic and vertical leverage is so important, antitrust authorities should haveinsisted that markets remain unconcentrated (i.e., below the moderately concentratedthreshold).
The recent mergers have pushed three of the country’s five regional refining markets(Petroleum Administrative Defense Districts or PADD) into a danger zone of concentration.This concentration reflects a business decision in which “operating refineries have sought toconcentrate their activities in markets where they hold a leading market share.”94 There hasclearly been a sharp increase in the level of concentration in all markets except the MountainWest. The East Coast, Mountain West and West Coast all fall well above the unconcentratedzone. The upper Midwest is close to the lower limit of the concentrated zone based on HHI,with the four firm concentration ratio moving well above the unconcentrated level.
Product markets are much smaller than refinery markets. That is, while refineries mayserve a broad area, most consumers buy virtually all of their gasoline in the metropolitan areain which they live. Most studies of gasoline prices use the metropolitan area as the unit ofanalysis. While we lack data on a city-by-city basis, some data is readily available on a state-by-state basis. It confirms that the trend of increasing concentration has brought the industryto a level that is a source of concern.
Exhibit IV-5 includes analyses of California, Illinois, Wisconsin and Connecticut basedon the number of branded gasoline stations in each state. We have selected a time frame

46
similar to that of the prior refinery analysis. California was selected because the West isfrequently mentioned in discussions of high gasoline prices. There was also a U.S.Department of Energy study available for comparison. Illinois and Wisconsin were selectedbecause they have been focal points of concern in recent price spikes. Connecticut is includedbecause it represents another PADD and there was a separate analysis available forcomparison.
We observe sharp increases in concentration in each of these states. Each is now wellinto a range of concentration that is a source of concern for competitiveness. The level ofconcentration we estimate on the basis of outlets is consistent with the other analyses that arebased on volume of sales.
E x h ib it I V -5 : C o n c e n tr a t io n in D o m e s t ic D o w n s tr e a m G a s o lin e O p e r a t io n s C o n c e n tr a t io n O f R e f in e r ie s I n R e g io n a l M a r k e ts 1 9 9 4 2 0 0 0 P E T R O L E U M A D M IN . H H I 4 -F IR M H H I 4 -F IR M D E F E N S E D IS T R IC T (P A D D ) C R C R I . E a s t C o a s t 1 2 9 7 6 2 2 0 0 7 7 7 I I . U p p e r M id w e s t 7 3 1 4 0 9 8 0 5 2 I I I . G u lf C o a s t 4 5 3 2 9 7 5 3 4 2 IV . M o u n ta in W e s t 1 0 0 0 4 9 1 0 6 1 5 1 V . W e s t C o a s t 1 0 3 7 5 4 1 3 7 6 6 7
C o n c e n tr a t io n O f G a s o lin e D is tr ib u t io n I n S ta te M a r k e ts
S ta te 1 9 9 4 1 9 9 9
H H I 4 -F irm H H I 4 -F irm
C a lifo rn ia 1 1 4 3 6 0 1 4 3 2 7 3 C o n n e c tic u t 1 0 2 2 5 3 1 4 1 5 6 5 I l l in o is 1 0 5 3 5 5 1 3 1 1 6 3 W is c o n s in 1 1 7 5 6 5 1 4 0 0 6 6 S o u rc e s : R e f in e r y : U .S . D e p a r tm e n t o f E n e rg y , E n e rg y In fo rm a tio n A d m in is tra t io n , P e tr o le u m S u p p ly A n n u a l 1 9 9 9 , V o lu m e 1 (J u n e 2 0 0 0 ) ; T a b le 3 8 fo r m a rk e t s h a re s , p . 1 2 2 fo r P A D D s . T h e s ta te s in e a c h P A D D a re a s fo l lo w s I = M E , N H , V T , M A , R I, C T , N Y , N J , P A , W V , D E , M D , V A , N C , S C , G A , F L ; I I= O H , M I, IN , K Y , T N , IL , W I, M N , IA , M O , O K , K S , M B , S D , N D , I I I= A L , M I, A K , L A , T X , N M ; IV = M T , W Y , C O , U T , ID ; V = W A , O R , N V , A Z , C A , H I A K . G a s o lin e : N a tio n a l P e tr o le u m N e w s , A n n u a l S u rv e y o f O u tle ts ; L u n d b e r g , C o n n e c tic u t M a r k e t R e p o r t: F e b r u a r y , 1 9 9 9 ; D O E , U .S . D e p a r tm e n t o f E n e rg y , E n e rg y In fo rm a tio n A d m in is tra t io n , A s s e s s m e n t o f S u m m e r 1 9 9 7 M o to r G a s o lin e P r ic e In c r e a s e , M a y 1 9 9 8 , p . 6 4

47
The previous discussion focuses on horizontal concentration. Vertical integrationbetween segments of the industry may have an impact as well. Vertical integration bydominant firms may create a barrier to entry requiring entry at two stages of production,95 orforeclosing critical inputs for competitors in downstream markets.96 Vertical arrangementsmay restrict the ability of downstream operators to respond to local market conditions.97
Vertical integration not only removes important potential competitors across stages ofproduction,98 but also may trigger a wave of integrative mergers,99 rendering smallindependents at any stage extremely vulnerable to a variety of attacks.100
Gasoline markets are vulnerable to the negative effects of vertical integration. Productmust move downstream from the refinery or the tanker to the pump. Vertically integratedoperations are closed to independent sources of supply. They may impose zonal pricingformulas or restrictions on sources of supply on their distribution outlets.101 With verticalintegration, the market may be less responsive than it could be both in the short term, sincecompeting product has difficulty getting into individual markets at the end of a vertically102
integrated chain, and in the long term because new competitors in any market may have toenter at several stages of the business.
An interesting study of cities across the country as well as the first merger in the waveof late 1990s mergers (the Tosco/Unocal merger of 1997) finds support for this concern. Thestudy finds that both horizontal concentration and vertical integration are associated with highprices:
Upstream concentration is positively correlated with price, the market share ofindependents is negatively correlated with price and the average market shareof the vertically integrated suppliers covaries positively with wholesale price…
Moreover, the incentive to raise price is also positively correlated with thegeographic proximity of integrated stations to rival independents, indicatingthat the greater the degree of competition, or cross-price elasticity, betweenintegrated retailers and rival independent retailers, the greater the integratedfirm’s incentive to raise rivals’ wholesale costs.103
In light of these findings, the integration of refining and distribution is important. Thepercentage of stations owned by companies that also own refineries did not change much overthe decade, but the size of the largest integrated owners increased dramatically. The integratedcompanies also appear to be more regionalized.104 Each company covers a smaller area moredensely, resulting in less competition.
We do not have similarly detailed analysis of the natural gas market, but the courtruling in the lawsuit against Enron can make the point. “Enron was positioned to yank pricesup because its Enron Online [EOL] trading platform controlled fully 40 percent of averagedaily trading on the Henry Hub natural gas spot market. Further, other traders in that market“routinely looked to EOL and Enron for current [Henry Hub] spot market pricinginformation,” according to the CFTC complaint.”105 The Henry Hub is the most important

48
price setting spot market in the nation. That would virtually ensure that the hub was highlyconcentrated at that time.
These levels of concentration would cause concern in any industry, but in the energyindustries they are of extreme concern because the underlying market forces are weak.Because the supply and demand elasticities for gasoline and natural gas are so low106 and theexpenditures on energy are so large,107 we believe these industries should be held to closescrutiny because the exercise of market power results in higher prices.108 Antitrust authoritieshave failed to exercise proper caution to protect the public interest and consumers aresuffering as a result.
V. PUBLIC POLICY
It may seem a bit odd to spend time arguing that the attitude of the Administration inWashington toward the energy industry is important. It goes without saying that it is. Theclose association of both the President and Vice President with the petroleum industry and theaggressive pro-industry position it has taken raises this issue to another level. First, thecoincidence between the election of November 2000 and the dramatic increase in prices thatfollowed raises a question – is there a causal link behind the correlation? Second, the searchfor policy in an atmosphere of crisis is deeply affected by the Administration’s attitude.
POLICY ORIENTATION MATTERS
There is no doubt that the Bush Administration represented a dramatic shift in policy.The National Energy Policy Development Group was formed under Vice President Cheney inthe spring of 2001. As we have seen, crude oil prices were well off their historic highs at thatmoment, while the domestic spread was at the first of several peaks. Nevertheless, when theNEPDG released its report, the underlying problem was portrayed as one in which“overdependence on any one source of energy, especially a foreign source, leaves usvulnerable to price shocks, supply interruptions and in the worst case, blackmail.”109 Theresulting policy recommendations were tilted strongly in favor of the industry.110 The VicePresident quickly became embroiled in controversy over questions of excessive industryinfluence in its deliberations, a dispute that is still pending in the Supreme Court.111
The high level of engagement of energy industry executives, like Enron’s CEO KenLay, in securing the rapid appointment of a new Chairman at the Federal Energy RegulatoryCommission (FERC), which oversees the natural gas industry, and in gaining access to thepolicy process was another favorable signal to the industry.112 The subsequent refusal of theAdministration to recognize that manipulation had played a large part in the California energycrisis and the delayed and minuscule penalties imposed sent another signal to industry.113 The

49
timid approach the FERC took in response to reports of natural gas price manipulationreinforced the message.114
The Bush Administration also moved quickly to roll back air conditioner efficiencystandards that had been set by the Clinton Administration. These would have curbed thedemand for electricity – reducing the need for as many as 50 power plants. They would haveparticularly affected natural gas consumption, since summer peaking demand draws heavilyon natural gas.115 The administration’s luke warm attitude toward to energy efficiency as thecornerstone of the policy response was made clear by the Vice President, when he relegated itto “a personal choice,” not a policy option. The Administration recently lost a court battleover this decision, but the signal could not have been stronger.
The tilt toward the industry reached its zenith in the energy bill. As one long-termobserver of Washington energy policy put it, “Some blame must rest with the White Houseand Vice President Cheney, whose task force, meeting in secret with energy industry leaders,wrote the libretto for the bill.”116 The central premise of the energy bill pushed by theadministration is that energy companies need more money to boost production of domesticenergy supplies. To that end, a grab bag of subsidies – totaling over $20 billion – wasearmarked for the oil and gas industry, while other expensive alternatives also would receiveassistance.117 On the natural gas side, the bill promotes costly backstop technologies, likeliquefied natural gas imports and an Alaska natural gas pipeline, which will lock in high gasprices.
These signals were in sharp contrast to the reaction of the Clinton Administration tothe early signs of trouble in energy markets in 2000. As discussed above, after approving manyof the mergers that led to the consolidation in the industry, Clinton appointee Robert Pitofskyhad issued a tough FTC report on the gasoline price spikes in the upper Midwest in thesummer of 2000.118 The Department of Energy had begun to express serious concerns aboutthe abuse of market power in the electricity industry.119 Similarly, the Clinton Administrationcreated a heating oil reserve for the Northeast, another sign that it would take a stronger stanceagainst the industry.
THE WRONG EXPLANATIONS LEAD TO THE WRONG POLICY
The explanation for the high and volatile price of gasoline offered by the industry andthe Bush Administration is so oversimplified and incomplete that it must be considered at bestmisleading. At worst, it is wrong because it points to policies that do not address importantunderlying causes of the problem and therefore will not provide a solution.
This explanation has serious flaws in the gasoline market:
• Blaming high gasoline prices on high crude oil prices ignores the fact thatover the past few years the domestic refining and marketing sectors have

50
imposed larger increases on consumers at the pump than crude priceincreases would warrant.
• Blaming tight refinery markets on Clean Air Act requirements toreformulate gasoline ignores the fact that in the mid-1990s the industryadopted a business strategy of mergers and acquisitions to increase profitsthat was intended to tighten refinery markets and reduce competition at thepump.
• Claiming that the antitrust laws have not been violated in recent pricespikes ignores the fact that forces of supply and demand are weak in energymarkets and that local gasoline markets have become sufficientlyconcentrated to allow unilateral actions by oil companies to push prices upfaster and keep them higher longer than they would be in vigorouslycompetitive markets.
• Eliminating the small gasoline markets that result from efforts to tailorgasoline to the micro-environments of individual cities will not increaserefinery capacity or improve stockpile policy to ensure lower and lessvolatile prices if the same handful of companies dominate the regionalmarkets.
There are similar flaws in the explanation for natural gas markets:
• Blaming natural gas price increases on crude oil prices ignores that fact thatnatural gas wellhead prices have increased much faster than the price of oil.
• It ignores the fact that natural gas markets lack liquidity and transparencyand have been manipulated.
• The merger wave led by the major petroleum companies has impacted thenatural gas market.
The obsession with domestic drilling is misguided. Because domestic resourcesrepresent a very small share of the global resources base and are relatively expensive todevelop, it is folly to pursue a supply-side solution to the energy problem:
This policy will not increase significantly the US production of crude oil, willnot reduce significantly OPEC’s influence, and it will distort the USmacroeconomy. These outcomes are caused by a policy that is not consistentwith the depleted state of the domestic resource base and with the economics ofinternational oil.

51
In any plausible scenario, however, the actual effect will be close to zero. IfOPEC correctly anticipates production from ANWAR (the Arctic NaturalWildlife Reserve), which would not be difficult given its long lead times,OPEC could slow additions to capacity very modestly such that its utilizationrate (and its effect on price) would be changed relative to a scenario in whichno oil is produced from the ANWR… Regardless of OPEC behavior, the 1-2mbd [million barrels per day] from ANWR would reduce the OPEC’s share ofthe world oil market by 2-3 percent. Such a change would be virtuallyundetectable given the large fluctuation in crude oil prices.120
The increase in the amount of oil and gas produced in America will not be sufficientto put downward pressure on world prices; it will only increase oil company profits, especiallyif large subsidies are provided, as contemplated in recent energy legislation. Moreover, even ifthe U.S. could affect the market price of basic energy resources, which is very unlikely, thatwould not solve the structural problem in domestic markets.
Tight markets in the U.S. can best be addressed by relieving pressure on the demandside, yet the energy bill being considered by Congress does little to relieve that pressure.Additionally, the legislation fails to take serious measures to reduce demand by boosting theefficiency requirements for the most important energy consuming equipment – likeautomobiles and air conditioners. As one recent analysis concluded:
It is not dependence on imported oil per se that makes the economy vulnerableto price swings, but the dependence on oil itself… A reduction in ourvulnerability to swings in the price of oil requires a reduction in our use of oil,regardless of where on the planet it is produced.121
Further boosting the profitability of the petroleum industry with subsidies and accessto resources in environmentally sensitive areas would not increase production a great deal, norwill it decrease prices to consumers. Over the past three years, the domestic oil and gasindustry has enjoyed a huge increase in profitability, but the pricing abuse has gotten worse,not abated. With a depleted, costly resource base that represents a very small share of theglobal total, domestic production simply cannot discipline the world price of oil.
The energy legislation fails to address the factors that have led to the creation of aconcentrated market and the industry’s consequent failure to respond to increased demand in aresponsible manner. The legislation is silent on the market power problem flowing from thehigh degree of concentration on the supply-side of the market. In fact, in some ways it willmake matters worse. It contains language that could make it more difficult to punish fraud inenergy commodity markets. In addition, the repeal of the Public Utility Holding Company Actwould allow the large oil and gas producers to buy up electric utilities, thereby integratingtheir natural gas production with consumption. The result would be to further diminishmarket forces in the industry, exacerbating the problems that are already too painfully evident.

52
POLICY THAT REFLECTS THE DOMESTIC REALITY
If the U.S. is to both reduce the market power of energy producers and stem the flowof imports, public policy must start immediately and aggressively on an efficiency path tolower energy consumption.122
It is time for public policy to seek permanent institutional changes that both reduce thechances that markets will be tight and reduce the exposure of consumers to the opportunisticexploitation of markets when they become tight. To achieve this reduction of risk, publicpolicy should be focused on achieving four primary goals:
• Restore reserve margins by developing both efficiency (demand-side) andexpanding refinery capacity (supply-side).
• Increase market flexibility through stock and storage policy.
• Discourage private actions that make markets tight and/or exploit marketdisruptions by countering the tendency to profiteer by withholding of supply.
• Promote a more competitive industry.
A goal of achieving an improvement of vehicle efficiency (increase in fleet averagemiles per gallon) equal to economy-wide productivity over the past decade (when the fleetfailed to progress) would have a major impact on demand. It would require the fleet averageto improve at the same rate it did in the 1980s. It would raise average fuel efficiency by fivemiles per gallon, or 20 percent. This is a mid-term target. This rate of improvement should besustainable for several decades. This would reduce demand by 1.5 million barrels per daywithin a decade.123 This would return consumption to the level of the mid-1980s.
Expanding refinery capacity by 10 percent equals approximately 1.5 million barrels perday. This would require 15 refineries, if the average size equals the refineries currently in use.This is less than one-third the number shut down in the past ten years and less than one-quarter of the number shut down in the past fifteen years. Alternatively, a ten percent increasein the size of existing refineries, which is the rate at which they increased over the 1990s,would do the trick, as long as no additional refineries were shut down.
Placed in the context of redevelopment of recently abandoned facilities or expansion ofexisting facilities, the task of adding refinery capacity does not appear daunting. Such anexpansion of capacity has not been in the interest of the businesses making the capacitydecisions. Therefore, public policies to identify sites, study why so many facilities have beenshut down, and establish programs to expand capacity should be pursued.
This combination of demand-side and supply-side policies to improve the long runmarket balance would restore the supply/demand balance to levels that typified the mid-1980s.

53
It has become more and more evident that private decisions on the holding of stockswill maximize short-term private profits to the detriment of the public. Increasingconcentration and inadequate competition allows stocks to be drawn down to levels that sendmarkets into price spirals. While the strategic petroleum reserve has been developed as astrategic stockpile and companies generally take care of operating stocks, the marketplace isclearly not attending to economic stockpiles. Companies will not willingly hold excesscapacity for the express purpose of preventing price increases. They will only do so if theyfear that a lack of supply or an increase in brand price would cause them to lose business tocompetitors who have available stocks. Regional gasoline markets appear to lack sufficientcompetition to discipline anti-consumer private stock policies.
Public policy must expand stocks. Participants in the distribution of gasoline could berequired to hold stocks at a percentage of retail sales. Public policy could also either directlysupport or give incentives for private parties to keep storage. It could lower the cost of storagethrough tax incentives by drawing down stocks during seasonal peaks. Finally, public policycould directly underwrite stockpiles. We now have a small Northeast heating oil reserve. Itshould be continued and sized to discipline price shocks, not just prevent shortages. Similarly,a Midwest gasoline stockpile should be considered.
In the short term, government must turn the spotlight on business decisions that makemarkets tight or exploit them.
Withholding of supply should draw immediate and intense public scrutiny, backed upwith investigations. Since the federal government is likely to be subject to political pressuresnot to take action, state governments should be authorized and supported in market monitoringefforts. An ongoing joint task force of federal and state attorney’s general could beestablished. The task force should develop databases and information to analyze the structure,conduct and performance of gasoline markets.
As long as huge windfall profits can be made, private sector market participants willhave a strong incentive to keep markets tight. Market manipulation could and should be madeillegal. The pattern of repeated price spikes and volatility has now become an enduringproblem. Because the elasticity of demand is so low – because gasoline is so important toeconomic and social life – this type of profiteering should be discouraged. A windfall profitstax that kicks in under specific circumstances will take the fun and profit out of marketmanipulation.
Further concentration of these industries is quite problematic. The Department ofJustice Merger Guidelines should be rigorously enforced. Moreover, the efficiency defense ofconsolidation should be looked on skeptically, since inadequate capacity is a market problem.
Restrictive marketing practices, such as zonal pricing and franchise restrictions onsupply acquisition should be examined and discouraged. These practices restrict flows ofproduct into markets at key moments.

54
Markets should be expanded by creating more uniform product requirements. Theseshould not result in a relaxation of clean air requirements.
Decisions by the oil cartel to increase crude prices have cost consumers, but privatebusiness decisions about production capacity, stocks and product supply and the failure ofpublic policy to slow the growth of demand by promoting efficiency have cost much more.124
Given the importance of energy in the economy, “consumers of petroleum products in theUnited States expect that, as with water and electricity, public officials will ensure thereliability and affordability of supplies.”125 Americans have come to believe that the pricespikes are the result of industry manipulation.126 This paper shows that there are importantways that this suspicion is well-founded. Over the past three years, policymakers have failedto provide consumers with a stable market and things are getting worse, not better.127

55
(Endnotes)
1 Oldenburg, Don, “Caught Over a Barrel: Soaring Gas Prices Have Motorists’ Wallets Running onEmpty,” The Washington Post, May 4, 2004, C-1.
2 Banerjee, Neela, “Drivers Tend to Shrug Off High Gas Prices, for Now,” The New York Times, May 4,2004, C-1.
3 Oldenburg, May 4, 2004, p. C-1.4 Kovacic, William E., “Prepared Statement of the Federal Trade Commission,” Market Forces,
Anticompetitive Activity and Gasoline Prices—FTC Initiatives to Protect Competitive Markets, Subcommitteeon Antitrust, Competition Policy and Consumer Rights, Committee on the Judiciary, United States Senate,April 7, 2004.
5 Beattie, Jeff, “Gas Prices Still Climbing, EIA Says,” The Energy Daily, April 12, 2004, citing GaryCaruso, Administrator of the Energy Information Administration. The Energy Information Administration,Short Term Energy Outlook – March 2004, dated March 9, 2004, stated that “about half of the increase reflectshigher crude oil prices, with the remainder reflecting the impact of low inventories, robust demand, anduncertain availability of imports.”
6 Gerth, Jeff, “Higher Oil Prices Are Damaging Global Economy, a Study Shows,” The New York Times,May 4, 2004, C-6, quoting Gary Caruso, Administrator of the Energy Information Administration.
7 Industrial Energy Consumers of America, 41 Month Natural Gas Crisis Has Cost U.S. Consumers $111Billion, Washington, December 3, 2003.
8 Romero, Simon, “Natural Gas Prices Surge and Fingers are Pointing,” The New York Times, December13, 2003, p. C-1.
9 “Heating Costs Going Through Roof,” CBS Evening News, Jan. 20, 2004, www.cbsnews.com; Mayer,Caroline E., “The Cost of Keeping Warm: Weather Threatens to Push Heating Bills to New Heights,” TheWashington Post, January 17, 2002, p. E-1; Hopper, Michael, “Heating Costs Pinch Pockets,” Topeka Capital-Journal, January 18, 2004; “Low Temperatures, High Prices,” York Daily Record, January 19, 2004.
10 At the hearing on Market Forces, Anticompetitive Activity and Gasoline Prices—FTC Initiatives toProtect Competitive Markets Subcommittee on Antitrust, Competition Policy and Consumer Rights, Committeeon the Judiciary, April 7, 2004, Senator Schumer responded to the statement by Mr. Kovacic by pointing outthat the domestic oil companies profit when OPEC’s actions raises the price of crude,.
11 At the hearing on Market Forces, Anticompetitive Activity and Gasoline Prices—FTC Initiatives toProtect Competitive Markets Subcommittee on Antitrust, Competition Policy and Consumer Rights, Committeeon the Judiciary, April 7, 2004, Senator Wyden appeared as the first witness and raised the issue of marketstructure.
12 The study cited was Energy Information Administration, “Price Changes in the Gasoline Market: AreMidwestern Gasoline Prices Downward Sticky?” (Washington, February 1999).
13 The Clean Air Act of 1990 started the shift to natural gas in the electricity sector.14 In fact, at the time of the 1995 changes in Clean Air Act requirements, the Department of Energy
conducted a study of the impact of environmental requirements on the refining industry. It concluded that“pollution abatement operating costs have been and continue to be a small part of overall operating costs.”(U.S. Department of Energy, Energy Information Administration, The Impact of Environmental ComplianceCosts on U.S. Refining Profitability [Washington, October 1997], p. 3). The study shows operating costs pergallon associated with pollution abatement at about $.01 per gallon and large capital costs for a short period oftime to meet new requirements, but these had already begun to decline by 1995. The impact of capitalexpenditures must also be small, in the range of a penny per gallon. Other studies lead to similar estimates ofcosts associated with pollution abatement of a few cents per gallon; see Nadim, Farahad, et al., “United StatesExperience with Gasoline Additives,” Energy Policy, 29, 2001. Similarly, general reviews of the industry at thetime concluded that “a close examination reveals that the change in refining costs attributable to RFG had nomajor impact on margin behavior between 1993 and 1995” (U.S. Department of Energy, Energy InformationAdministration, Petroleum 1996: Issues and Trends [Washington, September 1997], p. 137). In fact, overalloperating costs have been declining. Peterson, D.J. and Serej Mahnovski, New Forces at Work in Refining:Industry Views of Critical Business and Operations Trends (Santa Monica, CA: RAND Corporation, 2003), p.

56
xv, note that following “a wave of mergers, acquisitions, joint ventures and selective divestitures… [whose]aim was cutting costs, gaining economies of scale, increasing returns on investment, and boostingprofitability…” consolidation and restructuring appear to have had the salutary effect executives intended,“EIA data indicates that mid and large-size refiners reduced their per barrel operating costs.”
15 Energy Information Administration, Summer 2003 Motor Gasoline Outlook (Washington, April 2003),analyzes the spread.
16 The evidence indicates that natural gas markets are regional rather than global because of “the existenceof a capital intensive and inflexible transportation system,” (Soderholm, P., “Fuel Flexibility in WesternEuropean Power Sector,” Resource Policy, 26, 2000, p. 162, cited in Ewing, Bradley T., Farooq Malik andOzan Ozfidan, “Volatility Transmission in the Oil and Natural Gas Markets,” Energy Economics, 24, 2002, p.536. The authors also cite Energy Information Administration, Performance Profiles of Major EnergyProducers [Washington, 1998]).
Thus, we find significant direct and indirect transmission of volatility from the natural gassector to the oil sector. Our results do not indicate that volatility in the oil returns is affectedby shocks originating either in the oil sector… or the gas sector… In addition, the estimatedcoefficient on the cross error term is insignificant, suggesting the absence of an indirect effectof shocks in the natural gas sector on the oil sector.
17 The prediction equation is Domestic Spread = 1.545 + (Product Supplied * .004524) +(Month of Year *.1562) + Seasonal Adjustment (based on historic averages, Ja=0; F,M,A,O,N,D=-1; M=1,June=4,July=5, A=1)
18 Wellhead Price= (Crude * .67)/5.75.19 Wellhead Price= (Crude * .67)/5.75) + (Month * .137) (N, F =1; D, Ja=2, all others =0).20 Available at http://www.bls.gov/cex/home.htm. Exhibit II-9 uses the average for all households. The
Energy Information Administration, Residential Energy Consumption Survey, allows one to calculate the avergefor households that use a fuel, as well as for all households.
21 Public Citizen, Record Oil Company Profits Underscore Market Consolidation, May 31, 2001; Fortune500, July 18, 2001; Business Week, First Quarter Results, May 21, 2001.
22 Fortune 500, July 18, 2001.23 Business Week, Spring 2001, p. 92.24 U.S. Department of Energy, Energy Information Administration, Performance Profile (Washington,
2001), pp. 7-8.25 “A Record Setting Year,” National Petroleum News, March 2004.26 Energy Information Administration, Performance Profiles of Major Energy Producers: 2002
(Washington, February 2004), p. 20.27 Energy Information Administration, Performance Profiles of Major Energy Producers: 2001
(Washington, January 2003), p. 78.28 Even introductory economics texts now contain long discussions of strategic behavior and game theory
[see, for example, Taylor, John B., Economics (Boston: Houghton Mifflin, 1998), Chapter 11] and it hasbecome a routine part of applied policy analysis [Hastings, Justine, “Factors that Affect Prices of RefinedPetroleum Products” (Washington, Federal Trade Commission Public Conference, August 2, 2001)].
29 Ye. Michael, John Zyren and Joanne Short, “Elasticity of Demand for Relative Petroleum Inventory inthe Short Run,” International Atlantic Economic Journal, March 2003; Linn, ScottC. And Zhen Zhu, “NaturalGas Prices and The Gas Storage Report: Public News and Volatility in Energy Futures Markets,” Journal ofFutures Markets, 24: 2004; Esnault, Benoit, “The Need for Regulation fo Gas Storage: The Case of France,”Energy Policy, 31: 2003.
30 Federal Trade Commission, Midwest Gasoline Price Investigation (Washington, March 29, 2001.31 Federal Trade Commission, Midwest Gasoline, pp. i... 4.32 Peterson and Mahnovski, p. 16.33 Peterson and Mahnovksi, p. 42.34 Peterson and Mahnovski, p. 17.35 Peterson and Mahnovksi, p. 17.36 Peterson and Mahnovski, p. xvi.

57
37 Federal Trade Commission, Midwest Gasoline, note 23, citing Organization for Economic Co-operationand Development and Department of Energy documents states “Higher crude prices led producers to drawdown inventories in anticipation of replacing them later at lower prices.”
38 National Energy Policy Development Group, National Energy Policy (Washington, May 2001), p. 7-13(hereafter NEPDG).
39 They certainly have value on the stock market (see Edwards, Kenneth, John D. Jackson and Henry L.Thompson, “A Note on Vertical Integration and Stock Ratings of Oil Companies in the U.S.,” The EnergyJournal, 2000).
40 “Oil Data Show Industry Role in Shortages a Possibility,” The New York Times, June 15, 2001.41 Peterson and Mahnovksi, p. xv.42 NEPDG, p. 7-13.43 U.S. Department of Energy, Energy Information Administration, Petroleum Supply Monthly
(Washington, April 2000), p. 145, defines the lower operational inventory as follows:Lower operational Inventory (LOI): The lower operational inventory is the lower end of thedemonstrated operational inventory range updated for known and definable changes in thepetroleum delivery system. While not implying shortages, operational problems or priceincreases, the LOI is indicative of a situation where inventory-related supply flexibility couldbe constrained or non-existent. The significance of these constraints depends on localrefinery capability to meet demand and the availability and deliverability of products fromother regions or foreign sources.
44 The general literature on stock and storage behavior shows that stocks are typically kept to ensureoperational flow (see Pyndick, Robert S., “Inventories and the Short-Run Dynamics of Commodity Prices,”RAND Journal of Economics, Spring 1994, “The Present Value Model of Rational Commodity Pricing,” TheEconomic Journal, May 1993).
45 Energy Information Administration, Petroleum 1996: Issues and Trends (Washington, September 1997),p. 27. The U.S. Department of Energy identified “lower than normal gasoline stocks” in a chapter entitled“Spring ’96 Gasoline Price Runup.” Energy Information Administration, Assessment of Summer 1997, p. 5;“Statement of John Cook, Director, Petroleum Division, U.S. Department of Energy,” Subcommittee on Energyand Air Quality, Committee on Energy and Commerce, U.S. House of Representative, May 15, 2001, p. 1.
46 Joanne Shore, Petroleum Division. The FTC reached a similar conclusion in its Midwest GasolinePrice Investigation, at note 23.
47 “Statement of John Cook, Director, Petroleum Division, U.S. Department of Energy, Subcommittee onEnergy and Air Quality, Committee on Energy and Commerce, U.S. House of Representative, May 15, 2001, p.1.
48 U.S. Energy Information Administration, Do Current High Petroleum Product Prices? (Washington,March 12, 2003), pp. 1-2.
49 U.S. Energy Information Administration, Summer 2003 Motor Gasoline Outlook (Washington, April2003).
50 Peterson and Mahnovksi, p. 43.51 Balancing Natural Gas Policy: Fueling the Demands of a Growing Economy (Washington, September
2003).52 Huntington, Hillard G. “Presentation to The Future of Natural Gas Markets: A Forum at RFF,”
November 21, 2004, EMF 20: Natural Gas, Fuel Diversity and North American Energy Markets, November2003, shows the NPC estimate as an extreme outlier in terms of price.
53 Energy Information Administration, The Majors’ Shift to Natural Gas (Washington, September 2001).54 EIA, Performance Profiles: 2002, pp. 81-83.55 EIA, Performance Profiles: 2002, pp. 71-72.56 Beattie, Jeff, “U.S. Oil and Gas Producers Investing in Mergers, Not More Drilling – S&P,” Energy
Daily, April 26, 2004.57 Energy Information Administration, The Natural Gas Industry and Markets in 2002 (Washington,
February 2004), p. 3.58 EIA, The Natural Gas Industry, p. 2.

58
59 Four years after the initial signs of trouble and in spite of reforms instituted by the Federal EnergyRegulatory Commission, things were still bad, reflected “In numbers the FERC Chairman Pat Wood comparedto a “cold shower,” staff of the Federal Energy Regulatory Commission said Wednesday that only 20 percent ofcompanies are reporting all of their natural gas trades and about 10 percent are reporting power trades to publicindices.” (Davis, Tina, “Gas Prices Reporting Better, But Still Lagging –FERC,” Energy Daily, May 6, 2004.
60 Moody, Dian, Natural Gas Price Indices: Price Manipulation Issues (Washington: American PublicPower Association, January 2003).
61 Caruso, Guy, Outlook for Natural Gas & Petroleum, Energy Information Administration, May 19, 2003;Trapman, William, Natural Gas Storage, Energy Information Administration, October 29, 2002, show the lowlevels of storage in early 2001 and 2003. Policy Development and Energy Sections, Natural Gas PriceVolatility, June 3, 2003, pp. 3-4, notes storage is in 2003 at the start of the injection season was “50% lowerthan the previous year” and that “high prices of gas during the storage season make firms think twice aboutmaking purchases of gas for injection.”
62 Bradley, Malik and Ozfidan, p. 536.63 Johnson, Jeff, “Chemical CEOs Protest Natural Gas Prices,” Chemical and Engineering News, Feb. 2,
2004.64 Lobensz, George, “CFTC Probing Manipulation of Natural Gas Storage Data,” Energy Daily, May 5,
2004.65 Scherer, F. M. and David Ross, Industrial Market Structure and Economic Performance (Boston:
Houghton Mifflin, 1990). Shepherd, William G., The Economics of Industrial Organization (EnglewoodCliffs, NJ: Prentice Hall, 1985).
66 Scherer and Ross, p. 15.67 Scherer and Ross, pp. 16…17.68 Summarizing the literature, Scherer and Ross, pp. 53-54, develop a long list of characteristics.69 Landes, W. M. and R. A. Posner, “Market Power in Anti-trust Cases,” Harvard Law Review, 19: 1981,
two prominent conservative economic analysts offer a similar concept. The most frequent starting point for adiscussion of the empirical measurement of the price impact of monopoly power is the Lerner Index. AsScherer and Ross (pp. 70…71) note, the Lerner Index is defined as:
L = (Price – Marginal Cost)/ Price.
Its merit is that it directly reflects the allocatively inefficient departure of price from marginalcost associated with monopoly. Under pure competition, [Ll]=0. The more a firm’s pricingdeparts from the competitive norm, the higher is the associated Lerner Index value. A relatedperformance-oriented approach focuses on some measure of the net profits realized by firmsor industries.
Landes and Posner (pp. 938-945) state the price cost margin as the firm’s elasticity of demand. Theythen transform the index into an expression that uses market shares of firms and the market elasticity ofdemand and supply:
We point out that the Lerner index provides a precise economic definition of market power,and we demonstrate the functional relationship between market power on the one hand andmarket share, market elasticity of demand, and supply elasticity of fringe competitors on theother.
L= (P – C) 1 S ______ = ___ ____________________
d sP E e + e (1 – s ) d m j i
where:
S = the market share of the dominant firm d

59
e = elasticity of demand in the market m se = elasticity of supply of the competitive fringe
js = market share of the fringe. i
In words this formula says that the markup of price over cost will be directly related to the marketshare of the dominant firm and inversely related to the ability of consumers to reduce consumption (theelasticity of demand) and the ability of other firms (the competitive fringe) to increase output (the elasticity ofthis supply). These are market characteristics and fundamentals that are accessible to economic analysts.
70 Pillipovic, Dragana, Energy Risk: Valuing and Managing Energy Derivates (New York: McGraw-Hill,1998), p. 3.
71 Energy Information Administration, Price Changes in the Gasoline Market (Washington, March 1999),reviews several decades of studies with mixed results in the analysis of gasoline price asymmetry – thetendency of prices to increase rapidly, but fall slowly. The report concludes that there is strong evidence ofpattern asymmetry (i.e. prices do rise faster than they fall) but not amount asymmetry (eventually they fall backall the way). This is not the majority view, however.
72 Reilly, Barry and Robert Witt, “Petrol Price Asymmetry Revisited,” Energy Economics, 1998.73 Bacon, Robert W., “Rockets and Feathers: The Asymmetric Speed of Adjustment of UK Retail Gasoline
Prices to Cost Changes,” Energy Economics, 1991; Galeotti, Marzio, Alessandro Lanza and Matteo Manera,“Rockets and Feathers Revisited: An International Comparison on European Gasoline Markets,” EnergyEconomics, 2003; Borenstein, Severin and Andrea Shepard, “Sticky Prices, Inventories and Market Power inWholesale Gasoline Markets,” RAND Journal of Economics, 2002, p. 322; U.S. General Accounting Office,“Energy Security and Policy: Analysis of the Pricing of Crude Oil and Petroleum Products” (Washington,March 1993). Moreover, one fundamental difference between the price spikes of recent years and the “rocketsand feathers” debate should be underscored. In the recent circumstances, we are not dealing with crude oilprice changes alone, so the question is not whether refiner/marketer margins “catch up,” or whether some ofthe change in crude oil price ends up in the refiner/marketer pockets (bottom line). The recent price spikeshave been significantly driven by refiner/marketer margins. Even if margins return to historic levels after thespike, there is no doubt that a net increase in marketer margins has occurred.
74 National Energy Policy, p. 3-13.75 Espey, Molly, “Gasoline Demand Revisited: An International Meta-Analysis of Elasticities,” Energy
Economics 20, 1998, 273-295, identifies 363 estimates of short-term elasticity. The median is -.23 for the shortterm and -.43 for the long term. Kayser, Hilke A., “Gasoline Demand and Car Choice: Estimating GasolineDemand Using Household Information,” Energy Economics, 22, 2000, estimated the short-term elasticity in theU.S. at -.23. Puller, Steven L. and Lorna A. Greening, “Household Adjustment to Gasoline Price Change: AnAnalysis Using 9 Years of US Survey Data,” Energy Economics, 21, 1999, pp. 37-52, find a one-year priceelasticity of -.34, but model a more complex structure of responses within shorter periods. They find a largerelasticity of miles traveled in the first quarter after a price shock (-.69 to -.76), but that demand “snaps back.”The larger reduction in miles driven is still “inelastic.” Moreover, the reduction in miles driven is larger thanthe reduction in fuel consumed since it appears that households cut back on the most efficient driving miles(i.e. higher speed vacation miles).
76 Espy, Molly, “Explaining the Variation in Elasticity Estimates of Gasoline Demand in the United States:A Meta-analysis,” The Energy Journal, 17, 1996, Table 2, shows the average elasticity of demand for U.S. onlystudies at -.42.
77 See Bohi, Douglas R. Analyzing Demand Behavior: A Study of Energy Elasticities (Baltimore: JohnsHopkins University Press, 1981);
78 Federal Trade Commission, Midwest Gasoline Price Investigation (Washington, March 29, 2001), pp.i…4.

60
79 Consodine, Timothy J. and Eunnyeong Heo, “Price and Inventory Dynamics in Petroleum ProductMarkets,” Energy Economics, 22, 2000, p. 527, conclude “supply curves for the industry are inelastic andupward sloping.” See also “Separatiblity, Functional Form and Regulatory Policy in Models of InterfuelSubstitution,” Energy Economics, 1989.
80 Consodine, Timothy J., “Inventories Under Joint Production: An Empirical Analysis of PetroleumRefining,” Review of Economics and Statistics, 1997, p. 527, “high inventory levels depress prices… In somecases, imports of product are more variable than production or inventories.
81 Pirrong, Stephen Craig, The Economics, Law and Public Policy of Market Power Manipulation(Boston: Kluwer, 1996), pp. 10… 24… 59. See also, Williams, Jeffrey and Brian Wright, Storage andCommodity Markets (Cambridge: Cambridge University Press, 1991); Deaton, Angus and Guy Laroque, “Onthe Behavior of Commodity Prices,” Review of Economics and Statistics, 1992.
82 Friedman, David, et. al., Drilling in Detroit: Tapping Automaker Ingenuity to Build Safe and EfficientAutomobiles (Washington, D.C.: Union of Concerned Scientists, June 2001). Friedman, David, A New road:The Technology and Potential of Hybrid (Washington, D.C.: Union of Concerned Scientists, January 2003),lays out a scenario in which conventional vehicles move to 40 MPG and hybrids move to 60 MPG.
83 EIA, Monthly Energy Review, Table 3.1a.84 EIA, Monthly Energy Review, Table 4.4.85 Ellioit, R. Neal, Anna Monis Shipley, Steven Nadel and Elizabeth Brown, Natural Gas Price Effects of
Energy Efficiency and Renewable Energy Practices and Policies (Washington: American Council for anEnergy Efficient Economy, December 2003).
86 Shepherd, p. 389.87 Landes and Posner, 1981; Ordover, J.A. and R. D. Willig, “Herfindahl Concentration, Rivalry, and
Mergers,” Harvard Law Review, 95, 1982.88 W. Kip Viscusi, John M. Vernon, and Joseph E. Harrington, Jr., Economics of Regulation and Antitrust
(Cambridge: MIT Press, 2000), pp. 147-150.89 Landes and Posner, p. 947. “Since market share is only one of three factors in equation (2) that
determine market power, inferences of power from share alone can be misleading… The proper measure willattempt to capture the influence of market demand and supply elasticity on market power.”
90 Landes and Posner, p. 942.91 Waverman, Leonard, “Econometric Modelling of Energy Demand: When Are Substitutes Good
Substitutes?,” Energy Demand: Evidence and Expectations (Surrey University Press, 1992), p. 16. Urga,Giovanni and Chris Walters, “Dynamic Translog and Linear Logit Models: A Factor Demand Analysis ofInterfuel Substitution in US. Industrial Energy Demand,” Energy Economics, 25:2003, p. 18, concludes that“estimates of long run cross elasticities are well below the threshold of unity.”
92 U.S. Department of Justice and Federal Trade Commission Horizontal Merger Guidelines (Washington,1997), at section 0.1.
The rule of thumb reflected in all iterations of the Merger Guidelines is that the more concentrated anindustry, the more likely is oligopolistic behavior by that industry.... Still, the inference that higherconcentration increases the risks of oligopolistic conduct seems well grounded. As the number of industryparticipants becomes smaller, the task of coordinating industry behavior becomes easier. For example,a ten-firm industry is more likely to require some sort of coordination to maintain prices at an oligopolylevel, whereas the three-firm industry might more easily maintain prices through parallel behaviorwithout express coordination.93 Taylor, Chapter 11; Viscusi, Vernon, and Harrington, Chapter 5; Jean Fudenberg and Jean Tirole,
“Noncooperative Game Theory for Industrial Organization: An Introduction and Overview,” in RichardSchmalensee and Robert D. Willig, (eds.) Handbook of Industrial Organization (New York: North-Holland,1989).
94 Peterson and Mahnovksi, p. 24.95 Scherer and Ross, p. 526, formulate the issue as follows “To avoid these hazards, firms entering either
of the markets in question might feel compelled to enter both, increasing the amount of capital investmentrequired for entry.”
96 Shepherd, pp. 289-290, describes this issue as follows:

61
When all production at a level of an industry is “in-house,” no market at all exists from whichindependent firms can buy inputs. If they face impediments or delays in setting up a newsupplier, competition at their level will be reduced. The clearest form of this is the rise incapital a new entrant needs to set up at both levels.
Ores, special locations, or other indispensable inputs may be held by the integrated firm andwithheld from others. The integration prevents the inputs from being offered in a market, andso outsiders are excluded. A rational integrated firm might choose to sell them at asufficiently high price.
97 Shepherd, p. 294, argues that integration by large firms creates this problem. Restrictions may be set onareas, prices or other dimensions … Only when they are done by small-share firms may competition beincreased. When done by leading firms with market shares above 20 percent, the restrictions do reducecompetition.
98 Perry, Martin K., “Vertical Integration: Determinants and Effects,” in Schmalensee and Willig (eds.),Handbook of Industrial Organization, p. 197.
99 Perry, p. 247.100 Scherer and Ross, pp. 526-527; Shepherd, p. 290.101 Borenstein, Severin, A. Colin Cameron and Richard Gilbert, “Do Gasoline Prices Respond
Asymmetrically to Crude Oil Price Changes?” Quarterly Journal of Economics, 1997.102 Scherer and Ross, pp. 526-527; Shepherd, p. 290.103 Gilbert, Richard and Justine Hastings, “Vertical Integration in Gasoline Supply: An Empirical Test of
Raising Rivals’ Costs” (Competition Policy Center, University of California, Berkeley, 2001), p. 27; see alsoHastings, Justine, “Vertical Relationships and Competition in Retail Gasoline Markets: Empirical Evidencefrom Contract Changes in Southern California” (Competition Policy Center, University of California, Berkeley,2000).
104 In 1990, 22 integrated companies covered an average of 28 states. In 1999, 17 companies covered anaverage of 26 states.
105 “Beattie, Judge Green Lights Lawsuit,” p. 3.106 Landes and Posner, p. 947, stress the importance of adjusting scrutiny based on the market
characteristics:Market Share Alone Is Misleading. -Although the formulation of the Lerner index… providesan economic rationale for inferring market power from market share, it also suggests pitfallsin mechanically using market share data to measure market power. Since market share is onlyone of three factors... that determine market power, inferences of power from share alone canbe misleading. In fact, if market share alone is used to infer power, the market sharemeasure… which is determined without regard to market demand or supply elasticity(separate factors in the equation), will be the wrong measure. The proper measure willattempt to capture the influence of market demand and supply elasticity on market power.
107 Landes and Posner, p. 954, also argued that the size of the market at issue should be considered, “ifvery high market shares are required to justify a finding of monopoly power in a small market, then a lowermarket share should suffice in a large market.”
108 Recent studies that document the importance of concentration and market power in various markets at amicro level include Sen Anindya, “Higher Prices at Canadian Gas Pumps: International Crude Oil Prices ofLocal Market Concentration,” Energy Economics, 2003; Delpachitra, Sarath B., “Price Rigidity in theDownstream Petroleum Industry in New Zealand: Where Does it Happen,” Energy Economics, 2002; Adrangi,Bahram, Arjun Chatrath, Kambiz Raffiee, and Ronald D. Ripple, “Alaska North Slope Crude Oil Price and theBehavior of Diesel Prices in California,” Energy Economics, 2001; Gilbert and Hastings; Borenstein, Cameronand Gilbert.
109 “Text of the Speech of President Bush,” in releasing the National Energy Task Force Report, TheWashington Post, May 18, 2001.
110 Secretary of the Treasury O’Neill recounts that the Vice President responded to the criticism of some ofthe administration policies with the blunt statement that, “We won the mid-terms [elections], this is our due.”

62
The Washington Post, January 18, 2004, F-3. The quote is from Secretary of the Treasury O’Neill’s account ofvice President Cheney’s reaction to O’Neill’s complaint that the tax cuts would create a severe fiscal crisis.
111 “Supreme Court to Hear Cheney Task Force Case,” Energy Daily, December 16, 2003.112 Frontline, June 6, 2001.113 The California Attorney General reached a settlement with Dynegy for $280 million to settle
complaints about price manipulation in about 6 months in 2000-2001. Included in the total was a settlement of$3 million that the Federal Energy Regulatory Commission had reached with Dynegy. In other words, theFERC has agreed to just about one penny on the dollar of the ultimate abuse (see Davis, Teena, “Dynegy SettlePower Fight with California,” Energy Daily, April 28, 2004).
114 Beattie, Jeff, “FERC Still Unsure About Reliability of Gas Price Reporting,” Energy Daily, November5, 2003.
115 Kubo, Toru, Harvey Sachs, and Steven Nadel, Opportunities for New Appliance and EquipmentEfficiency Standards: Energy and Economic Savings Beyond Current Standards Programs (Washington, D.C.:American council for an Energy-Efficient Economy, September 2001). Nadel, Steve and Howard Geller, SmartEnergy Policies: Saving Money and Reducing Pollutant Emissions through Greater Energy Efficiency(Washington, D.C.: American Council for an Energy Efficient Economy, September 2001).
116 King, Llewellyn, “The Energy Pig-Out Has Been Delayed,” Energy Daily, December 2, 2003.117 King identifies half a dozen columnists and newspapers who are usually strong supporters of President
Bush who find the bill unacceptable.118 Federal Trade Commission, Midwest Gasoline Price Investigation, March 29, 2001, pp. i…4.119 Energy Information Administration, Horizontal Market Power in Restructured Electricity Markets
(March 2000).120 Cleveland, Cutler J. and Robert K. Kaufman, “Oil Supply and Oil Politics: Déjà vu All Over Again,”
Energy Policy, 31, 2003, pp. 485-487, point out the obvious math of the situation.121 Cleveland and Kaufman, p. 488.122 Cleveland and Kaufman, p. 488, note that “Just a 3 mile-per-gallon increase in the fuel efficiency of
SUVs alone would reduce the US oil consumer of more than ANWR could supply,” citing American Councilfor an Energy-Efficient Economy, Vehicle Fuels Economy Standards: Big Energy Savings at a Modest Cost,2001.
123 Friedman, et al.124 Peterson and Mahnovski, p. 5, note the following:
Oil industry research, analyses and policy dialogs conducted in both the private and publicsectors tend to emphasize the natural resource side of the business – upstream crude oilexploration and production. Much less analysis and discussion is devoted to oil companies asthe downstream manufacturers of intermediate and finished petroleum products.
125 Peterson and Mahnovski, p. 5.126 Harwood, J., “Americans Distrust Institutions in Poll,” Wall Street Journal, June 13, 2002, cited in
Peterson and Mahnovski, New Forces At Work, p. 19.127 For other products, imports play a larger role, close to 10 percent for distillate and 50 percent for
residual fuel oil.