fuel supply chain analysis of turkey - sabancı...
TRANSCRIPT

ARTICLE IN PRESS
Renewable and Sustainable Energy Reviews
11 (2007) 2058–2082
1364-0321/$ -
doi:10.1016/j
�CorrespoE-mail ad
www.elsevier.com/locate/rser
Fuel supply chain analysis of Turkey
Ahu Gumrah Dumanlia, Ibrahim Gulyurtlub, Yuda Yuruma,�
aFaculty of Engineering and Natural Sciences, Sabanci University, Tuzla, Istanbul 34956, TurkeybINETI-DEECA, Edificio J, Estrada do Pac-o do Lumiar, 22, 1649-038 Lisboa, Portugal
Received 10 March 2006; received in revised form 10 March 2006; accepted 24 March 2006
Abstract
In spite of its natural sources, Turkey depends on other countries in terms of energy production,
and a transfer from conventional fossil sources to sustainable energy sources is strongly necessary.
Among the sustainable energy sources, biomass is the subject of this study. The characteristics,
logistic aspects, environmental aspects, economical, legal and technical aspects are investigated in
order to show that the possible biomass co-firing is very important for the construction of economic,
sustainable and environmentally friendly energy systems.
r 2006 Elsevier Ltd. All rights reserved.
Keywords: Biomass; Coal; Co-firing; Environment; Economy; Logistics
Contents
1. Introduction . . . . . . . . . . . . . . . . . . . . . . . . . . . . . . . . . . . . . . . . . . . . . . . . . . . . . 2059
2. General information and energy situation of Turkey. . . . . . . . . . . . . . . . . . . . . . . . . 2059
3. Biomass species and non-toxic waste materials . . . . . . . . . . . . . . . . . . . . . . . . . . . . . 2062
3.1. Agricultural biomass residues. . . . . . . . . . . . . . . . . . . . . . . . . . . . . . . . . . . . . 2065
3.2. Animal based biomass samples available in Turkey . . . . . . . . . . . . . . . . . . . . . 2068
3.3. Non-toxic solid wastes. . . . . . . . . . . . . . . . . . . . . . . . . . . . . . . . . . . . . . . . . . 2069
3.4. Industrial wastes . . . . . . . . . . . . . . . . . . . . . . . . . . . . . . . . . . . . . . . . . . . . . . 2070
4. Co-firing aspects . . . . . . . . . . . . . . . . . . . . . . . . . . . . . . . . . . . . . . . . . . . . . . . . . . 2071
5. Logistic aspects . . . . . . . . . . . . . . . . . . . . . . . . . . . . . . . . . . . . . . . . . . . . . . . . . . . 2073
6. Technological aspects. . . . . . . . . . . . . . . . . . . . . . . . . . . . . . . . . . . . . . . . . . . . . . . 2075
see front matter r 2006 Elsevier Ltd. All rights reserved.
.rser.2006.03.011
nding author. Tel.: +90 216 4839512; fax: +90 216 4839550.
dress: [email protected] (Y. Yurum).

ARTICLE IN PRESSA.G. Dumanli et al. / Renewable and Sustainable Energy Reviews 11 (2007) 2058–2082 2059
6.1. Collected methodologies . . . . . . . . . . . . . . . . . . . . . . . . . . . . . . . . . . . . . . . . 2075
6.2. Plantation and production methodologies . . . . . . . . . . . . . . . . . . . . . . . . . . . . 2075
6.3. Densification to transport and preparation of the fuel . . . . . . . . . . . . . . . . . . . 2075
7. Environmental aspects . . . . . . . . . . . . . . . . . . . . . . . . . . . . . . . . . . . . . . . . . . . . . . 2078
8. Economic aspects . . . . . . . . . . . . . . . . . . . . . . . . . . . . . . . . . . . . . . . . . . . . . . . . . 2079
9. Conclusions . . . . . . . . . . . . . . . . . . . . . . . . . . . . . . . . . . . . . . . . . . . . . . . . . . . . . 2079
Acknowledgement . . . . . . . . . . . . . . . . . . . . . . . . . . . . . . . . . . . . . . . . . . . . . . . . . 2080
References . . . . . . . . . . . . . . . . . . . . . . . . . . . . . . . . . . . . . . . . . . . . . . . . . . . . . . 2080
1. Introduction
Continuity of industrial and social life strongly depends on the energy supply. Althoughenergy is indispensable in our lives, consumption of the large amounts of fossil fuels causesmany serious problems.
Most significant critical environmental problems are global warming which is due to theabsorption of infrared radiations by greenhouse gases (CO2, H2O, CH4, chlorofluor-ocarbons etc.), acid rains due to SO2 and NOx emissions and carbonaceous particulatematter and other emissions [1]. One possibility to reduce greenhouse-gas, SO2 and NOx
emissions of coal is co-firing; to burn low-sulfur and low-nitrogen-biomass together withcoal in pulverized coal-fired boilers or fluidized beds. In order to decide the type of thebiomass that will be used in the co-firing process, determination of the combustioncharacteristics of the biomass such as, calorific value, ash properties and elementalanalysis, is very important. On the other hand, the final decision on the usage of thebiomass is closely related with the economical feasibility of the biomass.
The aim of this study is to carry out an overall analysis of the whole supply chain ofTurkey, based on the biomass species as well as waste materials [2].
2. General information and energy situation of Turkey
Although Turkey has most of the energy resources, it is an energy importing country,since these resources are limited [3]. More than half of the primary energy consumption inTurkey is met by imports and the share of these imports increases continuously. Therefore,if the country wants to supply its demand of energy by its own resources and become lessdependent on foreign resources, the policy about using conventional energy resources(i.e. fossil fuels, such as hard coal, lignite, oil and natural gas) should be converted torenewable energy resources, and this must be realized in a reasonable period of time [3].
Turkey has several advantages for the use of the biomass as an energy source in terms ofits climate. Turkey has a climate which is mainly characterized by the Mediterraneanmacro climate system. On the other hand, despite of the Mediterranean geographicallocation of Turkey in which climatic conditions are quite temperate, diverse nature oflandscape and irregular topography causes significant differences in climatic conditionsfrom one region to the other. Shortly, the coastal areas have mild climates and innerAnatolian parts have extremely hot summers and cold winters with insufficient rainfall, onthe contrary, the north region of Turkey, the Black Sea Region, receives rainfallthroughout the year. Average rainfall nationwide is about 650mm [4].

ARTICLE IN PRESS
Table 1
Amount of primary energy sources in Turkey [6]
Sources Apparent Probably Possible Total
Hard coal (million tons) 428 449 249 1126
Lignite (million tons) 7339 626 110 8075
Asphaltite (million tons) 45 29 8 82
Oil shale (million tons) 555 1086 269 1641
Hydropower (MW) 34 736 — — 34 736
Oil (million tons) 36 — — 36
Natural gas (million tons) 8 — — 8
Nuclear (tons)
Uranium 9129 — — 9129
Thorium 380 000 — — 380 000
Geothermal (MW)
Electric 200 — 4300 4500
Thermal 2250 — 28 850 31 100
Solar (Mtoe/y)
Electric — — — 8.8
Heat — — — 26.4
Wood 1550 150 25 1725
Dung 175 30 13 218
A.G. Dumanli et al. / Renewable and Sustainable Energy Reviews 11 (2007) 2058–20822060
Turkey’s primary energy sources are hard coal, lignite, asphaltite, oil shale, hydropower,oil, natural gas, geothermal, solar, wood, and animal and plant wastes. Table 1 shows theamounts of these primary sources [5].The primary energy production and consumption statistics are given in Table 2. It is
clearly seen that on the average approximately half of the primary fuel used was importedbetween 1990 and 2003, if hard coal, natural gas and oil are considered separately. Thispicture becomes more dramatic as the import of these fuels varies between 80% and 90%and reaches up to 92% in 2003.Due to the high economic development and the increase of population in Turkey, it is
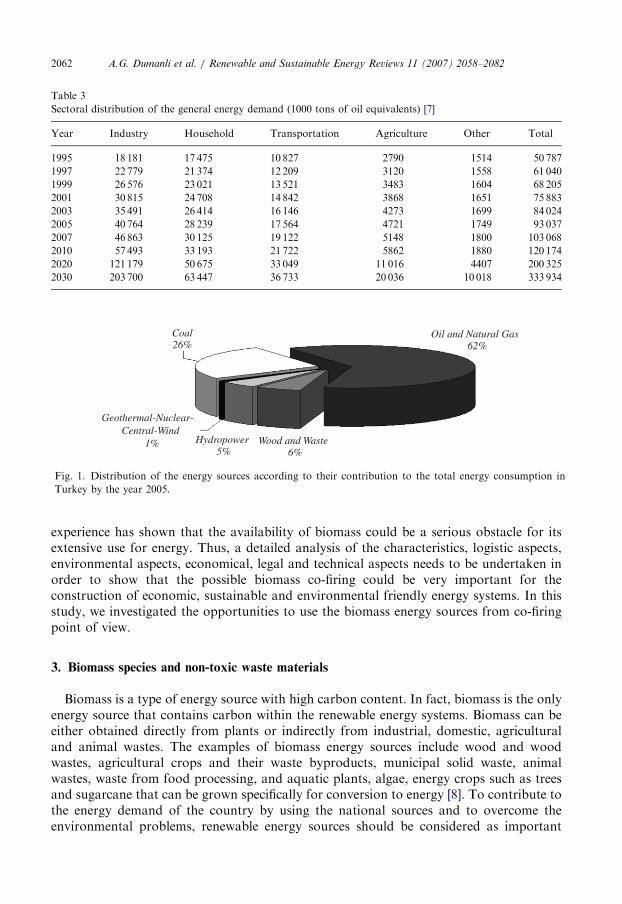
expected that between 2000 and 2010 the energy demand of Turkey will be doubled and in2030, it will be almost fivefold, Table 3 summarizes the sectoral distribution of generalenergy demand.The distribution of the consumption of energy sources of Turkey by the year 2005 is
given in Fig. 1. It is clearly seen that only a total of 12% of the energy need correspond tothe renewable sources.Other significant aspects about the use of biomass sources can be shown by the recent
energy production and consumption values [6]; Table 4 shows the projected values for totalprimary energy production and consumption and the share of biomass sources and Fig. 2summarizes the values presented in Table 4. It is obvious that the amount of primaryenergy consumption increases exponentially, while the production values significantly staybehind these values and in spite of that, use of biomass as a primary energy sourcedecreases each year.From the tables and the figures above, it is clear that Turkey needs to start to use its
sustainable energy sources immediately as previously stated. Among the varioussustainable sources available in Turkey, biomass could play an important role. However,

ARTIC
LEIN
PRES
S
Table 2
Primary energy production and consumption in Turkey between 1990 and 2003 (values in parenthesis represents the consumption values) [6]
Units 1990 1991 1992 1993 1994 1995 1996 1997 1998 1999 2000 2001 2002 2003
Hard coal kton 2745 2762 2830 2789 2839 2248 2441 2513 2156 1990 2259 2357 2245 2011
(8191) (8824) (8841) (8844) (8192) (8548) (10 892) (12 537) (13 146) (11 362) (15 393) (11 039) (13 756) (17 487)
Lignite kton 44 407 43 207 48 388 45 685 51 553 52 758 53 888 57 387 65 204 65 019 60 854 59 572 51 660 46 168
(45 891) (45 851) (50 659) (46 086) (51 178) (52 405) (54 961) (59 474) (64 504) (64 049) (64 394) (61 010) (52 039) (46 051)
Asphaltite kton 276 139 213 86 — 67 34 29 23 29 22 31 5 —
(287) (139) (197) (102) (66) (34) (29) (23) (29) (22) (31) (5)
Natural gas Mm3 212 203 198 200 200 182 206 253 565 731 639 312 378 561
(3418) (4205) (4612) (5088) (5408) (6937) (8114) (10 072) (10 648) (12 902) (15 086) (16 339) (17 694) (21 374)
Oil kton 3717 4451 4281 3892 3687 3516 3500 3457 3224 2940 2749 2551 2420 2375
(22 700) (22 683) (23 660) (27 074) (25 589) (27 918) (29 601) (29 176) (29 022) (28 862) (31 072) (29 661) (29 776) (30 669)
Hydropower GWh 23 148 22 683 26 568 33 951 30 586 35 541 40 475 39 816 42 229 34 678 30 879 24 010 33 684 35 330
(23 148) (22 683) (26 568) (33 951) (30 586) (35 541) (40 475) (39 816) (42 229) (34 678) (30 879) (24 010) (33 684) (35 330)
Wind & geoth (electricity) GWh 80 81 70 78 79 86 84 83 85 81 76 90 105 89
(80) (81) (70) (78) (79) (86) (84) (83) (85) (81) (76) (90) (105) (89)
Wind & geoth (heat ) kTOE 364 365 388 400 415 437 471 531 582 618 648 687 730 784
(364) (365) (388) (400) (415) (437) (471) (531) (582) (618) (648) (687) (730) (784)
Wood kton 17 870 17 970 18 070 18 171 18 272 18 374 18 374 18 374 18 374 17 642 13 938 16 263 15 614 14 991
(17 870) (17 970) (18 070) (18 171) (18 272) (18 374) (18 374) (18 374) (18 374) (17 642) (16 938) (16 263) (15 614) (14 991)
Animal and plant residues kton 8030 7918 7772 7377 7074 6765 6666 6575 6396 6184 5981 5790 5609 5439
(8030) (7918) (7772) (7377) (7074) (6765) (6666) (6575) (6396) (6194) (5981) (5790) (5609) (5439)
Solar kTOE 26 41 60 88 129 143 159 179 210 236 262 287 318 350
(28) (41) (60) (88) (129) (143) (159) (179) (210) (236) (262) (287) (318) (350)
Total kTOE 25 478 25 501 26 794 26 441 26 511 26 719 27 386 28 209 29 324 27 659 26 855 25 173 24 727 23 812
(52 987) (52 278) (56 684) (60 265) (59 127) (63 679) (69 862) (73 779) (74 709) (74 274) (81 221) (75 952) (78 711) (83 804)
A.G
.D
um
an
liet
al.
/R
enew
ab
lea
nd
Su
stain
ab
leE
nerg
yR
eviews
11
(2
00
7)
20
58
–2
08
22061
ARTICLE IN PRESS
Table 3
Sectoral distribution of the general energy demand (1000 tons of oil equivalents) [7]
Year Industry Household Transportation Agriculture Other Total
1995 18 181 17 475 10 827 2790 1514 50 787
1997 22 779 21 374 12 209 3120 1558 61 040
1999 26 576 23 021 13 521 3483 1604 68 205
2001 30 815 24 708 14 842 3868 1651 75 883
2003 35 491 26 414 16 146 4273 1699 84 024
2005 40 764 28 239 17 564 4721 1749 93 037
2007 46 863 30 125 19 122 5148 1800 103 068
2010 57 493 33 193 21 722 5862 1880 120 174
2020 121 179 50 675 33 049 11 016 4407 200 325
2030 203 700 63 447 36 733 20 036 10 018 333 934
Coal26%
Hydropower5%
Wood and Waste6%
Oil and Natural Gas62%
Central-WindGeothermal-Nuclear-
1%
Fig. 1. Distribution of the energy sources according to their contribution to the total energy consumption in
Turkey by the year 2005.
A.G. Dumanli et al. / Renewable and Sustainable Energy Reviews 11 (2007) 2058–20822062
experience has shown that the availability of biomass could be a serious obstacle for itsextensive use for energy. Thus, a detailed analysis of the characteristics, logistic aspects,environmental aspects, economical, legal and technical aspects needs to be undertaken inorder to show that the possible biomass co-firing could be very important for theconstruction of economic, sustainable and environmental friendly energy systems. In thisstudy, we investigated the opportunities to use the biomass energy sources from co-firingpoint of view.
3. Biomass species and non-toxic waste materials
Biomass is a type of energy source with high carbon content. In fact, biomass is the onlyenergy source that contains carbon within the renewable energy systems. Biomass can beeither obtained directly from plants or indirectly from industrial, domestic, agriculturaland animal wastes. The examples of biomass energy sources include wood and woodwastes, agricultural crops and their waste byproducts, municipal solid waste, animalwastes, waste from food processing, and aquatic plants, algae, energy crops such as treesand sugarcane that can be grown specifically for conversion to energy [8]. To contribute tothe energy demand of the country by using the national sources and to overcome theenvironmental problems, renewable energy sources should be considered as important

ARTICLE IN PRESS
Table 4
Primary energy production and consumption of Turkey between 2000 and 2030, Mtoe (values in parenthesis are
the consumption values) [7]
Energy source 2000 2005 2010 2015 2020 2025 2030
Coal (Hard coal+Lignite) 17 202 21 259 28 522 31 820 39 385 45 944 59 765
(20 256) (30 474) (50 311) (83 258) (129 106) (296 997) (363 210)
Oil and Natural gas 3408 2127 1735 1516 1604 1455 1893
(59 250) (73 256) (92 637) (112 993) (136 365) (179 765) (227 518)
Wood and waste 6963 6760 6446 6029 5681 5393 7015
(6963) (6760) (6446) (6029) (5681) (5393) (7015)
Hydropower 3763 5845 7520 8873 9454 10 445 3587
(3763) (5845) (7520) (8873) (9454) (10 445) (3587)
Geothermal 432 1380 3760 4860 4860 5400 7024
(432) (1380) (3760) (4860) (4860) (5400) (7024)
Nuclear 0.0 0.0 3657 9143 18 286 29 200 37 984
(0.0) (0.0) (3657) (9143) (18 286) (29 200) (37 984)
Solar 204 459 907 1508 2294 3248 4225
(204) (459) (907) (1508) (2294) (3248) (4225)
Central heating 253 495 884 1336 2018 2748 3575
(253) (495) (884) (1336) (2018) (2748) (3575)
Wind 55 250 620 980 1440 2134 2776
(55) (250) (620) (980) (1440) (2134) (776)
Wood and Waste Production and ConsumptionBetween 1190 and 2030
30000
800000
700000
600000
500000
400000
300000
200000
100000
0
25000
20000
15000
10000
50001985 1995
1995
2005
20052000
Years
Years
Ene
rgy
(Mto
e)
Ene
rgy
(Mto
e)
2015
20152010
2025
20252020
2035
20352030
Primary Energy Production
Primary Energy Consumption
Share of Biomass Sources
Fig. 2. Projection for total primary energy production and consumption.
A.G. Dumanli et al. / Renewable and Sustainable Energy Reviews 11 (2007) 2058–2082 2063

ARTICLE IN PRESSA.G. Dumanli et al. / Renewable and Sustainable Energy Reviews 11 (2007) 2058–20822064
inputs. Because biomass offers considerable flexibility in fuel supply in Turkey, due to therange and diversity of the fuels that can be produced, it should be considered as arenewable energy equivalent to fossil fuels. Biomass can be either used by directcombustion or mixed with an appropriate fossil fuel and be combusted or it can beconverted into solid, liquid and gaseous fuels using conversion technologies such asfermentation to produce alcohols, bacterial digestion to produce biogas and gasification toproduce a natural gas substitute. Biomass has so far been utilized either as a base fuel infairly small boilers or as a co-fuel in larger, mostly coal-based units. There is a possibilityof rendering the use of biomass more viable by blending it with non-toxic waste materials,which are economically unattractive for recycling and are expensive to dispose of inlandfills. The use of these wastes for energy is promising provided that they combine wellwith other fuels during the conversion process for energy and have no negative effect onthe environment. It is, therefore, imperative that there is a satisfactory synergy betweencoal, biomass and wastes so that the impact of multi-fuel co-firing minimizes any negativeaspect of any fuel when used separately [9]. The proposed study aims at determining thelimits of the optimized operation that could be beneficial in getting rid of waste andpromoting biomass for environmentally acceptable energy generation. Fluidized bedsystems are particularly well suited for such a co-firing operation because of theirversatility with regard to fuel.Worldwide, biomass is in the fourth place as an energy source and provides about 14%
of the world’s energy needs [10]. Furthermore, biomass is a clean and renewable energysource; for example, if biomass is utilized in a closed-loop process, the entire process,planting, harvesting, transportation, conversion to electricity via combustion then releaseinto the atmosphere, can be considered as there is no net gain of carbon dioxide in theatmosphere [11–13].In future, biomass has the potential to provide a cost-effective, environmental friendly
and sustainable supply of energy [1]. By the year 2050, it is estimated that 90% of the worldpopulation will live in developing countries. It is critical, therefore, that the biomassprocesses used in these countries should be sustainable. The modernization of biomasstechnologies, leading to more efficient biomass production and conversion is one possibledirection for biomass use in developing countries. Besides the ability of biomass providinga clean, renewable energy source that could dramatically improve our environment,economy and energy security, it can also create thousands of jobs and helps revitalize ruralcommunities.Biomass offers important advantages as a combustion feedstock due to its high volatility
and the high reactivity, both of the fuel and the resulting char. On the other hand, biomassshould be separated from coal to another category in term of its organic, inorganic, energycontent and physical properties. If compared with coal, biomass generally has less carbon,more oxygen, more silica and potassium, less aluminum and iron, lower heating value,higher moisture content and lower density and friability [14–17]. Also, the chlorine contentis considerably high in comparison with coal, which results with corrosion [16–18].Additionally, the high moisture and ash contents in biomass fuels can cause ignition andcombustion problems. Also the melting point of the dissolved ash is generally low, whichcauses fouling and slugging problems. Because of the low-heating values, use of biomasscan cause flame stability problems. A bright solution to these problems can be blendingbiomass with higher quality coal, which will reduce the flame stability problems, as well asminimize the corrosion effects [19].

ARTICLE IN PRESSA.G. Dumanli et al. / Renewable and Sustainable Energy Reviews 11 (2007) 2058–2082 2065
3.1. Agricultural biomass residues
Agricultural wastes are the wastes of agricultural activities without posterior use in theproper exploration. Crops and livestock account for 90% of the agricultural sector inTurkey. The type and quantity of crops that form the basis of the agricultural sector(wheat, barley, tobacco, cotton, rice, etc) give rise to huge amounts of agricultural residues.These are generally treated in an uncontrolled manner, and either burned in open-air firesor allowed to decay. In either case, they result in significant environmental impacts while atthe same wasted.
The main agricultural products of Turkey are grain, cotton, tobacco, grapes, sunflower,pulses (chickpeas and lentils), dried fruit (hazelnuts, seedless raisins, figs and apricots),fresh fruits (apples and citrus), tomatoes, tea and small ruminants (sheep, goats). Cerealproduction occupies 75% of Turkey’s crop land. Turkey is one of the world’s biggestwheat and barley producers; the annual wheat production was 19 million tons in 2003 andbarley production was 8.1 million tons in 2003. Other important products are cotton seed,which has an annual production of 1.3 million tons (2003), and sugar beet with 12.6 milliontons of annual production by the year 2003 [20].
Turkish agriculture is heavily dependent on seasonal rainfall. Among the total 8.5million hectares of land under potential perennial irrigation, only 4.5 million hectares, hasbeen equipped with requisite irrigation infrastructure. On the other hand, the expansion ofirrigated lands helps to improve production, create rural employment and alleviatemigration from rural to urban areas. For this reason, it is planned that by the year 2015,1.7 million hectares of land will be added to the irrigated land by the SoutheasternAnatolian Project [21].
Small farm size is a characteristic of Turkish agriculture. Distribution of the 4 millionfarm households is in such a way that 67% of these farms is between 0.1 and 5 ha and only33% of households own more than 5 ha. Unfortunately, this distribution causes the farmoutput to be low in comparison to the country’s enormous potential.
In 1999, Turkey has been faced with a serious economic crisis, and the debt of publicsector has reached to very high limits. During 1990s the ratio of public debit to nationalincome was below 30%, at the end of 2000 this ratio has reached to 60% and at the end of2001 it was 70%. Up to that time government was able to get into debts at high realinterest, but after that time this was not acceptable anymore.
By the IMF Letter of Intent and Reconstruction Program in 1999, the agriculturalpolicy of Turkey has changed; the subsidizing policies has been stopped and shifted into adirect income support system [22].
The improvement in the agricultural sector had targeted as 2.9–3.7% for the VIIthplanning period but realization of the target was as 1.7%. On the other hand, in the 8thfive year development plan (2001–2006), the improvement in the agricultural sector hadtargeted as 2.1% [23].
The following Table 5 presents the agricultural residues and the energy content of theavailable biomasses in Turkey. The most important representative example of biomassfamily is wood, which is a naturally occurring material, which consists of cellulose,hemicellulose and lignin. The following Table 6 is representing the proximate, ultimate andelemental analysis results of selected agricultural biomass sources and Turkishlignocellulosic biomass sources. Wood is one of the major sources of energy in ruralTurkey. An average of 0.75m3 of fuelwood is burnt annually by each fuelwood consumer.

ARTICLE IN PRESS
Table 5
Evaluation of plant based biomasses available in Turkey [17,25]
Product Annual production (tons) Energy content (MJ/kg)
Wheat residues 30 000–40 000 18.40
Barley residues 12 000–16 000 17.10
Oats residues 400–600 17.70
Rye residues 350–450 17.60
Rice residues 250–350 15.40
Maize residues 4000–5000 16.80
Sun flower residues 2500–3000 14.28
Cotton seed residues 2600–3100 17.07
Sugar beet residues 1500–2000 16.72
Hazelnut shell 350 000 1.9 kWh
Walnut shell 150 000 20.18
Olive waste 450 000 tons/1 million tons of olive 12.5–21.0
Cocoon shell 10 00 000 5.3 kWh
Wood and woody materials 12 000 000 62.3 kWh
Table 6
Chemical and structural analyses of biomass samples (wt% dry and extractive free basis) [17,26]
Sample C% H% O% N% Ash Moisture HHV
(Mj/kg)
Hemicellulose Cellulose Lignin
Hazelnut shell 52.9 5.6 42.7 1.4 1.3 9.0 19.3 29.9 25.9 42.5
Hazelnut seedcoat 51.0 5.4 42.3 1.3 1.4 6.8 19.3 15.7 29.6 53.0
Softwood (av.) 52.1 6.1 41.0 0.2 1.7 8.8 20.0 24.4 45.8 28.0
Hardwood (av.) 48.6 6.2 41.1 0.4 2.7 7.8 18.8 31.3 45.2 21.7
Waste material 48.3 5.7 45.3 0.7 4.5 11.0 17.1 29.2 50.6 24.7
Walnut shell 49.9 5.7 43.4 0.2 0.6 — 20.2
Tea waste 48.6 5.5 39.5 0.5 3.4 6.5 17.1 19.9 30.2 40.0
Wood bark 53.1 6.1 40.6 0.2 1.6 8.8 20.5 29.8 24.8 43.8
Wheat straw 45.5 5.1 34.1 1.8 13.5 8.5 17.0 39.1 28.8 18.6
Corncob 49.0 5.4 44.6 0.4 1.0 12.1 17.0 32.0 52.0 15.0
Corn stover — — — — 3.7 10.6 17.8 30.7 51.2 14.4
Tobacco stalk — — — — 2.4 8.9 17.7 28.2 42.4 27.0
Tobacco leaf — — — — 17.2 8.4 15.0 34.4 36.3 12.1
Olive husk 50.0 6.2 42.2 1.6 4.0 9.2 19 23.6 24.0 48.4
Spruce wood 51.9 6.1 40.9 0.3 0.5 7.6 20.1 21.2 50.8 27.5
Beech wood 49.5 6.2 41.2 0.4 0.4 7.4 19.2 31.8 45.8 21.9
Ailanthus wood 49.5 6.2 41.0 0.3 0.5 8.1 19.0 26.6 46.7 26.2
A.G. Dumanli et al. / Renewable and Sustainable Energy Reviews 11 (2007) 2058–20822066
Forest sources of Turkey shows an exponential declining due to insufficient forestryplantation and regeneration. Turkish forest area occupies about 26.6% (20.7 millionhectares) of entire land area, of which 48% is productive. Productive high forests coverabout 39.4% of total forest area and 10.5% of total land area [24].Main tree species in Turkey are, coniferous, which makes up about 54% and
broadleaved 46% of designated forest area. Most abundant species in Turkey are namelyconiferous, pine, fir, spruce and cedar and among hardwoods beech, oak, chestnut,hornbeam and alder.

ARTICLE IN PRESSA.G. Dumanli et al. / Renewable and Sustainable Energy Reviews 11 (2007) 2058–2082 2067
Estimated total annual wood increment in Turkish forests is about 34 millionm3.Annual total wood production including private is about 28 millionm3, of which 63% isconsumed as fire wood [24].
In Turkey, 5.9% of entire country (17.5% of forest areas) has been set aside forconserving natural values, especially biological diversity, and for preventing soil erosionand land slides. The areas set aside for protecting biological diversity alone, constitute0.9% of total land area and 1.8% of total forest area. Table 7 shows a summary of forestpotential of Turkey and main tree species that can be found in Turkey are presented inTable 8.
When the biological species are considered, Turkey would be one of the richest countriesin the world which means, non-wood products and services play very important role in thelife of people, especially that of rural poor regions [27]. Turkey is the largest producer andexporter of agricultural products in the near East and North African region. Despite theoverall trade deficit of Turkey, the agricultural trade balance is significantly positive,providing some relief to external accounts. Trade liberalization and rising demand in theregion resulted in agricultural product exports (excluding agro-industry) rising to a valueof approximately US$ 2.5 billion in 2003 and accounts for 5.3% of Turkey’s total exportearnings [28].
According to the Turkish Forestry Inventory, the Turkish forestry treasure is 1.2 billionm3, and the growth of this on the year basis is 34 million m3, on the other hand, theamount among these forest area which is available for woodcutting is 18 million m3 [29].Turkish wood demand per year will be 43 million m3 by the year 2020. And if thedifference between wood production and consumption will be supplied by import,government should have to pay 6.4 billions USD. In order to meet this deficiency,government should build up modern energy forests itself and citizens should be stimulated
Table 7
Forest potential of Turkey [24]
Quality Grand total (ha)
High forest Coppice
Coniferous Broadleaved Total Coniferous Broadleaved Total
Area
Productive forest 64 88 725 16 72 455 81 61 180 3414 17 89 268 17 92 682 99 53 862
Degraded forest 45 86 869 15 35 262 61 22 131 30 087 46 06 814 46 36 901 10 759 032
Total 11 075 594 32 07 717 14 283 311 33 501 63 96 082 64 29 583 20 712 894
Growing stock (000m3)
Productive forest 742 224 276 358 10 18 582 87 80 786 80 873 10 99 455
Degraded forest 44 884 18 754 63 638 143 23 192 23 335 86 973
Total 787 108 295 112 10 82 220 230 103 978 104 208 11 86 428
Annual increment (000m3)
Productive forest 19 686 6674 26 360 29 4641 4670 31 030
Degraded forest 1009 588 1597 3 1369 1372 2969
Total 20 695 7262 27 957 32 6010 6042 33 999
Annual allowable cut
Selection methods 417 40 457
Regeneration methods 6402 2145 8548
Tending methods 2229 980 3209
Total 9048 3165 12 214 5884

ARTICLE IN PRESS
Table 8
Main tree species in Turkish forests [24]
Species High forests Total forest area
Family of species # of species Area (ha) % Area (ha) %
Coniferous
Pine–Pinus 7 55 41 722 67.90 86 01 681 41.53
Fir–Abies 4 457 778 5.61 61 9791 3.00
Spruce–Picea 1 185 138 2.26 286 658 1.38
Cedar–Cedrus 1 219 369 2.68 336 342 1.62
Juniper–Juniperus 6 78 583 0.96 12 34 162 5.96
Cypress–Cupressus 1 666 0.01 1 347 0.01
Douglas–Pseudotsuga 1 280 — 280 —
Others 5191 0.06 28 835 0.14
Sub total 6 488 727 79.48 11 109 096 53.64
Broadleaved
Beech–Fagus 1 10 60 822 13.00 13 35 786 6.45
Oak–Quercus 34 349 259 4.28 60 89 327 29.40
Chestnut–Castanea 1 56 886 0.70 99 434 0.48
Hornbeam–Carpinus 2 57 550 0.70 99 309 0.48
Alder–Alnus 2 57 815 0.70 109 502 0.53
Ash–Fraxinus 3 8096 0.10 11 669 0.06
Poplar–Populus 6 10 289 0.12 20 548 0.10
Maple–Acer 10 1579 0.02 2953 0.01
Lime–Tilia 4 4944 0.06 5424 0.03
Acacia–Acacia 1 1022 0.01 3075 0.02
Sweet Gum–Liquidambar 1 1930 0.02 3191 0.02
Plane–Platanus 2 817 0.01 1470 0.01
Eucalypt–Eucalyptus 1 771 0.01 6655 0.03
Tree of Heaven–Ailanthus 3 802 0.01 802 —
Hop Honbeam–Ostrya 1 646 0.01 2066 0.01
Elm–Ulmus 3 459 0.01 519 —
False Acacia–Robinia 1 234 — 234 —
Walnut–Juglan 1 176 — 176 —
Willow–Salix 19 160 — 2194 0.01
Birch–Betula 3 11 — 596 —
Laurel–Laurus 1 — — 409 —
Others 58 186 0.71 18 08 460 8.72
Sub total 16 72 454 20.52 96 03 799 46.36
Grand total 81 61 181 100.00 20 712 895 100.00
A.G. Dumanli et al. / Renewable and Sustainable Energy Reviews 11 (2007) 2058–20822068
for energy afforestation by government also. General Management of Forestry has startedenergy forestry in 1978, and the afforested area under this project was 535,000 ha at theend of 2001. Efficiency of the energy forestry in Turkey from wood product per unit areapoint of view is well below than the countries, which are the leaders in this subject [30].
3.2. Animal based biomass samples available in Turkey
Animal husbandry is one of the main means of living. Thus a significant amount ofanimal wastes are produced each year. In Turkey, most of the animal based biomassstudies have been done in the area of biogas research and development projects since the

ARTICLE IN PRESSA.G. Dumanli et al. / Renewable and Sustainable Energy Reviews 11 (2007) 2058–2082 2069
1960s. In addition to feasibility studies on biogas utilization, many digesters have beenconstructed at different places in the country. The representative animal-based residuesand their total energy potential is given in Table 9.
3.3. Non-toxic solid wastes
The solid wastes have been recording by Government Statistics Institute since 1994. Bythe end of 2002, among 3215 municipalities, 2984 have solid waste removal service. Thesolid waste removal situation by the municipalities is presented in Fig. 3.
The first power generation attempts based on biogas applications had been started in1957 and continued until 1987. Recently, power generation by using biomass and wasteattempts have been restarted on small scale by using municipal solid wastes (MSW) [32].The Ministry of Energy and Natural Resources has planned to increase the production ofbiomass energy, which uses up animal and plant waste, to 7530 thousand tons of oilequivalent (Ttoe) by 2020. Modern biomass energy production, however, has not beenforeseen at all. In fact, classical biomass energy production with no commercial valueshould be decreased and modern biomass energy production should start and be increased.
Table 9
Total and recoverable bioenergy potential of animal wastes in Turkey [31]
Kind of animal Total number of
animals (thousand
head)
Coefficient of
conversion (ktoe
per thousand
animals)
Total energy
potential (ktoe)
Recoverable energy
potential (ktoe)
Sheep and goats 75 095 0.048 3604 1081
Donkey, horse,
mule and camel
1370 0.235 322 97
Poultry 311 500 0.003 935 281
Cattle and water
buffalo
12 121 0.245 2970 891
Burying; 2
Other; 2.8To the MetropolitanMunicipality; 15.5
To otherMunicipality Refuse; 2.9
RegularStocking; 27.8
To the MunicipalityRefuse; 45.9
Spilling to the Rivers; 0.8
Burning in thr Air; 0.9
Composting; 1.5
Fig. 3. Solid wastes in Turkey according to the Removal Type [34].
ARTICLE IN PRESS
Table 10
Waste power plants in Turkey [33]
Waste plant Power (MW) Net energy production (million kWh/y)
Adana waste plant 45 302
Mamak waste gas plant 10 76.8
Bursa waste gas plant 14 Auto-producer
Izmit waste gas plant 72 Auto-producer
Mersin waste plant 18.8 On construction
Tarsus waste plant 12.5 On construction
A.G. Dumanli et al. / Renewable and Sustainable Energy Reviews 11 (2007) 2058–20822070
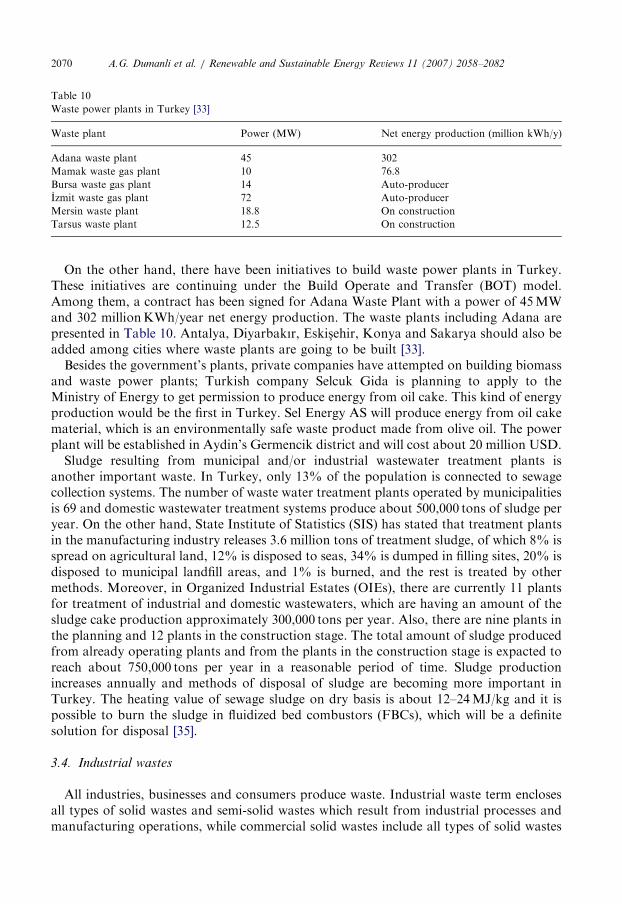
On the other hand, there have been initiatives to build waste power plants in Turkey.These initiatives are continuing under the Build Operate and Transfer (BOT) model.Among them, a contract has been signed for Adana Waste Plant with a power of 45MWand 302 millionKWh/year net energy production. The waste plants including Adana arepresented in Table 10. Antalya, Diyarbakır, Eskis-ehir, Konya and Sakarya should also beadded among cities where waste plants are going to be built [33].Besides the government’s plants, private companies have attempted on building biomass
and waste power plants; Turkish company Selcuk Gida is planning to apply to theMinistry of Energy to get permission to produce energy from oil cake. This kind of energyproduction would be the first in Turkey. Sel Energy AS will produce energy from oil cakematerial, which is an environmentally safe waste product made from olive oil. The powerplant will be established in Aydin’s Germencik district and will cost about 20 million USD.Sludge resulting from municipal and/or industrial wastewater treatment plants is
another important waste. In Turkey, only 13% of the population is connected to sewagecollection systems. The number of waste water treatment plants operated by municipalitiesis 69 and domestic wastewater treatment systems produce about 500,000 tons of sludge peryear. On the other hand, State Institute of Statistics (SIS) has stated that treatment plantsin the manufacturing industry releases 3.6 million tons of treatment sludge, of which 8% isspread on agricultural land, 12% is disposed to seas, 34% is dumped in filling sites, 20% isdisposed to municipal landfill areas, and 1% is burned, and the rest is treated by othermethods. Moreover, in Organized Industrial Estates (OIEs), there are currently 11 plantsfor treatment of industrial and domestic wastewaters, which are having an amount of thesludge cake production approximately 300,000 tons per year. Also, there are nine plants inthe planning and 12 plants in the construction stage. The total amount of sludge producedfrom already operating plants and from the plants in the construction stage is expacted toreach about 750,000 tons per year in a reasonable period of time. Sludge productionincreases annually and methods of disposal of sludge are becoming more important inTurkey. The heating value of sewage sludge on dry basis is about 12–24MJ/kg and it ispossible to burn the sludge in fluidized bed combustors (FBCs), which will be a definitesolution for disposal [35].
3.4. Industrial wastes
All industries, businesses and consumers produce waste. Industrial waste term enclosesall types of solid wastes and semi-solid wastes which result from industrial processes andmanufacturing operations, while commercial solid wastes include all types of solid wastes

ARTICLE IN PRESS
Baby Dipers8%
Metal6%
Glass6%
ResiduesTextile Industry
5%Residues
Nylon Industry
9% ResiduesPlastic Industry
5%
ResiduesPaper Industry
8%
MarterialsOrganic
44%
SubstancesAsh and Other
9%
Fig. 4. Main constituents of industrial residues in Istanbul [36].
A.G. Dumanli et al. / Renewable and Sustainable Energy Reviews 11 (2007) 2058–2082 2071
generated by stores, offices and other commercial sources, excluding residences, andexcluding industrial wastes. Some part of those industrial and commercial wastes arebiodegradable, such as paper fines and industrial biosludge, into mixed alcohol fuels (e.g.isopropanol, isobutanol, isopentanol) [10]. The types of industrial wastes and thecomparative amounts are given in Fig. 4.
4. Co-firing aspects
Biomass can be converted into useful forms of energy using number of differentprocesses. Conversion process is selected according to the type and quantity of biomassfeedstock, the desired form of the energy, environmental standards expectations, economicconditions and designing factors. Conversion of biomass to energy is undertaken using twomain processing technologies: first category is thermo-chemical processes, which includecombustion, pyrolysis, gasification and liquefaction and bio-chemical/biological processesconsist of digestion (production of biogas, a mixture of mainly methane and carbondioxide) and fermentation (production of ethanol) [8,37]. Co-combustion of biomass withother fuels can be advantageous with regard to cost, efficiency and emissions. Processingcosts can be lowered and higher efficiencies of large plants can be utilized for biomass andemissions of CO2, SOx and NOx can be reduced by co-firing process. The use of biomass inthe existing boilers, which are designed for coal combustion is much cheaper than buildingnew biomass plants [14]. Fluidized bed systems are particularly well suited for such a co-firing operation because of their versatility with regard to fuel [38,39]. While usingbiomass, care has to be taken if high chlorine and high alkaline, which are known to benegative effects on operation like corrosion or slagging of the heat transfer surfaces [40,41].In a generalized sense, the co-firing processes can be categorized as following:
(a)
Co-combustion or direct co-firing: the biomass is directly fed to the boiler furnace ofany type (fluidized bed, grate or pulverized combustion), if needed, physicalpreprocessing is applied to the biomass and coal such as drying, grinding or metalremoval.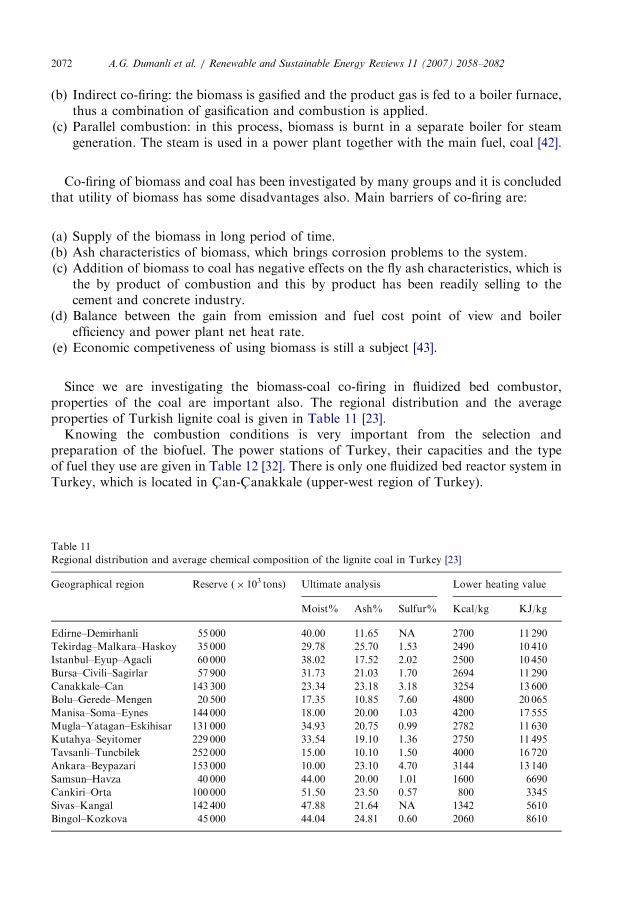
ARTICLE IN PRESSA.G. Dumanli et al. / Renewable and Sustainable Energy Reviews 11 (2007) 2058–20822072
(b)
Tab
Regi
Geo
Edir
Teki
Istan
Burs
Can
Bolu
Man
Mug
Kuta
Tavs
Ank
Sam
Can
Siva
Bing
Indirect co-firing: the biomass is gasified and the product gas is fed to a boiler furnace,thus a combination of gasification and combustion is applied.
(c)
Parallel combustion: in this process, biomass is burnt in a separate boiler for steamgeneration. The steam is used in a power plant together with the main fuel, coal [42].Co-firing of biomass and coal has been investigated by many groups and it is concludedthat utility of biomass has some disadvantages also. Main barriers of co-firing are:
(a)
Supply of the biomass in long period of time. (b) Ash characteristics of biomass, which brings corrosion problems to the system. (c) Addition of biomass to coal has negative effects on the fly ash characteristics, which isthe by product of combustion and this by product has been readily selling to thecement and concrete industry.
(d)
Balance between the gain from emission and fuel cost point of view and boilerefficiency and power plant net heat rate.(e)
Economic competiveness of using biomass is still a subject [43].Since we are investigating the biomass-coal co-firing in fluidized bed combustor,properties of the coal are important also. The regional distribution and the averageproperties of Turkish lignite coal is given in Table 11 [23].Knowing the combustion conditions is very important from the selection and
preparation of the biofuel. The power stations of Turkey, their capacities and the typeof fuel they use are given in Table 12 [32]. There is only one fluidized bed reactor system inTurkey, which is located in C- an-C- anakkale (upper-west region of Turkey).
le 11
onal distribution and average chemical composition of the lignite coal in Turkey [23]
graphical region Reserve (� 103 tons) Ultimate analysis Lower heating value
Moist% Ash% Sulfur% Kcal/kg KJ/kg
ne–Demirhanli 55 000 40.00 11.65 NA 2700 11 290
rdag–Malkara–Haskoy 35 000 29.78 25.70 1.53 2490 10 410
bul–Eyup–Agacli 60 000 38.02 17.52 2.02 2500 10 450
a–Civili–Sagirlar 57 900 31.73 21.03 1.70 2694 11 290
akkale–Can 143 300 23.34 23.18 3.18 3254 13 600
–Gerede–Mengen 20 500 17.35 10.85 7.60 4800 20 065
isa–Soma–Eynes 144 000 18.00 20.00 1.03 4200 17 555
la–Yatagan–Eskihisar 131 000 34.93 20.75 0.99 2782 11 630
hya–Seyitomer 229 000 33.54 19.10 1.36 2750 11 495
anli–Tuncbilek 252 000 15.00 10.10 1.50 4000 16 720
ara–Beypazari 153 000 10.00 23.10 4.70 3144 13 140
sun–Havza 40 000 44.00 20.00 1.01 1600 6690
kiri–Orta 100 000 51.50 23.50 0.57 800 3345
s–Kangal 142 400 47.88 21.64 NA 1342 5610
ol–Kozkova 45 000 44.04 24.81 0.60 2060 8610

ARTICLE IN PRESS
Table 12
Powerstations in Turkey [32]
Name of powerplant Type of fuel City Capacity (MW)
1 Afs-in-Elbistan A Lignite K. Maras- 1360
2 Aliaga GT+KC- Motorin Izmir 180
3 Ambarlı Fuel–Oil Istanbul 630
4 Ambarlı KC- * Natural gas Istanbul 1350
5 Bursa NG Natural gas Bursa 1432
6 C- an Onsekizmart Lignite C- anakkale 320
7 C- atalagzı B Hard coal Zonguldak 300
8 Denizli Vapor Denizli 17.5
9 Esenyurt I, II, III, IV Natural gas Istanbul 188.5
10 Enron (Trakya Elek) Natural gas Tekirdag 498
11 Engil GT Motorin Van 15
12 Hakkari Fuel–Oil Hakkari 11
13 Hamitabat KC- Natural gas Kırklareli 1200
14 Hopa Fuel–Oil Artvin 50
15 Kangal 1, 2, 3** Lignite Sivas 457
16 Kemerkoy 1, 2, 3 Lignite Mugla 630
17 Orhaneli Lignite Bursa 210
18 Oya elektrik Natural gas Kocaeli 258
19 Park Termik Lignite Ankara 620
20 PS3-Silopi Fuel–Oil S- .Urfa 44
21 PS3A-Idil Fuel–Oil Mardin 11.4
22 Seyitomer Lignite Kutahya 600
23 Soma A Lignite Manisa 44
24 Soma B Lignite Manisa 990
25 Tunc-bilek A+B Lignite Kutahya 429
26 Unimar Natural gas Tekirdag 504
27 Van Fuel–Oil Van 24
28 Yatagan Lignite Mugla 630
29 Yenikoy Lignite Mugla 420
A.G. Dumanli et al. / Renewable and Sustainable Energy Reviews 11 (2007) 2058–2082 2073
5. Logistic aspects
The more available the biomass the more practical it becomes as a fuel. Thus,determination of the regional availability and transport possibilities of the biomass is veryimportant. Additionally, the existing power plants are going to be considered according totheir closeness to the biomass sources. The below Fig. 5 summarizes the energy sector inTurkey. In the figure the black labels show the power stations, blue labels are the coalmines and the red labels represent the coal mines on investment stage.
Distribution of the biomass is another factor for biomass evaluation. In the followingFig. 4 the simple demonstration of the highways in Turkey are shown, in fact, the realnetwork is more advanced and Fig. 5 represents the rail roads for transportation. Besidesthe ability of reaching the area desired of the selected route, its economy is anotherimportant point of decision. Basically transportation by railroads is much cheaper than themain roads, but, as it can be seen from the following figures; main roads have much moreopportunities for the distribution of the fuel. Railroads can be selected for the destinationswhere available, or railroad transferred by main road option can be considered also.

ARTICLE IN PRESS
Fig.5.Energysectorin
Turkey
[44].
A.G. Dumanli et al. / Renewable and Sustainable Energy Reviews 11 (2007) 2058–20822074

ARTICLE IN PRESSA.G. Dumanli et al. / Renewable and Sustainable Energy Reviews 11 (2007) 2058–2082 2075
6. Technological aspects
6.1. Collected methodologies
In Turkey there is no such an organizational collected methodology developed forbiomass energy sources. The responsible authorities for solid waste management in Turkeyare the Ministries of Environment, Industry and Trade, Interior Affairs, Public Works andSettlement, municipalities, the chambers of trade and industry; and the Turkish StandardsInstitute. Among the biomass consumers wood-derived industries and household usersconsume the main portion biomass energy. Lumber, pulp and paper industries burn theirown wood wastes in large furnaces and boilers to supply 60% of the energy needed to runfactories. In terms of household burning, wood is usually burnt in stoves andapproximately 6.5 million homes in Turkey use biomass as their primary heating fuel.Agricultural and municipal solid wastes can be used as energy sources economically inTurkey also (Figs. 6 and 7).
6.2. Plantation and production methodologies
Biomass plantation is an energy forests and energy crops based issue. The aim of thebiomass plantation is to obtain modern biofuels. The basis of the biomass plantation isphotosynthesis, and the plants which can make faster photosynthesis and grow quickly arepreferred.
According to the present tree types, only 7 t/ha amount of wood is possible to beproduced per year, which means the power of the wood plantation is about 2.8 kW/ha. Onthe other hand, depending on the efficiency of utilization, specific power value declines,thus, in order to obtain 1 kW of power with a wood boiler we need 1.43 ha of plantedforest. The efficiency of energy forests should be higher that the natural forestration. Theefficiency of an energy forest is between 15 and 35 t/ha and the plantation period is about4–8 years. Recently, the most preferred tree types for energy forestry are black poplar,balsam poplar, trembling poplar, willow and eucalyptus [47].
Energy plantation is done with C4 type of plants for 1 year period or several yearsperiod of time. Sweet sorghum, miscanthus, sugar cane and corn are in the class of C4 typeplants and from these plants, it is possible to produce ethanol, synthetic petroleum, biogasand solid biofuels. C3 plants such as, wheat, barley, rye, sugar beet have a production rateof 10–30 tons/ha/year and their dry matter production per unit leaf is 50–200 g/m2 leaf/day.On the other hand, C4 type plants have a production rate of 60–80 tons/ha/year and theirdry matter production per unit leaf is 400–500 g/m2 leaf/day [48].
In Turkey, energy plantation and forestry are the emerging subjects to be developed. Forthis reason in the scope of energy planning for the area allocated for energy, forestry andplantation, a strict agricultural and afforestration production planning should be made.
6.3. Densification to transport and preparation of the fuel
Wood can be either chipped or briquetted prior to use. These chips or briquettes aresupposed to be utilized in the co-combustion with coal in the power plants. There are nosuch biomass preparation application present in Turkey, the dried and compressed animalwastes, which are used as household fuel in rural areas. Biomass species can be either

ARTICLE IN PRESS
Fig.6.Main
roadsin
Turkey,adaptedfrom
[45].
A.G. Dumanli et al. / Renewable and Sustainable Energy Reviews 11 (2007) 2058–20822076

ARTICLE IN PRESS
Fig.7.Railroadsin
Turkey,adaptedfrom
[46].
A.G. Dumanli et al. / Renewable and Sustainable Energy Reviews 11 (2007) 2058–2082 2077

ARTICLE IN PRESSA.G. Dumanli et al. / Renewable and Sustainable Energy Reviews 11 (2007) 2058–20822078
chipped or briquetted prior to use. Since there are no such attempts of co-combustion ofbiomass with coal, there is no fuel preparation methods described yet in TurkishStandards.
7. Environmental aspects
The environmental considerations include the emissions and solid wastes after usingbiomass as an energy source. By means of emissions, although biomass can be directlyburnt in conventional boilers. There are advantages of co-firing biomass and coal, such asco-firing biomass with coal, which in comparison with single coal firing, helps to reduce thetotal emissions. Co-firing biomass with coal reduces both NOx and SOx emissions fromexisting pulverized coal-fired power plants [49]. Co-firing may be preffered for the purposeof reducing the costs, minimize waste and reduce soil and water pollution, depending uponthe chemical composition of the biomass used.Due to its low sulfur content, biomass reduces the SOx emissions [15]. NOx emissions are
reported to be reduced by the use of biomass in a range of 10–40% depending on the typeand amount of the biomass used. On the other hand, biomass emits CO2, but the amountof CO2 is the same that biomass consumes from the atmosphere during its growth. Thus ina short term cycle, biomass can be considered as a CO2 neutral fuel [18]. Biomass alsoemits CO, N2O, CH4 other hydrocarbons and particulate matter, and trace elementemissions reduce as well [15]. Inspite of the presence of some uncertainties at the moment,SO2, CO2 and ash production will be typically far lower for biomass power systems thanfor coal combustion and conversion systems [50–52].The amount of ash deposition from biomass can either be greater or considerably less
than that from coal. Trace elements comes from biomass’ nature transfers to the ashcontent. The amounts of trace element levels are related to species of biomass, growing siteof the sample, age of plant, and distance the source of pollution [50]. The utilization ofbiomass and waste as fuels has an environmental benefit. On the other hand, using biomasscan introduce environmental risks due to the content of heavy metals, especially Cd in thecombustion residues. In addition, the potassium (K), sodium (Na), chlorine (Cl) and sulfur(S) content of the biomass fly ash as well as in the boiler fly ash is great, which may causeundesirable reactions that can take place in the boiler section results with fouling andcorrosion [53].The main problem concerning waste plants are the emissions to the air while burning.
Necessary controls should be taken over by the Ministry of Environment for theseemissions to be under standards foreseen by the European Union and no facility should begiven license, if it has no Energy Information Administration.Recently, environmental problems resulting caused by energy production, conversion
and utilization take a great attention from public, industry and government [54]. Turkeymade great progress over the last 15 years in terms of its environmental problems: the 1982Constitution recognizes the right of citizens to live in a healthy and balanced environment;an Environment Act was passed in 1983; the Ministry of Environment was established in1991; public awareness and demand for a clean environment are growing; and active non-governmental environmental organizations are emerging. Despite these positive develop-ments, there are still economic and social decisions need to be taken in order to incorporatethe environmental issues adequately [19].

ARTICLE IN PRESSA.G. Dumanli et al. / Renewable and Sustainable Energy Reviews 11 (2007) 2058–2082 2079
8. Economic aspects
In future, it is expected that biomass will provide a cost-effective, sustainable andenvironmental friendly supply of energy.
Turkish energy policy needs to meet fast growing demand in a reasonable period of time,which means large investments has to be made. On the other hand, private sector hasrelatively limited financial capacity. Thus in order to be more efficient and effective, theprivate sector has to be mobilized.
The energy prices should be determined in such a way that the balance between demandand supply to be established without undervaluing the rest of the economy andenvironment. Additionally, energy prices must reflect the cost imposed by the specificconsumer category on the economy. Another important point about energy pricing policyis it should not be employed as an anti-inflationary instrument. It should be applied in sucha way that it does not create cross subsidies between classes of consumers [55,56].
Another important consideration of using biomass is the tariff of using biomass energyas well as its production cost. According to the ‘Law of Priority for Renewable EnergySources’ accepted by Parliament of Federal Germany in 1999, which is accepted as agroundbreaking development for renewable energy sector, this law was specifying theactual prices that would be paid for generation from each of several different renewabletechnologies independent of the retail price for electricity and this is expected to be a modelfor overall Europe [57]. Since the European Membership negotiations of Turkey hasstarted on 3 October 2005, a very similar regulation will be used in Turkey. According to‘Law of Priority for Renewable Energy Sources’, tariff regulations for the electrictyobtained from biomass sources are as the following:
1.
For the plants with a capacity lower than 500 kWatts, at least 10.23 cents/kWatt. 2. For the plants with a capacity lower than 5MWatts, at least 9.2 cents/kWatt. 3. For the plants with a capacity lower than 500MWatts, at least 8.69 cents/kWatt [58].9. Conclusions
Turkey has most of the energy sources, but unfortunately, Turkey is an energyimporting country. In order to be less dependent on other countries, Turkey needs to useits sustainable sources. For this point of view, biomass is a very attractive choice, since it iseconomical, sustainable, environmental friendly and a familiar energy source for Turkey.Additionally, Turkey has several advantages for the use of biomass sources in terms of itsclimate.
In this paper, we investigated the use of biomass for co-firing with coal. Thus, wesearched for the characteristics of the fuel, logistic aspacts, environmental aspects,technical and economical aspects of using biomass with coal.
Worldwide, biomass is in the fourth place as an energy source and provides about 14%of the world’s energy needed. Turkey is one of the world’s biggest wheat and barleyproducers, and Turkey is a very rich country in terms of biological diversity. Also, Turkeyhas a significant amount of agricultural wastes, which needs to be utilized. On the otherhand, according to the Turkish Forestry Inventory the Turkish forestry treasure is1.2 billionm3, and the growth of this, on the year basis is 34millionm3. Another source of

ARTICLE IN PRESSA.G. Dumanli et al. / Renewable and Sustainable Energy Reviews 11 (2007) 2058–20822080
biomass sources is coming from animal husbandry, which is one of the main means ofliving, means a significant amount of animal wastes are produced each year.There are initiative studies about evaluating the non-toxic solid wastes, which are needed
to be spread, such as from Adana and Mamak waste plants. Another non-toxic solid wasteis sludge which has a big potential, i.e. 500,000 tons per year for use as fuel.Biomass can be converted into useful forms of energy using a number of different
processes. Fluidized bed systems are particularly well suited for such a co-firing operationbecause of their versatility with regard to fuel. Although emissions of CO2, SOx and NOx
can be reduced by co-firing process, care has to be taken of high chlorine and high alkaline,which are known to be negative effects on operation like corrosion or slagging of the heattransfer surfaces.The more available the biomass, the more practical it becomes as a fuel. Thus, we
investigated the logistic distribution of the power plants and transport possibilities. In fact,Turkey has a chance to grow biomass species throughout the country depending on theannual rainfalls, but transport possibilities are also important. In one hand, we haverailroad transportation which is cheap, on the other hand, we have main roads which arewell distributed.In terms of technological issues there is no organizationally collected methodology
developed for biomass energy sources, but the biomass plantation and productionmethodologies are well described although it is not applicable yet.The energy pricing of the biomass sources are not regulated by the Turkish
government yet, but the prior considerations are made. Basically, the energy pricesshould be determined in such a way that the balance between demand and supply isestablished.
Acknowledgement
This research is being supported by the European Commision, Sixth FrameworkProgramme, FP6, within the Priority of Sustainable Energy Systems, with the Projectentitled COPOWER (Synergy effects of co-processing of biomass with coal and non-toxicwastes for heat and power generation), Project no: 503806.
References
[1] Boyle G. Renewable energy-power for a sustainable future. Oxford University Press: Oxford; 1998.
[2] European Union Sixth Framework Programme, Contract for Specific Targeted Research, Copower Project -
Annex I. Description of Work: 2003.
[3] Ediger VS, Kentel E. Renewable energy potential as an alternative to fossil fuels in Turkey. Energy Convers
and Manage 1999;40:743–55.
[4] Sensoy S. Turkish State Meteorological Service, Climate of Turkey 2003. Available from: www.meteor.gov.tr
[5] Turkish energy report. World Energy Council Turkish National Committee, 1995.
[6] Ministry of Energy and Natural Sources of Turkey 2005. Available from: www.enerji.gov.tr
[7] World Energy Council Turkish National Committee 2003. Available from: http://www.dektmk.org.tr
[8] Wereko-Brobby CY, Hagan EB, editors. Biomass conversion and technolgy. New York: Wiley; 1996.
[9] European union sixth framework programme copower project annex i. Description of work. 2004.
[10] Demirbas A. Combustion characteristics of different biomass fuels. Progr Energy Combust Sci
2004;30:219–30.
[11] Spliethoff H, Hein KRG. Effect of co-combustion of biomass on emissions in pulverized fuel furnaces. Fuel
Processing Technology 1998;54:189–205.

ARTICLE IN PRESSA.G. Dumanli et al. / Renewable and Sustainable Energy Reviews 11 (2007) 2058–2082 2081
[12] Sami M, Annamalai K, Wooldridge M. Co-firing of coal and biomass fuel blends. Progr Energy Combust Sci
2001;27:171–214.
[13] Korbee R, Cieplik MK, Kiel JHA. Cost-effective screening of biomass materials for co-firing. Proceedings of
the world conference and technology exhibition on biomass for energy, Industry and Climate Protection.
2004, Rome, Italy.
[14] Savolainen K. Co-firing of biomass in coal-fired utility boilers. Appl Energy 2003;74:369–81.
[15] Tillman DA. Biomass coring: The technology, the experience, the combustion consequences. Biomass
Bioenergy 2000;19:365–84.
[16] Armesto L, et al. Co-combustion of coal and olive oil industry residues in fluidised bed. Fuel 2003;
82:993–1000.
[17] Surmen Y, Demirbas A. Cofiring of biomass and lignite blends: Resource facilities; technological and
environmental issues. Energy Sources 2003;25:175–87.
[18] Baxter L. Biomass-coal co-combustion: Opportunity for affordable renewable energy. Fuel 2005;84:
1295–302.
[19] Demirbas A. Energy and environmental issues relating to greenhouse gas emissions in Turkey. Energy
Convers Manage 2003;44:203–13.
[20] Turkey’s statistical yearbook. Republic of Turkey, Prime Ministry State Institute of Statistics, 2004.
[21] Maharaj KM. New-Agriculturist on-line; 1999. Available from: http://www.new-agri.co.uk
[22] Report on ‘‘Turkish agriculture during globalization process’’. Undersecretariat of Treasury and foreign
Trade, 2004.
[23] Eighth five year development plan, private specialization comission for electricity energy report. State
Planning Organization: Ankara; 2001.
[24] Konukcu M. Statistical profile of Turkish forestry. State Planning Organization, 1998.
[25] Production targets on fruit growing sector in Turkey. 2005, Turkish Agricultural Engineers Society.
[26] Demirbas A. Calculation of higher heating values of biomass fuels. Fuel 1997;76:431–4.
[27] Demirayak F. Biological diversity-protection of nature and sustainable development. TUBITAK, Vision
2023 Project, 2002.
[28] Report on Turkish economy, agriculture. Undersecretariat of The Prime Ministry for Foreign Trade, Export
Promotion Center, 2004.
[29] General Directorate of Forests in Turkiye. The forest assesment of Turkey 2005. Available from:
www.ogm.gov.tr
[30] Saracoglu N. Renewable Energy Sources: Energy Foresty. e-journal of Union of Chambers of Turkish
Engineers and Architects 2005;412.
[31] Kaygusuz K, Sarı A. Renewable energy potential and utilization in Turkey. Energy Convers Manage 2003;
44:459–78.
[32] Environmental atlas of Turkey. Ministry of Environment and Forestry, General Management of
Environmental Effect Evaluation and Planning, Headship of Environment Inventory Office, 2001.
[33] EU Biomass Technology in Agro-industry of Third Countries 2002. Available from: http://www.bio-sme-tc.
net/home/Default.htm
[34] Municipality solid waste statistics of Turkey. State Institute of Statistics, 2002.
[35] Toraman OY, et al. J Environ Sci Health 2004;A39:973–86.
[36] General Managemet of Environment and Forestry of Istanbul. Forest Statistics of Turkey 2006. Available
from: www.istanbulcevor.gov.tr
[37] McKendry P. Energy production from biomass (part 2): Conversion technologies. Bioresource Technol
2002;83:47–54.
[38] Permchart W, Kouprianov VI. Emission performance and combustion efficiency of a conical fluidized-bed
combustor firing various biomass fuels. Bioresource Technol 2004;92:83–91.
[39] Gayan P, et al. Circulating fluidised bed co-combustion of coal and biomass. Fuel 2004;83:277–86.
[40] Ireland SN, Mcgrellis B, Harper N. On the technical and economic issues involved in the co-firing of coal and
waste in a conventional pf-fired power station. Fuel 2004;83:905–15.
[41] Pronobis M. Evaluation of the influence of biomass co-combustion on boiler furnace slagging by means of
fusibility correlations. Biomass Bioenergy 2005;28:375–83.
[42] Williams A, Pourkashanian M, Jones JM. Combustion of pulverised coal and biomass. Progr Energy
Combust Sci 2001;27:587–610.
[43] Gan J, Smith CT. A comparative analysis of woody biomass and coal for electricity generation under various
CO2 emission reductions and taxes. Biomass and Bioenergy 2006;30(4):296–303.

ARTICLE IN PRESSA.G. Dumanli et al. / Renewable and Sustainable Energy Reviews 11 (2007) 2058–20822082
[44] Anac S. Situation of coal in the energy politics. General Management of Turkish Coal Administration, 2003.
[45] General Directorate of Highways. Highways map 2006. Available from: www.kgm.gov.tr
[46] Republic of Turkey State Railroads. Railways map 2006. Available from: www.tcdd.gov.tr
[47] Youth for Habitat-Turkiye. Biomass energy 2004. Available from: www.youthforhab.org.tr
[48] The Scientific & Technological Research Council of Turkey. Biomass Energy and Forestry;2004. Available
from: www.tubitak.gov.tr
[49] Pedersen LS, et al. Effects on SOx and NOx emissions by co-firing straw and pulverized coal. Energy Fuels
1997;11:439–46.
[50] Demirbas A. Potential applications of renewable energy sources, biomass combustion problems in boiler
power systems and combustion related environmental issues. Progr Energy Combust Sci 2005;31:171–92.
[51] McIlveen-Wright DR, Williams BC, McMullan JT. A re-appraisal of wood-fired combustion. Bioresource
Technol 2001;76:183–90.
[52] Lavric ED, Konnov AA, De Ruyck J. Dioxin levels in wood combustion—a review. Biomass and Bioenergy
2004;26:115–45.
[53] Hansen LA, Frandsen FJ, Johansen KD. Characterization of ashes and deposits from high-temperature coal-
straw co-firing. Energy Fuels 1999;13:803–16.
[54] Dincer I. Environmental issues: Ii-potential solutions. Energy Sources 2001;23:69–81.
[55] Surmen Y. The necessity of biomass energy for the Turkish economy. Energy Sources 2003;25:83–92.
[56] Demirbas A. Production potential of electricity from biomass in Turkey. Energy Sources 2002;24:921–9.
[57] Wind-Works.org. Renewable energy tariffs or standard offer contracts: An historical time line 2005.
Available from: www.wind-works.org
[58] Maegaard P. Sensational german renewable energy law and its innovative tariff principles. In: Proceedings of
the Eurosun 2000. Copenhagen; 2000.