fuel processing technology - bioenergy.inl.gov articles/evaluating the...research article evaluating...
TRANSCRIPT

Fuel Processing Technology 140 (2015) 46–56
Contents lists available at ScienceDirect
Fuel Processing Technology
j ourna l homepage: www.e lsev ie r .com/ locate / fuproc
Research article
Evaluating the pelletization of “pure” and blended lignocellulosicbiomass feedstocks
Nathan C. Crawford a,⁎, Allison E. Ray b, Neal A. Yancey b, Nick Nagle a
a National Bioenergy Center, National Renewable Energy Laboratory, Golden, CO 80401, USAb Biofuels and Renewable Energy Technology, Idaho National Laboratory, Idaho Falls, ID 83415, USA
⁎ Corresponding author.E-mail address: [email protected] (N.C. Craw
http://dx.doi.org/10.1016/j.fuproc.2015.08.0230378-3820/Published by Elsevier B.V.
a b s t r a c t
a r t i c l e i n f oArticle history:Received 30 March 2015Received in revised form 18 August 2015Accepted 20 August 2015Available online xxxx
Keywords:BiomassFeedstockPelletingBlendingFlowabilityShearPowder rheometerCompressibilityYield stressFriction
Due to its low density and poorflowability, rawbiomassmay not be an economically viable feedstock for the pro-duction of biofuels. However, mechanical densification can be employed to improve its viability. In this study, theflow properties (compressibility, shear, and wall friction) of “pure” feedstocks (corn stover, hybrid poplar,switchgrass andMiscanthus), and feedstock blends, are investigated and compared tomeasured pelleting energyconsumption values. As anticipated, themore compressiblematerials required lower pelletization energies. Con-versely, the lessflowable feedstocks (i.e., thematerialswith higher cohesion and yield strength)were less energyintensive to pellet. In addition, the flowability parameters of the blendedmaterials could be predicted by averag-ing themeasured flow parameters of their pure feedstock constituents. Therefore, only the flow characteristics ofthe pure feedstocks need to be directly measured, while the flowability of a blended feedstock with a knownblend ratio can be accurately inferred. A model was also developed to calculate the required pressure to pelleta particular feedstock, pure or blended, based on itsflowability parameters (namely compressibility andwall fric-tion). Strong correlation was observed between the measured pelleting energy consumption and the predictedpelleting pressure values. This newly developed model allows for a material's pelleting feasibility to be assessedwithout having to physically pelletize the material.
Published by Elsevier B.V.
1. Introduction
The conversion of biomass, specifically lignocellulosic biomass, intoliquid transportation fuels (i.e., biofuels) has the potential to provide re-newable alternatives to those derived from fossil carbon sources (suchas oil, natural gas, and coal). Lignocellulosic (LC) biomass is the fibrous,structural portion of plants; common examples include: crop residuessuch as corn stover and bagasse, and energy crops like switchgrassand poplar [1]. In addition, LC biomass is the most abundant source ofrenewable carbon on the planet [2] and is not suitable for human con-sumption, completely eliminating the food-to-fuel paradigm.
A consistent supply of a high-quality, economical feedstock is criticalto achieving national biofuel goals; however, raw biomass is not an eco-nomically viable feedstock. Themajor disadvantage of rawbiomass is itslow bulk density, which typically ranges from 40 to 100 kg/m3 for agri-cultural grasses and straws, and 150 to 250 kg/m3 for woody resources[3,4,5,6]. As a result, the low densities of biomass often make it difficultto store, transport, and interfacewith biorefinery infeed systems [3,5,7].
However, “loose” biomass can be mechanically densified intopellets, increasing bulk density as much as ten-fold [3], with reportedfinal compaction densities of 600 to 1200 kg/m3 [8,9,10,11,12,4].
ford).
Mechanical densification not only leads to improved bulk density, butit also enhances feedstock durability, storability, and uniformity [3]. Ad-ditionally, “loose” biomass is known for its poor flowability which pre-vents it from flowing properly during discharge and transfer throughbiorefinery operations. As a result, biorefineries would need to installspecialized equipment to handle these materials, making retrofittingexisting corn-based ethanol plants into cellulosic ethanol plants compli-cated and costly [13]. The uniform size and shape of pelleted biomass,on the other hand, make it more compatible with existing grain-basedstorage and handling equipment [14].
Yet, high energy consumption values have kept pelletization frombeing used for large-scale biofuel production. The energy costs duringgrinding and pelleting of biomasswould need to be less than the gainedsavings from enhanced transportation and storage efficiency [13]. Ener-gy requirements for the densification of biomasswill depend heavily onthe applied pressure, as well as the method of compaction. Also,pelleting energy is contingent on the physical properties of thematerialbeing compressed, such as (but not limited to) moisture content, parti-cle size and size distribution, and initial bulk density [5].
Although difficult to quantify, a recent study byWilson et al. [13] in-vestigated the costs associated with the processing, transportation, andstorage of baled versus pelleted biomass. They estimated the costs forpelleting a variety of feedstock species to be around $30/t. Using datafrom Hess et al. [15], they approximated baling costs to be about $20/t
Nomenclature
A1 Integration constant (kPa/m)C Compressibility (%)CP Compressibility required for pelleting (%)D Pellet die diameter (in)EC Electrical energy consumption during pelleting (kWh/t)fc Unconfined yield stress (kPa)ffc Flowability (or flow) index, =σ1/fc (−)κ Radial-to-axial stress proportionality constant, =σ1/σ2
(−)L Pellet die length (in)L/D Pellet die length-to-diameter ratio (−)μw Coefficient of wall friction (−)MC Moisture content (%)N Normal stress (kPa)Nc Pre-shear critically consolidated normal stress (kPa)P Pressure (MPa)PC Compression pressure (MPa)PP Pelleting pressure (MPa)Pw Wall pressure (MPa)ϕi Angle of internal friction (°)ϕe Effective angle of internal friction (°)r Radial coordinate (−)R Pellet die radius (in)ρP Pellet bulk density (g/mL)ρG Ground (or “loose”) bulk density (g/mL)σ1 Major principal stress (kPa)σ2 Minor principal stress (kPa)τ Shear stress (kPa)τ0 Cohesion (kPa)z Axial coordinate (−)
47N.C. Crawford et al. / Fuel Processing Technology 140 (2015) 46–56
(a net difference of $10/t). However, the reduced transportation andstorage costs for pelleted biomass accounted for an average savings of$50/t compared to baled biomass [13]. Therefore, the reduced truck traf-fic and increased conveying and storage efficiencies substantially offsetany additional processing costs associated with pelleting; making bio-mass pelletization an economical and intriguing pre-processing option.
Beyond bulk density, another challenge with using raw biomass as afeedstock is the necessity to create a reliable year-round feedstock sup-ply. Feed crops are region and climate specific, and as a result, they areharvested at different times of the year (such as cool season grasses inearly spring, wheat, barley and oat straw during the summer, corn andgrain sorghum stalks in the fall, and perennial grasses such as switch-grass in the early winter) [13]. In order for a biorefinery to have a con-sistent feedstock supply and composition, massive storage facilitieswould be required. Pelleting could reduce storage volume requirementsby a factor of two compared to the volumes required for “loose,” non-pelleted biomass [16]. However, due to different harvest times,multiplebiomass specieswould need to be fed and/or pelleted simultaneously tokeep a uniform feedstock composition.
The blending of time-dependent and location-specific materialswould enhance supply-chain efficacy and stabilize feedstock composi-tional variance. Feedstock blends can be formulated not only based onavailability, but with the intention to target specific physiochemicalcharacteristics (such as reducedmilling energy requirements, increaseddigestibility, reduced ash formation, and improved flowability proper-ties). For instance, switchgrass required ~3-times more energy (on av-erage) to hammer mill relative to corn stover [6]. While woodyfeedstocks, like hybrid poplar or pine, tend to result in lower ash forma-tion in comparison to herbaceous feedstocks, such as corn stover and
switchgrass [17,18,19]. A material like corn stover can be blendedwith other biomass to reduce milling energy requirements; however,in order to keep ash content low, a woody biomass could be added tocounter balance increased ash formation. Therefore, in addition topelleting, biomass blending and formulation will be essential to achiev-ing sustainable biofuel production [17].
A number of studies have investigated the densification of herbaceousand woody biomass materials. Ndiema et al. [20] examined the influenceof die pressure on the relaxation characteristics of briquetted rice straw,while Adapa et al. [9] studied the specific energy required to pelletize bar-ley, canola, oat, and wheat straws. Li and Liu [21] used a punch-and-dieprocess to densify wood residues into fuel-grade slugs and Mani et al.[5] evaluated the compaction mechanism of straws, corn stover andswitchgrass at different compression forces, particle sizes, and moisturecontents. In addition, several studies have investigated the impact of par-ticle size andmoisture content (among others) on the physical propertiesof pelleted biomass [22,23,24,14,25]. More recently, Monedero et al. [26]studied the effects of material composition, additive concentration, mois-ture content, and compression on the pelletization process and pelletquality of “pure” and blended pine and poplar sawdust.
However, to our knowledge, no study has used flowmeasurements(compressibility, yield strength,wall friction, etc.) to directly predict thepelletization of pure and blended biomass feedstocks. Knowledge ofhow the compaction and flow properties of different biomass speciescorrelate with the pelletization process will allow scientists to forecastwhether or not a feedstock is suitable for pelleting, and lead to improvedfeedstock blend formulation prior to pelleting.
The objectives of this studywere to (1) investigate theflowpropertiesof pure feedstock species, (2) compare the flow properties of the purespecies to the flowability measurements of feedstock blends, (3) use theflow properties of the feedstocks, both pure and blended, to predictpelleting pressure requirements, and (4) compare the pelleting pressurepredictions to measured pelleting energy consumption values.
2. Materials and methods
2.1. Materials
The lignocellulosic biomass feedstocks selected for this study in-clude: corn stover (CS), hybrid poplar (HP), switchgrass (SG), andMiscanthus (MIS) (Fig. 1). These materials provide a robust mix of her-baceous and woody plants. More specifically, corn stover, switchgrass,and hybrid polar were chosen because they represent a combinationof crop residue, energy crop, and hardwood species.
Single-pass corn stover was harvested in October 2012 in Ames, IA.Bales of corn stover were received at INL in December 2013. Cleanchips of hybrid poplar were obtained from Boardman, OR in November2013. Switchgrass was harvested from Garvin county, OK and collectedby Oklahoma State University in July 2012, and switchgrass bales werereceived in November 2013.Miscanthus was harvested from Tifton, GAin January 2014, and super sacks of chopped, 1-in. material wereshipped to INL in February 2014.
Bales of corn stover and switchgrass, choppedMiscanthus, and chips ofhybrid poplar were fed through a two-stage, full-scale grinding processfor the purpose of pelleting using the Feedstock Process DemonstrationUnit (PDU) as part of DOE's Biomass Feedstock National User Facility(BFNUF) that is located at Idaho National Laboratory (Idaho Falls, ID).First, material was processed through a Vermeer BG-480 (Pella, IA),which has two horizontal grinding drums with swinging hammerspowered by two, 200-HP motors [27], and passed through a 2-in. screen.Then, the 2-in. screened material was processed through a Bliss hammermill (Ponca City, OK) with a 1/4-in. screen. Two, 5-gal buckets of groundmaterialwere sent to theNational Renewable Energy Laboratory (Golden,CO) for further studies. The two-stage grinding process discussed herewas employed solely for generating material for pelleting and is not atypicalmillingmethodused for the conversion of “loose” biomass to fuels.

Fig. 1. Digital images of: a) corn stover, b) hybrid poplar, c) switchgrass, and d)Miscanthus feedstocks (scale bar = 1 in.).
48 N.C. Crawford et al. / Fuel Processing Technology 140 (2015) 46–56
The ground “pure” feedstock species were blended into one binaryand two ternary blend formulations on a dry weight basis. The binaryblend was a 50:50 wt.% mix of CS and SG, while the ternary blendswere 33:33:33 wt.% combinations of CS + SG + HP and CS + SG +MIS. Blending ratios can be designed to target a specific composition(e.g., to adjust glucan, xylan, and lignin fractions), and to enhance di-gestibility and limit ash content.
2.2. Pelleting
Ground biomasswas pelleted using a Bliss Pioneer PelletMill (B35A-75) at Bliss Industries, LLC testing laboratory (Ponca City, OK). The millhas a rated output of ~1000 kg/h for herbaceous biomass, although ca-pacity is material dependent. The pellet mill has two, 40-HP motors,and each motor is instrumented to measure current for calculation ofelectrical energy consumption. The die length-to-diameter ratio (L/D)was selected based upon the feedstock or blend being processed. Pelletswere produced for each feedstock and the three blendstocks (Table 1).Pellet durabilitywasmeasured and validated, but results are not report-ed here.
2.3. Particle sizing
Super sacks of ground biomass were sent to Bliss Industries, LLC.Sieve analysis and bulk density measurements were performed at theBliss test lab. The moisture content and bulk density were measuredfor both the ground and pelleted materials (Table 1). All feedstock ma-terial (pure and blended species) were sieved to obtain particle classifi-cations across fourteen size ranges (in μm): b74, 74–104, 104–150,150–178, 178–211, 211–297, 297–419, 419–594, 594–841, 841–1191,
Table 1Biomass pelleting parameters and results, where:MC is themoisture content, ρ is the density, L ielectrical energy consumption during pelleting. The “±” indicates a single standard deviation f
Material MC (%) ρ (kg/m
Ground Pellet Ground
CS 11.63 ± 0.05 6.66 ± 0.03 112 ± 3HP 13.52 ± 0.03 8.58 ± 0.02 117 ± 2SG 12.62 ± 0.03 7.17 ± 0.03 128 ± 2MIS 13.21 ± 0.04 9.22 ± 0.03 144 ± 3CS + SG 10.71 ± 0.06 7.14 ± 0.02 115 ± 1CS + SG + HP 11.13 ± 0.09 8.47 ± 0.02 128 ± 2CS + SG + MIS 10.16 ± 0.03 8.62 ± 0.02 133 ± 1
1191–1679, 1679–2380, 2380–3353, and N3353. After sieving, themass retained on each sieve wasweighed. The geometric average parti-cle size and standard deviation were calculated according to ISO stan-dard 9276-2:2014 [28].
The sieve sizing data were corroborated and expanded upon usingoptical microscopy (Leica DM 3000, Clemex Technologies Inc., Lon-gueuil, Quebec, Canada; data analysis via Clemex Vision PE software,version 6) at NREL. The optical micrographs not only allowed for sizingof the feedstockmaterials, but also particle dimensional analysis, name-ly aspect ratio. To expedite the analysis process, only the pure feedstockspecies (CS, HP, SG, and MIS) were evaluated optically. Average particledimensions obtained via microscopy were reported on a volume basis[29,28]. Analyzing microscopy results on a volume basis allows for amore direct comparison between other commonly used biomass sizingtechniques (i.e., sieving and/or laser diffraction).
2.4. Powder rheometer
The FT4 Powder Rheometer (Freeman Technology, Worcestershire,UK) was used at NREL to measure the flow properties of the pure andblended biomass feedstocks. The FT4 Powder Rheometer is a universalpowder tester, with accessories for measuring compressibility and rota-tional shear properties, including wall friction (the FT4 has additionaltestingmethodologies that were not employed for this study). A full de-scription of the FT4's capabilities can be found elsewhere [30,31].
All testing were done using the 50 mm diameter, borosilicate testvessel (85 mL test volume). In order to standardize the packing stateof each sample before testing, all samples were conditioned using the23.5mmblade (the biomass particles become entangledwith the largerblades leading to a torque overload). The conditioning protocol consists
s the pellet die length, L/D is the pellet length-to-diameter ratio (D=0.25 in.), and EC is therom (at minimum) triplicate measurements.
3) L L�D
EC
Pellet (in) (−) (kWh/ton)
695 ± 3 3.00 12 88650 ± 17 2.25 9 107610 ± 4 2.50 10 146658 ± 25 3.00 12 293
6 670 ± 10 2.25 9 79642 ± 14 2.25 9 100627 ± 4 2.25 9 78

49N.C. Crawford et al. / Fuel Processing Technology 140 (2015) 46–56
of an axial traverse of the blade downward and upward through the en-tire height of the sample. During the upward traverse, the blade liftseach particle and gently drops them behind the blade. Conditioningloosens and slightly aerates the granular sample, removing any packinghistory such as excess trapped air or pre-consolidation either from stor-age or during filling of the vessel.
All test sequences, compressibility, shear cell, andwall friction, wererepeated in triplicate (at minimum) to assess measurement reproduc-ibility, with all error bars reported as a single standard deviation.
2.4.1. CompressibilityDuring the compressibility test, the pre-conditioned sample bed is
compressed with a vented piston that allows entrained air to escape.Each sample is slowly compacted across a range of normal stresses(N) from0.5 to 21 kPa,measuring the change in bed height at 11 distinctintervals. The compressibility of a sample (C) is defined as the percentchange in volume after compression, C=(V0-V)/V0; where V0 is the ini-tial, conditioned volume and V is the volume at a specific normal stressvalue.
2.4.2. Shear cellShear cell tests were performed with the 48 mm shear head in the
force control mode, so as the shear head was rotated, the torque signalwas measured while the normal force was held constant (i.e., theshear head can displace vertically during testing). During the shearcell test, the sample is first compacted with the vented piston to a spec-ified pre-shear normal load (3, 6, 9, or 15 kPa). After compaction, thepiston is removed and the shear head is attached. The shear head isthen lowered, inserting its blades into the sample until the pre-shearnormal force is again established. The head is then slowly rotated, in-ducing a shear stress. The sample is continuously sheared until theshear stress reaches steady state and the sample is “critically consolidat-ed” [32]. Next, the normal stress is reduced, allowing room for the par-ticles to dilate and move past one another. At this point, a yield stresscan be measured. The pre-shear/shear sequence is repeated five times(as recommended by Carson and Wilms [33]) at decreasing normalstress values (the sample is always pre-sheared to the critically consol-idated state before measurement). A curve of the normal stress andshear stress pairings is then obtained, referred to as the yield locus. Ayield locus is unique and contingent on its pre-shear history. The yieldloci were individually evaluated using Mohr stress circle analysis to ac-quire values of: the major and minor principal stress, unconfined yieldstrength, cohesion, and interparticle friction, as described by Carsonand Wilms [33] and Freeman [30].
To characterize the flowability of a material, Jenike [32] proposed touse the ratio of the major principal stress to the unconfined yieldstrength, called the flowability index (ffc). Based on the flow indexvalue, a material can be classified as non-flowing, very cohesive, cohe-sive, easy flowing, or free flowing (Table 2) [34].
2.4.3. Wall frictionWall friction properties are vital for understanding how a consoli-
dated granular material will interact with the wall material of its con-tainer or processing equipment. Wall friction tests are nearly identicalto the shear cell testing. Instead of shearing the sample against itselfand obtaining interparticle properties like interparticle friction or cohe-sion, the wall friction test shears the sample against a metallic disc withwell defined material properties. In essence, the shear head is replacedwith a 48 mm stainless steel coupon (316 grade, 1.2 μm surface rough-ness). During wall friction testing, the sample is compacted and pre-
Table 2Classification of granular solids flowability via flowability index.
Non-flowing Very cohesive Cohesive Easy flowing Free flowing
ffc b 1 1 b ffc b 2 2 b ffc b 4 4 b ffc b 10 ffc N 10
sheared at a specified normal stress load (3, 9, or 15 kPa). Once again,the normal force is decreased and the sample is sheared until failure.The shear stress and normal force pairs are plotted to obtain a wall fric-tion yield locus. Wall friction coefficients, or angles, can be extractedfrom the loci. Since the structural integrity of the sample is notdisrupted during shearing, the wall friction test requires only one pre-shear step and five subsequent shear steps.
3. Results and discussion
3.1. Particle sizing
The particle size distributions of the pure feedstocks via sieving aresimilar and donot appear to be significantly different (Fig. 2). The sievedgeometric average particle sizes of CS, HP, SG, and MIS were 990, 1068,934, and 991 μm, respectively. Although not plotted in Fig. 2 (for clari-ty), the geometric average particle sizes of the blendstocks CS + SG,CS + SG + HP, and CS + SG + MIS were respectively 935, 987, and971 μm. Again, a distinct difference between the sieved average particlesizes and size distributions for the pure and blended feedstocks was notobserved.
However, the breadth of the particle size distributions appear to bedifferent for the pure feedstocks. More specifically, the smallest sieveopenings (pan, 74, and 104 μm) and the largest sieves (2380 and3,353 μm) display the greatest discrepancy in particle weight fractionacross the different feedstock materials (Fig. 2). Thus, the weight frac-tion of fines (defined for this study as the particles b150 μm) and coarseparticles (defined as the particles N2380 μm) were summed for eachpure and blended feed species (Fig. 3). Both CS andHP have the greatestamount of coarse particles, with weight fractions N4%. SG and MIS, onthe other hand, have weight fractions of coarse particles of 0.7 and1.5%, respectively. In addition, HP, SG, and MIS also have low fractionsof fines (correspondingly 0.6, 1.0, and 0.3%), while CS has the greatestamount of fine particles at 1.6%. Therefore, CS has the broadest size dis-tribution of all the pure feedstockmaterials, while SG andMIS have dis-tributions that are relatively narrow (with the low amounts of fine andcoarse particles). Materials with broader size distributions have com-monly been found to bemore compressible and less flowable [6,35]. Al-ternatively, HP has a particle size distribution biased towards largeparticles, with a substantial amount of coarse particles and a lowamount of fines.
The feedstock blends have elevated levels of both coarse and fineparticles (Fig. 3). All three blendstocks have weight fractions of coarseparticles of ~3.3% (still less than the amount of coarse particles found
Fig. 2. Size distribution of corn stover (gray), hybrid poplar (blue), switchgrass (black),and Miscanthus (red) feedstocks using standard US mesh sieves. (For interpretation ofthe references to color in this figure legend, the reader is referred to the web version ofthis article.)

Fig. 3.Weight fraction of coarse (N2.4mm) andfine (b0.15mm)particles for the pure andblended feedstocks.
50 N.C. Crawford et al. / Fuel Processing Technology 140 (2015) 46–56
in CS and HP). However, all three feedstock blends have significantlymorefineparticles (N 2%) than thepure feedstocks;which is not reason-able, but most likely stems from a sampling issue at the time of sieving(e.g., perhaps the blendmaterials were stored differently, or were sam-pled from a different part of the storage container, or not fully homoge-nized prior to sieving). Nonetheless, the large amount of fines withinthe blendstocks would make them less compressible, while themoder-ate amount of coarse particles would enhance compressibility [6].Therefore, it is expected that the blended feedstocks will be moderatelycompressible compared to the pure feedstock species.
The volume-based average particle length for the four pure feed-stock species ranged from ~1000 to 1500 μm (Table 3), with CSdisplaying the smallest average length. HP andMIS had the largest aver-age particle lengths at ~1500 μm. CS also had the smallest average par-ticlewidth at 436 μm,while HP had the largest average particle width at719 μm. However, the large variance in the length and width valueskeep them from being statistically unique between the different feed-stocks. Additionally, the particle length values agree with the averageparticle size values from the sieving data. Therefore, the two separatesizing techniques corroborate one another.
The optical microscopy results also allow for the measurement ofparticle aspect ratio (defined as the length to width ratio). The averageaspect ratio is between 2 to 3 for all four of the feedstocks, with a max-imum value of 10–13 (parentheses in Table 3). Thus, both sizing tech-niques (sieving and microscopy) indicate that the grinding of thefeedstocks was consistent across the different species. In addition, theaspect ratios of the ground feedstocks evaluated hereweremuch small-er than typically observed with milled biomass. As a result, the groundspecies should experience less interparticle entanglements and bemore flowable than coarsely milled materials. Although microscopyallowed for examination of particle shape, the sieving analysis allowedformore effective analysis of the particle size distributions (i.e., fine ver-sus coarse particles).
Table 3Volume-based average particle dimensions via optical microscopy (n = the number ofparticles sized). The “±” values are a single standard deviation, while the values in the pa-rentheses indicate a maximummeasured aspect ratio.
Feedstock n (−) Length (μm) Width (μm) Aspect ratio (−)
CS 4432 984 ± 532 436 ± 201 2.2 (10.4)HP 4430 1522 ± 714 719 ± 324 2.7 (10.9)SG 3117 1250 ± 695 547 ± 342 2.9 (13.0)MIS 2781 1523 ± 680 568 ± 297 2.9 (12.8)
3.2. Compressibility
Compressibility is a bulk property measurement that indicates amaterial's ability to become compacted when subjected to a normalforce. The compressibility test is not a direct measurement offlowability, but it can indicate the strength of adhesive forces betweenparticles.
The compressibility of the pure (Fig. 4) and blended (Fig. 5) feed-stocks was assessed from 0.5 to 21 kPa. When considering the com-pressibility of the four pure feedstocks, the CS sample was the mostcompressible, compressing by 38% at 21 kPa (Fig. 4). HP was slightlyless compressible (compressing 32% at 21 kPa), while SG and MISwere the least compressible (compressing 28 and 27%, respectively,at 21 kPa). Interestingly, the more compressible materials (CS andHP) are also the materials that required less energy during thepelleting process (Table 1). Conversely, the least compressible mate-rials (SG and MIS) required the most energy during pelletization.Therefore, there is a direct relationship between compressibility andpelletization energy.
The additional compressibility of corn stover and hybrid poplar ismost likely due to both differences in material structure and size distri-bution. Corn stover is a heterogeneousmaterial with a low fiber contentand the vascular tissues that makeup its stalk are more spongy [6].Therefore, it is expected to be more compressible than the other mate-rials studied here. Miscanthus and switchgrass are more fibrous andrigid, while hybrid poplar is a hardwood known for its flexibility. It isreasonable to assume that the hybrid poplar sample would be morecompressible than the fibrous grassy materials, Miscanthus andswitchgrass.
Furthermore, in comparison to the SG and MIS samples, CS and HPboth have a significant fraction of large particles (N2.4 mm), 5.5 and4.2% w/w, respectively; while the SG andMIS both haveweight fractionof large particles less than 2% (Fig. 3). Additionally, the CS sample hasmorefines (1.7wt.% particles b0.15mm) than the other pure feedstocks(all with b1%). The large particles in the CS and HP samples create col-lapsible void spaces in the solids network. During compaction, smaller(fine) particles rearrange and fill in the void spaces surrounding thelarger (coarse) particles [35,36]. As a result, materials with broadersize distributions are typically more compressible [6,35].
The three blended feedstocks, on the other hand, had nearly identi-cal compressible behaviors, with compressibilities of 31, 32, and 33% at21 kPa for the CS+SG, CS+SG+MIS, and CS+SG+HP, respectively.The compressibilities of the feedstock blends overlap with the HP sam-ple, the more moderately compressible pure feedstock.
Fig. 4. Compressibility (% change in volume) of corn stover (triangles), hybrid poplar(circles), switchgrass (squares), and Miscanthus (diamonds) feedstocks as a function ofapplied normal stress. The dashed lines are logarithmic fits to the individual data sets.

Fig. 5. Compressibility (% change in volume) of blended feedstocks: CS + SG (opensquares), CS+ SG+HP (open circles), and CS+ SG+MIS (open diamonds) as a functionof applied normal stress. The dashed lines are logarithmic fits to the individual data sets.
Fig. 7. Unconfined yield stress versus major principal stress for corn stover (triangles),hybrid poplar (circles), switchgrass (squares), and Miscanthus (diamonds) feedstocks.The solid lines represent the boundaries between flowability designations, while thedashed lines are linear fits to the individual data sets.
51N.C. Crawford et al. / Fuel Processing Technology 140 (2015) 46–56
3.3. Shear testing
3.3.1. “Pure” feedstocksShear cell testswere designed to determine the shear stress required
to initiate flow of a pre-consolidated sample of granular solids (i.e., theyield stress). Shear cell measurements indicate how easily a materialwill transition from a static state into dynamic flow. Originally, sheartesting was used exclusively for the design of hoppers and silos, buttoday they are commonly used for the general characterization of gran-ular materials.
The yield stress values for the four pure feedstocks, CS, HP, SG, andMIS, at a pre-shear normal stress value of 9 kPa were segmented intotwo groupings (Fig. 6). The CS and HP samples displayed relativelyhigh and similar yield strengths, cohesion, and interparticle friction.While the SG andMISmaterials had lower yet similar yield stress, cohe-sion, and interparticle friction values. Interestingly, the easier to pelletmaterials (CS and HP) are less “flowable” than themore difficult to pel-let materials (SG and MIS). Therefore, there is an inverse relationshipbetween the ease of pelleting and material flowability.
Using Mohr circle analysis, the yield loci from Fig. 6 can be assessedto produce values of the unconfined yield stress (fc) and themajor prin-cipal stress (σ1). Plotting fc as a function of σ1 generates a linearizedflow function, where the flowability index (ffc) is the inverse of theslope. Moving counter-clockwise in Fig. 7, the values of the flowability
Fig. 6. Yield loci of corn stover (triangles), hybrid poplar (circles), switchgrass (squares),and Miscanthus (diamonds) feedstocks at a pre-shear consolidation normal stress (NC)of 9 kPa. The dashed lines are linear fits to the individual yield loci.
index (given in Table 2) decrease from the free flowing region to thenon-flowing regime.
The flow functions for all four pure feedstocks yielded linear in-creases in fc with increasing σ1 (Fig. 7); with HP, SG, and MIS all fallingin the easy flowing region (although HP did have a significantly lowerflow index than SG and MIS). Conversely, CS crossed two flow regimeswith a flow index in the cohesive and easy flowing regions. At lowmajor principal stresses, CS displays comparable flowability to MIS andSG, but as themajor principal stress increases, CS becomes less flowable.At large principal stress values (σ1 N 15 kPa), CS becamedistinctively theleast flowable of the four pure feedstocks. Flowability is dependent onthe physical properties of the material, as well as the environmentalconditions and the equipment used for handling, storing, andprocessing[37]. Typically, only simple granular solids display consistent flowabilityacross different stress regimes [38,39]. Therefore, corn stover is a com-plex material whose flow behavior increases in difficulty as the consoli-dation stress is increased. The complex behavior of corn stover is a directresult of its heterogeneous composition. SG, MIS, and HP are relativelyhomogeneous materials harvested from the same part of their respec-tive plants. CS, on the other hand, is a varied feedstock made frommixed parts of the plant (the stock, stem, leafs, and cob).
Overall, the flow indices (ffc) for the ground feedstocks in this studyagree with previously reported ffc values for ground biomass species,which typically range from the easy flowing to cohesive regimes [39,40,41]. Milled biomass materials, due to their larger particle sizes andaspect ratios (which can lead to more frequent interparticle entangle-ments), are usually less flowable than ground biomass, with ffc valuescommonly in the cohesive to very cohesive regimes [35,42].
A summary of all flowability parameters, including: unconfinedyield stress (fc), major and minor principal stresses (σ1 and σ2, respec-tively), cohesion (τ0), static and effective angles of interparticle friction(ϕi and ϕe, respectively), and flowability indices (ffc) for pre-shearnormal stress (NC) values of 3 to 15 kPa are reported in Table 4 for thefour pure feedstocks. The cohesive strength of corn stover was foundto be the highest, followed by hybrid poplar; while switchgrass andMiscanthus had the lowest, yet comparable cohesion. The average mea-sured angles of internal friction were 41.3±1.0, 40.0 ±2.0, 34.9 ±3.2,and 32.7 ±3.9 for CS, HP, SG, and MIS, respectively (Table 4).
Fasina et al. [35] used an automated ring shear tester to study theflow properties of switchgrass (among other samples). They reportedϕi and ffc values of 41.8 ± 0.92 and 3.5, respectively. Chevanan et al.[42], on the other hand, used a custom fabricated linear shear box to de-termine the flow properties of chopped switchgrass and corn stover.

Table 4Shear testing results for the “pure” feedstocks at pre-shear normal stress (NC) values of 3, 6, 9, and 15 kPa (unconfined yield stress (fc), major and minor principal stresses (σ1 and σ2,respectively), cohesion (τ0), static and effective angles of interparticle friction (ϕi and ϕe, respectively), and flowability index (ffc)).
Material NC (kPa) fc σ1 σ2 τ0 ϕi ϕe ffc
(kPa) (kPa) (kPa) (kPa) (°) (°) (−)
CS 3 1.2 ± 0.2 7.2 ± 0.1 1.2 ± 0.1 0.28 ± 0.06 41.2 ± 1.1 45.2 ± 0.2 5.8 ± 1.16 3.8 ± 0.3 15.6 ± 0.9 2.4 ± 0.1 0.85 ± 0.07 41.3 ± 0.7 46.8 ± 0.6 4.2 ± 0.19 5.3 ± 0.3 23.3 ± 0.5 3.6 ± 0.1 1.36 ± 0.30 41.6 ± 1.3 47.8 ± 2.0 4.4 ± 0.1
15 9.1 ± 0.5 35.7 ± 1.8 5.1 ± 0.3 2.50 ± 0.32 40.9 ± 0.8 48.0 ± 1.1 3.9 ± 0.2HP 3 2.2 ± 0.2 8.3 ± 0.4 1.3 ± 0.1 0.51 ± 0.04 39.8 ± 0.6 45.9 ± 0.3 3.8 ± 0.4
6 2.9 ± 0.4 14.7 ± 0.6 2.6 ± 0.1 0.70 ± 0.10 38.9 ± 0.6 44.5 ± 0.3 5.0 ± 0.59 4.6 ± 0.9 23.0 ± 1.1 3.8 ± 0.2 1.07 ± 0.25 40.3 ± 3.5 45.7 ± 2.9 5.0 ± 0.8
15 6.1 ± 0.5 32.1 ± 0.6 6.1 ± 0.1 1.51 ± 0.20 37.5 ± 2.2 45.5 ± 0.9 5.2 ± 0.1SG 3 0.8 ± 0.1 5.6 ± 0.6 1.4 ± 0.1 0.20 ± 0.02 33.2 ± 2.4 39.6 ± 2.1 7.5 ± 0.6
6 1.2 ± 0.2 12.6 ± 0.3 2.7 ± 0.1 0.29 ± 0.05 37.6 ± 1.1 39.8 ± 1.0 10.6 ± 1.79 1.9 ± 0.3 17.6 ± 1.0 4.8 ± 0.3 0.51 ± 0.07 32.4 ± 1.9 34.8 ± 2.1 9.5 ± 0.7
15 3.5 ± 0.6 26.7 ± 1.9 6.5 ± 0.5 0.95 ± 0.15 32.3 ± 1.7 36.2 ± 1.7 7.7 ± 0.9MIS 3 1.1 ± 0.1 6.5 ± 0.7 1.3 ± 0.1 0.27 ± 0.03 37.0 ± 2.8 41.7 ± 2.5 5.9 ± 1.6
6 1.7 ± 0.2 10.4 ± 0.2 2.9 ± 0.1 0.50 ± 0.05 28.8 ± 2.3 32.8 ± 2.3 6.1 ± 0.59 2.3 ± 0.1 16.3 ± 0.6 4.6 ± 0.2 0.68 ± 0.04 30.0 ± 1.2 33.7 ± 1.4 6.9 ± 1.4
15 3.4 ± 0.3 26.9 ± 1.7 6.1 ± 0.4 0.88 ± 0.07 35.0 ± 2.4 34.5 ± 2.1 7.9 ± 1.4
52 N.C. Crawford et al. / Fuel Processing Technology 140 (2015) 46–56
They reportedϕi values of 39–46 and 46–50 and ffc values of 2.3–4.3 and2.2–3.4 for switchgrass and corn stover, respectively. While Gil et al.[40] used a Jenike shear device to measure the flowability of poplarand corn stover milled to target particle sizes of 2 and 5 mmwith vary-ing moisture contents (7–33% w/w). They reported ϕi and ffc values of26–33 and 3.6–10.1 for corn stover and 30–32 and 3.9–12.0 for poplar.To our knowledge, there are no reported flowability data forMiscanthusin current literature. Even though the environmental conditions and theequipment used for handling, storing, and processing these materialsvaried significantly across this assortment of studies, theflowpropertiesreported here for CS, HP, and SG coincide with published literaturevalues.
3.3.2. Blended feedstocksThe four pure feedstocks were combined to create three feedstock
blends: CS + SG, CS + SG + HP, and CS + SG + MIS (50:50 ratio byweight for the binary blend and 33:33:33 ratio for the ternary blends).The yield stress values at a pre-shear normal stress of 9 kPa for thethree feedstocks were nearly identical (Fig. 8). The CS + SG andCS + SG+ HP blends both had cohesive strengths of ~1 kPa and inter-particle friction angles of ~38; while the CS + SG + MIS sample had acohesion stress and interparticle friction angle of 0.7 kPa and 36, respec-tively. The yield loci of the blended feedstocks fall directly between the
Fig. 8. Yield loci at a pre-shear consolidation normal stress (Nc) of 9 kPa for blended feed-stocks: corn stover + switchgrass (squares), corn stover + switchgrass + hybrid poplar(circles), and corn stover + switchgrass + Miscanthus (diamonds). The dashed lines arelinear fits to the individual yield loci.
measured yield loci of the pure feedstocks in Fig. 6; indicating that flowproperties can be tuned via feedstock blending.
All of the flow parameters for the three feedstock blends are quitesimilar across the tested pre-shear normal stress values (Table 5). Theaverage flowability indices of the CS + SG, CS + SG + HP,CS + SG + MIS blends are 5.6 ± 1.3, 5.6 ± 1.1, and 6.1 ± 1.4; whilethe average ϕi values for the blended feedstocks are 39.1 ± 1.3,37.4 ± 1.9, and 35.8 ± 1.7, respectively.
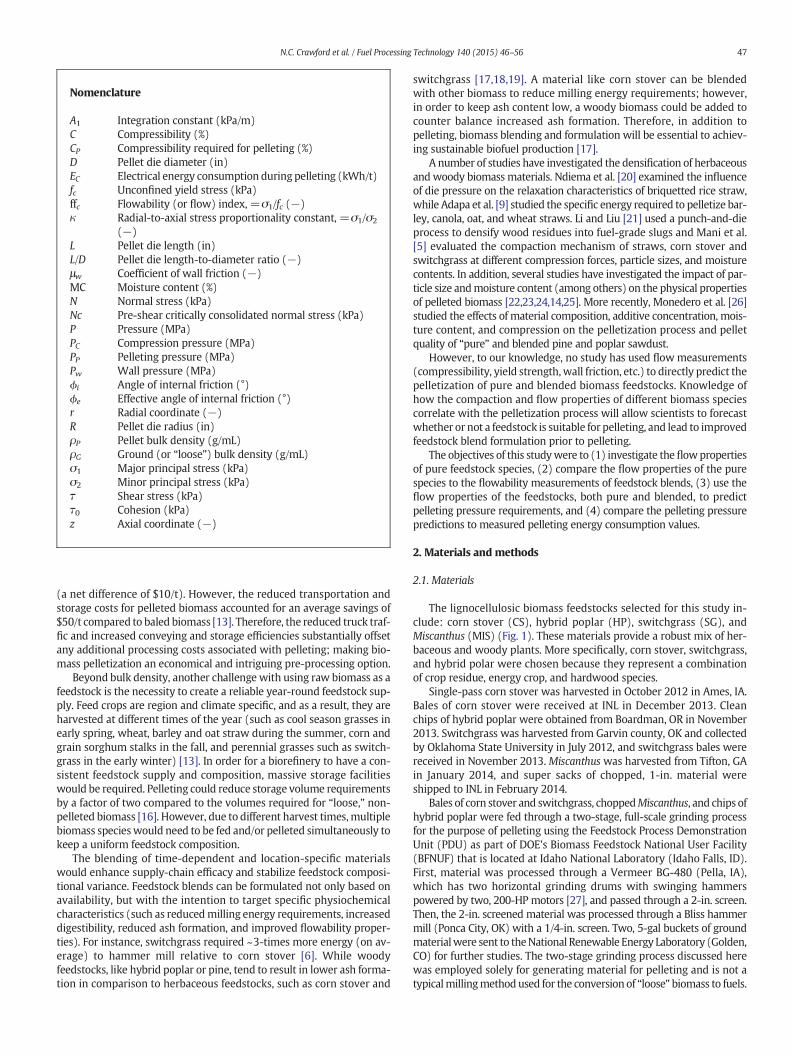
The flow properties of the blends appear to be a composite of theirindividual pure feedstock constituents. When the angle of internal fric-tion (ϕi) and cohesion (τ0) at a pre-shear normal stress of 9 kPa for theblended feeds are plotted with the pure feedstocks (Fig. 9), the blendsfall between the highest and lowest ϕi and τ0 values. The bars in Fig. 9representmeasured data, while the square and circle symbols are calcu-lated values of ϕi and τ0, respectively, for the blendstocks based on themeasured values of their individual “pure” components. The calculatedvalues ofϕi and τ0 overlap near perfectly with themeasured values (Fig.9). As a result, it appears that the individual feedstock flow propertiescan be measured separately and based on the blending ratio, theflowability characteristics of the feedstock blends can be predicted.
Broadening the scope of Fig. 9, the average flowability indices of thepure and blended feedstocks across all of the measured pre-shear nor-mal stresses (3, 6, 9, and 15 kPa) were evaluated (Fig. 10). Again, theffc values of the blends fell within upper and lower bounds of theflowability indices of the pure feedstocks. Also, the calculated valuesof ffc (circles) for the blendstocks agree with the measured data (bars;Fig. 10). The computed ffc values for the binary (CS + SG) and two ter-nary blends (CS + SG + HP and CS + SG + MIS) fell within a singlestandard deviation of the measured values. Although the binary blend(CS+ SG) calculated flow index is slightly larger than the experimentalvalue. This discrepancy is most likely caused by the large fluctuation inthe measured flowability index value for pure SG, which ranges from~7.5–10.6. The large variance in switchgrass' ffc value is compoundedby the fact that it makes up 50% by weight of the binary blend andonly 33% of the ternary blends. Thus, the wide-ranging flow index forSG has a greater impact on the predicted value of the binary blend incomparison to the ternary blends.
In general, the flow measurements of the blended feedstocks agreewith the flowability data from their pure feedstock constituents. If thepure feedstocks flow properties are thoroughly and reliably interrogat-ed, then the flow properties of the blended feedstocks can be predictedarithmetically. Therefore, only the flowability of the individual feed-stocks need to be measured and the blend characteristics can be in-ferred; giving engineers the ability to design feedstock blend ratiosbased on desired flow characteristics. This novel outcome has the
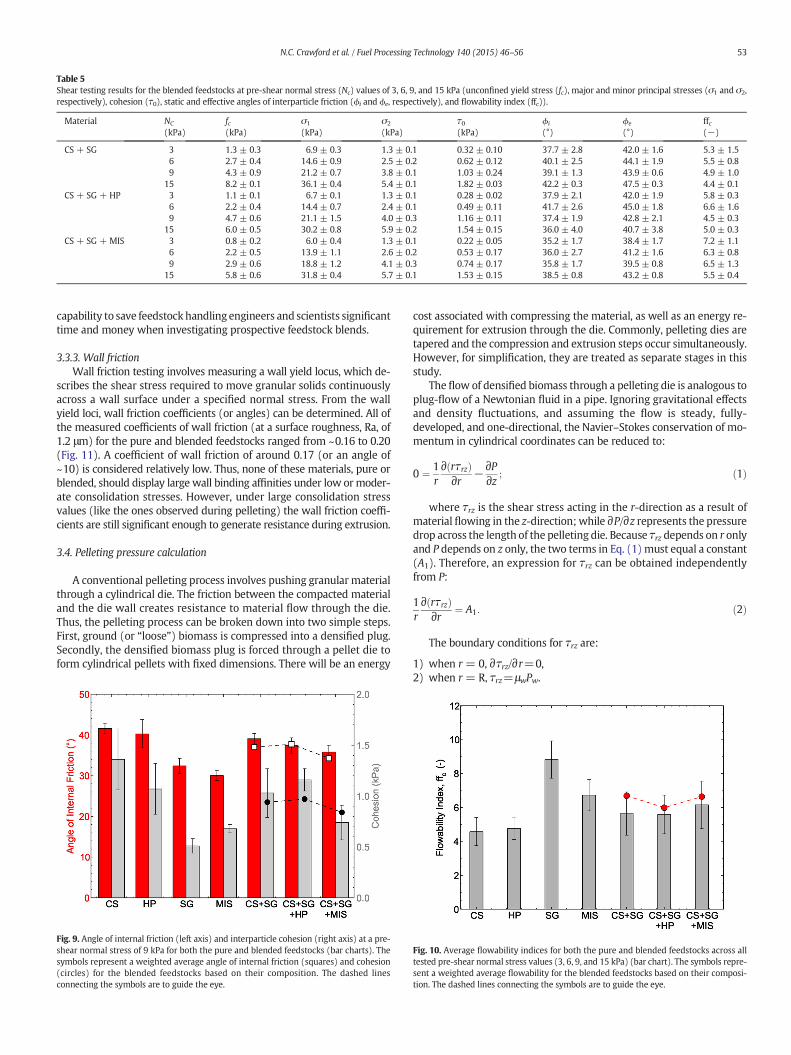
Table 5Shear testing results for the blended feedstocks at pre-shear normal stress (Nc) values of 3, 6, 9, and 15 kPa (unconfined yield stress (fc), major and minor principal stresses (σ1 and σ2,respectively), cohesion (τ0), static and effective angles of interparticle friction (ϕi and ϕe, respectively), and flowability index (ffc)).
Material NC
(kPa)fc(kPa)
σ1
(kPa)σ2
(kPa)τ0(kPa)
ϕi
(°)ϕe
(°)ffc(−)
CS + SG 3 1.3 ± 0.3 6.9 ± 0.3 1.3 ± 0.1 0.32 ± 0.10 37.7 ± 2.8 42.0 ± 1.6 5.3 ± 1.56 2.7 ± 0.4 14.6 ± 0.9 2.5 ± 0.2 0.62 ± 0.12 40.1 ± 2.5 44.1 ± 1.9 5.5 ± 0.89 4.3 ± 0.9 21.2 ± 0.7 3.8 ± 0.1 1.03 ± 0.24 39.1 ± 1.3 43.9 ± 0.6 4.9 ± 1.0
15 8.2 ± 0.1 36.1 ± 0.4 5.4 ± 0.1 1.82 ± 0.03 42.2 ± 0.3 47.5 ± 0.3 4.4 ± 0.1CS + SG + HP 3 1.1 ± 0.1 6.7 ± 0.1 1.3 ± 0.1 0.28 ± 0.02 37.9 ± 2.1 42.0 ± 1.9 5.8 ± 0.3
6 2.2 ± 0.4 14.4 ± 0.7 2.4 ± 0.1 0.49 ± 0.11 41.7 ± 2.6 45.0 ± 1.8 6.6 ± 1.69 4.7 ± 0.6 21.1 ± 1.5 4.0 ± 0.3 1.16 ± 0.11 37.4 ± 1.9 42.8 ± 2.1 4.5 ± 0.3
15 6.0 ± 0.5 30.2 ± 0.8 5.9 ± 0.2 1.54 ± 0.15 36.0 ± 4.0 40.7 ± 3.8 5.0 ± 0.3CS + SG + MIS 3 0.8 ± 0.2 6.0 ± 0.4 1.3 ± 0.1 0.22 ± 0.05 35.2 ± 1.7 38.4 ± 1.7 7.2 ± 1.1
6 2.2 ± 0.5 13.9 ± 1.1 2.6 ± 0.2 0.53 ± 0.17 36.0 ± 2.7 41.2 ± 1.6 6.3 ± 0.89 2.9 ± 0.6 18.8 ± 1.2 4.1 ± 0.3 0.74 ± 0.17 35.8 ± 1.7 39.5 ± 0.8 6.5 ± 1.3
15 5.8 ± 0.6 31.8 ± 0.4 5.7 ± 0.1 1.53 ± 0.15 38.5 ± 0.8 43.2 ± 0.8 5.5 ± 0.4
53N.C. Crawford et al. / Fuel Processing Technology 140 (2015) 46–56
capability to save feedstockhandling engineers and scientists significanttime and money when investigating prospective feedstock blends.
3.3.3. Wall frictionWall friction testing involves measuring a wall yield locus, which de-
scribes the shear stress required to move granular solids continuouslyacross a wall surface under a specified normal stress. From the wallyield loci, wall friction coefficients (or angles) can be determined. All ofthe measured coefficients of wall friction (at a surface roughness, Ra, of1.2 μm) for the pure and blended feedstocks ranged from ~0.16 to 0.20(Fig. 11). A coefficient of wall friction of around 0.17 (or an angle of~10) is considered relatively low. Thus, none of these materials, pure orblended, should display large wall binding affinities under low ormoder-ate consolidation stresses. However, under large consolidation stressvalues (like the ones observed during pelleting) the wall friction coeffi-cients are still significant enough to generate resistance during extrusion.
3.4. Pelleting pressure calculation
A conventional pelleting process involves pushing granular materialthrough a cylindrical die. The friction between the compacted materialand the die wall creates resistance to material flow through the die.Thus, the pelleting process can be broken down into two simple steps.First, ground (or “loose”) biomass is compressed into a densified plug.Secondly, the densified biomass plug is forced through a pellet die toform cylindrical pellets with fixed dimensions. There will be an energy
Fig. 9. Angle of internal friction (left axis) and interparticle cohesion (right axis) at a pre-shear normal stress of 9 kPa for both the pure and blended feedstocks (bar charts). Thesymbols represent a weighted average angle of internal friction (squares) and cohesion(circles) for the blended feedstocks based on their composition. The dashed linesconnecting the symbols are to guide the eye.
cost associated with compressing the material, as well as an energy re-quirement for extrusion through the die. Commonly, pelleting dies aretapered and the compression and extrusion steps occur simultaneously.However, for simplification, they are treated as separate stages in thisstudy.
The flow of densified biomass through a pelleting die is analogous toplug-flow of a Newtonian fluid in a pipe. Ignoring gravitational effectsand density fluctuations, and assuming the flow is steady, fully-developed, and one-directional, the Navier–Stokes conservation of mo-mentum in cylindrical coordinates can be reduced to:
0 ¼ 1r∂ rτrzð Þ∂r
−∂P∂z
; ð1Þ
where τrz is the shear stress acting in the r-direction as a result ofmaterial flowing in the z-direction;while ∂P/∂z represents the pressuredrop across the length of the pelleting die. Because τrz depends on r onlyand P depends on z only, the two terms in Eq. (1) must equal a constant(A1). Therefore, an expression for τrz can be obtained independentlyfrom P:
1r∂ rτrzð Þ∂r
¼ A1: ð2Þ
The boundary conditions for τrz are:
1) when r = 0, ∂τrz/∂r=0,2) when r = R, τrz=μwPw.
Fig. 10. Average flowability indices for both the pure and blended feedstocks across alltested pre-shear normal stress values (3, 6, 9, and 15 kPa) (bar chart). The symbols repre-sent a weighted average flowability for the blended feedstocks based on their composi-tion. The dashed lines connecting the symbols are to guide the eye.

Fig. 11. Average coefficients of wall friction (Ra= 1.2 μm) across pre-shear normal stressvalues of 3, 9, and 15 kPa for both the pure and blended feedstocks (bar chart). The sym-bols represent a weighted average wall friction coefficients for the blended feedstocksbased on their composition. The dashed lines connecting the symbols are to guide the eye.
54 N.C. Crawford et al. / Fuel Processing Technology 140 (2015) 46–56
μw is the coefficient of friction between the die wall and the biomassplug (i.e., the coefficient of wall friction; Fig. 11) and Pw is the resultantstress acting on the die wall due to the axial force driving biomassthrough the die. After applying the boundary conditions, A1 was foundto be:
A1 ¼ 2μwPw
R: ð3Þ
With a fully-defined A1, Eq. (1) now becomes:
∂P∂z
¼ 2μwPw
R: ð4Þ
However, Pw is a function of P and thus, Eq. (4) cannot be integratedin its current form. Fortunately, Pw is simply defined as:
Pw ¼ κP; ð5Þ
where κ is the radial-to-axial stress proportionality constant (com-monly denoted as λ); which is simply the ratio of the minor andmajor principal stress values (Table 6).
The boundary condition for P is: when z=0, P= Pc; where Pc is thepressure required to compress the “loose” biomass to the desired pelletdensity. Values for Pc were obtained from the logarithmic fits of thecompressibility data in Figs. 4 and 5. These expressions were then ex-trapolated to the degree of compression required to pellet eachmaterial(Cp; Table 6):
CP ¼ ρP−ρG
ρP� 100%; ð6Þ
Table 6Energy and pressure requirements for pelleting the pure and blended feedstocks.
Material κ (−) CP (%) PC (MPa) PP (MPa) EC (kWh/t)
CS 0.15 84 15 53 88HP 0.17 82 58 192 107SG 0.25 79 196 1003 146MIS 0.24 78 239 1727 293CS + SG 0.19 80 96 266 79CS + SG + HP 0.17 83 63 214 100CS + SG + MIS 0.20 79 41 147 78
where ρP and ρG are the pellet and ground (or “loose”) bulk densi-ties, respectively (Table 1). Using the boundary condition, Eq. (4) canbe separated and integrated to obtain:
P ¼ PC exp2μwκz
R
� �: ð7Þ
The overall pelleting pressure (PP) required to compress “loose”biomass into a densified plug and then force it through a pelleting dieof length L and diameter D is:
PP ¼ PC exp 4μwκL=Dð Þ: ð8Þ
Using Eq. (8) and the compressibility, shear cell, and wall frictiondata, the pressure required to pellet (PP) the pure and blended feed-stocks could be obtained. The calculated PP values ranged from 50 to1700 MPa for the pure feedstocks and 145 to 270 MPa for the blendedfeedstocks (Table 6). The calculated pelleting pressures for CS and HPand the three blendstocks are equivalent to typical pressures used topellet herbaceous straws and grasses, as well as wood residues (~20–150 MPa) [9,21,20,5]. The SG and MIS feedstocks, on the other hand,had abnormally high calculated pelleting pressures (N900 MPa). How-ever, relatively large pressures (300–800 MPa) have been used previ-ously to densify biomass materials [43].
The calculated pelleting pressure values were then compared to themeasured pelleting energy consumption from Table 1 (Fig. 12). Re-markably, there is strong agreement between the measured energyconsumption and pelleting pressure values. The materials that requiredmore energy for pelleting, switchgrass and Miscanthus, also had largepelleting pressure requirements: 1003 and 1727 MPa, respectively.While the materials requiring low energy for pelleting, corn stover, hy-brid poplar, and the three blendstocks, also had relatively low calculatedpelleting pressures (50–270 MPa).
The total pelleting pressure (PP), aswell as the compression pressure(PC) are listed for the four pure feedstocks and the three blends inTable 6. Roughly 40 to 15% of the pelleting pressure was used to com-press the materials and the remaining 60 to 85% was used to overcomefriction in the pelleting die. At first glance, the extrusion pressure (thedifference between PP and PC) seems disproportionately large. Our ex-pectation was that the force required to compress the materials wouldmakeup the majority of the energy involved in the pelleting process.However, Mewes [44] studied the consumption of energy to overcome
Fig. 12. Electrical pelleting energy consumption (EC) versus the calculated pelleting pres-sure (PP) for pure feedstocks of corn stover (filled triangle), hybrid poplar (filled circle),switchgrass (filled square),Miscanthus (filled diamond), and blended feedstocks of cornstover+switchgrass (open square), corn stover+ switchgrass+hybridpoplar (open cir-cle), and corn stover+ switchgrass+Miscanthus (open diamond). The solid line is an ex-ponential (best) fit to the data.

55N.C. Crawford et al. / Fuel Processing Technology 140 (2015) 46–56
friction during compression of straw and hay and showed that roughly40% of the total applied energy was used to compress the materials(straw and hay), while the remaining 60% was used to overcome fric-tion. Additionally, Mani et al. [45] showed that over 50% of the energyfor briquetting corn stover was due to friction during extrusion. Maniet al. also showed that when the briquetting pressure was increasedfrom 5 to 15 MPa, the ratio of the extrusion to compression energy in-creased; which they attributed to the increase in normal pressure be-tween the die and the briquette. Therefore, it is reasonable to assumethat during pelleting, which occurs at higher pressures than briquetting(N30MPa), the extrusion energy could account for 60 to 80% of the totalenergy requirements.
The development and validation of the pelleting pressure model(Eq. (8)) allows for materials to be “pre-screened” prior to pelleting. Afeedstock's material properties (specifically compressibility, shear, andwall friction) can be measured and its pelleting feasibility can beassessed without actually having to pellet the material; saving biomassprocess and handling engineers substantial amounts of time andmoney.
4. Conclusions
The flow properties (compressibility, shear, and wall friction) of“pure” and blended biomass feedstocks were evaluated and comparedto measured pelleting energy consumption values. As projected, thecompressibilities of the biomass feedstocks were directly correlatedwith their pelletization energies. However, a feedstock's flowproperties(i.e., the material's cohesion, yield strength, interparticle friction) werefound to be inversely related to its pelleting energy requirements. In ad-dition, the compressibility and flowability of a feedstock blend can bepredicted by averaging the measured properties of its pure feedstockconstituents; thus, only the flow parameters of the pure componentsneed to be directly measured. A model was also developed to calculatethe required pressure to pellet the pure and blended biomass species.Strong correlation was observed between the measured pelleting ener-gy consumption values and the predicted pelleting pressure. Thismodelallows for a feedstock's pelleting suitability to be assessed, based on itscompressibility, flowability, and wall friction, without actually havingto pelletize the material. Overall, the results reported here will helpguide ongoing feedstock formulation efforts, while also enhancingpelleting process efficiency.
Acknowledgments
This work was funded by the U.S. Department of Energy under Con-tract No. DE-AC36-08-GO28308 with the National Renewable EnergyLaboratory and through the BioEnergy Technologies Office. The authorsthank Dave Pace, Marnie Cortez, Craig Conner, and Austin Matthews fortheir valued technical assistance.
References
[1] C.E.Wyman, Cellulosic ethanol: a unique sustainable liquid transportation fuel, MRSBull. 33 (4) (2008) 381–383, http://dx.doi.org/10.1557/mrs2008.77.
[2] A.A. Modenbach, S.E. Nokes, Enzymatic hydrolysis of biomass at high-solids loadings— a review, Biomass Bioenergy 56 (2013) 526–544, http://dx.doi.org/10.1016/j.biombioe.2013.05.031.
[3] J.S. Tumuluru, C.T. Wright, J.R. Hess, K.L. Kenney, A review of biomass densificationsystems to develop uniform feedstock commodities for bioenergy application,Biofuels Bioprod. Biorefin. 5 (6) (2011) 683–707, http://dx.doi.org/10.1002/bbb.324.
[4] N. Kaliyan, R.V. Morey, Factors affecting strength and durability of densified biomassproducts, Biomass Bioenergy 33 (3) (2009) 337–359, http://dx.doi.org/10.1016/j.biombioe.2008.08.005.
[5] S. Mani, L.G. Tabil, S. Sokhansanj, Effects of compressive force, particle size andmois-ture content on mechanical properties of biomass pellets from grasses, BiomassBioenergy 30 (7) (2006) 648–654, http://dx.doi.org/10.1016/j.biombioe.2005.01.004.
[6] S. Mani, L. Tabil, S. Sokhansanj, Grinding performance and physical properties ofwheat and barley straws, corn stover and switchgrass, Biomass Bioenergy 27 (4)(2004) 339–352, http://dx.doi.org/10.1016/j.biombioe.2004.03.007.
[7] D. Inman, N. Nagle, J. Jacobson, E. Searcy, A.E. Ray, Feedstock handling and process-ing effects on biochemical conversion to biofuels, Biofuels Bioprod. Biorefin. 4 (5)(2010) 562–573, http://dx.doi.org/10.1002/bbb.241.
[8] L. Tabil, P. Adapa, M. Kashaninejad, Biomass feedstock pre-processing— part 2: den-sification, in: D.M.A.D.S. Bernardes (Ed.), Biofuel's Engineering Process Technology,InTech 2011, pp. 439–464, http://dx.doi.org/10.5772/18495 (Ch. 19).
[9] P. Adapa, L. Tabil, G. Schoenau, Compaction characteristics of barley, canola, oat andwheat straw, Biosyst. Eng. 104 (3) (2009) 335–344, http://dx.doi.org/10.1016/j.biosystemseng.2009.06.022.
[10] P.K. Adapa, L.G. Tabil, G.J. Schoenau, Compression characteristics of non-treated andsteam-exploded barley, canola, oat, and wheat straw grinds, Appl. Eng. Agric. 26 (4)(2010) 617–632.
[11] S. Mani, L. Tabil, S. Sokhansanj, Evaluation of compaction equations applied to fourbiomass species, Can. Biosyst. Eng. 46 (3) (2004) 3.55–3.61.
[12] M. Kashaninejad, L.G. Tabil, Effect of microwave-chemical pre-treatment on com-pression characteristics of biomass grinds, Biosyst. Eng. 108 (1) (2011) 36–45,http://dx.doi.org/10.1016/j.biosystemseng.2010.10.008.
[13] J.M. Wilson, L.J. McKinney, K. Theerarattananoon, T.C. Ballard, D. Wang, S.A.Staggenborg, P.V. Vadlani, Energy cost for pelleting and transportation of selest cel-lulosic biomass feedstocks for ethanol production, Appl. Eng. Agric. 30 (1) (2014)77–85.
[14] K. Theerarattananoon, F. Xu, J. Wilson, R. Ballard, L. Mckinney, S. Staggenborg, P.Vadlani, Z.J. Pei, D. Wang, Physical properties of pellets made from sorghum stalk,corn stover, wheat straw, and big bluestem, Ind. Crop. Prod. 33 (2) (2011)325–332, http://dx.doi.org/10.1016/j.indcrop.2010.11.014.
[15] J.R. Hess, C.T. Wright, K.L. Kenney, Cellulosic biomass feedstocks and logistics forethanol production, Biofuels Bioprod. Biorefin. 1 (3) (2007) 181–190, http://dx.doi.org/10.1002/bbb.26.
[16] P. Krishnakumar, K.E. Ileleji, A comparative analysis of the economics and logisticalrequirements of different biomass feedstock types and forms for ethanol produc-tion, Appl. Eng. Agric. 26 (5) (2010) 899–907 (annual Meeting of the American-So-ciety-of-Agricultural-and-Biological-Engineers, Reno, NV, Jun 21–24, 2009).
[17] K.L. Kenney, W.A. Smith, G.L. Gresham, T.L. Westover, Understanding biomass feed-stock variability, Biofuels 4 (1) (2013) 111–127, http://dx.doi.org/10.4155/bfs.12.83.
[18] D.L. Carpenter, R.L. Bain, R.E. Davis, A. Dutta, C.J. Feik, K.R. Gaston, W. Jablonski, S.D.Phillips, M.R. Nimlos, Pilot-scale gasification of corn stover, switchgrass, wheatstraw, and wood: 1. Parametric study and comparison with literature, Ind. Eng.Chem. Res. 49 (4) (2010) 1859–1871, http://dx.doi.org/10.1021/ie900595m.
[19] P. Das, A. Ganesh, P. Wangikar, Influence of pretreatment for deashing of sugarcanebagasse on pyrolysis products, Biomass Bioenergy 27 (5) (2004) 445–457, http://dx.doi.org/10.1016/j.biombioe.2004.04.002.
[20] C. Ndiema, P. Manga, C. Ruttoh, Influence of die pressure on relaxation characteris-tics of briquetted biomass, Energy Convers. Manag. 43 (16) (2002) 2157–2161,http://dx.doi.org/10.1016/S0196-8904(01)00165–0.
[21] Y. Li, H. Liu, High-pressure densification of wood residues to form an upgraded fuel,Biomass Bioenergy 19 (3) (2000) 177–186, http://dx.doi.org/10.1016/S0961-9534(00)00026-X.
[22] O. Fasina, S. Sokhansanj, Effect of fines on storage and handling properties of alfalfapellets, Can. Agric. Eng. 38 (1) (1996) 25–29.
[23] Z. Colley, O.O. Fasina, D. Bransby, Y.Y. Lee, Moisture effect on the physical character-istics of switchgrass pellets, Trans. ASABE 49 (6) (2006) 1845–1851.
[24] O.O. Fasina, Physical properties of peanut hull pellets, Bioresour. Technol. 99 (5)(2008) 1259–1266, http://dx.doi.org/10.1016/j.biortech.2007.02.041.
[25] P.K. Adapa, L.G. Tabil, G.J. Schoenau, Factors affecting the quality of biomass pelletfor biofuel and energy analysis of pelleting process, Int. J. Agric. Biol. Eng. 6 (2)(2013) 1–12, http://dx.doi.org/10.3965/j.ijabe.20130602.001.
[26] E. Monedero, H. Portero, M. Lapuerta, Pellet blends of poplar and pine sawdust: ef-fects of material composition, additive, moisture content and compression die onpellet quality, Fuel Process. Technol. 132 (0) (2015) 15–23, http://dx.doi.org/10.1016/j.fuproc.2014.12.013.
[27] N. Yancey, C. Wright, C. Conner, J. Tumuluru, Optimization of preprocessing anddensification of sorghum stover at full-scale operation, Proceedings of the ASABE2011 Annual International Meeting.
[28] International organization for standardization, ISO Standard 9276-2:2014 — Repre-sentation of Results of Particle Size Analysis— Part 2: Calculation of Average ParticleSizes/Diameters and Moments From Particle Size Distributions, May 2014.
[29] R. Trottier, S. Dhodapkar, A guide to characterizing particle size and shape, Chem.Eng. Prog. 110 (7) (2014) 36–46.
[30] R. Freeman, Measuring the flow properties of consolidated, conditioned and aeratedpowders — a comparative study using a powder rheometer and a rotational shearcell, Powder Technol. 174 (1–2) (2007) 25–33, http://dx.doi.org/10.1016/j.powtec.2006.10.016 (pSA Conference 2003, Harrogate, England, 2003).
[31] R.E. Freeman, J.R. Cooke, L.C.R. Schneider, Measuring shear properties and normalstresses generated within a rotational shear cell for consolidated and non-consolidated powders, Powder Technol. 190 (1–2) (2009) 65–69, http://dx.doi.org/10.1016/j.powtec.2008.04.084 (symposium on Powder Science and Technology- Powders and Sintered Material, Albi, France, MAY 23-25, 2007).
[32] A.W. Jenike, Storage and Flow of Solids, Salt Lake City, Utah, 1964.[33] J.W. Carson, H.Wilms,Development of an international standard for shear testing, Pow-
der Technol. 167 (1) (2006) 1–9, http://dx.doi.org/10.1016/j.powtec.2006.04.005.[34] J. Tomas, H. Schubert, Particle characterization, Partec 79 (1979) 301–319.[35] O.O. Fasina, Flow and physical properties of switchgrass, peanut hull, and poultry lit-
ter, Trans. ASABE 49 (3) (2006) 721–728.

56 N.C. Crawford et al. / Fuel Processing Technology 140 (2015) 46–56
[36] G. Barbosa-Canovas, P. Juliano, Compression and Compaction Characteristics of Se-lected Food Powders, 49, Kluwer Academic Plenum Publishers, New York, NY,2005http://dx.doi.org/10.1016/S1043-4526(05)49006–3.
[37] V. Ganesan, K.A. Rosentrater, K. Muthukurnarappan, Flowability and handling char-acteristics of bulk solids and powders — a review with implications for DDGS,Biosyst. Eng. 101 (4) (2008) 425–435, http://dx.doi.org/10.1016/j.biosystemseng.2008.09.008.
[38] S. Kokova, N. Pilpel, The failure properties of lactose and calcium carbonate powders,Powder Technol. 5 (1971) 329–343.
[39] P. Chen, Z. Yuan, X. Shen, Y. Zhang, Flow properties of three fuel powders,Particuology 10 (4) (2012) 438–443, http://dx.doi.org/10.1016/j.partic.2011.11.013.
[40] M. Gil, D. Schott, I. Arauzo, E. Teruel, Handling behavior of two milled biomass: Srfpoplar and corn stover, Fuel Process. Technol. 112 (2013) 76–85, http://dx.doi.org/10.1016/j.fuproc.2013.02.024.
[41] F. Miccio, D. Barletta, M. Poletto, Flow properties and arching behavior of biomassparticulate solids, Powder Technol. 235 (2013) 312–321, http://dx.doi.org/10.1016/j.powtec.2012.10.047.
[42] N. Chevanan, A.R. Womac, V.S.R. Bitra, D.C. Yoder, S. Sokhansanj, Flowability param-eters for chopped switchgrass, wheat straw and corn stover, Powder Technol. 193(1) (2009) 79–86, http://dx.doi.org/10.1016/j.powtec.2009.02.009.
[43] A. Demirbas, A. Sahin, Evaluation of biomass residue 1. briquetting waste paper andwheat straw mixtures, Fuel Process. Technol. 55 (2) (1998) 175–183, http://dx.doi.org/10.1016/S0378-3820(98)00041–1.
[44] E. Mewes, Compression relationships as a result of experiments in pressure cham-bers, Landwirtsch. Forsch. 9 (3) (1959) 68–76.
[45] S. Mani, L. Tabil, S. Sokhansanj, Specific energy requirement for compacting cornstover, Bioresour. Technol. 97 (12) (2006) 1420–1426, http://dx.doi.org/10.1016/j.biortech.2005.06.019.