fuel economy standards: how far? how fast? how wide? how...
TRANSCRIPT

___________________________________________________________________________
2011/SOM1/EWG/WKSP3/007 Agenda Item: III-C- (a)
Fuel Economy Standards: How Far? How Fast? How Wide? How Best
Submitted by: International Council on Clean
Transportation (ICCT)
APEC Cooperative Energy Efficiency Design for Sustainability - Energy Efficient
Urban Passenger TransportationSan Francisco, United States
14–16 September 2011

1
Fuel Economy Standards: HowFar? How Fast? How Wide?
How Best?
Michael P. Walsh“Energy Efficient Urban Passenger
Transportation”
San Francisco24 September, 2011
International Council on CleanTransportation
Goal of the ICCT is todramatically reduceconventional pollutantand greenhouse gasemissions from personal,public and goodstransportation in order toimprove air quality andhuman health, andmitigate climate change.
WWW.THEICCT.ORG
Transportation Fuel Consumptionis Growing Rapidly

2
Historical Fleet CO2 Emissions Performance AndCurrent Or Proposed Standards
We Are Starting To Address The Growth
US 2025:107
EU 2020: 95
Japan 2020: 105
China 2020: 117
90
110
130
150
170
190
210
230
250
270
2000 2005 2010 2015 2020 2025
GR
AM
SC
O2
PE
RK
ILO
ME
TE
RN
OR
MA
LIZ
ED
TO
NE
DC
TE
ST
CY
CL
E
US-LDV
California-LDV
Canada-LDV
EU
Japan
China
S. Korea
Australia
Solid dots and lines: historical performanceSolid dots and dashed lines: enacted targets
Solid dots and dotted lines: proposed targetsHollow dots and dotted lines: unannounced proposal
[1] China's target reflects gasoline fleet scenario. If including other fuel types, the target will be lower.[2] US and Canada light-duty vehicles include light-commercial vehicles.
Historical Fleet Fuel Consumption Performance AndCurrent Or Proposed StandardsBut We Have A Long Way To Go
US: 4.6
EU: 4.1
Japan: 4.5
China: 5.0
3
4
5
6
7
8
9
10
11
12
2000 2005 2010 2015 2020 2025
LIT
ER
PE
RH
UN
DR
ED
KIL
OM
ET
ER
NO
RM
AL
IZE
DT
ON
ED
CT
ES
TC
YC
LE
US-LDV
California-LDV
Canada-LDV
EU
Japan
China
S. Korea
Australia
[1] China's target reflects gasoline fleet scenario. If including other fuel types, the target will be higher.[2] US and Canada light-duty vehicles include light-commercial vehicles.
Solid dots and lines: historical performanceSolid dots and dashed lines: enacted targetsSolid dots and dotted lines: proposed targetsHollow dots and dotted lines: unannounced proposal
Standard Design: Mass Reduction TechnologySize Based Standards Incentivize Lightweighting
• Take a particular technology package, for example:
– Efficiency (15% GHG reduction) gasoline direct injection, turbocharging, new transmission
– Mass reduction (10% mass reduction 6% GHG reduction) via lightweight materials
• Size-based approach fully rewards lightweighting; weight-based does not
7
175
195
215
235
255
275
40.5 42 43.5 45 46.5
Vehicle footprint (ft2)
GH
Gem
issi
on
rate
(gC
O2
e/m
i)
Toyota PC models (MY2008)
Toyota PC sales-wtd average (MY2008)Approximate PC 2016 standard
Corolla
Camry
Fleet
average
175
195
215
235
255
275
2250 2500 2750 3000 3250
Vehicle weight (lb)
GH
Gem
issi
on
rate
(gC
O2
e/m
i) Toyota PC models (MY2008)Toyota PC sales-wtd average (MY2008)Hypothetical wt-based PC 2016 standard
Corolla
Camry
Fleet
average
Weight-based design:– Efficiency: 34-41 g CO2/mi benefit
– Lightweighting: only 4-5 g CO2/mi compliance benefit
– Lightweighting results in more stringent standard
Size-based design:– Efficiency: 34-41 g CO2/mi benefit
– Lightweighting: 13-15 g CO2/mi actual benefit
– Plus potential for further optimization
Fiscal Measures Are Also Very ImportantImpact Of French Bonus-Malus On Car Market
Shift

3
Programs Adopted To Date AreJust Starting To Turn The Corner
Tremendous Potential Still Exists ForIncreasing Efficiency, Reducing CO2
• Technical efficiency low-CO2 options
– Petroleum efficiency
• Gasoline
• Diesel
• Hybrid
– Alternative fuels
• Compressed natural gas
• Biofuels
– Electric-drive
• Plug-in hybrid electric
• Electric
• Fuel cell electric
• Petroleum-fueled vehicles will be dominant for many years
– The most near-term GHG reduction potential, most affordable, lowestconsumer payback period, lowest cost-per-ton CO2 are petroleum efficiencyoptions
10
Electric
Turbo
Hybrid
Plug-in hybrid
Fuel cell
Stop-start
Advancedlightweightmaterials
Low rollingresistance tires
Aerodynamics
Efficientaccessories
Directinjection
Diesel
6+ Speed
All Aspects of the Vehicle HavePotential For Improvement
Efficiency and Low-CO2
Technologies
12
What efficiency technologies are available for conventional vehicles?– All of these are being deployed today by automakers around to world
CO2

4
Increased Efficiency: Near-Term
• Major incremental efficiency improvement comes at modest cost
– engine, transmission, and vehicle load reduction technologies willproliferate for global 2015-2016 standards
– Technologies with 20-25% CO2 decrease (+25-33% in km/L) haveconsumer payback periods of 2-3 years
13
Electric
Turbocharging
Hybrid
Plug-in hybrid
Fuel cell
Stop-start
Advanced lightweight materials
Low rolling resistance tires
Aerodynamics
Efficient accessories
Direct injection
Compression ignition
6+ speed transmission
Variable valve timing
Cylinder deactivation
Variable valve lift
Dual clutch transmission
Cooled EGR
Lean-burn
Data from US EPA, 2010 for rulemaking greenhouse gas standards for 2012-2016 vehicles
Increased Efficiency: Mid-Term
• More exciting hybrid models arrive every year◦ Hybrids now span across compacts, sedans, crossovers, large SUVs, pickups
◦ Hybrids have much higher efficiency: 40-100% greater km/L (30-50% lower CO2)
◦ Hybrids are 3% of US market today; but costs decrease with volume, new entries
14
Model year 2008 vehicle data from US EPA data on US city/highway test procedure; Hybrid models areexisting and announced model year 2008-2011 hybrid models
Hybrid Technology: GHG Reduction
15
Hybrid vehicle models commercialized in U.S.– Span vehicles: compacts, sedans, crossovers, large SUVs, pickups
– Average 33% CO2/mi reduction, 50% mpg increase vs. similar non-hybrids
Source: CARB 2010
Hybrid Vehicle Technology: Emissions
16
Hybrids well-positioned for new CO2 and criteria pollutant standards– Current hybrid models tend to offer 25-30% CO2 decrease and lowest NOx/HC
– Future standards (e.g., in US, California) will push CO2, as well as NOx/HC, lower
.
2022
20
16
Notes: data from EPA, 2010. Future year CO2 reduction based on EPA/NHTSA adopted 2016 standards; FutureTotal hydrocarbon and oxides of nitrogen (THC+NOx) based on proposed California LEVIII criteria pollutantstandards for 2022 for NMOG and NOx

5
Hybrid Technology Costs
• Hybrid component costs continue to come down
– This is happening due to innovation, learning, volume, competitive supplier base
– Hybrids become more cost-competitive over time
17Data sources: EPA, 2010; EPA/NHTSA/CARB, 2010
Increased Efficiency: Long-Term
Gradually over the long-term, electric drive is expected to take off– Today’s stop-start and hybrids will offer a bridge to plug-in electric vehicles
– But… according to nearly every consulting and technical research study -
• Of new vehicles in 2020-2025, over 90% still use petroleum fuels
• In optimistic cases, there are 5-10% full electric vehicles by 2025
18
Automobile CO2 Emissions: Long-Term
How might we achieve deeper, long-term CO2 cuts by 2050? Advanced technology will be required (e.g., efficiency, hybrids, electric, biofuels)
We will need to change travel behavior, land use patterns, not just technology
19
Efficiency
Hybrids
Biofuels
Electric
Travel demand?
Electrification: New Model Introduction
• In just the next several years…
– Every major automaker will have several hybrid models
– Every major automaker will have several plug-in electric vehicles
– Some major automakers will be running major fuel cell vehicle demonstrations
20
0.5
1999 2001 2003 2005 2007 2009 2011 2013
Introduc on year
Hybrid
Plug‐in hybrid
Electric vehicle
Fuel cell (demo)
Honda
Toyota
Ford
GM
Nissan
Mercedes
BMW
VW‐Audi
Hyundai‐Kia
Other
Insight I
GS HS250h Highlander
RX
Camry Prius I
CR‐Z Accord Civic
LS CT200h
Clarity
A F‐Cell
B F‐Cell
Tucson
Silverado
Escape Mariner Fusion
Vue LaCrosse Tahoe Aura
Malibu
Escalade
Al ma M35h
ML450 S400
Sonata
Cayenne
Aspen
Touraeg
A6
Je a
Op ma
Prius
iQ
Transit
Focus Energi
Fit
7‐Series
X6
Volt
MegaCity
Smart
Mini
Leaf
Coda
Fisker
IMiEV
Tesla
500
BlueOn
MKZ
Urban
Infini
Plug‐in
BYD Th!nk
C‐Max
Equinox
Bright
E‐up
V
Rav4
Insight II
Prius II Prius III
PX F3DM
FCHV
Q5
C
6
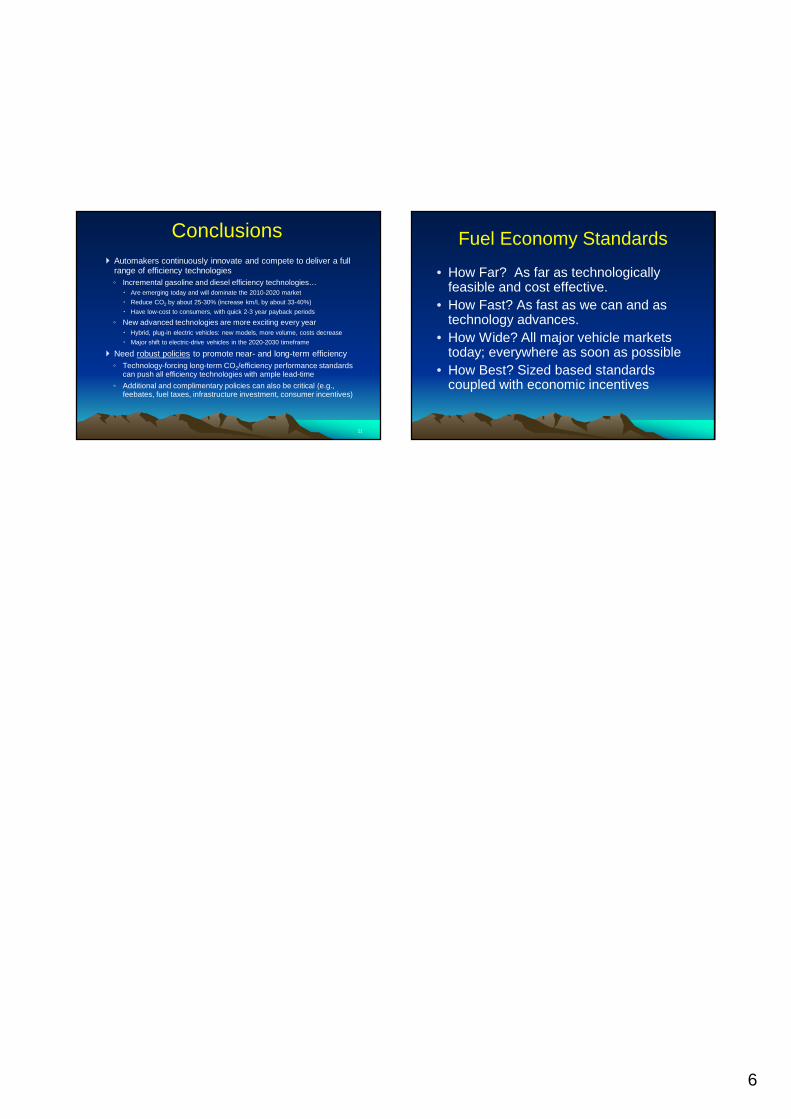
Conclusions
Automakers continuously innovate and compete to deliver a fullrange of efficiency technologies
◦ Incremental gasoline and diesel efficiency technologies…
Are emerging today and will dominate the 2010-2020 market
Reduce CO2 by about 25-30% (increase km/L by about 33-40%)
Have low-cost to consumers, with quick 2-3 year payback periods
◦ New advanced technologies are more exciting every year
Hybrid, plug-in electric vehicles: new models, more volume, costs decrease
Major shift to electric-drive vehicles in the 2020-2030 timeframe
Need robust policies to promote near- and long-term efficiency
◦ Technology-forcing long-term CO2/efficiency performance standardscan push all efficiency technologies with ample lead-time
◦ Additional and complimentary policies can also be critical (e.g.,feebates, fuel taxes, infrastructure investment, consumer incentives)
21
Fuel Economy Standards
• How Far? As far as technologicallyfeasible and cost effective.
• How Fast? As fast as we can and astechnology advances.
• How Wide? All major vehicle marketstoday; everywhere as soon as possible
• How Best? Sized based standardscoupled with economic incentives