fuel cells – a complement and an alternative to cells – a complement and an alternative to . ......
TRANSCRIPT

Fuel Cells – A Complement and an Alternative to Batteries on the Path to Application K. Andreas Friedrich Institut für Technische Thermodynamik Pfaffenwaldring 38-40, Stuttgart
www.DLR.de • Chart 1

2
Introduction
Transport
Stationary
Importance of battery and fuel cells
Challenges
Principle and design of fuel cells
Transport requirements
Lowering noble metal content
Hybrid systems
Status of residential application
Japan
Germany
Content

3
Introduction
Transport
Stationary
Importance of battery and fuel cells
Challenges
Principle and design of fuel cells
Transport requirements
Lowering noble metal content
Hybrid systems
Status of residential application
Japan
Germany
Content

Recent International Intitiatives
COP 21 and 22 in 2015 and 2016
- COP 21 achieved a legally binding and universal agreement on climate change
- Limit the world’s rise in average temperature to “well below” 2 °C
- Dynamic commitments which are reviewed
- Ratified by more than 120 countries
www.DLR.de • Chart 4
Hydrogen Council 2017 in Davos
- Thirteen leading energy, transport and industry companies have today launched a global initiative for hydrogen to foster the energy transition.
- Investments currently amount to an estimated total value of €1.4 Bn/year

Importance of Fuel Cells and Hydrogen Technology
Transportation / mobility - Fuel cell vehicles (FCV) - Range extender
Energy / stationary application - Residential power (micro-CHP) - Distributed flexible power plants Hydrogen: - Long-term storage (power to gas) - Use in chemical industry - Synthetic fuels - Load management
www.DLR.de • Chart 5
Toyota Mirai

How Does a Fuel Cell Work?
www.DLR.de • Chart 6
Example: Proton Exchange Membrane Fuel Cell (PEMFC) • Electrolyte: polymer membrane
• Charge carriers: H+ ions
• H+ ions react at cathode to
water
• Reaction anode:
H2 -> 2H+ + 2e-
• Reaction cathode:
½O2 + 2H+ + 2e- -> H2O
• Temperature: 60 - 80°C
chemical energy electrical energy

Components of Polymer Electrolyte Fuel Cells
6 nm
25 nm
40 w% Pt/C Nafion 112
GDL Toray paper
www.DLR.de • Chart 7

8
Introduction
Transport
Stationary
Importance of battery and fuel cells
Challenges
Principle and design of fuel cells
Transport requirements
Lowering noble metal content
Hybrid systems
Status of residential application
Japan
Germany
Content

Comparison of Battery and Fuel Cell Vehicles
+ Locally emission-free + Highest efficiency + Standardized e-fuel + Private charging infrastructure + Model choice improving - High cost - Public charging infrastructure - Charging currently time consuming - Driving range - CO2 reduction dependent on % RE
www.DLR.de • Chart 9
+ Locally emission-free + high efficiency + Charging / fueling ≅ 3 min. + Driving range > 400 km + Fast CO2 reduction possible + Simplified heat management - High cost - Missing H2 fueling infrastructure - Reliability - No model choices
Battery Vehicle Fuel Cell Vehicle

Efficiencies
www.DLR.de • Chart 10
Typical car efficiency (Tank to Wheel): - Internal combustion engine: 20 – 25 %
- Fuel cell electrical drive: 40 – 50 %
- Battery electrical drive: 70 – 80 %
fuel heat movement electricity
fuel electricity
O H
H
chemical energy electricity electricity
Secondary battery

Efficiency Comparison of Automotive Power Trains
www.DLR.de • Chart 11 > Europeasn Space-Technology-Transfer-Forum“> July 9-10, 2012
Based on Well-to-Wheel studies of European and Japanese Sources: Concawe, EUCAR, JRC und JHFC
Gasoline Diesel
Hybrid (gasoline) Hybrid (Diesel)
Fuel Cell Powertrain with 100% H2 from natural gas
Battery drive with power from 100% EU grid
Fuel Cell Powertrain from 100% renewable H2
Battery Powertrain from 100% renewable power
Technology Change
Gasoline Japan (JHFC)
Diesel Japan (JHFC)
Hybride Gasoline Japan
Fuel Cell Japan (nowadays and future)
Battery Japan (Power Mix)

Status of Electromobility (I)
www.DLR.de • Chart 12
More than 1 Mio battery electric vehicles About 90% of drivers in germany travel less than 100 km per day
Source: Global EV Outlook 2016

Status of Electromobility (II)
www.DLR.de • Chart 13
Few thousands of fuel cell vehicles – no degression of cost by mass fabrication yet
2017 FCV models:
FCX Honda Clarity
Mercedes GLC f-cell
Plug-in hybrid SUV 9 kWh Li-ion battery (50 km) 4 kg H2 @ 700 bar (500 km)

www.DLR.de • Folie 14
Development Success
Gemini PEFC Stack
Nissan PEFC Stack (2012)
Pt loading (mg/cm2): 1960s ca. 11
1990s ca. 1 - 3 2000s ca. 0.4 - 0.6 2016 ca. 0.2 - 0.3
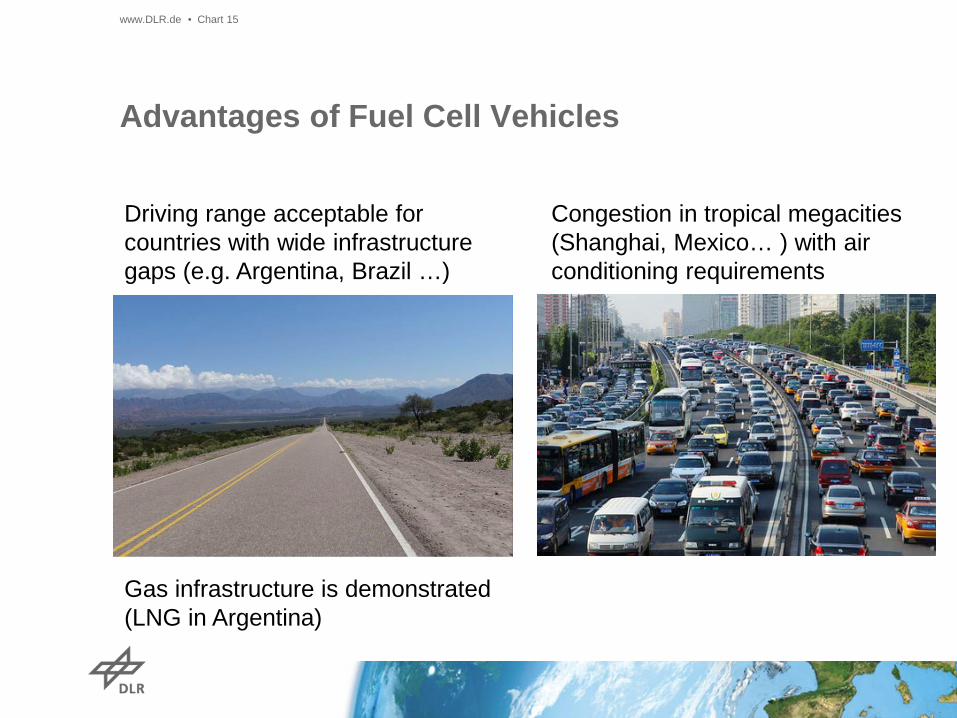
Advantages of Fuel Cell Vehicles
www.DLR.de • Chart 15
Driving range acceptable for countries with wide infrastructure gaps (e.g. Argentina, Brazil …)
Congestion in tropical megacities (Shanghai, Mexico… ) with air conditioning requirements
Gas infrastructure is demonstrated (LNG in Argentina)

Infrastructure for Fuel Cell Vehicles
- Investments for H2 Infrastructure until 2030 accumulate to 10 - 21 bill. Euro in a moderate scenario (7 Mio. fuel cell vehicles)*
- Comparative values: - Road infrastructure in Germany in 2005: 5 bill. Euro - EEG (RE) compensation 2013: 8.5 bill. Euro Photovoltaics 20.38 bill. Euro total - Income toll system in Germany 2015: 3 bill. Euro
www.DLR.de • Chart 16
Plug-in Cars: Public charging station: ca. 12 vehicles cost: ca. 8000 € H2 fueling station: ca. 2000 – 2500 vehicles, cost: ca. 1 Mio € Cost for 1 Mio vehicles Battery: 0.67 billion € Fuel cells: 0.5 billion €
*GermanHy 2009, Joest et al.

www.DLR.de • Chart 17
Importance of Pt Expenditure for Automotive PEMFCS
- High-cost of precious-metal catalyst, Pt (~35 € / g) contributes significantly of the total system cost*
- 3-5 times higher PGM content compared to ICE
- South Africa is the top producer of platinum, with an almost 77% share, followed by Russia at 13% (40 years reserves at the present rate)
- Platinum is considered a bottleneck towards the widespread diffusion of this technology
- Pt loading for commercial automotive MEA in present demonstration cars is around 0.45 mg/cm² leading to roughly 0.5 g/kW
* E.J. Carlson, P. Kopf, J. Sinha, S. Sriramulu, and Y. Yang Cost Analysis of PEM Fuel Cell Systems for Transportation December 2005, TIAX LLC

Electric powertrains can become cost competitive with ICE over the next decades
1 Delta between FCEV TCO and ICE gasoline TCO calculated in EUR/month/vehicle SOURCE: Clean team sanitized data, coalition workshops, Working team analysis
Exlanation TCO: • TCO: purchase price + operation costs • Purchase price: component costs (66%), asembly costs (13%), SG&A (14%), profit (7%) • Operation costs: maintainance, fuel costs and infrastructure costs • Duration: 15 years; 12.000 km per year (180.000km overall)
0.18 0.18
0.20 0.21
0.24
0.18 0.18 0.19
0.20 0.20
0.18 0.18
0.19 0.18
0.18
2020 2030 2050
Total Cost of Ownership (TCO) EUR/km
0.0
0.30
0.20
0.10
0.05
0.15
FCEV BEV PHEV ICE - gasoline ICE - diesel
TCO Delta1
EUR/month 64 23 4
0.25
C/D SEGMENT (C-Class)
25% FCEV WORLD

Assumption: Dramatic Fuel Cell System Cost Reduction (90 %!) with efficient Pt use
www.DLR.de • Chart 19
SOURCE: Coalition Study The role of Battery Electric Vehicles, Plug-in Hybrids and Fuel Cell Electric Vehicles 2010

DLR.de • Chart 20
Reduction of stack cost Reduction of manufacturing cost at increased durability in order to compete
with conventional technologies
Strategy
R&D for Materials, Components, Systems→ cost reduction, increased durability of FC-
systems
Challenge
Performance
Cost
Durability Trilemma
Most promising regarding cost reduction: catalyst layer (45 % of stack cost)
• Low loadings • Alternative catalysts
[U.S. DOE 2015 Annual Merit Review]

DLR.de • Chart 21
Reduction of Pt content EU (Impact project)
0.25 mgPt/cm2
~0.60 mgPt/cm2
Performance improvement at low loadings:

DLR.de • Chart 22
Durability improvement (1 A/cm2):
o Reduced durability at reduced Pt- loading
Commercial MEA 0.6mgPt/cm2
Target
Test in Progress
Reduction of Pt content: Durability EU (Impact project)

DLR.de • Chart 23
Determination of Degradation Rates Problem: No common procedure to determine degradation rates
• j = 1 A/cm2
• Refresh interruptions
Determination between reversible and irreversible degradation

DLR.de • Chart 24
Determination of Degradation Rates
Test block
Operation period
Recovery procedure 0.00 A/cm2
0.05 A/cm2
0.26 A/cm2
0.59 A/cm2
0.84 A/cm2
1.00 A/cm2
20 min
Single FC-DLC cycle
Durability test: Sequence of test blocks consisting of an operation and a
recovery period
FC dynamic load cycle (FC-DLC) according to FCH-JU StackTest Project Pseudo I-V curve after each cycle

DLR.de • Chart 25
0.00 A/cm2
0.05 A/cm2
0.26 A/cm2
0.59 A/cm2
0.84 A/cm2
1.00 A/cm2
FC-DLC cycles
FC dynamic load cycle (FC-DLC) according to FCH-JU StackTest Project Pseudo I-V curve after each cycle
Determination of Degradation Rates

www.DLR.de • Chart 26
Degradation and Performance vs. Pt-loading
Pt-loadings at anode/cathode in mgPt/cm2
DLR Rainbow-Stack
2nd set 1st set

www.DLR.de • Chart 27
Degradation and Performance Vs Pt-loading
• Irreversible degradation increases with decreasing cathode ECSA (BoL)
• Slightly increased ECSA loss observed for high degradation rates
• No correlation observed for anode ECSA loss

Fuel Cells with Batteries: Concept of Power Boost by Hybridization
www.DLR.de • Chart 28
Modeling of fuel cell and battery hybrid: voltage and power
Volta
ge in
V
Current in A -> Current in A ->
Volta
ge in
V
Pow
er in
W
Load/ Source
Fuel cell + Li battery direct hybrid

Emission-free Aircraft
www.DLR.de • Chart 29
- Zero emission passenger flight with fuel cells
- HY4 combines high efficient power generation by fuel cell - battery hybrid with efficient drive train and economic fuselage.
- Air transport of up to 4 passengers with less than 350 g H2 per 100 km at cruising speed of 160-200 km/h.
- Basis for future improvements regarding reliability, endurance and peak altitude.
- Future commercial emission-free passenger aircraft for up to 40-60 passengers seems possible with advanced fuel cell technology
H2FLY

30
Introduction
Transport
Stationary
Importance of battery and fuel cells
Challenges
Principle and design of fuel cells
Transport requirements
Lowering noble metal content
Hybrid systems
Status of residential application
Japan
Germany
Content

Stationary Application: Residential Application in Japan
www.DLR.de • Chart 31

Stationary Application: Residential Application in Japan
www.DLR.de • Chart 32

Residential Systems in Germany
www.DLR.de • Chart 33
• Technology introduction program (TEP) for stationary residental fuel cells in place in Germany
• Goal: Increase the number of installation up to 75 000 until 2023
Manufacturer Micro-CHP brand name
Electrical power [kW]
Thermal power [kW]
Electrical efficiency
[%]
Total efficiency
[%]
Technology
Buderus Logapower FC10
0.7 0.62 45 85 SOFC
Elcore Elcore 2400 0.3 0.7 32 104 HT PEMFC Hexis Galileo
1000 N 1.0 1.8 35 95 SOFC
Junkers CeraPower FC
0.7 0.62 45 85 SOFC
RBZ Inhouse 5000+
5.0 7.5 34 92 PEMFC
SenerTec Dachs InnoGen
0.7 0.96 37 93 PEMFC
SOLIDpower BlueGEN 1.5 0.61 60 85 SOFC Engen-2500 2.5 2.0 50 90 SOFC
Viessmann Vitovalor 300-P
0.75 1.0 37 90 PEMFC

Conclusions
- Fuel Cell and Batteries are important technologies for our future energy system
- Fuel Cells can help to overcome some of batteries present and future limitations
- Transport and stationary power can profit from hybrid system
THANK YOU FOR YOUR ATTENTION !
www.DLR.de • Chart 34
The research leading to these results has received funding from the European Union’s Seventh Framework Programme (FP7/2007-2013) for Fuel Cell and Hydrogen Joint Technology Initiative under Grant no 303452 (Impact).