functionscavanaughmath.pbworks.com/w/file/fetch/59793654/precalc 2.4.pdf · average rate of change...
TRANSCRIPT
Copyright © Cengage Learning. All rights reserved.
Functions

Copyright © Cengage Learning. All rights reserved.
2.4 Average Rate of Change of a Function

3
Objectives
► Average Rate of Change
► Linear Functions Have Constant Rate of Change
4
Average Rate Of Change Of A Function
Functions are often used to model changing quantities.
In this section we learn how to find the rate at which the values of a function change as the input variable changes.

5
Average Rate of Change
6
Average Rate of Change We are all familiar with the concept of speed: If you drive a distance of 120 miles in 2 hours, then your average speed, or rate of travel, is = 60 mi/h.
Now suppose you take a car trip and record the distance that you travel every few minutes. The distance s you have traveled is a function of the time t:
s(t) = total distance traveled at time t

7
Average Rate of Change We graph the function s as shown in Figure 1.
Figure 1
Average speed
8
Average Rate of Change The graph shows that you have traveled a total of 50 miles after 1 hour, 75 miles after 2 hours, 140 miles after 3 hours, and so on.
To find your average speed between any two points on the trip, we divide the distance traveled by the time elapsed.
Let’s calculate your average speed between 1:00 P.M. and 4:00 P.M. The time elapsed is 4 – 1 = 3 hours. To find the distance you traveled, we subtract the distance at 1:00 P.M. from the distance at 4:00 P.M., that is, 200 – 50 = 150 mi.

9
Average Rate of Change Thus, your average speed is
The average speed that we have just calculated can be expressed by using function notation:
10
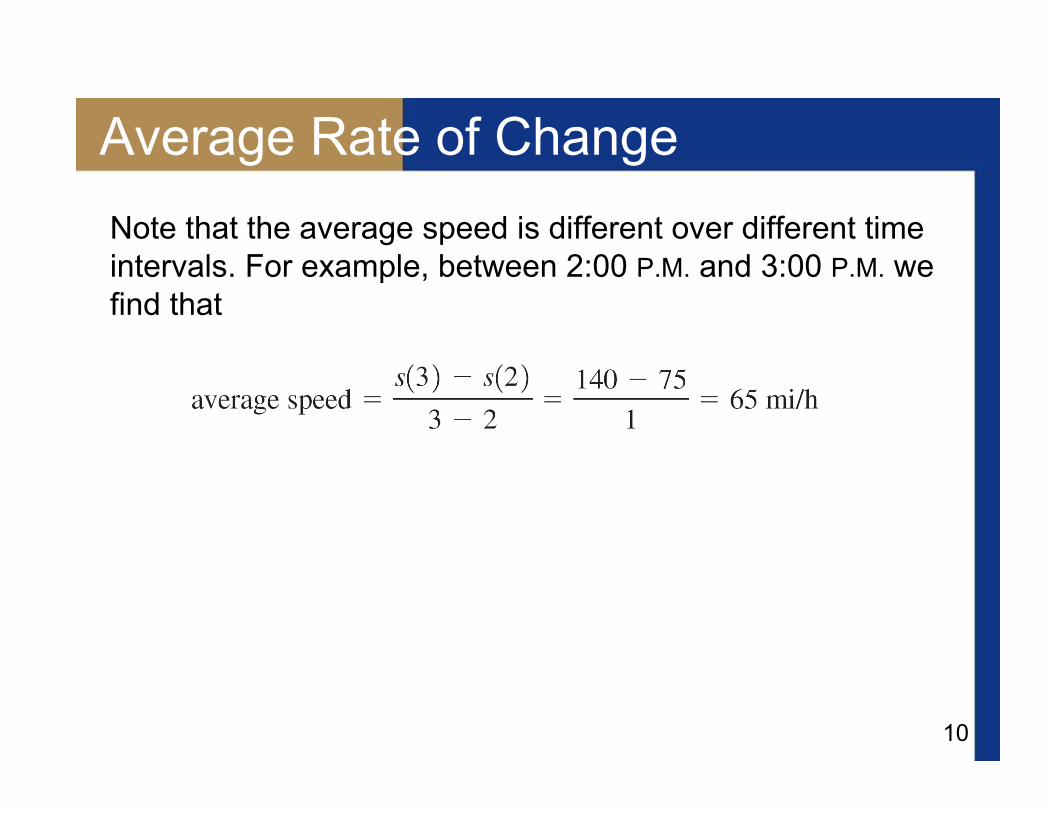
Average Rate of Change Note that the average speed is different over different time intervals. For example, between 2:00 P.M. and 3:00 P.M. we find that

11
Average Rate of Change Finding average rates of change is important in many contexts.

12
Example 1 – Calculating the Average Rate of Change
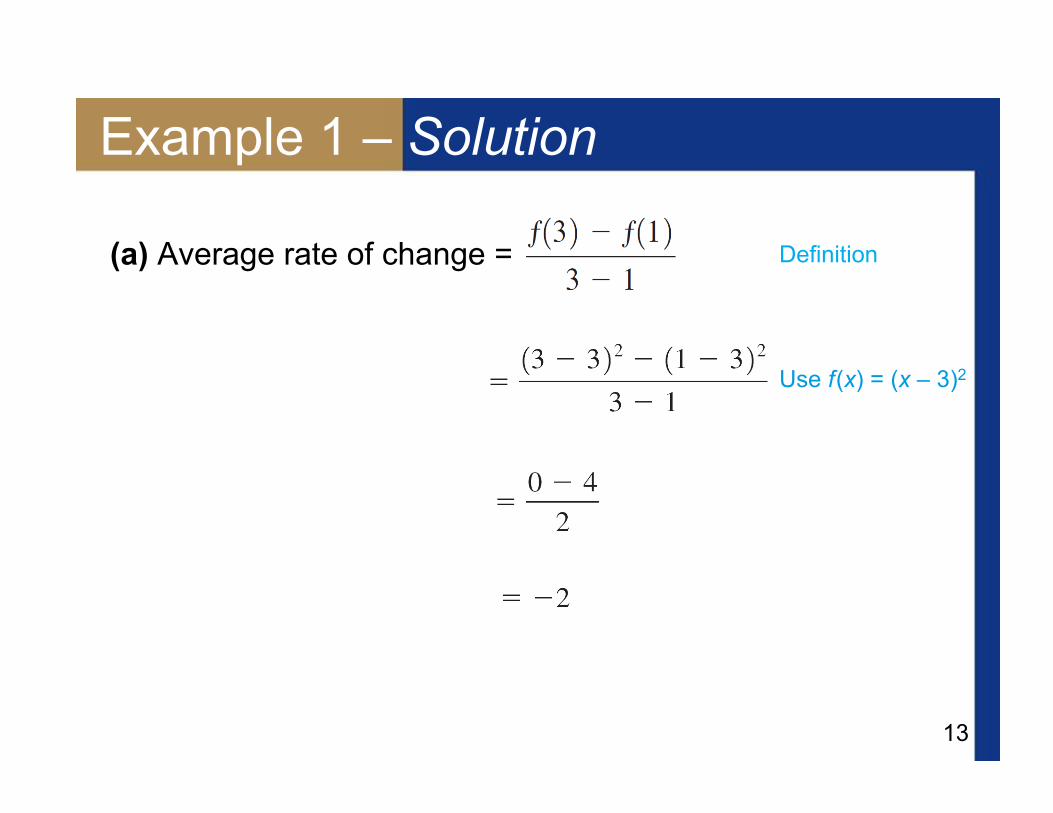
For the function f (x) = (x – 3)2, whose graph is shown in Figure 2, find the average rate of change between the following points:
(a) x = 1 and x = 3
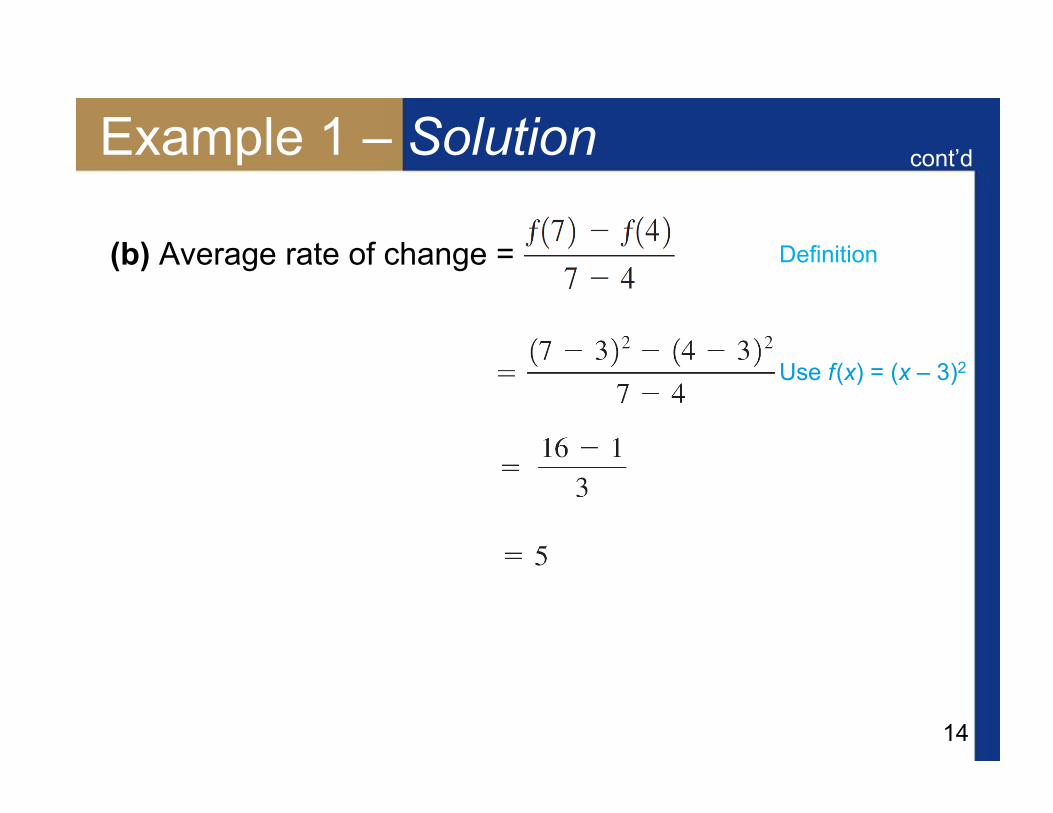
(b) x = 4 and x = 7
f (x) = (x – 3)2
Figure 2
13
Example 1 – Solution
(a) Average rate of change = Definition
Use f (x) = (x – 3)2
14
Example 1 – Solution
(b) Average rate of change =
cont’d
Definition
Use f (x) = (x – 3)2
15
Linear Functions Have Constant Rate of Change
16
Linear Functions Have Constant Rate of Change
For a linear function f (x) = mx + b the average rate of change between any two points is the same constant m.
The slope of a line y = mx + b is the average rate of change of y with respect to x. On the other hand, if a function f has constant average rate of change, then it must be a linear function.
In the next example we find the average rate of change for a particular linear function.

17
Example 4 – Linear Functions Have Constant Rate of Change
Let f (x) = 3x – 5. Find the average rate of change of f between the following points.
(a) x = 0 and x = 1 (b) x = 3 and x = 7 (c) x = a and x = a + h
What conclusion can you draw from your answers?

18
Example 4 – Solution
(a) Average rate of change

19
Example 4 – Solution
(b) Average rate of change
cont’d

20
Example 4 – Solution
(c) Average rate of change
cont’d

21
Example 4 – Solution It appears that the average rate of change is always 3 for this function. In fact, part (c) proves that the rate of change between any two arbitrary points x = a and x = a + h is 3.
cont’d