fta and regional integration
DESCRIPTION
This presentation was given at the 2014 ADBI-Keio Executive Training in Economics which was held in Keio University and ADBI, Tokyo on 3-7 November 2014.Read more about the event: http://bit.ly/1UoJdFvTRANSCRIPT

FTA and Regional Integration
Fukunari Kimura Professor, Faculty of Economics, Keio University Chief Economist, Economic Research Institute
for ASEAN and East Asia (ERIA)
1
The views expressed in this presentation are the views of the author and do not necessarily reflect the views or policies of the Asian Development Bank Institute (ADBI), the Asian Development Bank (ADB), its Board of Directors, or the governments they represent. ADBI does not guarantee the accuracy of the data included in this paper and accepts no responsibility for any consequences of their use. Terminology used may not necessarily be consistent with ADB official terms.

1. Context • East Asian economic integration was initiated for
crisis prevention after the Asian currency crisis. – Chiang Mai Initiative, …
• However, since then, the East Asian economic integration has proceeded on the real economy side. – De facto economic integration led by production
networks or the 2nd unbundling – ASEAN Economic Community, five ASEAN+1 FTAs – Attempts over the 21st century rule making by mega
FTAs such as RCEP, TPP, … • South Asia has largely lagged behind the move.
2

Japan USA PRC
EU
Korea Canada
Mexico
Singapore Malaysia
Viet Nam
Brunei Darussalam
Indonesia Philippines
Thailand Chile
Australia
New Zealand
Peru
Cambodia Lao PDR
Myanmar
India
Hong Kong, China Taipei,China
Papua New Guinea
Russia RCEP (ASEAN+6)
APEC (FTAAP)
日EU FTA TTIP
CJK FTA
ASEAN (AEC)
NAFTA
TPP
Mega-FTAs negotiations in East Asia and Asia-Pacific
3

2. Production networks or the 2nd unbundling
• The 2nd unbundling (international division of labor in terms of production processes and tasks) has substantially changed international trade since the mid-1980s (Baldwin (2011)).
• Development gaps nurture production networks (Jones and Kierzkowski (1990)).
• The 2nd unbundling is most advanced in machinery industries (Kimura and Ando (2005)).
• Keep good balance between agglomeration and dispersion forces. – Inter-firm (arm’s length) division of labor generates industrial
agglomeration (Kimura and Ando (2005)). – New economic geography (Baldwin, Forslid, Martin, Ottaviano,
and Robert-Nicoud (2003))
4

The 2nd Unbundling
⇒ Bay B Bay A
Bay C
Bay B
Bay A
Bay C
1st 2nd
ICT⇒
The 2nd unbundling, i.e., international division of labor in terms of production processes and tasks, has developed since the 1980s, based on drastic reduction in coordination costs due to ICT revolution. The 2nd unbundling in the manufacturing sector is most advanced in East Asia.
Source: Baldwin (2011).
5

Bay B
Bay A
Bay C
Bay B
Bay A
Bay C
Bay B
Bay A
Bay C
1) Two-way flows of goods, ideas, technology, capital, and technicians.
2) Investment and application of technical, managerial and market know-how abroad.
Connecting factory & doing business abroad: The “trade-investment-services nexus”
Source: The original is in Baldwin (2011), slightly modified by the author.
The 1st and the 2nd unbundling
6

The fragmentation theory: Production blocks and service links
PB: production blocks SL: service links
7
PB
PB PB
PB
PB
SL
SL
SL SL
SL
After fragmentation
Before fragmentation
Large integrated factory
Tradeoff between the reduction in production costs in PB and the enhancement of SL costs. Fragmentation of production occurs particularly between countries at different development stages (Jones and Kierzkowski (1990)).

The evolution of the 2nd unbundling
The United States
Mexico
Consumers
Headquarters or affliates
Unrelated firms with same firm nationality
Unrelated firms with different firm nationality
The United States
Consumers
Consumers
Japan
Republic of Korea
Viet Nam
Malaysia
The Philippines
Taipei,China
Internet auction
Agglomeration
Agglomeration
Cross-border production sharing (back-and-forth; intra-firm)
Production networks (“networks”; fragmentation and agglomeration;
intra-firm in short distance, arm’s length in long distance)
8 Source: Ando and Kimura (2010).

Machinery exports and imports by regions (US$ millions)
Source: Chang and Kimura (2013). 9
0
500,000
1,000,000
1,500,000
2,000,000Ex
port
s199
3
Impo
rts1
993
Expo
rts2
011
Impo
rts2
011
Expo
rts1
993
Impo
rts1
993
Expo
rts2
011
Impo
rts2
011
Expo
rts1
993
Impo
rts1
993
Expo
rts2
011
Impo
rts2
011
Expo
rts1
993
Impo
rts1
993
Expo
rts2
011
Impo
rts2
011
Expo
rts1
993
Impo
rts1
993
Expo
rts2
011
Impo
rts2
011
ROW EU27 ASEAN+6 LA NAFTA
Final Products
Parts andComponents

Source: Ando and Kimura (2013).
The 2nd unbundling
The 1st unbundling
Export shares of machinery parts and components in total exports indicate the degree of participation in international
production networks.
10

Source: Ando and Kimura (2013).
The 2nd unbundling
The 1st unbundling
11
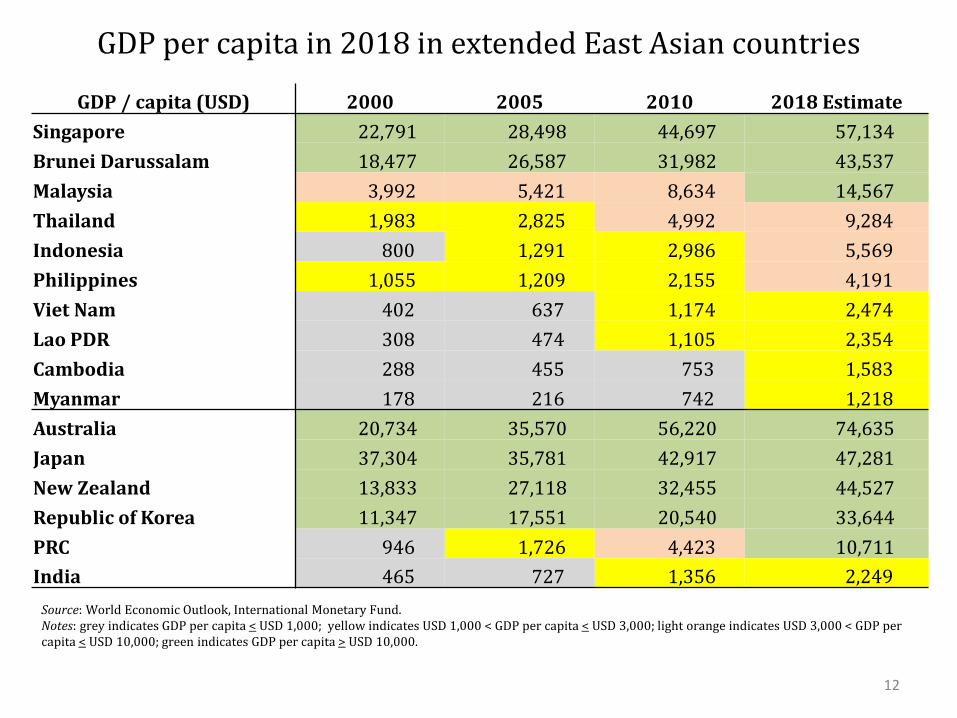
GDP per capita in 2018 in extended East Asian countries
GDP / capita (USD) 2000 2005 2010 2018 Estimate Singapore 22,791 28,498 44,697 57,134 Brunei Darussalam 18,477 26,587 31,982 43,537 Malaysia 3,992 5,421 8,634 14,567 Thailand 1,983 2,825 4,992 9,284 Indonesia 800 1,291 2,986 5,569 Philippines 1,055 1,209 2,155 4,191 Viet Nam 402 637 1,174 2,474 Lao PDR 308 474 1,105 2,354 Cambodia 288 455 753 1,583 Myanmar 178 216 742 1,218 Australia 20,734 35,570 56,220 74,635 Japan 37,304 35,781 42,917 47,281 New Zealand 13,833 27,118 32,455 44,527 Republic of Korea 11,347 17,551 20,540 33,644 PRC 946 1,726 4,423 10,711 India 465 727 1,356 2,249
Source: World Economic Outlook, International Monetary Fund. Notes: grey indicates GDP per capita < USD 1,000; yellow indicates USD 1,000 < GDP per capita < USD 3,000; light orange indicates USD 3,000 < GDP per capita < USD 10,000; green indicates GDP per capita > USD 10,000.
12

13
Income levels at the provincial level (2005)
Source: ERIA=IDE-JETRO GSM Team.

Border Development with Enhancement of Connectivity GDP per capita (2005)
(source) Kudo and Kumagai (forthcoming) 14

15
Beijing (PRC) Vienciana (Lao PDR), and Phnom Penh (Cambodia);
Ha Noi (Viet Nam),

1.5
2.0
2.5
3.0
3.5
4.0
4.5
300 3,000 30,000
LPI 2012 ASEAN 2012 CLMV 2007 Fitted line (LPI 2012)
Singapore
Malaysia
Thailand
Indonesia Philippines
Viet Nam
Cambodia
Lao PDR
GDP per capita (2012, Nominal USD)
LPI 2012
Myanmar
Hong Kong
Korea
China
India
LPIs in forerunner ASEAN and East Asia are relatively higher compared with the indices obtained by regression
= higher LPI compared with GDP/GNI per capita = better access between primary cities to primary ports = high competitiveness in the global market
16
Source: Modified from ERIA (2010)
Correlation between LPI and GDP per capita
PRC
Hong Kong, China
Republic of Korea

SMEs
Innovation in
industrial agglomeration
International production networks
Access to technology Access to finance Fostering human resources Establishing industrial organizations
SME-related policies reviewed by SME Policy Index
Technology transfer/spillover Managerial knowhow Market access
17

18
Reduction in network set-up cost
Reduction in service link cost
Reduction in production cost per se
High-level FTAs
• Investment liberalization
• IPR protection • Competition policy
• Tariff removal • Trade facilitation • Enhancing
institutional connectivity
• Liberalization of production-supporting services
• Investment liberalization
Development agenda
• Investment facilitation/promotion
• Enhancing physical connectivity (including hard and soft logistics infrastructure development)
• Reducing transaction cost in economic activities
• Upgrading infrastructure services such as electricity supply and EPZs
• Enhancing agglomeration effects through SME development
• Strengthening innovation
Policies for enhancing the 2nd unbundling

3. Economic integration and macro/financial policies
• Production networks prefer the stability of exchange rates. – Hayakawa and Kimura (2009)): negative effects of ER
volatility on machinery parts trade in the gravity equation exercise.
– At least some ER coordination may make sense. • Financial sector is one of the important service
subsectors to support production networks. – Liberalization with keeping proper regulation
• Efforts toward financial market integration may work well. – Stock market, bond market, …
19

4. Comparison with the EU
• Much deeper economic integration in the EU in the sense of approaching to a single market. – Development gaps (geographical and industrial) deter
the formation of a single market in Asia. • Macroeconomic policy coordination at the infant
stage in Asia. – Start noticing necessity, looking at the advancement
of de facto economic integration. • Interesting combination of economic integration
and development agenda in ASEAN, including the development of financial sector.
20
5. Conclusion
• Financial integration including single currency is not a short-run agenda.
• However, there are many (small) things to do in order to develop regional financial market.
• Economic integration in the real economy with production networks eventually requires a step toward macroeconomic policy coordination.
21

References • Ando, Mitsuyo and Kimura, Fukunari. (2010) “The Spatial Pattern of Production and Distribution Networks
in East Asia.” In Prema-chandra Athukorala, ed., The Rise of Asia: Trade and Investment in Global Perspective, London and New York: Routledge: 61-88.
• Ando, Mitsuyo and Kimura, Fukunari. (2013) “Production Linkage of Asia and Europe via Central and Eastern Europe.” Journal of Economic Integration, Vol.28, No. 2 (June): 204-240.
• Baldwin, Richard. (2011) “21st Century Regionalism: Filling the Gap between 21st Century Trade and 20th Century Trade Rules.” Centre for Economic Policy Research Policy Insight No. 56 (May) (http://www.cepr.org).
• Baldwin, Richard; Forslid, Rikard; Martin, Philippe; Ottaviano, Gianmarco; and Robert-Nicoud, Frederic. (2003) Economic Geography and Public Policy, Princeton: Princeton University Press.
• Chang, Mateus Silva and Kimura, Fukunari. (2013, 2014) “The Evolution of Production Networks in Machinery Industries.” mimeo.
• Economic Research Institute for ASEAN and East Asia. (2010) Comprehensive Asia Development Plan. Jakarta: ERIA (http://www.eria.org).
• Hayakawa, Kazunobu and Kimura, Fukunari. (2009) “The Effect of Exchange Rate Volatility on International Trade in East Asia.” Journal of the Japanese and International Economies, Vol. 23, Issue 4 (December): 395-406.
• Jones, R. W. and H. Kierzkowski. (1990). “The Role of Service in Production and International Trade: A Theoretical Framework.” In The Political Economy of International Trade: Essays in Honor of Robert E. Baldwin, edited by In R. W. Jones and A. O.Krueger. Oxford: Basil Blackwell.
• Kimura, Fukunari and Ando, Mitsuyo. (2005) “Two-dimensional Fragmentation in East Asia: Conceptual Framework and Empirics.” International Review of Economics and Finance (special issue on “Outsourcing and Fragmentation: Blessing or Threat” edited by Henryk Kierzkowski), 14, Issue 3: 317-348.
22