fruits and vegetables report in vietnam - …home.marketintello.com/data/widgets/sample...
TRANSCRIPT
MarketIntello
11
FRUITS AND VEGETABLES REPORT IN VIETNAM
2016
www.marketintello.com
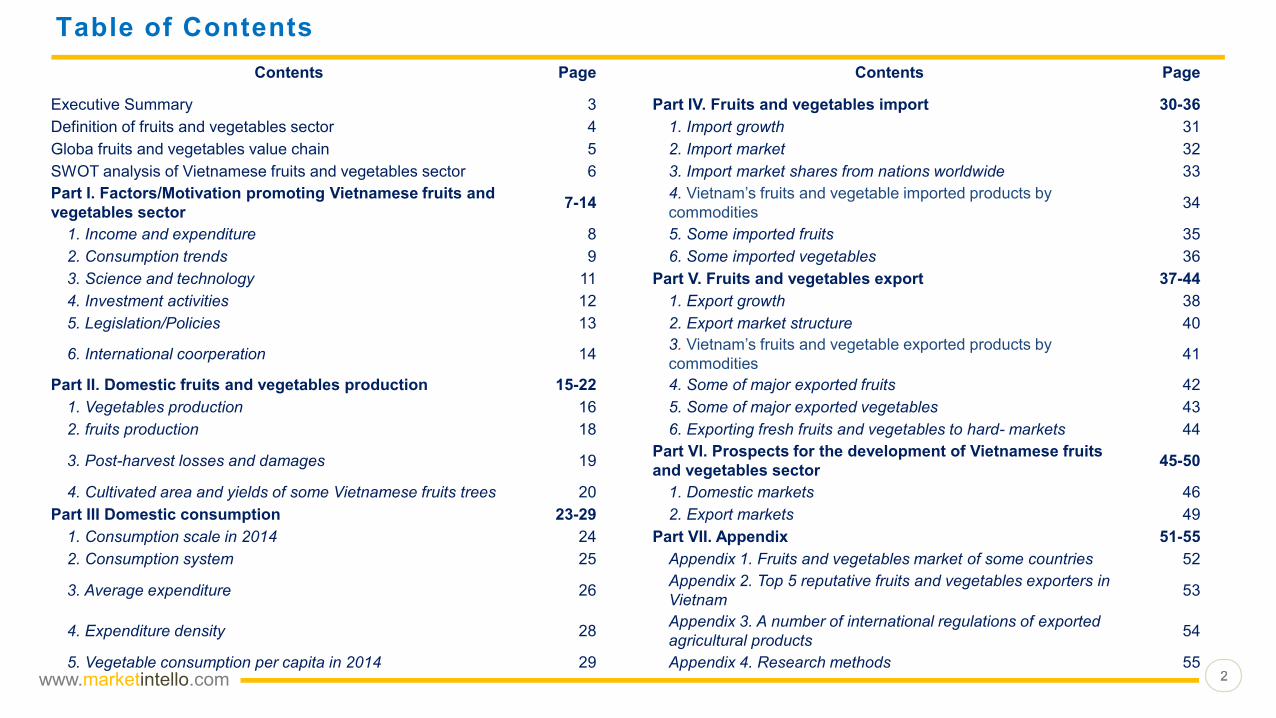
Table of Contents
22
Contents Page Contents Page
Executive Summary 3 Part IV. Fruits and vegetables import 30-36
Definition of fruits and vegetables sector 4 1. Import growth 31
Globa fruits and vegetables value chain 5 2. Import market 32
SWOT analysis of Vietnamese fruits and vegetables sector 6 3. Import market shares from nations worldwide 33
Part I. Factors/Motivation promoting Vietnamese fruits and
vegetables sector7-14
4. Vietnam’s fruits and vegetable imported products by
commodities 34
1. Income and expenditure 8 5. Some imported fruits 35
2. Consumption trends 9 6. Some imported vegetables 36
3. Science and technology 11 Part V. Fruits and vegetables export 37-44
4. Investment activities 12 1. Export growth 38
5. Legislation/Policies 13 2. Export market structure 40
6. International coorperation 143. Vietnam’s fruits and vegetable exported products by
commodities 41
Part II. Domestic fruits and vegetables production 15-22 4. Some of major exported fruits 42
1. Vegetables production 16 5. Some of major exported vegetables 43
2. fruits production 18 6. Exporting fresh fruits and vegetables to hard- markets 44
3. Post-harvest losses and damages 19Part VI. Prospects for the development of Vietnamese fruits
and vegetables sector45-50
4. Cultivated area and yields of some Vietnamese fruits trees 20 1. Domestic markets 46
Part III Domestic consumption 23-29 2. Export markets 49
1. Consumption scale in 2014 24 Part VII. Appendix 51-55
2. Consumption system 25 Appendix 1. Fruits and vegetables market of some countries 52
3. Average expenditure 26Appendix 2. Top 5 reputative fruits and vegetables exporters in
Vietnam53
4. Expenditure density 28Appendix 3. A number of international regulations of exported
agricultural products54
5. Vegetable consumption per capita in 2014 29 Appendix 4. Research methods 55

www.marketintello.com
Executive Summary
33
Fruits and vegetables sector is one of Vietnam's
sectors potentially compete at international markets.
Thanks to diversity of soil types and climate,
Vietnam's fruits and vegetables are of various
kinds with approximately 120 types of vegetables
and 40 types of fruits being harvested seasonally to
meet domestic and export demands. The total
cultivated area of vegetables in Vietnam reached xx
thousand hectares in 2015, increased by x% compared
to 2011. Regarding fruits trees, the trend now is to
replace old trees with new varieties (hybrids),
establishing fruits trees areas grown under VietGAP
and Global Gap standards.
In 2014, an average Vietnamese person consumed xx
kg of vegetables and xx kg of fruits. Fruits and
vegetables expenditures average increased more than
x% on average during 2010-2014. In two big cities
Hanoi and Ho Chi Minh City, the average fruits and
vegetables consumption of residents was much higher
than that of national average consumption.
Imported fruits and vegetables still account for
a minor proportion in Vietnamese fruits and
vegetables consumption (x% for vegetables
and x% for fruits). However, imported fruits and
vegetables from Thailand have gradually
dominated Vietnam’s markets. During last 5 years
(2011-2015), the market share of imported
Thailand fruits and vegetables has increased by x
percentage points, approximate equal the
decrease of China (x percentage points). This
suggests that consumers tend to switch to
higher-quality and safer fruits and vegetables.
Fruits and vegetables export turnover of
Vietnam grows continuously, with an average
annual rate of about x%. With a growth rate of
nearly x% in 2015, Chinese market accounted
for 2/3 of the total Vietnamese vegetables
export turnover. Some markets also have high
growth rates, such as Korea, Taiwan and Malaysia.
Meanwhile, fruits and vegetables exports from
Vietnam to Japan, USA and Singapore decreased
slightly in 2015.
Dragon fruits, lychees, longans and rambutan
are Vietnam's main exports to foreign market
with a turnover of over 300 million USD in 2014,
mainly exported to Chinese market. Most
vegetables are exported to Asian markets, only
some items (sweet corns, carrots, turnips, wood
ears) reached hard- markets such as the US,
Japan and Europe.
Vietnamese fruits and vegetables have
gradually approached hard-markets. In 2015,
the export value of fruits and vegetables from
Vietnam to TPP countries reached x million USD,
doubled x million USD in 2010. However, export
turnover of these markets still accounted for minor
proportion in total export turnover of Vietnam's
fruits and vegetables (x%).
www.marketintello.com
Definition of fruits and vegetables sector
44
• Fruits and vegetables sector includes fresh or dry vegetables, bulbs and fruits and their preparations
(except cassava and cashews).
• Fruits and vegetables items in this report based on item codes specified in the list of Harmonized System
Codes, version 2007 (2007 HS list) including chapters 07, 08 and 20 except cassava and cashew nuts.
www.marketintello.com
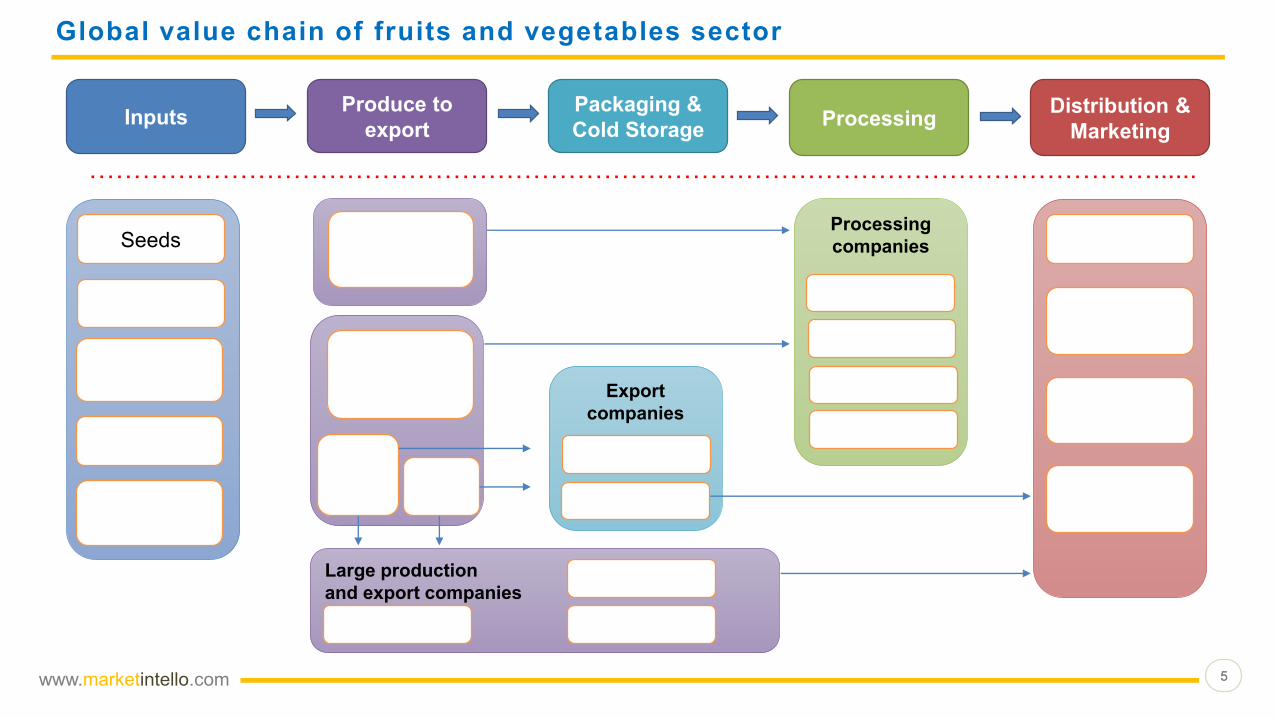
Global value chain of fruits and vegetables sector
55
InputsProduce to
export
Packaging &
Cold StorageProcessing
Distribution &
Marketing
SeedsProcessing
companies
Large production
and export companies
Export
companies
…………………………………………………………………………………………………………......

www.marketintello.com
SWOT analysis of Vietnamese fruits and vegetables sector
66
SO
TWWeaknesses
- Far from EU and the US markets;
- Poor processing techniques and post-harvest
preservations, large post-harvest losses;
- High material input costs;
- Below-capacity processing factories;
- Low quantity of processed fruits and
vegetables;
- Restricted FDI investments in fruits and
vegetables sector
Strengths- Diverse climate, rsuitable for manufacturing;
- Numerous products;
- High domestic demand, especially for fresh
fruits and vegetables;
- This sector receives geat government
supports.
Opportunities
Threats

www.marketintello.com
Part I. Factors/Motivation promoting Vietnamese fruits and vegetables sector
77
Contents Page
Executive Summary 3
Definition of fruits and vegetables sector 4
Global value chain of fruits and vegetables sector 5
SWOT analysis of Vietnamese fruits and vegetables sector 6
Part I. Factors/Motivation promoting Vietnamese fruits and
vegetables sector7-14
1. Income and expenditure 8
2. Consumption tendency 9
3. Science and technology 11
4. Investment activities 12
5. Legislation/Policies 13
6. International coorperation 14
Part II. Domestic fruits and vegetables production 15-22
Part III Domestic consumption 23-29
Part IV. fruits and vegetables import 30-36
Part V. fruits and vegetables export 37-44
Part VI. Prospects for the development of Vietnamese fruits and vegetables sector 45-50
Part VII. Appendix 51-55

www.marketintello.com 88
1. Income and expenditure
During the period 2010-2015,
average personal income rose by
xx% a year and the total
expenditure of households
increased by xx% on average.
Part I. Factors/Motivation promoting Vietnamese fruits and vegetables sector
Income and expenditure in
Vietnam have increased
considerably over the past 5
years, and are expected to
continue to grow.
Personal income and household expenditure in Viet Nam 2010-2017

www.marketintello.com
Part I. Factors/Motivation promoting Vietnamese fruits and vegetables sector
99
2. Consumption tendency
2.1. Domestic consumption tendency

www.marketintello.com
Part I. Factors/Motivation promoting Vietnamese fruits and vegetables sector
1010
2. Consumption tendency (continued)
- US markets:
- EU Markets:
- Korean markets:
- Japanese markets:
2.2. International consumption tendency
www.marketintello.com 1111
- The current trend
- The rate of applying scientific advances in agricultural production
- Food preservation technology
3. Science and technology
Part I. Factors/Motivation promoting Vietnamese fruits and vegetables sector

www.marketintello.com 1212
4. Investment activities
Part I. Factors/Motivation promoting Vietnamese fruits and vegetables sector
A growing number of large private enterprises invested in the agricultural sector:
- Vingroup
- PAN Group
- Some other companies:
Investments in safe agriculture, including fresh fruits and vegetable production, are current development trend in
Vietnam.

www.marketintello.com 1313
5. Legislation/Policies
Part I. Factors/Motivation promoting Vietnamese fruits and vegetables sector
. - Land Law 2013 (issued from July 1st, 2014) were institutionalized and expanded the land use rights, encouraged farmers to
invest in long-term production to develop it effectively;
- Decision No.124QĐ-TTg dated 02/02/2012 of "Approving the master plan on agricultural production development until 2020 and
vision to 2030“.
- Decision No. 899/QD-TTg dated 01/06/2013 of restructuring the agricultural sector including restructuring and diversifying crops,
replacing inefficient crops with high economic benefit ones, which are mainly fruits trees;
- Ministry of Agriculture and Rural Development ’s Decision No. 1648 / QD-BNN-TT dated 17/07/2013 of Planning key fruits
trees area focusing on and orientating some fruits trees in the South until 2020;
- Decision No. 445/QD-TTg dated 21/03/2016 of Pilot Completion Scheme, expanding new model of cooperatives in the Mekong
Delta during the period 2016-2020, including fruits cooperatives;
- Policies of national trade promotion of key items, including fresh and processed fruits and vegetables;
- Policies of Tariffs Preferences, Enterprises’ income tax and Export Promotion.

www.marketintello.com 1414
Vietnam is now a member of large economic organizations worldwide such as: WTO, TPP, APEC, ASEM and ASEAN
Participating in and completing 12 free trade agreements (FTA), bilateral and multilateral:
- FTA between Asean and China
- FTA between Asean and Korea
- FTA between Asean and Japan
- FTA between Asean and India
- FTA between Asean and Australia/Newzealand
- FTA between Viet Nam and Japan
- FTA between Viet Nam and Chile
- FTA between Viet Nam and Korea
- FTA between Viet Nam and Eurasian Economic Union
- FTA between Viet Nam and Europe Union
- Trans-Pacific Partnership Agreement TTP
Advantages:
Challenges:
6. International co-operation
Part I. Factors/Motivation promoting Vietnamese fruits and vegetables sector
www.marketintello.com
Part II. Domestic fruits and vegetables production
1515
Contents Page
Executive Summary 3
Definition of fruits and vegetables sector 4
Global value chain of fruits and vegetables sector 5
SWOT analysis of Vietnamese fruits and vegetables sector 6
Part I. Factors/Motivation promoting Vietnamese fruits and vegetables sector 7-14
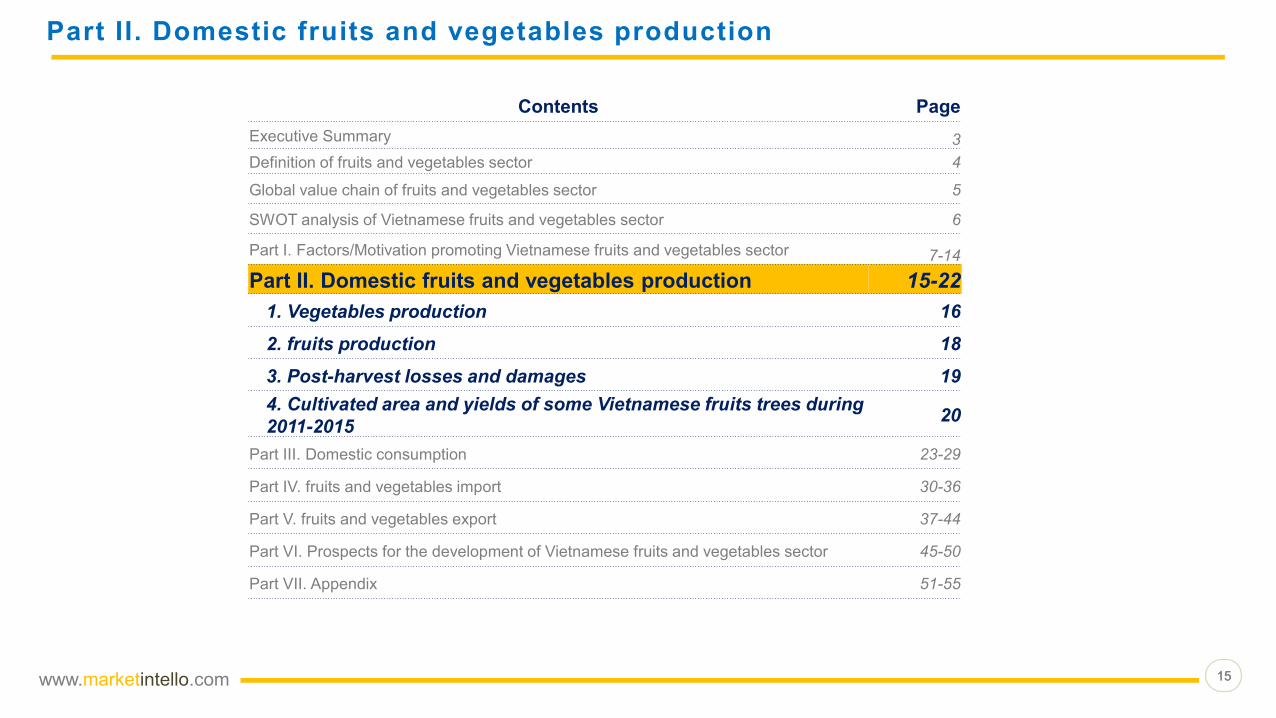
Part II. Domestic fruits and vegetables production 15-22
1. Vegetables production 16
2. fruits production 18
3. Post-harvest losses and damages 19
4. Cultivated area and yields of some Vietnamese fruits trees during
2011-201520
Part III. Domestic consumption 23-29
Part IV. fruits and vegetables import 30-36
Part V. fruits and vegetables export 37-44
Part VI. Prospects for the development of Vietnamese fruits and vegetables sector 45-50
Part VII. Appendix 51-55
www.marketintello.com 1616
Part II. Domestic fruits and vegetables production
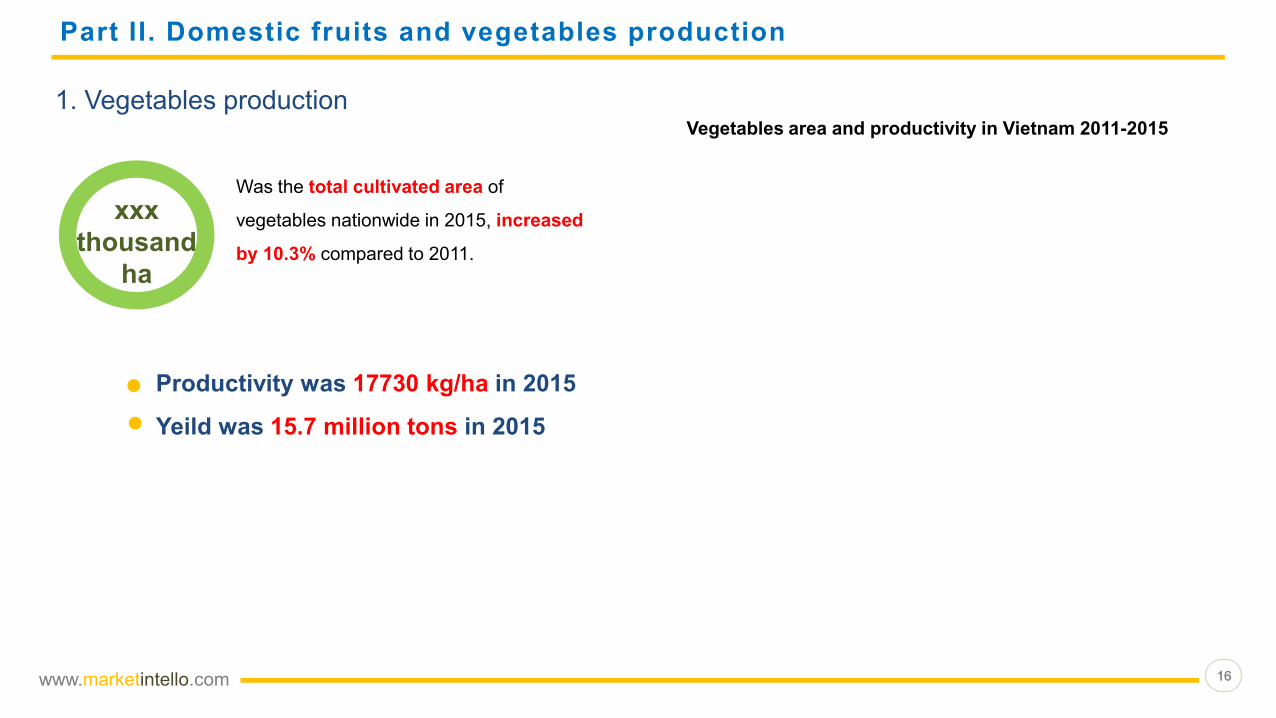
Was the total cultivated area of
vegetables nationwide in 2015, increased
by 10.3% compared to 2011.
1. Vegetables production
Productivity was 17730 kg/ha in 2015
Yeild was 15.7 million tons in 2015
xxx
thousand
ha
Vegetables area and productivity in Vietnam 2011-2015

www.marketintello.com 1717
Part II. Domestic fruits and vegetables production (continued)
1. Vegetables production (continued)
0
50
100
150
200
250
300
Red RiverDelta
NorthernMidland andMountainous
North CentralCoast
CentralCoastal Plain
CentralHighlands
Southeast Mekong Delta
Vegetables area by region in Vietnam 2010-2013
2010 2011 2012 2013
1000 ha
0 10 20 30 40 50 60
Ha Giang
Tay Ninh
Bac Giang
Gia Lai
Tra Vinh
Vinh Long
Hai Duong
Nghe An
Ha Noi
Thai Binh
Thanh Hoa
An Giang
Soc Trang
Tien Giang
Lam Dong
15 provinces had largest vegetables area in Vietnam 2013 (Unit: 1000 ha)
Cuu Long Delta region is the most widely grown
vegetable area in the country (29.5% of the total area in
2013).
Source: MARD

www.marketintello.com 1818
Part II. Domestic fruits and vegetables production (continued)
2. fruits production
Current tendency:
Source: MARD
0 10 20 30 40 50 60 70 80
Nghe An
Tay Ninh
Thai Nguyen
Tra Vinh
Son La
Hai Duong
Dong Thap
Soc Trang
Hau Giang
Ben Tre
Binh Thuan
Vinh Long
Bac Giang
Dong Nai
Tien Giang
15 provinces had largest fruits area in Vietnam 2013 (Unit: 1000 ha)
xxxthousand ha
Was the total cultivated area of fruits trees across
the country in 2015, increased by 6.05%
compared to 2011.
www.marketintello.com 1919
Part II. Domestic fruits and vegetables production (continued)
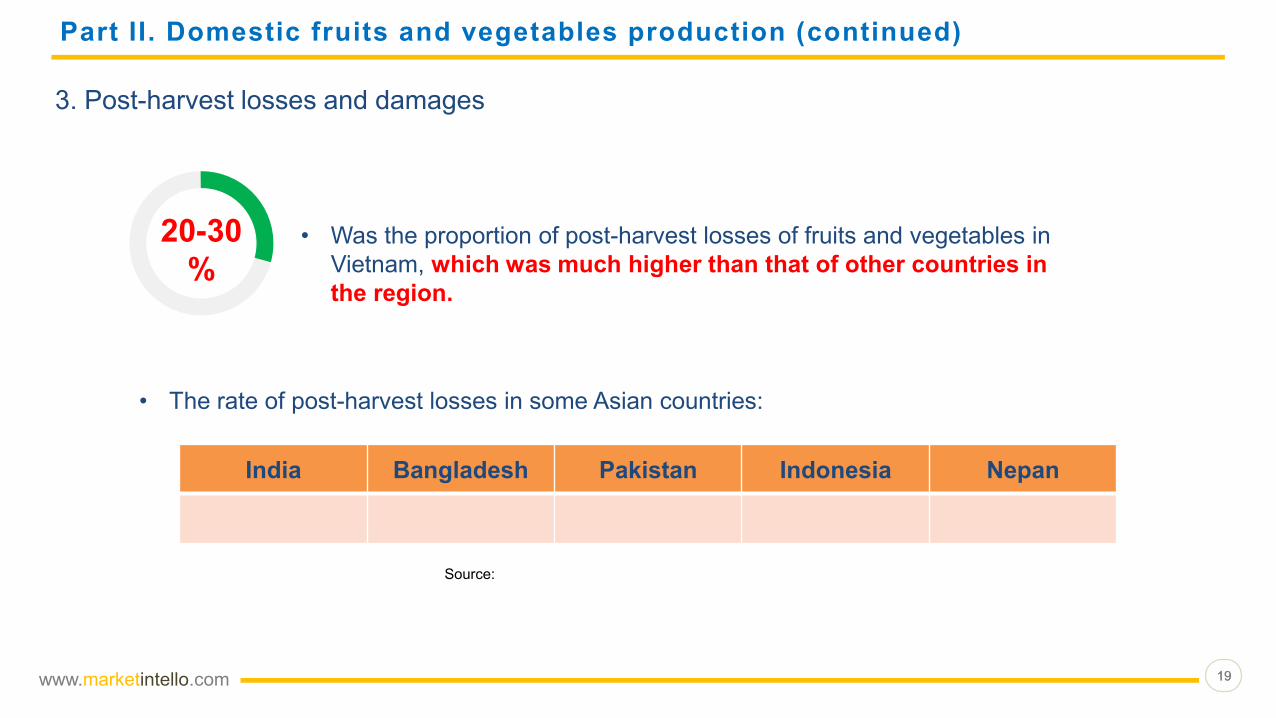
3. Post-harvest losses and damages
20-30
%• Was the proportion of post-harvest losses of fruits and vegetables in
Vietnam, which was much higher than that of other countries in
the region.
• The rate of post-harvest losses in some Asian countries:
India Bangladesh Pakistan Indonesia Nepan
Source:
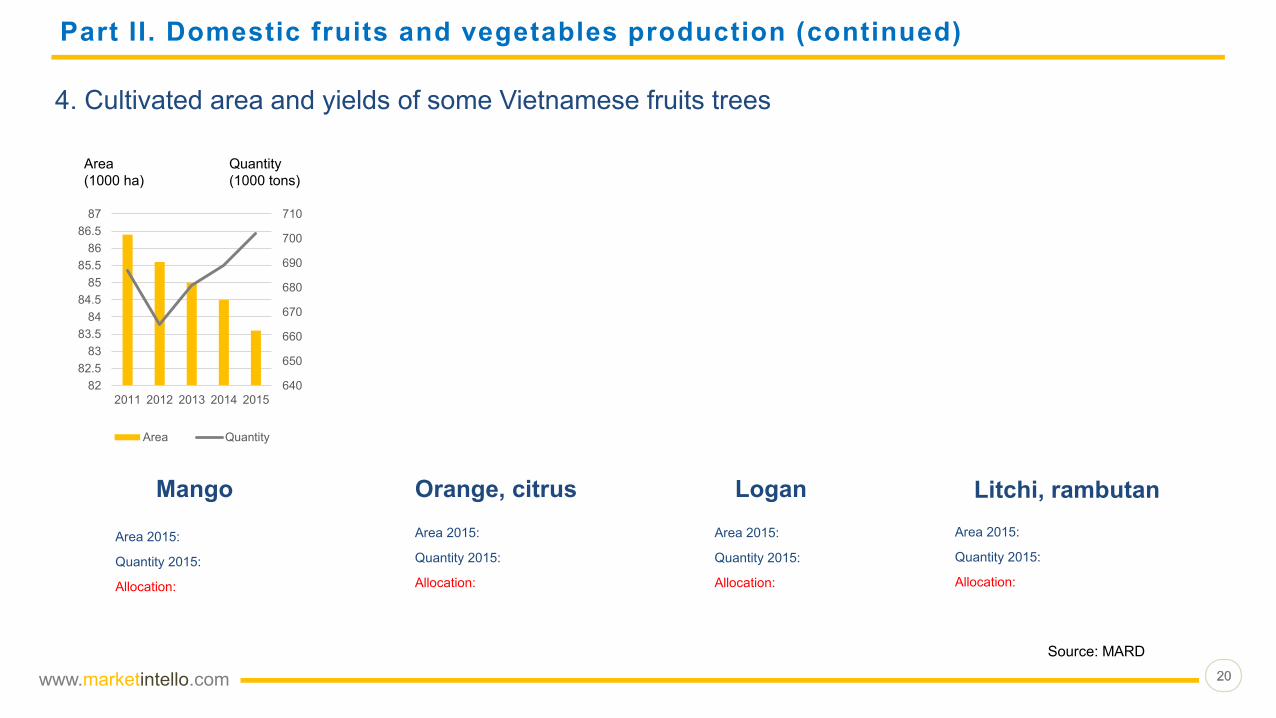
www.marketintello.com 2020
Area 2015:
Quantity 2015:
Allocation:
Mango
Part II. Domestic fruits and vegetables production (continued)
4. Cultivated area and yields of some Vietnamese fruits trees
640
650
660
670
680
690
700
710
82
82.5
83
83.5
84
84.5
85
85.5
86
86.5
87
2011 2012 2013 2014 2015
Area Quantity
Area
(1000 ha)
Quantity
(1000 tons)
Orange, citrus Logan Litchi, rambutan
Source: MARD
Area 2015:
Quantity 2015:
Allocation:
Area 2015:
Quantity 2015:
Allocation:
Area 2015:
Quantity 2015:
Allocation:

www.marketintello.com 2121
Part II. Domestic fruits and vegetables production (continued)
4. Cultivated area and yields of some Vietnamese fruits trees (continued)
Provinces Area (ha) Percentage Yields(ton) Percentage
All country 35.665 100 614.346 100
1. Binh Thuan 23.200 65,1 430.120 70,0
2. Long An 5.916 16,6 78.400 12,8
3. Tien Giang 4.052 11,4 75.190 12,2
Cultivated area and yields of longans in Viet Nam and provinces in 2014
Source: Vinafruits, Binh Thuan DARD, Tien Giang and Long An’s statistic book 2014

www.marketintello.com 2222
Part II. Domestic fruits and vegetables production (continued)
Trees Apr May Jun Jul Aug Sep Oct Nov Dec Jan Feb Mar Apr
Dragon fruits
Mango
Rambutan
Durian
Longan
Trees Apr May Jun Jul Aug Sep Oct Nov Dec Jan Feb Mar Apr
Dragon fruits
Mango
Rambutan
Durian
Longan
* Seasonal schedule of some fruits crops in Mekong Delta
* Seasonal schedule of some fruits crops in South East region
Source: MARDNote: Main seasons
Extra seasons

www.marketintello.com
Part III. Domestic consumption
2323
Contents Page
Executive Summary 3
Definition of fruits and vegetables sector 4
Global value chain of fruits and vegetables sector 5
SWOT analysis of Vietnamese fruits and vegetables sector 6
Part I. Factors/Motivation promoting Vietnamese fruits and vegetables sector 7-14
Part II. Domestic fruits and vegetables production 15-22
Part III. Domestic consumption 23-29
1. Consumption scale in 2014 24
2. Consumption system 25
3. Average expenditure 26
4. Expenditure density 28
5. Vegetable consumption per capita in 2014 29
Part IV. fruits and vegetables import 30-36
Part V. fruits and vegetables export 37-44
Part VI. Prospects for the development of Vietnamese fruits and vegetables sector 45-50
Part VII. Appendix 51-55
www.marketintello.com 2424
Part III. Domestic consumption
Sources: VHLSS 2014, MarketIntello
1. Consumption scale in 2014
Import
Domestic production

www.marketintello.com 2525
Part III. Domestic consumption (continued)
Vegetables in Hanoi was consumed through the
traditional market in 2014.
Source: MarketIntello
xx%
2. Consumption system
Fruits and vegetables was consumed fresh,
unprocessed domestically.xx%
Vegetables consumption via shopping channels in Hanoi 2014

www.marketintello.com 2626
Part III. Domestic consumption (continued)
Was an increase in per capita expenditure per year for fruits and vegetable during the period 2010 –
2014.
x%
0
20
40
60
80
100
2010 2012 2014
Average expenditure of household per month for fruits and vegetables 2010-2014
Vegetable Fruit
Thousand dongs
3. Average expenditure
Sources: VHLSS 2010, 2012, 2014, MarketIntello

www.marketintello.com 2727
Part III. Domestic consumption (continued)
0
20
40
60
80
100
2010 2012 2014 2010 2012 2014
Urban Rural
Expenditure for fruits and vegetables by urban and rural in Vietnam 2010-2014
VegetableFruit
Thousand dongs
3. Average expenditure (continued)
Sources: VHLSS 2010, 2012, 2014, MarketIntello

www.marketintello.com 2828
Part III. Domestic consumption (continued)
The higher income may lead the larger
expenditures on fruits and vegetables
In 2014, urban residents spent around x% for
fruits and y% for vegetables out of the total
expenditure on food.
4. Expenditure density
Fruits and vegetables expenditure by income 2014
Proportion of fruits and vegetables on food expenditure 2014

www.marketintello.com 2929
Part III. Domestic consumption (continued)
5. Vegetable consumption per capita in 2014 (Unit: kg/person/year)
0 10 20 30 40 50 60 70 80
Mekong Delta
Southeast
Central Highlands
North Central Coastal and Central Coastal Plain
Red River Delta
Northern Midland and Mountainous
Vegetables consumption (kg/person/year)
Sources: VHLSS 2014, MarketIntello
05101520253035
Mekong Delta
Southeast
Central Highlands
North Central Coast and Central Coastal Plain
Red River Delta
Northern Midland and Mountainous
fruits consumption (kg/person/year)
In 2014, on average, a Vietnamese person consumed xx kg of vegetables and yy kg of fruits. This figure was far lower
than the average consumption of 100 kg of vegetables per year in Japan.
www.marketintello.com
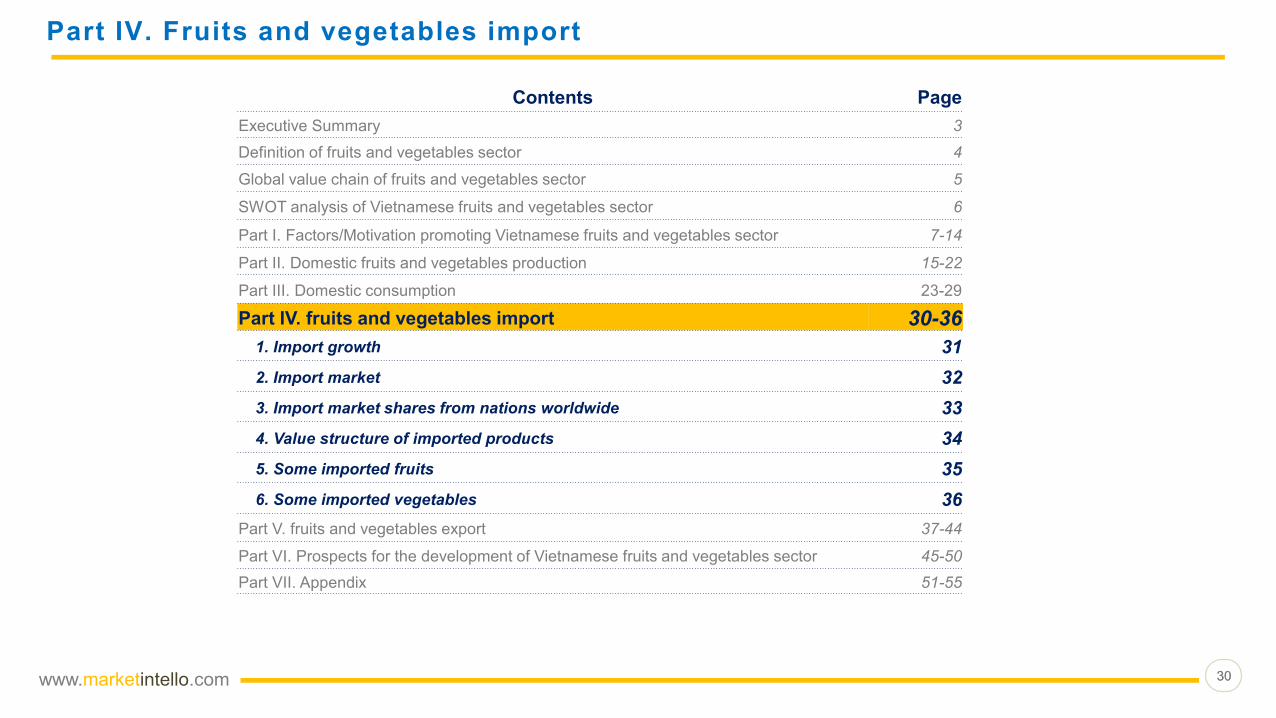
Part IV. Fruits and vegetables import
3030
Contents Page
Executive Summary 3
Definition of fruits and vegetables sector 4
Global value chain of fruits and vegetables sector 5
SWOT analysis of Vietnamese fruits and vegetables sector 6
Part I. Factors/Motivation promoting Vietnamese fruits and vegetables sector 7-14
Part II. Domestic fruits and vegetables production 15-22
Part III. Domestic consumption 23-29
Part IV. fruits and vegetables import 30-36
1. Import growth 31
2. Import market 32
3. Import market shares from nations worldwide 33
4. Value structure of imported products 34
5. Some imported fruits 35
6. Some imported vegetables 36
Part V. fruits and vegetables export 37-44
Part VI. Prospects for the development of Vietnamese fruits and vegetables sector 45-50
Part VII. Appendix 51-55

www.marketintello.com 3131
Part IV. Fruits and vegetables import
1. Import growth
Was the growth rate of average annual imports in
Vietnam during the period 2011-2015.
Source: MARD
0
100
200
300
400
500
600
700
2011 2012 2013 2014 2015 First 6 monthsof 2016
Value of fruits and vegetables import in Vietnam 2011-2015 and the first 6 months of 2016
million USD
xx%
x
million USD Was fruits and vegetables imports of Vietnam in
2015, increased by 19.3% compared to 2014.
351.2 million USD Was fruits and vegetable export value of
Vietnam's during the first 6 months of 2016, x
times higher than in the same period in 2015.

www.marketintello.com 3232
Part IV. Fruits and vegetables import (continued)
2. Import market
In 2015, the value of fruits and vegetables that Vietnam imported from Thailand reached xxx million USD. Therefore,
Thailand did pass China (yyy million USD) to be Vietnam’s major source of fruits and vegetables import.
Source: MARD
0
50
100
150
200
250
Thailand China USA Myanmar Australia
The import turnover of Vietnam from main markets in 2015
million USD

www.marketintello.com
USA
-
Z%
Myanmar
+
T
%
3333
Changes in market shares
compared to 2011
Thailand
+
X %
China
-
Y
%
Changes in market shares
compared to 2011
Changes in market shares
compared to 2011
Changes in market shares
compared to 2011
3. Import market shares from nations worldwide
Part IV. Fruits and vegetables import (continued)
Trends: Increasing consumption fruits originated from Thailand, reducing consumption ones from
Chinese.
Source: UN comtrade and MarketIntello

www.marketintello.com 3434
Part IV. Fruits and vegetables import (continued)
4. Vietnam’s fruits and vegetable imported products by commodities
Was the value of fruits and vegetables
imported into Vietnam fresh, frozen or
unprocessed.
92 %
Vietnam’s fruits and vegetable imported
products by commodities in 2015
Vegetables
Fruit
Vegetables preparations
Fruit preparations

www.marketintello.com 3535
Part IV. Fruits and vegetables import (continued)
5. Some imported fruits to Vietnam in 2014
Rank Products [1]Turnover(milli
on USD)
Growth rate
2014-2013 (%)
CAGR 2010-
2014 (%)Main source of import
1
Avocado, guava,
mango and
mangosteen
2 Fresh grape
3 Fresh apple
4 Macadamia
5 Mandarin
6Apricot, cherries and
peach
7 Fresh/dried orange
[1]: Only items with import turnover >=10 million USD were counted Source: MarketIntello

www.marketintello.com 3636
Part IV. Fruits and vegetables import (continued)
6. Some imported vegetables to Vietnam in 2014
Dried beans was imported into Vietnam from Myanmar80.8 %
Rank Products [2]Turnover(milli
on USD)
Growth rate
2014-2013 (%)
CAGR 2010-
2014 (%)Main source of import
1 Dried beans
2 Garlics
3 Shallots
4 Potatoes
5 Carrots and turnips
[2]: Only items with import turnover >=10 million USD were counted
Source: MarketIntello
Garlics, onions, shallots, potatoes, carrots and turnips were imported into Vietnam mainly from
Chinese
www.marketintello.com
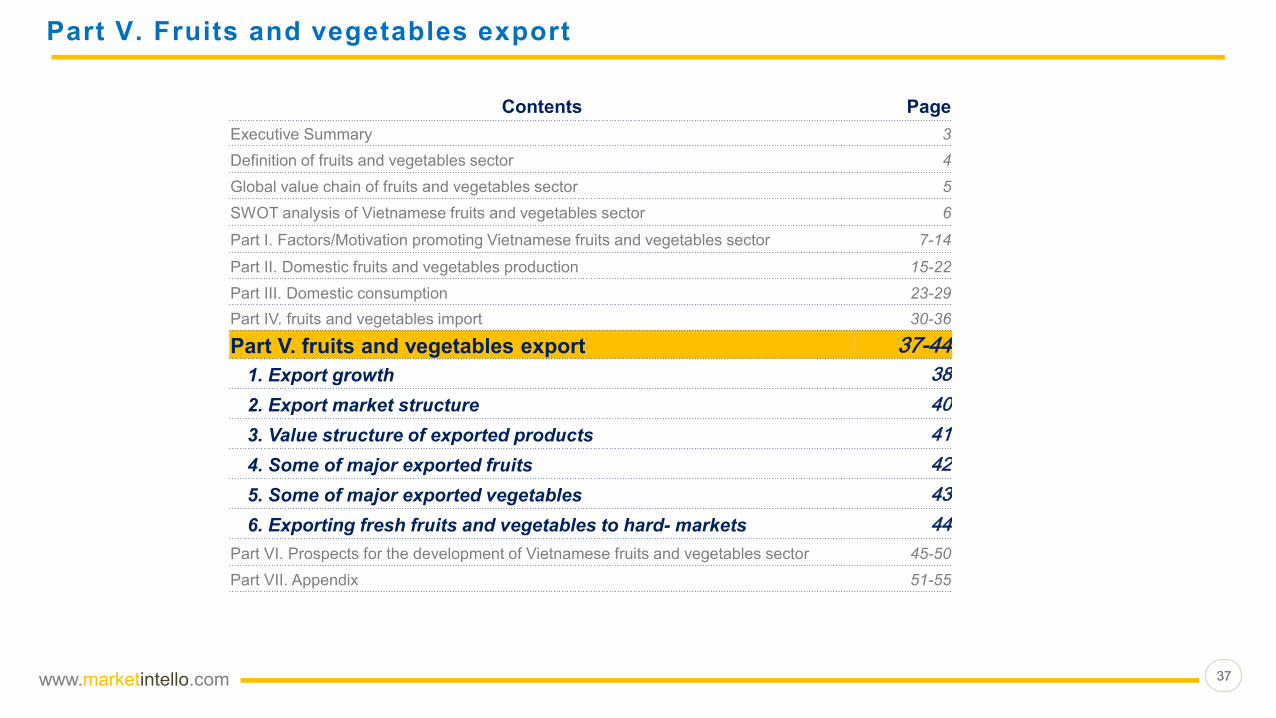
Part V. Fruits and vegetables export
3737
Contents Page
Executive Summary 3
Definition of fruits and vegetables sector 4
Global value chain of fruits and vegetables sector 5
SWOT analysis of Vietnamese fruits and vegetables sector 6
Part I. Factors/Motivation promoting Vietnamese fruits and vegetables sector 7-14
Part II. Domestic fruits and vegetables production 15-22
Part III. Domestic consumption 23-29
Part IV. fruits and vegetables import 30-36
Part V. fruits and vegetables export 37-44
1. Export growth 38
2. Export market structure 40
3. Value structure of exported products 41
4. Some of major exported fruits 42
5. Some of major exported vegetables 43
6. Exporting fresh fruits and vegetables to hard- markets 44
Part VI. Prospects for the development of Vietnamese fruits and vegetables sector 45-50
Part VII. Appendix 51-55

www.marketintello.com 3838
Part V. Fruits and vegetables export
1. Export growth
0
400
800
1,200
1,600
2,000
2010 2011 2012 2013 2014 2015 First 6months of
2016
Value of fruits and vegetables export of Vietnam 2010-2015 and the first 6 months of 2016
Million USD
Sources: MARD & MarketIntello
%
billion USD
The average growth rate in 2010-2015.
Was fruits and vegetables export turnover of
Vietnam in 2015, increased 23.7% compared
to 2014.
billion USD
Was fruits and vegetables export value of
Vietnam in the first 6 months of 2016, 1.4
times higher than that in the same period in
2015.

www.marketintello.com 3939
Part V. Fruits and vegetables export (continued)
1. Export growth (continued)
0
5
10
15
20
25
30
35
Phones orcomponents
Textileproducts
Computers,electronicproducts
Footwear Machines,equipment,instrumentsand other
spare parts
Wood andwood
products
Seafood Means oftransportand spare
parts
Crude oil Cameras,camcorders
Rice Fruit andvegetable
Export turnover of some commodity groups in Vietnam 2015
Biliion USD
It was forecasted that in 2016, fruits and vegetable exports would reach $ 2.5 billion USD and
potentially surpass turnover exports of rice.

www.marketintello.com 4040
Part V. Fruits and vegetables export (continued)
2. Export market structure
Was the growth rate of exports to the Chinese
market in 2015, accounting for over 2/3 of total
exports turnover.
Sources: ITC & MarketIntello
Was Vietnam’s market share in China,
increased by nearly x percentage points
compared to 2011.
China remained the largest market of fruits and vegetables export of Vietnam
x %
y%

www.marketintello.com 4141
Part V. Fruits and vegetables export (continued)
3. Vietnam’s fruits and vegetable exported products by commodities
Fruit
Vegetables
Vegetable preparations
Fruit prepairations
Sources: UN comtrade & MarketIntello
Vietnam’s fruits and vegetables export
value in fresh, frozen or unprocessed form.85 %
Vietnam’s fruits and vegetable exported
products by commodities in 2015

www.marketintello.com 4242
Part V. Fruits and vegetables export (continued)
4. Some of major exported fruits
Vietnam’s major exported fruits in 2014
Nguồn: Bộ NN&PTNT và MarketIntello
Was the total export value of products such as
dragon fruits, lychee, longan and rambutan in
2014, increased by 28% compared to 2013.
Rank Products
Turnover
2014
(million USD)
Growth rate
2013-2014
(%)
CAGR 2010-
2014 (%)Main market
1
Dragon fruits,
lychee, longan
and rambutan
2 Coconut
3
Fresh guava,
mango and
mangosteen
4 Macadamia nuts
5
Bananas, including
plantains, fresh or
dried.
323
million
USD
www.marketintello.com 4343
Part V. Fruits and vegetables export (continued)
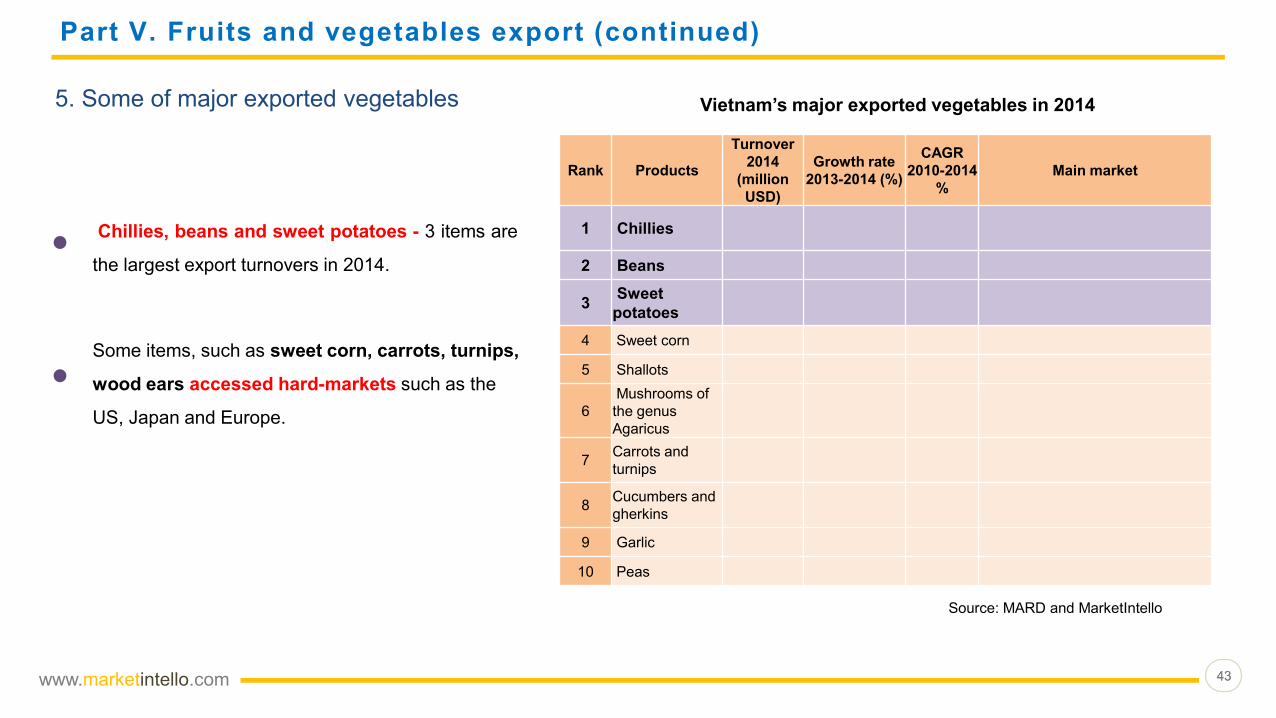
5. Some of major exported vegetables Vietnam’s major exported vegetables in 2014
Source: MARD and MarketIntello
Rank Products
Turnover
2014
(million
USD)
Growth rate
2013-2014 (%)
CAGR
2010-2014
%
Main market
1 Chillies
2 Beans
3Sweet
potatoes
4 Sweet corn
5 Shallots
6
Mushrooms of
the genus
Agaricus
7Carrots and
turnips
8Cucumbers and
gherkins
9 Garlic
10 Peas
Chillies, beans and sweet potatoes - 3 items are
the largest export turnovers in 2014.
Some items, such as sweet corn, carrots, turnips,
wood ears accessed hard-markets such as the
US, Japan and Europe.
www.marketintello.com 4444
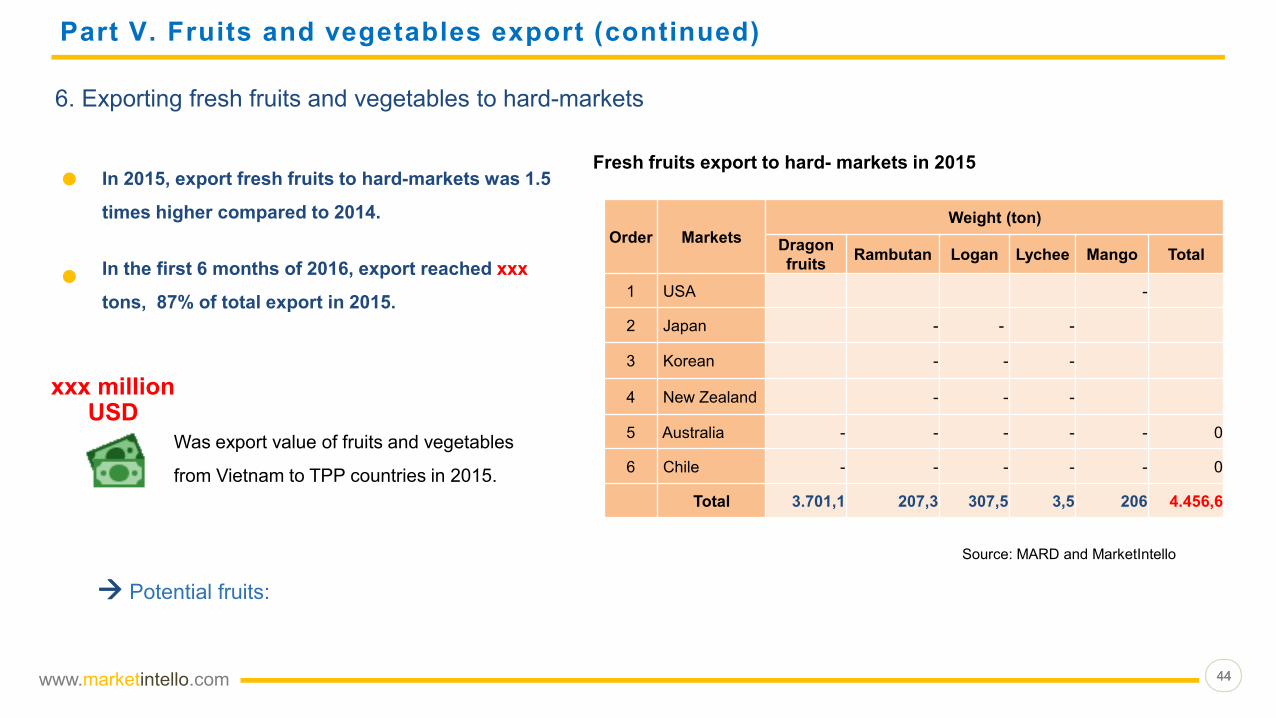
Part V. Fruits and vegetables export (continued)
6. Exporting fresh fruits and vegetables to hard-markets
In 2015, export fresh fruits to hard-markets was 1.5
times higher compared to 2014.
Was export value of fruits and vegetables
from Vietnam to TPP countries in 2015.
Order Markets
Weight (ton)
Dragon
fruitsRambutan Logan Lychee Mango Total
1 USA -
2 Japan - - -
3 Korean - - -
4 New Zealand - - -
5 Australia - - - - - 0
6 Chile - - - - - 0
Total 3.701,1 207,3 307,5 3,5 206 4.456,6
Source: MARD and MarketIntello
xxx million USD
Fresh fruits export to hard- markets in 2015
In the first 6 months of 2016, export reached xxx
tons, 87% of total export in 2015.
Potential fruits:

www.marketintello.com
Part VI. Prospects for the development of Vietnamese fruits and vegetables sector
4545
Contents Page
Executive Summary 3
Definition of fruits and vegetables sector 4
Global value chain of fruits and vegetables sector 5
SWOT analysis of Vietnamese fruits and vegetables sector 6
Part I. Factors/Motivation promoting Vietnamese fruits and vegetables sector 7-14
Part II. Domestic fruits and vegetables production 15-22
Part III. Domestic consumption 23-29
Part IV. fruits and vegetables import 30-36
Part V. fruits and vegetables export 37-44
Part VI. Prospects for the development of Vietnamese fruits
and vegetables sector45-50
1. Domestic potential 46
2. Export potential 49
Part VII. Appendix 49-53

www.marketintello.com 4646
Part VI. Prospects for the development of Vietnamese fruits and vegetables sector
1. Domestic potential
1.1. Production potential
• Cultivated area, productivity and yield
• Trend
• Fresh fruits and vegetables production

www.marketintello.com 4747
Part VI. Prospects for the development of Vietnamese fruits and vegetables sector
1. Domestic potential (continued)
- Spendings on fruits and vegetables
- Consumers’ demand
- Systems of supermarkets and selling safe vegetables
1.2. Consumption potential

www.marketintello.com 4848
Part VI. Prospects for the development of Vietnamese fruits and vegetables sector
1. Domestic potential (continued)
- Free trade agreements
- Trend
- The products mainly imported from Thailand are:…
- Vegetable import from Australia
- Some imported temperate fruits were consumed greatly in the country:…
1.3. Import potential

www.marketintello.com 4949
Part VI . Prospects for the development of Vietnamese frui ts and vegetables sector (continued)
2. Export potential
- Until now, Vietnam's fruits and vegetables have been exported to over 40 countries and territories, including 10 main
export markets:
- Vietnam's fruits and vegetable exports to TPP countries and other hard-markets remain relatively small, accounting
from x% -y% in each market.
- Some other potential markets such as:…
2.1. Export markets
www.marketintello.com 5050
Part VI . Prospects for the development of Vietnamese frui ts and vegetables sector (continued)
2. Export potential (continued)
2.2. Export potential to hard- markets
- America
- Japan
- Australia
…

www.marketintello.com
Part VII. Appendix
5151
Contents Page
Executive Summary 3
Definition of fruits and vegetables sector 4
Global value chain of fruits and vegetables sector 5
SWOT analysis of Vietnamese fruits and vegetables sector 6
Part I. Factors/Motivation promoting Vietnamese fruits and vegetables sector 7-14
Part II. Domestic fruits and vegetables production 15-22
Part III. Domestic consumption 23-29
Part IV. fruits and vegetables import 30-36
Part V. fruits and vegetables export 37-44
Part VI. Prospects for the development of Vietnamese fruits and vegetables sector 45-50
Part VII. Appendix 51-55
Appendix 1. fruits and vegetables market of some countries 52
Appendix 2. Top 5 reputative fruits and vegetables exporters in
Vietnam53
Appendix 3. A number of international regulations of exported
agricultural products54
Appendix 4. Research methods 55

www.marketintello.com 5252
Part VII. Appendix
Appendix 1. fruits and vegetables market of some countries [3]
China Japan America
Korea The Netherlands
Import turnover in 2015: 7 million USD
CAGR 2011-2015: 17 %
Growth tendency:
Main source of import: Thai Lan (17,5%), Chile
(14,1%), the USA (11,1%)
Imports from Vietnam: 12,8%
[3]: These were countries with which Vietnam had the largest export value in 2015
Source: UN comtrade and MarketIntello

www.marketintello.com 5353
Part VII. Appendix (continued)
Appendix 2. Top 5 reputative fruits and vegetables exporters in Vietnam[4]
Export turnover: 76 million USD
Export markets: China, Korea, Japan, Malaysia…
FOCOCEV
LUONG QUOI
BAC HONG LAM
NONG SAN NGHE AN
Export turnover: 12.9 million USD
Export markets: EU, USA, Middle-East, Africa, South America
Export turnover: 10.9 million USD
Export markets: China
Export turnover: 10.5 million USD
Export markets: China, Mexico, Bangladesh, Argentina
ANTESCOExport turnover: 10 million USD
Export markets: EU, America, Australia, Asia[4]: Ranked by MOIT in 2014
www.marketintello.com 5454
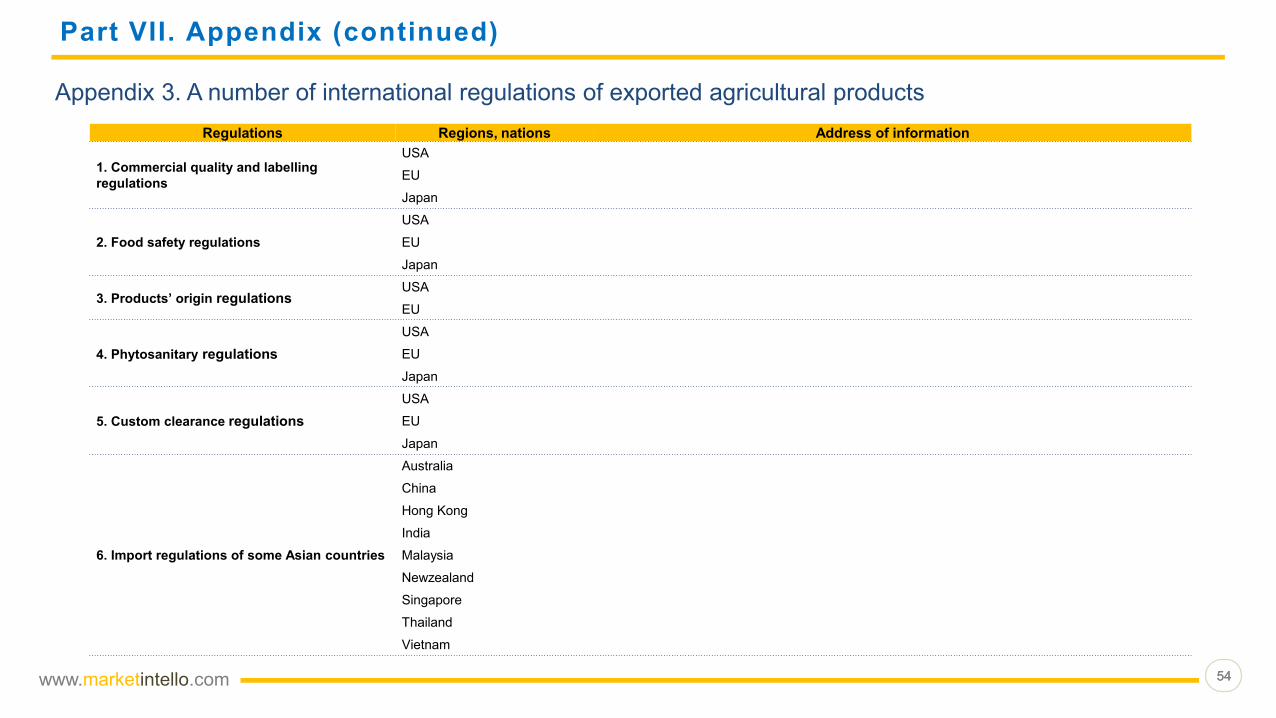
Part VII. Appendix (continued)
Appendix 3. A number of international regulations of exported agricultural products
Regulations Regions, nations Address of information
1. Commercial quality and labelling
regulations
USA
EU
Japan
2. Food safety regulations
USA
EU
Japan
3. Products’ origin regulationsUSA
EU
4. Phytosanitary regulations
USA
EU
Japan
5. Custom clearance regulations
USA
EU
Japan
6. Import regulations of some Asian countries
Australia
China
Hong Kong
India
Malaysia
Newzealand
Singapore
Thailand
Vietnam
www.marketintello.com 5555
Part VII. Appendix (continued)
[email protected] (+84)04-39351419
For more information, please contact: MarketIntello Vietnam
www.marketintello.com www.facebook.com/marketintello
Room 305 – 306, 12 Trang Thi, Hoan Kiem, Ha
Noi
The data used in this report was collected and aggregated from various official sources. International trade data was collected from the merchandise
trade statistics of the United Nations (UN Comtrade) and the International Trade Centre (ITC). The vegetables and fruits are based on product code
specified in the list of harmonized system code, version 2007 (HS 2007), including chapters 07, 08 and 20, except cassava and cashew. Data on the
production of agricultural products was taken from the Statistical Yearbook published by the General Statistics Office and databases of the Ministry of
Agriculture and Rural Development. Vegetable consumption was calculated from Census Household Living Standards (CHLS) performed by GSO. To
compare the market and export of Vietnam’s agricultural products, research used competitiveness assessment methods established by United Nations
Industrial Development Organization (UNIDO). In the case of information from official sources were not enough, unofficial sources would be used instead
and the content was specified in the report.
Appendix 4. Research methods
@Copyright: Report was conducted by MarketIntello Viet Nam, any reproduction and circulation not consented by MarketIntello Viet Nam is pirated.
(+84)04-39351418