frp bypass bridge-final report 2 - iowa department of ...€¦ · temporary bypass applications are...
TRANSCRIPT

Technical Report Documentation Page
1. Report No. 2. Government Accession No. 3. Recipient’s Catalog No.
4. Title and Subtitle
Testing and Evaluation of the Iowa DOT FRP Temporary Bypass Bridge
5. Report Date
March 2008
6. Performing Organization Code
7. Author(s) 8. Performing Organization Report No.
Terry J. Wipf, Brent M. Phares, Travis K. Hosteng, Doug L. Wood, James S. Nelson
9. Performing Organization Name and Address 10. Work Unit No. (TRAIS)
Center for Transportation Research and Education
Iowa State University
2901 South Loop Drive, Suite 3100
Ames, IA 50010-8634
11. Contract or Grant No.
12. Sponsoring Organization Name and Address 13. Type of Report and Period Covered
Iowa Department of Transportation
800 Lincoln Way
Ames, IA 50010
14. Sponsoring Agency Code
15. Supplementary Notes
Funding provided through the Innovative Bridge Research and Construction Program within the Federal Highway Administration
16. Abstract
In the last decade, the use of fiber reinforced polymer (FRP) composites technology has emerged as an option in structural engineering and has shown its potential for structural applications in bridges. FRP composite materials are appealing in that they are highly resistant to corrosion, have a low weight, and have a high tensile strength. This report summarizes a project funded through the Federal Highway Administration’s Innovative Bridge Research and Construction program that investigate the applicability and effectiveness of using FRP composites in bridge construction. A temporary FRP bypass bridge was designed and developed to replace existing steel temporary bridge with the Iowa Department of Transportation. The FRP replacement system is approximately 35 percent lighter than the steel alternative, potentially easier to transport, and the few components that may deteriorate are readily replaceable. This new FRP deck bridge for temporary bypass applications consists of two 39 ft-10 in. by 13 ft-6 ½ in. deck panels, measuring approximately 3 ft in thickness, that are spliced with steel plates along the centerline of the roadway to form a bridge that spans 39 ft-0 in. with a roadway width of 24 ft-0 in. (from face of one barrier rail to that of opposite side barrier rail) for two 12 ft-0 in. traffic lanes. Brief summaries of the design, fabrication and evaluation of the FRP deck bridge for temporary bypass applications are provided. The report presents structural field performance results for the demonstration project and provides correlation of the performance with design parameters.
17. Key Words 18. Distribution Statement
FRP, FRP Bridge, Fiber Reinforced Polymer , Bridge Test, FRP Slab Bridge No restrictions.
19. Security Classification (of this report)
20. Security Classification (of this page)
21. No. of Pages 22. Price
Unclassified. Unclassified. 23 NA


Testing and Evaluation of the Iowa DOT FRP Temporary Bypass Bridge
Co-Principal Investigator T.J. Wipf
Director, Bridge Engineering Center
B.M. Phares Associate Director, Center for Transportation Research and Education
Associate Director, Bridge Engineering Center
Investigators T.K. Hosteng
Research Engineer, Bridge Engineering Center
D.L. Wood Manager, Engineering Laboratories, Department of Civil, Construction, and Environmental
Engineering
Authors T.J. Wipf, B.M. Phares, T.K. Hosteng, D.L. Wood, J.S. Nelson
Prepared by: Bridge Engineering Center
Center for Transportation Research and Education Iowa State University
2901 South Loop Drive, Suite 3100 Ames, IA 50010-8632 Phone: 515-294-8103 Fax: 515-294-0467
www.ctre.iastate.edu
Prepare for: Iowa Department of Transportation
Office of Bridges and Structures 800 Lincoln Way Ames, IA 50010
Final Report March 2008

TABLE OF CONTENTS
INTRODUCTION ..............................................................................................1 RESEARCH OBJECTIVE ..................................................................................2 DESIGN AND FABRICATION ...........................................................................2 INSTALLATION ...............................................................................................6 RESEARCH METHODOLOGY ..........................................................................8 RESULTS ........................................................................................................8 Initial Load Testing ............................................................................8 Loaded Truck Testing ........................................................................11 In-place Performance ........................................................................20 CONCLUSION .................................................................................................23 REFERENCES ..................................................................................................23

1
INTRODUCTION For years the Iowa Department of Transportation (Iowa DOT) has used small, mobile steel bridges for use as temporary structures for various applications. These bridges are comprised of W24x68 steel beams and a 5 ½” thick steel grid deck. A bridge span consists of three segments longitudinally bolted together to form a single unit. The total superstructure weight of a single span is 54,000 pounds and the bridges were designed for an AASHTO H20-44 loading (see Fig. 1). These steel temporary bridge spans were constructed and first implemented in 1971. Since 1971, there have been twenty uses of one or more of the spans. However, due to the deterioration of the steel temporary detour bridge sections, the Iowa DOT, through support of the Federal Highway Administration’s (FHWA) Innovative Bridge Research and Construction (IBRC) program opted to investigate the applicability of a composite bridge as a new temporary bridge system. The replacement system, a Fiber Reinforced Polymer (FRP) composite bridge, is approximately 35 percent lighter than the steel alternative, potentially easier to transport, and the few components that may deteriorate are readily replaceable (namely the connection hardware and guardrail) (see Fig. 2). This new composite structure consists of two sections, each with a guardrail attached to one side, built-in lifting lugs, and a replaceable wearing surface.
Figure 1. Current steel bypass bridge utilized by the Iowa DOT.
Figure 2. Proposed bypass bridge, without guardrail or other hardware.

2
RESEARCH OBJECTIVES
The objectives of this work include: first, to validate through field tests the design assumptions and structural adequacy of this structure for the designated purposes; second, evaluate the load distribution characteristics of the bridge components and system as a whole; third, through physical load testing determine both the short and long-term durability of the structure and evaluate the performance of the structure under service loads. In addition, from the overall results it was desired to provide information regarding the viability of this type of structure for this and other possible applications. DESIGN AND FABRICATION
Based on the temporary bridge design guidelines provided by the Iowa DOT, a design was developed and presented to the Iowa DOT by Hardcore Composites, Inc who contracted HNTB Corporation for design verification. Final design calculations were completed by Hardcore Composites, and checked by engineers at the Iowa DOT and Iowa State University. The final design included two 13.5 ft x 39 ft – 10 in. deck panels measuring approximately 3 ft in thickness connected together to provide two lanes of traffic. See Fig. 3 for design sketches of the panels and related details. Each panel is composed of seven layers, referred to as plies, of QM6408 FRP fabric on the bottom and top and three plies on each vertical side. These layers of FRP are what provide the resistance to bending forces. Encased by the exterior plies, the core of each panel is composed of 600 8 in. x 16 in. x 36 in. foam bottles individually wrapped with one ply of TV3400 FRP fabric. As a whole, these bottles provide the shear resistance for the structure. Once all the bottles were installed and wrapped with FRP plies, vinyl ester resin was infused into the structure through a process called Vacuum Assisted Resin Transfer Molding (VARTM). Figures 4 thru 7 illustrate various stages of fabrication of the FRP panels. This process should result in all components of the system having full penetration of resin.
At calculated locations, eight foam bottles in each panel were replaced with bottles outfitted with the lifting hardware shown in Fig. 8. The lifting hardware consists of an anchored steel plate with a threaded hole that accepts bolt-on D-rings. Connection of the two panels is accomplished by means of 1 in. thick by 16 in. wide steel plates running the length of the bridge on the top and bottom of the bridge centerline. The top and bottom plates are then connected with threaded rods which pass through the FRP panels. The original design for attachment of the guardrail consists of a base plate attached to each guardrail post and a plate on the bottom of the deck; again the two plates are connected with threaded rod through the FRP panels. The guardrail system for the temporary composite bridge is composed of all steel components including: a w-shape rail post, steel tube rails, and a curb constructed of steel angle and gusset plates. Figure 3c illustrates a cross-section view of the guardrail system. The wearing surface of the deck panels consists of a 3/8 in. layer of abrasive epoxy covering the entire deck surface except the areas occupied by connection plates (see Fig. 7 and 9).

3
a. Elevation view
b. Plan view
c. Guardrail and center plate connection details Figure 3. Iowa DOT FRP Bypass Bridge

4
Figure 4. Installation of bottom FRP plies
Figure 5. Installation of FRP wrapped foam bottles

5
Figure 6. Example of Vacuum Assisted Resin Transfer Molding (VARTM) process
Figure 7. Guardrail and centerline attachment locations
Figure 8. Threaded insert for installation of lifting lugs

6
Figure 9. Epoxy wearing surface
INSTALLATION
Both of the Iowa DOT bypass bridge deck panels were delivered on a single flatbed semi trailer stacked one on top of the other as shown in Fig. 10. Load testing of the deck panels was initially intended to take place in one of ISU’s structural engineering testing laboratories. However, due to tight tolerances between the width of the deck panels and the width of the overhead door, testing was moved to an outdoor area on Iowa DOT property.
Figure 10. Delivery of Iowa DOT composite bridge.
Temporary abutments, composed of two 30 ft long W-shape steel beams, were placed on the ground and braced for temporary construction and testing of the bridge components. The bridge deck panels were set in place with a 65-ton hydraulic truck crane, see Figs. 11 and 12. Each of the deck panels weighed approximately 17,000 lbs each and were placed on the temporary abutments with 10 in. of bearing and a 1 in. gap between the deck panels, as specified in the plans. Once the panels were properly situated, a steel fabricator made measurements for the center connection plates and the guardrail attachment plates. Figure 13 shows the bridge with the guardrail installed.

7
Figure 11. Unloading of individual deck panels.
Figure 12. Temporary abutments for Iowa DOT composite bridge.
Figure 13. FRP Bypass Bridge with guardrail installed.
8
RESEARCH METHODOLOGY
In an attempt to validate the design assumptions/calculations and to obtain as much information about the load distribution and serviceability characteristics of this structure, controlled outdoor ‘laboratory’ tests were conducted in addition to a full-scale load test both with the structure on temporary supports as well as once the structure was in service. For the first outdoor laboratory test, the structure was evaluated by loading an individual panel with a single point load (using a hydraulic actuator). The point load was moved to several locations on the structure so that, through the use of superposition, the effects of a loaded truck could be calculated. Once this test was completed, the panels were connected and loaded using a fully loaded tandem axle dump truck provided by the Iowa DOT. Once in service, the structure was then field tested with a fully-loaded truck to re-evaluate both the design assumptions and the results obtained from the laboratory style testing.
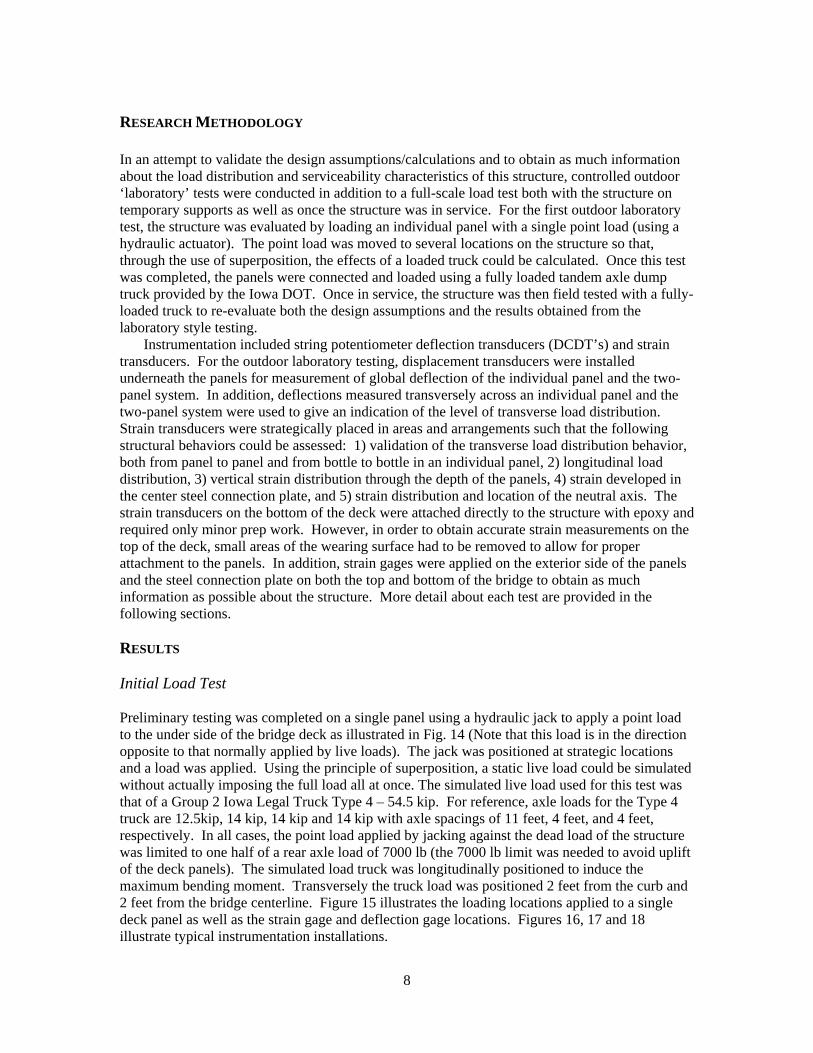
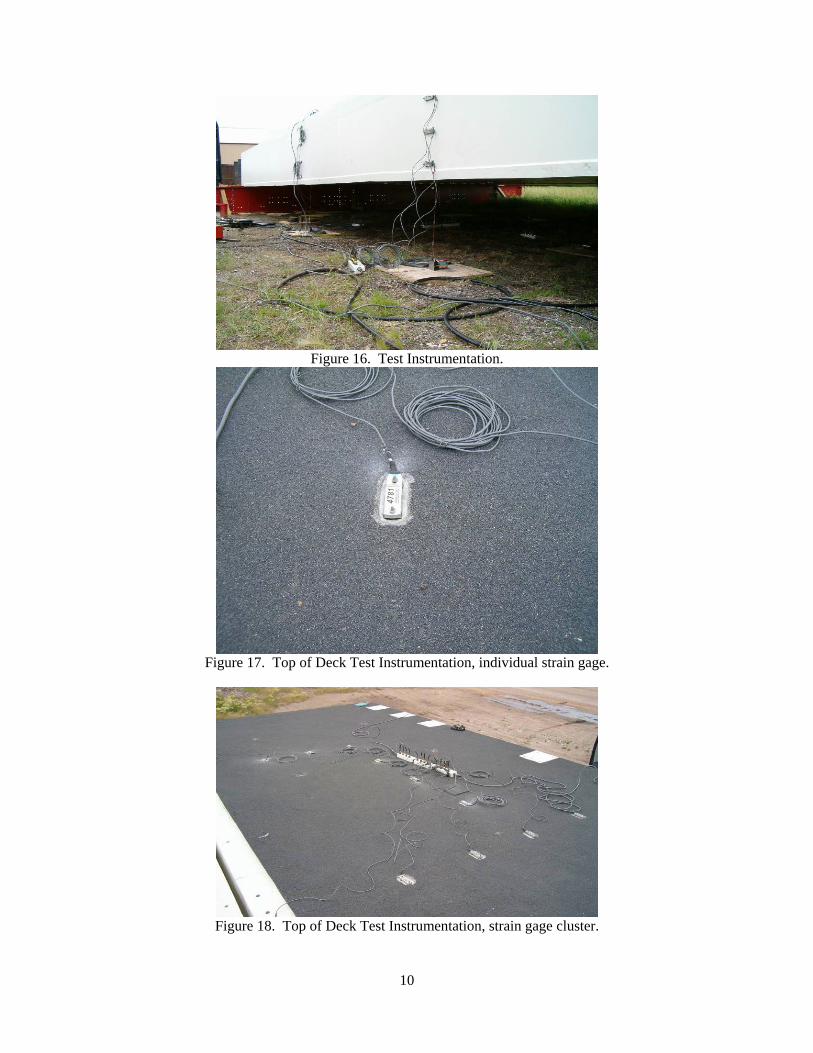
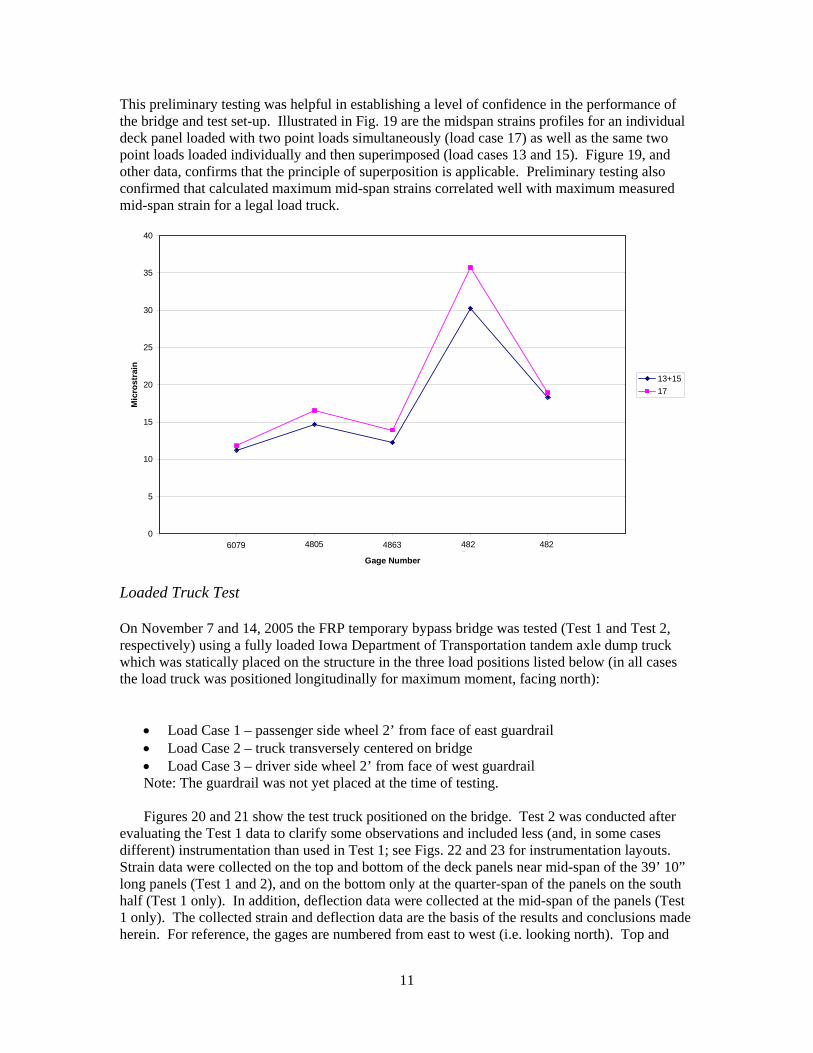
Instrumentation included string potentiometer deflection transducers (DCDT’s) and strain transducers. For the outdoor laboratory testing, displacement transducers were installed underneath the panels for measurement of global deflection of the individual panel and the two-panel system. In addition, deflections measured transversely across an individual panel and the two-panel system were used to give an indication of the level of transverse load distribution. Strain transducers were strategically placed in areas and arrangements such that the following structural behaviors could be assessed: 1) validation of the transverse load distribution behavior, both from panel to panel and from bottle to bottle in an individual panel, 2) longitudinal load distribution, 3) vertical strain distribution through the depth of the panels, 4) strain developed in the center steel connection plate, and 5) strain distribution and location of the neutral axis. The strain transducers on the bottom of the deck were attached directly to the structure with epoxy and required only minor prep work. However, in order to obtain accurate strain measurements on the top of the deck, small areas of the wearing surface had to be removed to allow for proper attachment to the panels. In addition, strain gages were applied on the exterior side of the panels and the steel connection plate on both the top and bottom of the bridge to obtain as much information as possible about the structure. More detail about each test are provided in the following sections. RESULTS Initial Load Test Preliminary testing was completed on a single panel using a hydraulic jack to apply a point load to the under side of the bridge deck as illustrated in Fig. 14 (Note that this load is in the direction opposite to that normally applied by live loads). The jack was positioned at strategic locations and a load was applied. Using the principle of superposition, a static live load could be simulated without actually imposing the full load all at once. The simulated live load used for this test was that of a Group 2 Iowa Legal Truck Type 4 – 54.5 kip. For reference, axle loads for the Type 4 truck are 12.5kip, 14 kip, 14 kip and 14 kip with axle spacings of 11 feet, 4 feet, and 4 feet, respectively. In all cases, the point load applied by jacking against the dead load of the structure was limited to one half of a rear axle load of 7000 lb (the 7000 lb limit was needed to avoid uplift of the deck panels). The simulated load truck was longitudinally positioned to induce the maximum bending moment. Transversely the truck load was positioned 2 feet from the curb and 2 feet from the bridge centerline. Figure 15 illustrates the loading locations applied to a single deck panel as well as the strain gage and deflection gage locations. Figures 16, 17 and 18 illustrate typical instrumentation installations.

9
Figure 14. Hydraulic Jack.
39'-10"
19'-11"
13'-7"
CLStrain Gage DCDT Foam Bottle 10" Bearing
Rail AttachmentLocation
Center PlateAttachment Location
7'-1"
8"
1'-4"
10'
2'
6'
2'
6'
Truck Position 1
Truck Position 2
1'-7"
Edge of Curb
6'-3" 11' 4' 4'
Legal Type 4
Top/BtmTopBtm N
LC1
LC2
LC3
LC4
LC5 LC9 LC13
LC14LC10LC6
LC7
LC8
LC11
LC12
LC15
LC16
LC17
LC17
4826
4827
4863
4805
6079
Figure 15. Legal Truck Type 4 Load Positioning.
10
Figure 16. Test Instrumentation.
Figure 17. Top of Deck Test Instrumentation, individual strain gage.
Figure 18. Top of Deck Test Instrumentation, strain gage cluster.
11
This preliminary testing was helpful in establishing a level of confidence in the performance of the bridge and test set-up. Illustrated in Fig. 19 are the midspan strains profiles for an individual deck panel loaded with two point loads simultaneously (load case 17) as well as the same two point loads loaded individually and then superimposed (load cases 13 and 15). Figure 19, and other data, confirms that the principle of superposition is applicable. Preliminary testing also confirmed that calculated maximum mid-span strains correlated well with maximum measured mid-span strain for a legal load truck.
0
5
10
15
20
25
30
35
40
0 1 2 3 4 5 6
Gage Number
Mic
rost
rain
13+15
17
6079 4826
4827
4805 4863
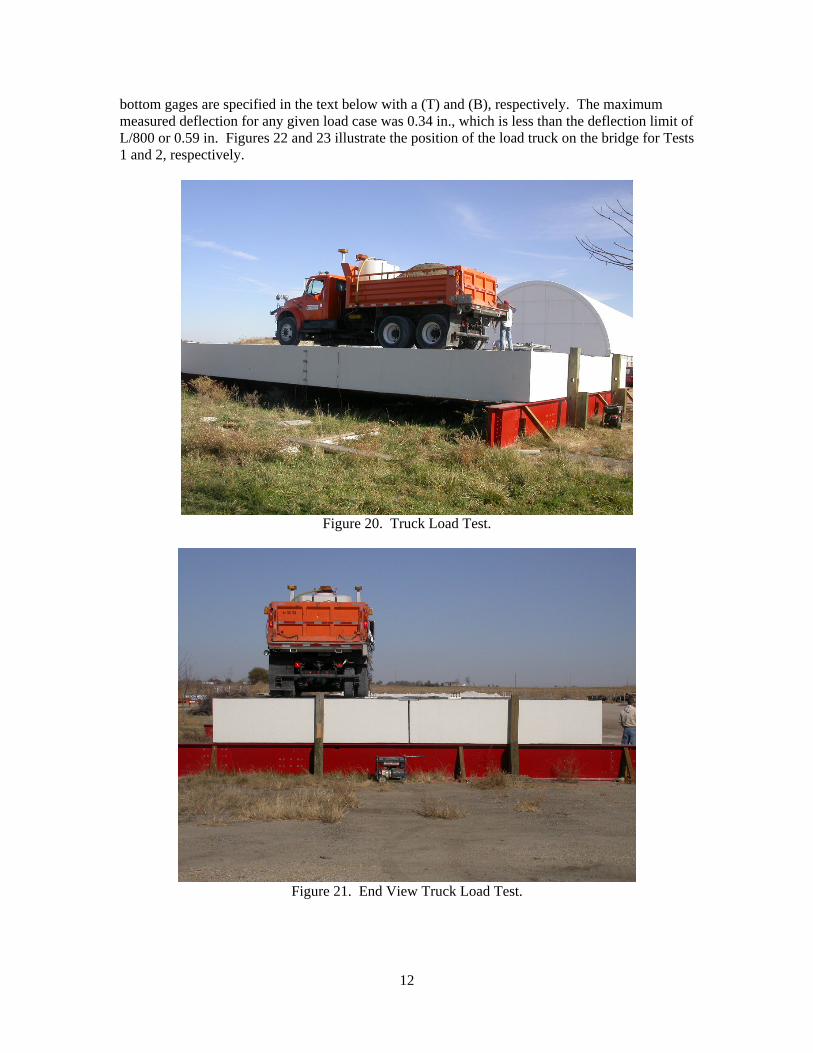
Loaded Truck Test On November 7 and 14, 2005 the FRP temporary bypass bridge was tested (Test 1 and Test 2, respectively) using a fully loaded Iowa Department of Transportation tandem axle dump truck which was statically placed on the structure in the three load positions listed below (in all cases the load truck was positioned longitudinally for maximum moment, facing north):
Load Case 1 – passenger side wheel 2’ from face of east guardrail Load Case 2 – truck transversely centered on bridge Load Case 3 – driver side wheel 2’ from face of west guardrail Note: The guardrail was not yet placed at the time of testing. Figures 20 and 21 show the test truck positioned on the bridge. Test 2 was conducted after
evaluating the Test 1 data to clarify some observations and included less (and, in some cases different) instrumentation than used in Test 1; see Figs. 22 and 23 for instrumentation layouts. Strain data were collected on the top and bottom of the deck panels near mid-span of the 39’ 10” long panels (Test 1 and 2), and on the bottom only at the quarter-span of the panels on the south half (Test 1 only). In addition, deflection data were collected at the mid-span of the panels (Test 1 only). The collected strain and deflection data are the basis of the results and conclusions made herein. For reference, the gages are numbered from east to west (i.e. looking north). Top and
12
bottom gages are specified in the text below with a (T) and (B), respectively. The maximum measured deflection for any given load case was 0.34 in., which is less than the deflection limit of L/800 or 0.59 in. Figures 22 and 23 illustrate the position of the load truck on the bridge for Tests 1 and 2, respectively.
Figure 20. Truck Load Test.
Figure 21. End View Truck Load Test.

13
1'-4"CL Foam Bottle (Typ)10" Bearing
8"
13'-7"
7'-1"
13'-7"
39'-10"19'-11"Rail Attacment
Location
N
1'-8"
7'-1"
DCDTStrain Gage
BtmTopTop/Btm
19'-11"39'-10"
3'
6'
2'
6'
6'
1'-8"
10'9'-3"
1'-8"
3'-8"
10'-7"
17'-6"
LC1
LC2
LC3
Back Truck on From North
10"2"Typ.
10'
SG1
SG2
SG3
SG4
SG5
SG6
SG14SG7
SG8
SG9
SG10
SG11
SG12
SG13
SG15 SG16 SG17
SG18SG19SG20
1234
(Typ.)
D1
D2
D3D4
D5
D6
Plan View
Figure 22. Instrumentation layout, Test 1, FRP Deck Bridge (vehicle facing north).

14
10'
2"Typ.
39'-10"Rail Attacment
Location
4321
(Typ.)
Back Truck on From North
17'-6"
6'
1'-8"
6'
Top/BtmStrain Gage
BtmTop
DCDT
2'
1'-8"
10'-7"6'
3'-8"
19'-11"
10"3'
9'-3"
Foam Bottle (Typ)1'-4"LC
SG4
SG3
SG2
7'-1"
13'-7"
10" Bearing
N
10'
13'-7"
7'-1"
8"SG1
SG6SG5
Plan View
CL
1'2'
LC3
LC2
LC1
Figure 23. Instrumentation layout, Test 2, FRP Deck Bridge (vehicle facing north).
15
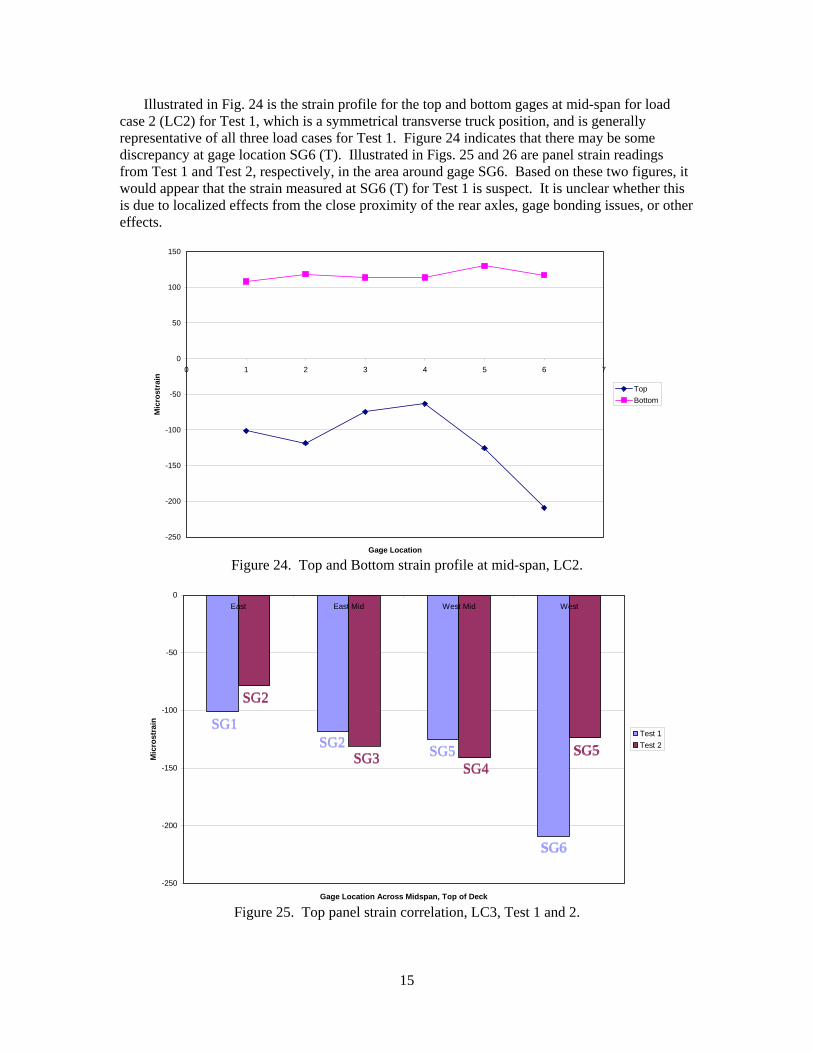
Illustrated in Fig. 24 is the strain profile for the top and bottom gages at mid-span for load case 2 (LC2) for Test 1, which is a symmetrical transverse truck position, and is generally representative of all three load cases for Test 1. Figure 24 indicates that there may be some discrepancy at gage location SG6 (T). Illustrated in Figs. 25 and 26 are panel strain readings from Test 1 and Test 2, respectively, in the area around gage SG6. Based on these two figures, it would appear that the strain measured at SG6 (T) for Test 1 is suspect. It is unclear whether this is due to localized effects from the close proximity of the rear axles, gage bonding issues, or other effects.
-250
-200
-150
-100
-50
0
50
100
150
0 1 2 3 4 5 6 7
Gage Location
Mic
rost
rain
Top
Bottom
Figure 24. Top and Bottom strain profile at mid-span, LC2.
-250
-200
-150
-100
-50
0
East East Mid West Mid West
Gage Location Across Midspan, Top of Deck
Mic
rost
rain
Test 1
Test 2
Figure 25. Top panel strain correlation, LC3, Test 1 and 2.
SG1 SG2
SG5
SG6
SG2
SG3 SG4
SG5
SG1 SG2
SG5
SG2
SG3 SG4
SG6
SG5

16
-400
-350
-300
-250
-200
-150
-100
-50
01 2 3
Load Case
Mic
rost
rain
Test2,SG6
Test2,SG5
Test1,SG6
Figure 26. Strain comparison near SG6, Tests 1 and 2.
Figures 27 and 28 illustrate the transverse distribution of strain at mid-span for a single lane
loaded and two lanes loaded, respectively (similar transverse distribution was calculated at quarter-span but is not shown here). The two lanes loaded case was approximated by superposition of LC 1 and 3. As shown, it is evident that the distribution of strain is relatively symmetric about the longitudinal centerline of the bridge, which suggests adequate load transfer from panel to panel by the steel connection plates. Note that SG7 strain data are not shown in Fig. 27 or 28; these data represent the strain on the steel connection plates. Generally, the strains measured in the steel connection plates were smaller in magnitude than those in the FRP, possibly the result of slip occurring between the connection plate and the panels as well as other factors.
Transverse Distribution
0.0
20.0
40.0
60.0
80.0
100.0
120.0
140.0
160.0
180.0
200.0
0 1 2 3 4 5 6 7
Gage Location (E-W)
Mic
ros
tra
in
LC1
LC2
LC3
LC1 LC2 LC3
Figure 27. Transverse load distribution at mid-span for all three load cases.

17
Transverse Distribution (two lanes loaded)
0
50
100
150
200
250
300
0 1 2 3 4 5 6 7
Gage Location (E to W)
Mic
ros
trai
n
LC1 LC3
Figure 28. Transverse load distribution at mid-span, two lanes loaded.
Presented in Table 1 are mid-span strain values for LC 1 – 3 for Test 1. Maximum tensile
strains recorded in the FRP for each load case were: LC1 1 – 171, LC2 – 130 microstrain, and LC3 – 179 microstrain. Assuming a modulus of elasticity of 4,000 ksi, these maximum recorded strains are equivalent to a stress of approximately 0.68 ksi, 0.52 ksi, and 0.72 ksi, respectively. For the two lanes loaded case, the maximum strain value is approximately 254 microstrain, which is equivalent to a stress of 1.01 ksi. Maximum recorded strains in the steel for each load case were: LC1 – 51 microstrain, LC2 – 8 microstrain, and LC3 – 27 microstrain. Assuming a modulus of elasticity of 29,000 ksi, these maximum strains are equivalent to a stress of approximately 1.48 ksi, 0.23 ksi, and 0.78 ksi, respectively.
Table 1. Top and Bottom Strain Values for LC 1 – 3 at mid-span (microstrain) for Test 1.
LC1 SG1 SG2 SG3 SG7
(steel) SG4 SG5 SG6
Top -182 -180 -86 -51 -80 -76 -122
Bottom 166 171 138 24 77 78 63
LC2 SG1 SG2 SG3 SG7
(steel) SG4 SG5 SG6
Top -101 -118 -75 -8 -63 -125 -209
Bottom 108 118 114 -7 114 130 117
LC3 SG1 SG2 SG3 SG7
(steel) SG4 SG5 SG6
Top -58 -70 -40 27 -92 -175 -354
Bottom 61 74 82 -25 121 176 179

18
For testing, three vertical cross-sections were instrumented on both the East and West side of the bridge (1ft south of centerline, centerline, and 2 ft north of centerline, see Fig. 29), with four gages placed throughout each cross-section. Figures 30 and 31 illustrate the vertical strain distribution at each location for the East and West sides, respectively, for LC2 which is representative of all load cases. Figures 30 and 31suggest that there are differences in the neutral axis location from cross section to cross section on the sides of the panels; additionally, Figure 24 also illustrates that the neutral axis may vary across the width of the panel. The reasons for the variability in neutral axis from cross section to cross section are unknown.
Figure 32 illustrates the strain profile for gages SG2, SG18, SG19 and SG20, on the bottom of the deck for all three load cases. It is evident from Fig. 32, that transverse distribution of load from bottle to bottle is adequate and relatively constant regardless of load position.
39'-10"
Strain Gage 10'19'-11"
3'
2'1'
Figure 29. Instrumentation on East/West side of deck panel.
East Panel Edge Strain Distribution, LC2
-150
-100
-50
0
50
100
0 1 2 3 4 5
Gage Location (1 Top - 4 Bottom)
Mic
rost
rain 1ft S. CL
2ft N. CL
CL
LC1 LC2 LC3
Figure 30. Side panel strain distribution, East side, LC2.

19
West Panel Edge Strain Distribution, LC2
-150
-100
-50
0
50
100
0 1 2 3 4 5
Gage Location (Top - Bottom)
Mic
rost
rain
1ft S. CL
2ft N. CL
CL
LC1 LC2 LC3
Figure 31. Side panel strain distribution, West side, LC2.
0
20
40
60
80
100
120
140
160
180
1 2 3 4
Gage
Mic
rost
rain
LC1
LC2
LC3
SG2 SG18
SG19 SG20
Figure 32. Transverse strain distribution from bottle to bottle.

20
In Place Performance In the spring of 2007 the FRP temporary bypass bridge was installed on a construction project in Northeast Iowa to allow traffic to flow around a mainline bridge structure that was being replaced. Timber abutments and backwalls were constructed as specified in the plan documents. However, after placement of the bridge panels it was found that maintaining the specified gap between the abutment backwall and the end of the panels was difficult given the flexibility of the backwall and the pressure from the compacted backfill. After placement of the backfill and the approach roadway sections, the backwalls were found to be partially in contact with the end of the bridge panels raising concern that this could possibly cause premature deterioration of the edge of the panels. Traffic was allowed across the structure and the panel ends were periodically monitored for any signs of wear or damage.
For several reasons, traffic over the FRP bridge was restricted to one lane by the use of portable jersey barriers, as shown in Fig. 33. Shortly after traffic was allowed on the bridge, Iowa DOT inspectors noticed that the transverse edge at the end of one of the panels was showing signs of significant damage at the approach end of the bridge, see Fig. 34. Investigation of the area found that the contact between the backwall and the panel was not necessarily the problem. Rather, the elevation of the top of the backwall was approximately an inch lower than the elevation of the top of the panel, this left the leading edge of the panel exposed to the full force of oncoming traffic loads. Due to time constraints and the need to keep traffic uninterrupted, steel plates (shown in Fig. 33) were use to span from the approach roadway section to the bridge deck across the abutment joint in an attempt to stop the progression of the deck deterioration. At the same time, traffic was reduced from two lanes to one lane across the bridge.
Shortly after the steel plates were installed, inspection found that the top layer of FRP and the wearing surface had debonded on one of the deck panels over approximately half of the panel surface area (the other panel showed no signs of delamination or other deterioration) (see Fig. 35). At apparently the same time, it appeared that water and debris had entered through holes in the top layer of FRP near the lifting lug locations and was thought to be potentially deteriorating the foam bottles that comprised the core of the panels. For comparison purposes, a load test was also conducted at the time of the inspection. The load test involved statically loading the structure with a fully loaded tandem axle dump truck, weighing 52, 260 lbs, moving across the bridge at a crawl speed. For this testing the test truck was centered on the bridge as shown in Fig. 36. Figure 36 also illustrates the location of instrumentation which included only BDI strain gages. Maximum strains measured at midspan were approximately 155 microstrain, which are less than those measured during the laboratory style testing completed prior to installation of the bridge. Illustrated in Fig. 37 is the transverse strain distribution at midspan across both deck panels. Two features are evident from the data shown in Fig. 37: 1) the south panel, with visually identified delaminated top FRP layers, appears to be carrying less load than the northern panel as would be expected, 2) despite the delaminated top FRP layers of the south panel, transverse load distribution at midspan is not markedly different than that measured during the laboratory style tests done previously. However, as a result of the deterioration of the south panel, the bridge was immediately closed, removed, and replaced.

21
Figure 33. Jersey barrier and steel plate on FRP Bypass Bridge.
Figure 34. Damage at edge of deck panel at approach abutment.
Figure 35. Delamination of top layer of FRP at a lifting lug location.

22
39'-10"
Rail AttacmentLocation
6'
Strain Gage
1'-8"
Btm
1'-8"
10'-7"
LC1
19'-11"
Foam Bottle (Typ)
9'-3"
Plan View
1'-4"CL
13'-7"
7'-1"
10" Bearing
N
10'
13'-7"
7'-1"
8"SG1
SG2
SG3
SG4
SG8
SG7
SG6
SG5
3'-4"
3'-4"
3'-4"
3'-4"
3'-4"
3'-4"
1'-9"
1'-9"
Figure 36. Instrumentation for on site load test, 8/15/07.
0
20
40
60
80
100
120
140
160
180
0 1 2 3 4 5 6 7 8 9
Gage
Mic
rost
rain
SG1 SG2 SG3 SG4 SG5 SG6 SG7 SG8
Figure 37. Transverse strain distribution at midspan, on site load test, 8/15/07.

23
CONCLUSIONS With their current fleet of temporary bypass bridge structures nearing the end of their service life and showing signs of deterioration, the Iowa DOT, through the assistance of the IBRC program, wished to investigate the feasibility of replacing the current steel structures with a FRP composite structure. The replacement structure is constructed of FRP plies, or sheets, wrapped around a core composed of hundreds of individually wrapped Styrofoam bottles. The entire structure is then infused with resin. The complete bridge is composed of two sections; each section measures 13.5 ft x 39 ft – 10 in. and is approximately 3 ft thick. These two sections are connected together to provide two lanes of traffic. The entire bridge can be disassembled and loaded on to a single tractor trailer for transportation and can be hoisted with a small truck crane.
Prior to in service use, load testing was conducted on the structure at an off site location. Static load tests were conducted with a fully loaded tandem axle load truck weighing approximately 44,500 lbs. Measured strains and deflections from preliminary load tests indicated that the structure exhibited sufficient stiffness and load distribution characteristics. Maximum deflections recorded during testing were 0.34 in. which is less than the specified maximum L/800 of 0.59 in. Maximum tensile strains recorded in the FRP for each load case were: LC1 1 – 171, LC2 – 130 microstrain, and LC3 – 179 microstrain. Assuming a modulus of elasticity of 4,000 ksi, these maximum recorded strains are equivalent to a stress of approximately 0.68 ksi, 0.52 ksi, and 0.72 ksi, respectively. For the two lanes loaded case the maximum strain value is approximately 254 microstrain, which is equivalent to a stress of 1.01 ksi. Maximum recorded strains in the steel connection plate for each load case were: LC1 – 51 microstrain, LC2 – 8 microstrain, and LC3 – 27 microstrain. Assuming a modulus of elasticity of 29,000 ksi, these maximum strains are equivalent to a stress of approximately 1.48 ksi, 0.23 ksi, and 0.78 ksi, respectively.
After initial inspection and testing, the structure was installed at a site in northeast Iowa. Difficulties arose immediately during construction of the abutment backwall after placement of the bridge deck panels on the abutments. Compaction of the abutment backfill resulted in the abutment backwalls being in contact or close contact with the ends of the deck panels. Construction was allowed to proceed and following placement of the approach sections, the bridge was open to traffic. Not long after being opened to traffic, inspection revealed that the ends of the bridge deck panels were under distress due to differences in elevation of the approach slab and the edge of the deck panels and possibly other factors. To keep the detour route open, and the construction from possible delays, large steel plates were installed across the abutment joints in an attempt to alleviate the distress to the ends of the deck panels. Some time after installation of the steel plate, a routine inspection revealed a large area of apparent delamination in the upper layer of one of the deck panels. Further inspection revealed that moisture had infiltrated the deck panel and was beginning to result in deterioration of the styrofoam bottles and that the top layers of FRP were in fact delaminated.
A brief load test at the time of this inspection resulted in measured tensile strains at midspan that were similar to with those measured prior to installation. Although these test results indicated that the bridge showed no signs of reduced stiffness and was adequately distributing the loads, the structure was immediately removed. REFERENCES AASHTO. 1996. Standard Specifications for Highway Bridges, Sixteenth Edition. Washington, DC: American Association of State Highway and Transportation Officials. AASHTO LRFD. 1998. LRFD Bridge Design Specifications. Washington, DC: American Association of State Highway and Transportation Officials.