frostburg state university trends in undergraduate ... · accounting 137 146 131 112 128 business...
TRANSCRIPT
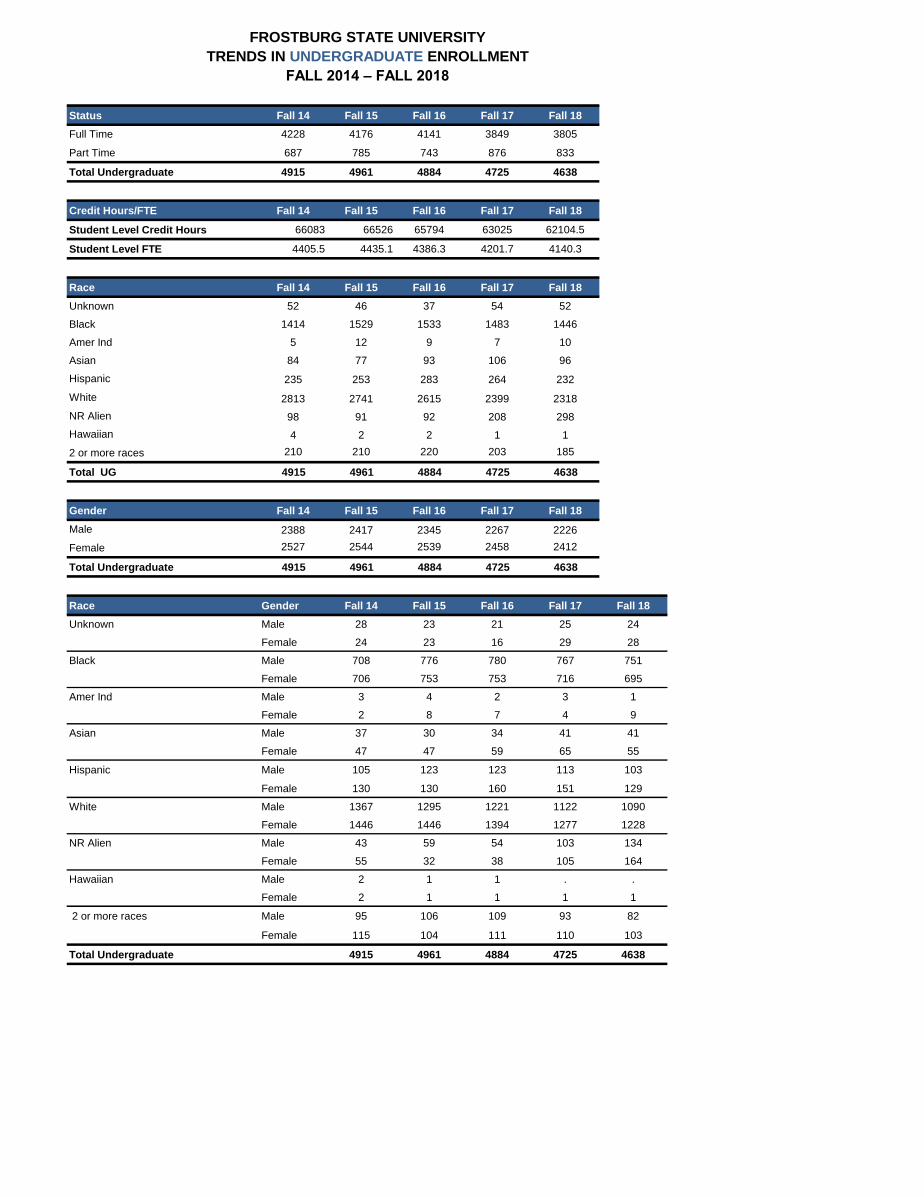
Status Fall 14 Fall 15 Fall 16 Fall 17 Fall 18
Full Time 4228 4176 4141 3849 3805
Part Time 687 785 743 876 833
Total Undergraduate 4915 4961 4884 4725 4638
Credit Hours/FTE Fall 14 Fall 15 Fall 16 Fall 17 Fall 18
Student Level Credit Hours 66083 66526 65794 63025 62104.5
Student Level FTE 4405.5 4435.1 4386.3 4201.7 4140.3
Race Fall 14 Fall 15 Fall 16 Fall 17 Fall 18
Unknown 52 46 37 54 52
Black 1414 1529 1533 1483 1446
Amer Ind 5 12 9 7 10
Asian 84 77 93 106 96
Hispanic 235 253 283 264 232
White 2813 2741 2615 2399 2318
NR Alien 98 91 92 208 298
Hawaiian 4 2 2 1 1
2 or more races 210 210 220 203 185
Total UG 4915 4961 4884 4725 4638
Gender Fall 14 Fall 15 Fall 16 Fall 17 Fall 18
Male 2388 2417 2345 2267 2226
Female 2527 2544 2539 2458 2412
Total Undergraduate 4915 4961 4884 4725 4638
Race Gender Fall 14 Fall 15 Fall 16 Fall 17 Fall 18
Unknown Male 28 23 21 25 24
Female 24 23 16 29 28
Black Male 708 776 780 767 751
Female 706 753 753 716 695
Amer Ind Male 3 4 2 3 1
Female 2 8 7 4 9
Asian Male 37 30 34 41 41
Female 47 47 59 65 55
Hispanic Male 105 123 123 113 103
Female 130 130 160 151 129
White Male 1367 1295 1221 1122 1090
Female 1446 1446 1394 1277 1228
NR Alien Male 43 59 54 103 134
Female 55 32 38 105 164
Hawaiian Male 2 1 1 . .
Female 2 1 1 1 1
2 or more races Male 95 106 109 93 82
Female 115 104 111 110 103
Total Undergraduate 4915 4961 4884 4725 4638
FROSTBURG STATE UNIVERSITY
TRENDS IN UNDERGRADUATE ENROLLMENT
FALL 2014 – FALL 2018

Geographic Area Fall 14 Fall 15 Fall 16 Fall 17 Fall 18
Out of State 407 384 389 510 603
Maryland 4508 4577 4495 4215 4035
Total Undergraduate 4915 4961 4884 4725 4638
Registration Type Fall 14 Fall 15 Fall 16 Fall 17 Fall 18
Concur. HS Reg. 44 35 24 37 20
Continuing 3232 3320 3417 3368 3293
1st-time Student 958 933 831 777 737
Re-Admit 63 68 57 56 73
Transfer 570 560 514 448 472
UG 2nd Degree 48 45 41 39 43
Total Undergraduate 4915 4961 4884 4725 4638
Off Campus Site Fall 14 Fall 15 Fall 16 Fall 17 Fall 18
Catonsville 22 19 13 0 0
Hagerstown 188 163 148 126 135
Arundel Mills 18 18 25 27 27
Garrett CC . 8 10 4 0
Cecil CC . 6 6 8 17
Online Program 375 457 446 470 483
Total Undergrad 603 671 648 635 662
Residence Hall Fall 14 Fall 15 Fall 16 Fall 17 Fall 18
Allen Hall 76 70 74 73 73
Annapolis Hall 167 161 131 . .
Cambridge Hall 130 133 123 152 146
Cumberland Hall 227 228 192 138 112
Diehl Hall 82 72 62 73 79
Frederick Hall 311 298 281 281 273
Frost Hall 70 61 47 48 53
Gray Hall 75 76 71 76 64
Simpson Hall 84 85 82 77 79
Sowers Hall 80 82 79 77 77
Westminster Hall 313 290 265 275 256
Total Undergrad 1615 1556 1407 1270 1212
Student Level Fall 14 Fall 15 Fall 16 Fall 17 Fall 18
Freshman 1424 1392 1309 1129 1061
Sophomore 980 1085 1005 995 921
Junior 1166 1178 1224 1175 1164
Senior 1221 1212 1250 1212 1231
Other U 124 94 96 214 261
Total Undergrad 4915 4961 4884 4725 4638
FROSTBURG STATE UNIVERSITY
TRENDS IN UNDERGRADUATE ENROLLMENT
FALL 2014 – FALL 2018

Primary Major Fall 14 Fall 15 Fall 16 Fall 17 Fall 18
COLLEGE OF BUSINESS
Accounting 137 146 131 112 128
Business Administration 528 472 496 483 451
Economics 41 37 42 43 68
Total COB 706 655 669 638 647
COLLEGE OF EDUCATION
Athletic Training 92 107 74 80 76
Adventure Sports . 7 9 5 4
Early Child./Elementary Ed. 211 179 189 188 203
Elementary Educ. 81 56 44 39 38
Elementary/Mid School Dual Cert. 17 53 45 45 48
Exercise & Sport Science 182 191 184 145 141
Physical Educ. 65 57 54 63 50
Recreation & Parks Mgmt 69 72 71 71 77
Total COE 717 722 670 636 637
COLLEGE OF LIBERAL ARTS & SCIENCES
Art&Design BFA 24 23 26 19 20
Biology 224 242 193 147 119
Chemistry 68 48 45 36 17
Communication Studies 40 45 47 48 35
Computer Info Systems 26 34 29 27 30
Computer Science 186 180 194 169 163
Earth Science 28 35 33 35 30
Engineering 184 182 174 161 166
English 84 76 76 63 62
Environmental Analysis 22 19 16 22 22
Ethnobotany 18 17 23 10 14
Geography 35 31 31 22 27
History 47 39 36 32 25
Health Science . 50 130 167 174
Information Techonology 66 82 94 84 84
International Studies 26 27 29 16 11
Interpretive Biol. & Natural Hist. 15 14 12 13 10
Law and Society 243 240 223 228 198
Liberal Studies 89 76 81 70 76
Mass Communication 163 189 180 181 174
Mathematics 36 44 32 27 16
Modern Foreign Languages 16 14 13 11 8
Music 69 69 68 75 58
Nursing 375 457 445 468 483
Philosophy 6 8 8 4 3
Physics 22 13 14 11 10
Political Science 78 70 71 67 59
Pre-Art 96 106 92 77 71
Pre-Engineering 42 50 53 66 62
Pre-Nursing (BSN) 1 16 15 45 87
Pre-Professional 85 74 60 19 9
Pre-Social Work 50 67 69 49 46
Psychology 321 303 294 260 258
Secure Computing & Info Assurance 26 46 68 71 85
Social Science 47 41 36 47 43
Social Work 34 36 45 48 36
Sociology 68 58 59 41 40
Theatre 48 57 48 43 32
Urban & Regional Planning 10 9 9 5 0
Wildlife & Fisheries 117 104 108 110 118
Total CLAS 3135 3291 3279 3094 2981
DEGREE SEEKING UNDECIDED 219 188 163 120 95
NON-DEGREE SEEKING 138 105 103 237 278
Total Undergraduate 4915 4961 4884 4725 4638
FALL 2014 – FALL 2018
FROSTBURG STATE UNIVERSITY
TRENDS IN UNDERGRADUATE ENROLLMENT

Second Major~ Fall 14 Fall 15 Fall 16 Fall 17 Fall 18
Accounting . 1 3 2 .
Art&Design BFA 1 1 1 1 .
Athletic Training . 1 . . .
Biology 7 4 3 5 6
Business Administration 8 3 3 5 4
Chemistry 0
Communication Studies 3 2 1 1 1
Computer Info Systems 1 1 1 . .
Computer Science 4 6 5 2 1
Early Childhood/Elementary Educ. . 1 1 2 .
Earth Science 2 1 2 1 .
Economics 7 12 7 5 4
Engineering 6 3 1 1 1
English 4 3 6 4 .
Environmental Analysis 1 2 . . 2
Ethnobotany 1 1 . 1 1
Exercise & Sport Science . 1 . . 2
Geography 4 5 4 6 3
History 2 1 3 2 1
Health Science . . 2 2 4
International Area Studies Certif. 1 2 1 . .
Information Techonology 1 1 . . .
International Studies 5 3 3 1 .
Interpretive Biology & Natural History 4 4 6 3 4
Law and Society 51 49 51 34 35
Liberal Studies .
Mass Communication 1 1 2 2 1
Mathematics 2 3 4 5 7
Modern Foreign Languages 11 9 6 4 9
Music 1 1 4 . .
Nursing 1 . . . .
Pre-Art . . . . .
Philosophy 11 7 10 5 4
Physical Education . . . . 1
Physics 7 10 5 2 2
Political Science 11 11 8 14 15
Pre-Professional . . . . .
Psychology 6 11 7 7 11
Recreation & Parks Mgmt 1 2 2 1 .
Social Science . . . . 2
Social Work 1 1 . 1 .
Sociology 20 13 22 13 21
Software Development Certif. . . 1 . .
Theatre 1 2 1 4 2
Urban & Regional Planning . . . 1 1
Wildlife & Fisheries 1 . . 1 .
~These students have already been counted under their primary major.
FROSTBURG STATE UNIVERSITY
TRENDS IN UNDERGRADUATE ENROLLMENT
FALL 2014 – FALL 2018

State Fall 14 Fall 15 Fall 16 Fall 17 Fall 18
Foreign 99 91 92 208 298
US-State Unkwn 1 . 1 3 .
Arizona 1 . . . .
California 4 3 1 . .
Colorado 1 . 1 1 1
Connecticut 2 1 . . .
Delaware 9 8 6 6 8
Washington, DC 50 40 40 38 38
Florida 1 . 2 1 2
Georgia . . . . 1
Illinois 3 2 2 1 .
Indiana 2 1 . . .
Iowa . . 2 2 3
Kentucky 1 . 2 . .
Maryland* 4508 4577 4495 4222 4035
Massachusetts 1 1 1 1 1
Michigan 1 1 1 1 .
New Hampshire 1 2 . .
New Jersey 17 18 14 9 9
New York 9 8 6 4 2
North Carolina 1 4 1 2 1
Ohio 1 1 3 3 4
Pennsylvania 110 105 105 102 115
Tennessee . . . . 1
Texas 2 2 2 2 2
Vermont 1 1
Virginia 53 55 66 78 84
West Virginia 37 41 41 40 32
Total Undergraduate 4915 4961 4884 4725 4638
*Maryland County Fall 14 Fall 15 Fall 16 Fall 17 Fall 18
Allegany 750 733 718 656 664
Anne Arundel 268 281 291 278 252
Balt County 370 421 415 407 399
Calvert 98 94 93 87 80
Caroline 17 21 16 16 14
Carroll 165 152 148 128 122
Cecil 81 100 77 68 61
Charles 201 219 204 176 158
Dorchester 13 14 7 8 8
Frederick 305 330 325 294 290
Garrett 152 136 141 166 150
Harford 129 119 124 120 113
Howard 174 161 175 180 173
Kent 10 10 10 10 7
Montgomery 459 454 477 468 410
Prince Georges 594 611 572 492 463
Queen Annes 28 32 29 25 23
St. Marys 101 94 78 80 84
Somerset 3 1 1 3 1
Talbot 18 20 17 16 19
Washington Co. 314 310 301 283 292
Wicomico 32 30 36 28 25
Worcester 25 22 20 22 21
Baltimore City 201 212 220 211 206
Total Undergraduate 4508 4577 4495 4222 4035
FROSTBURG STATE UNIVERSITY
TRENDS IN UNDERGRADUATE ENROLLMENT
FALL 2014 – FALL 2018

MASTER'S Level
Status Fall 14 Fall 15 Fall 16 Fall 17 Fall 18
Full Time 183 218 221 172 196
Part Time 478 503 493 417 391
Total Graduate 661 721 714 589 587
Credit Hours/FTE Fall 14 Fall 15 Fall 16 Fall 17 Fall 18
Student Level Credit Hours 4063 4442 4412 3601 3674
Student Level FTE 338.6 370.2 367.7 300.1 306.2
Race Fall 14 Fall 15 Fall 16 Fall 17 Fall 18
Unknown 65 100 100 87 70
Black 51 41 44 45 50
Amer Ind 1 1 . . .
Asian 15 14 16 12 17
Hispanic 9 7 14 13 15
White 483 492 449 402 409
NR Alien 24 59 85 21 12
Hawaiian 1 . . . .
2 or more races 12 7 6 9 14
Total Graduate 661 721 714 589 587
Gender Fall 14 Fall 15 Fall 16 Fall 17 Fall 18
Male 276 312 290 218 208
Female 385 409 424 371 379
Total Graduate 661 721 714 589 587
Race Gender Fall 14 Fall 15 Fall 16 Fall 17 Fall 18
Male 39 47 37 40 31
Female 26 53 63 47 39
Male 19 15 15 16 18
Female 32 26 29 29 32
Male . . . . .
Female 1 1 . . .
Male 11 8 8 7 9
Female 4 6 8 5 8
Male 4 5 5 7 3
Female 5 2 9 6 12
White Male 185 190 158 129 136
Female 298 302 291 273 273
NR Alien Male 13 45 65 15 7
Female 11 14 20 6 5
Male 1 . . . .
Female . . . . .
Male 4 2 2 4 4
Female 8 5 4 5 10
661 721 714 589 587
FROSTBURG STATE UNIVERSITY
TRENDS IN MASTER'S ENROLLMENT
FALL 2014 – FALL 2018
Hawaiian
2 or more races
Total Graduate
Unknown
Black
Amer Ind
Asian
Hispanic

Geographic Area Fall 14 Fall 15 Fall 16 Fall 17 Fall 18
Out of State 282 241 285 268 135
Maryland 440 420 436 446 452
Total Graduate 722 661 721 714 587
Registration Type Fall 14 Fall 15 Fall 16 Fall 17 Fall 18
Continuing 515 532 569 471 426
1st-time Masters Level 127 168 134 103 148
Second Degree 4 7 3 4 5
Internal Transfer . . . 2 1
Re-Admit 15 14 8 9 7
Total Graduate 661 721 714 589 587
Off Campus Site Fall 14 Fall 15 Fall 16 Fall 17 Fall 18
Hagerstown 111 129 133 113 98
Online Progs 285 316 298 261 272
Total Graduate 396 445 431 374 370
Residence Hall Fall 14 Fall 15 Fall 16 Fall 17 Fall 18
Cambridge Hall 6 2 2 2 1
Frederick Hall . . . 1
Gray Hall . . . . 1
Westminster Hall 1 . .
Total Graduate 7 2 2 2 3
Student Level Fall 14 Fall 15 Fall 16 Fall 17 Fall 18
<1 Year Grad 315 410 364 276 310
1+ Year Grad 310 284 311 291 257
Other G 36 27 39 22 20
Total Graduate 661 721 714 589 587
FROSTBURG STATE UNIVERSITY
TRENDS IN MASTER'S ENROLLMENT
FALL 2014 – FALL 2018

Major Fall 14 Fall 15 Fall 16 Fall 17 Fall 18
COLLEGE OF BUSINESS
Management (MBA) 277 275 219 176 174
COLLEGE OF EDUCATION
Education 203 216 234 235 227
Administration & Supervision 51 55 49 47
Curriculum & Instruction 14 22 24 25
Interdisciplinary 34 31 32 36
Literacy Education 38 34 37 37
School Counseling 16 27 43 44
Special Education 50 47 49 46
Elementary Educ MAT 19 19 5 8 7
Secondary Educ MAT 11 15 17 10 12
Parks & Recreation Mgmt 38 35 25 27 19
Total COE 271 285 281 280 265
COLLEGE OF LIBERAL ARTS & SCIENCES
Applied Ecology & Conserv. Biol. 11 15 15 14 11
Computer Science 22 64 93 40 47
Counseling Psych 32 31 30 29 29
Nursing 10 23 31 23 35
Wildlife & Fisheries 2 1 5 5 6
Total CLAS 77 134 174 111 128
NON-DEGREE SEEKING 36 27 40 22 20
Total Graduate 661 721 714 589 587
FROSTBURG STATE UNIVERSITY
TRENDS IN MASTER'S ENROLLMENT
FALL 2014 – FALL 2018

State Fall 14 Fall 15 Fall 16 Fall 17 Fall 18
Foreign 24 62 87 21 15
US-State Unkwn 1 2 1 2 .
Alabama 1 . . 1 .
Alaska 1 2 . . .
Arizona 1 5 4 1 .
Arkansas . . . 1 .
California 18 20 9 7 5
Colorado 3 4 3 1 .
Connecticut 1 2 1 1 1
Delaware 1 1 1 . .
Washington, DC 2 1 2 2 3
Florida 7 6 3 6 4
Georgia 1 2 1 2 1
Illinois 5 4 3 4 3
Indiana 1 1 1 . .
Iowa 1 1 1 . .
Kansas 1 1 . . .
Kentucky . 1 1 1 1
Louisiana 1 1 . . .
Maine . 1 2 1 .
Maryland 431 450 458 416 452
Massachusetts 3 2 1 . .
Michigan 1 3 2 3 2
Minnesota 4 3 3 3 1
Mississippi 1 . . . .
Missouri . . 1 1 .
Montana 1 . . . .
Nevada 3 3 2 2 2
New Jersey 6 6 10 6 4
New Mexico . . 1 2 2
New York 6 5 9 8 4
North Carolina 7 8 7 3 2
North Dakota . 1 1 1 .
Ohio 2 7 5 4 1
Oklahoma 1 . . 1 .
Oregon 2 . . . 1
Pennsylvania 63 59 51 53 41
South Carolina 1 . 1 . 2
Tennessee 2 1 1 1 1
Texas 3 2 . 1 .
Utah 1 1 1 . .
Vermont 1 1
Virginia 24 25 19 12 12
Washington 1 1 1 1 .
West Virginia 26 24 19 18 26
Wisconsin 1 2 1 1 .
Wyoming 1 1 . . .
Total Graduate 661 721 714 589 587
FROSTBURG STATE UNIVERSITY
TRENDS IN MASTER'S ENROLLMENT
FALL 2014 – FALL 2018

*Maryland County Fall 14 Fall 15 Fall 16 Fall 17 Fall 18
Allegany 138 126 132 127 146
Anne Arundel 14 23 21 24 17
Balt County 19 19 19 20 20
Calvert 3 3 5 3 3
Caroline . . 1 1 .
Carroll 10 8 14 15 17
Cecil 1 2 3 4 1
Charles 9 5 4 4 8
Frederick 25 35 48 28 41
Garrett 25 25 19 22 36
Harford 5 9 11 9 6
Howard 11 12 11 11 13
Kent 2 1 . . .
Montgomery 24 29 27 19 26
Prince Georges 19 16 18 19 16
Queen Annes 2 1 3 2 2
St. Marys 2 4 5 7 4
Somerset 1 1
Talbot . . 1 1 1
Washington Co. 101 116 106 88 79
Wicomico 4 4 1 2 2
Worcester 6 5 3 1 1
Baltimore City 11 7 6 8 12
Total Graduate 431 450 458 416 452
FROSTBURG STATE UNIVERSITY
TRENDS IN MASTER'S ENROLLMENT
FALL 2014 – FALL 2018

DOCTORAL Level
Status Fall 14 Fall 15 Fall 16 Fall 17 Fall 18
Full Time 26 20 22 4 9
Part Time 43 54 56 78 60
Total Doctoral 69 74 78 82 69
Credit Hours/FTE Fall 14 Fall 15 Fall 16 Fall 17 Fall 18
Student Level Credit Hours 492 467 437 373 354
Student Level FTE 49.2 46.7 43.7 37.3 35.4
Race Fall 14 Fall 15 Fall 16 Fall 17 Fall 18
Unknown . 5 4 11 9
Black 1 1 . 2 2
White 66 66 72 68 57
NR Alien 1 1 1 . .
2 or more races 1 1 1 1 1
Total Doctoral 69 74 78 82 69
Gender Fall 14 Fall 15 Fall 16 Fall 17 Fall 18
Male 22 24 27 26 21
Female 47 50 51 56 48
Total Doctoral 69 74 78 82 69
Race Gender Fall 14 Fall 15 Fall 16 Fall 17 Fall 18
Unknown Male . 2 1 2 1
Female . 3 3 9 8
Black Female 1 1 . 2 2
White Male 21 21 25 23 19
Female 45 45 47 45 38
NR Alien Female 1 1 1 . .
2 or more races Male 1 1 1 1 1
Total Doctoral 69 74 78 82 69
Geographic Area Fall 14 Fall 15 Fall 16 Fall 17 Fall 18
Out of State 17 21 16 16 11
Maryland 52 53 62 62 58
Total Doctoral 69 74 78 78 69
Registration Type Fall 14 Fall 15 Fall 16 Fall 17 Fall 18
Continuing 69 74 78 82 69
First-time Doctoral . . . . .
Total Doctoral 69 74 78 82 69
Sites Fall 14 Fall 15 Fall 16 Fall 17 Fall 18
Frostburg 45 31 47 34 33
Hagerstown 24 43 31 48 36
Total Doctoral 69 74 78 82 69
FALL 2014 – FALL 2018
FROSTBURG STATE UNIVERSITY
TRENDS IN DOCTORAL ENROLLMENT

Student Level Fall 14 Fall 15 Fall 16 Fall 17 Fall 18
<1 Year Doctoral 23 18 18 19 10
1+ Year Doctoral 46 56 60 63 59
Total Doctoral 69 74 78 82 69
Major Fall 14 Fall 15 Fall 16 Fall 17 Fall 18
COLLEGE OF EDUCATION
Educational Leadership 69 74 78 82 69
State Fall 14 Fall 15 Fall 16 Fall 17 Fall 18
Foreign 1 1 1 . .
Maryland* 52 53 59 66 58
Pennsylvania 10 11 13 12 7
Virginia 1 2 . 1 1
West Virginia 5 7 5 3 3
Total Doctoral 69 74 78 82 69
*Maryland County Fall 14 Fall 15 Fall 16 Fall 17 Fall 18
Allegany 32 23 33 25 24
Anne Arundel 2 2 1 . .
Baltimore County . 2 1 2 2
Carroll 1 1 1 2 2
Frederick 6 10 8 13 9
Garrett 7 3 5 5 6
Harford 1 1 1
Howard 1 1
Montgomery . 2 1 4 3
Prince Georges . 1 . 1 1
Washington Co. 4 9 8 10 7
Wicomico 1 1
Baltimore City 1 1
Total Doctoral 52 53 59 64 58
FALL 2014 – FALL 2018
FROSTBURG STATE UNIVERSITY
TRENDS IN DOCTORAL ENROLLMENT

Female Male
Full
Time
Part
Time MD
Out of
State Minority White Other
Student-
level FTE
First Time UG 735 341 394 733 2 664 71 395 329 11 762.1
Freshmen 334 155 179 328 6 300 34 213 114 7 325.7
Sophomore 914 450 464 829 85 821 93 422 461 31 865
Junior 1164 648 516 933 231 1059 105 453 670 41 1026.7
Senior 1231 663 568 867 364 1158 73 484 711 36 1012.6
Other/Unclas UG 260 155 105 115 145 33 227 3 33 224 148.1
Total
Undergraduate 4638 2412 2226 3805 833 4035 603 1970 2318 350 4140.3
First Time Grad 148 89 59 70 78 111 37 33 104 11 87.2
Other Graduate 439 290 149 126 313 341 98 63 305 71 219
Total Graduate 587 379 208 196 391 452 135 96 409 82 306.2
Total Doctoral 69 48 21 9 60 58 11 3 57 9 35.4
Total FSU 5294 2839 2455 4010 1284 4545 749 2069 2784 441 4481.9
Female Male
Full
Time
Part
Time MD
Out of
State Minority White Other
Total
Head Ct
First Time UG 762.1 355.8 406.3 761.4 0.7 691.5 70.6 409.5 341.6 11 735
Freshmen 325.7 153.3 172.5 322.6 3.1 292.6 33.1 209.4 109.6 6.7 334
Sophomore 865 407.2 457.9 837.2 27.8 774.2 90.9 408.7 426.1 30.3 914
Junior 1026.7 531.6 495.1 940.7 86 926.4 100.3 414.4 574.9 37.4 1164
Senior 1012.6 517.1 495.5 871.8 140.7 948.2 64.4 404.6 579.6 28.4 1231
Other/UnclasUG 148.1 88.5 59.7 94.9 53.2 11.5 136.7 2.8 10.9 134.5 260
Total
Undergraduate 4140.3 2053.4 2086.9 3828.7 311.6 3644.3 496 1849.4 2042.7 248.3 4638
First Time Grad 87.2 53.4 33.8 55.2 32 64.9 22.3 19.7 60.4 7.1 148
Other Graduate219 144.4 74.6 104.3 114.7 172.2 46.8 34.2 147.6 37.3 439
Total Graduate 306.2 197.8 108.3 159.5 146.7 237.1 69.1 53.8 208 44.3 587
Total Doctoral 35.4 27.1 8.3 8.1 27.3 30.2 5.2 1.3 29.5 4.6 69
Total FSU 4482 2278 2204 3996 486 3912 570 1905 2280 297 5294
Residence Race
STUDENT LEVEL CREDIT HOUR FTE - ALL FSU
Total
FTE
Sex Attendance
FROSTBURG STATE UNIVERSITY
Fall 2018
ENROLLMENT DATA BY CAMPUS
HEADCOUNT - ALL FSU
Total
Head Ct
Sex Attendance Residence Race

Total Student
Campus Career Major
Headct
and FTE Female Male
Full
Time
Part
Time MD
Out of
State Minority White Other
level
FTE
Arundel Mi l l s Undergraduate Engineering 27 4 23 21 6 27 . 12 11 4 22.2
27 4 23 21 6 27 . 12 11 4 22.2
22.2 3.3 18.9 19.5 2.7 22.2 . 9.5 8.8 3.9 27
Ceci l Community
Col lege
Undergraduate Engineering 15 3 12 15 . 15 . 3 10 2 13.7
Non-Degree 2 . 2 2 . 2 . 2 . . 2
17 3 14 17 . 17 . 5 10 2 15.7
15.7 2.7 13 15.7 . 15.7 . 4.7 9.3 1.7 17
Hagerstown Undergraduate Bus iness
Adminis tration
51 22 29 10 41 50 1 13 33 5 27
Early Chi ld Elem
Educ37 32 5 32 5 35 2 1 36 . 35.1
Elementary Educ 1 1 . 1 . 1 . . 1 . 0.9
Libera l Studies 4 3 1 4 . 4 . . 4 . 4.2
Psychology 41 33 8 10 31 39 2 11 28 2 21.6
Sociology 1 1 . . 1 1 . . 1 . 0.2
Graduate Education 89 66 23 18 71 76 13 7 65 17 35.9
Elem Educ MAT 7 6 1 7 . 6 1 1 2 4 8.8
Non-Degree 2 1 1 . 2 1 1 . 1 1 0.5
Doctora l Educational
Leadership
36 27 9 1 35 30 6 3 24 9 16.3
269 192 77 83 186 243 26 36 195 38 150.5
150.5 111.2 39.3 78.9 71.6 138.5 12 19.3 109.7 21.5 269
Onl ine Undergraduate Nurs ing 483 438 45 11 472 465 18 182 289 12 168
Graduate Computer Science 18 7 11 4 14 11 7 7 9 2 8.3
Education 26 19 7 3 23 20 6 4 21 1 10.3
Management 174 94 80 39 135 123 51 41 106 27 85.3
Nurs ing 35 35 . 11 24 30 5 4 26 5 21.2
Park & Recr
Resource Mgmt
19 8 11 1 18 17 2 4 12 3 9.5
755 601 154 69 686 666 89 242 463 50 302.5
302.5 235.6 66.9 54.8 247.7 262.4 40.1 97.8 183.6 21.1 755
Total Headcount
HEADCOUNT and FTES - Off Campus Sites and Online Program
Total FTE
Total Headcount
Total FTE
Total FTE
Total FTE
Sex
Attendance
Status Residence Race
Total Headcount
Total Headcount
FROSTBURG STATE UNIVERSITY
Fall 2018
ENROLLMENT DATA BY CAMPUS

HEGIS
CodeDiscipline Name
Lower
Division
Credit Hours
Upper
Division
Credit Hours
Graduate
Credit Hours
Doctoral
Credit Hours
Total Credit
Hours
502 Accounting 447 489 213 0 1149
506 Business Law 177 0 0 0 177
506 Bus Management Info Systems 0 63 0 0 63
506 Business Administration 84 0 0 0 84
506 Finance 0 903 66 0 969
506 International Business 0 81 0 0 81
506 Management 433 2573 513 0 3519
506 Marketing 0 672 144 0 816
2204 Economics 939 1764 138 0 2841
Total COB 2080.0 6545.0 1074.0 0.0 9699.0
HEGIS
CodeDiscipline Name
Lower
Division
Credit Hours
Upper
Division
Credit Hours
Graduate
Credit Hours
Doctoral
Credit Hours
Total Credit
Hours
801 Education General 396 825 282 0 1503
802 Elementary Education 0 646 0 0 646
803 Secondary Education 0 36 105 0 141
808 Special Education 0 0 186 0 186
823 Early Childhood Education 159 111 0 0 270
826 School Counseling 0 0 411 0 411
827 Educational Administration 0 0 108 0 108
827 Educational Leadership 0 0 0 354 354
829 Curriculum and Instruction 0 0 240 0 240
830 Reading Education 0 420 144 0 564
835 Athletic Training 73 161 0 0 234
835 Exercise & Sport Science 613 794 0 0 1407
835 Health & Physical Education 237 232 0 0 469
835 Physical Education 63 474 27 0 564
837 Health 44 0 0 0 44
837 Health 150 0 0 0 150
2103 Adventure Sports 0 36 0 0 36
2103 Park & Recreation Resources 285 302 144 0 731
2201 Social Science 0 21 0 0 21
9500 Orientation 767 0 0 0 767
Total COE 2787.0 4058.0 1647.0 354.0 8846.0
FROSTBURG STATE UNIVERSITY
Fall 2018
CREDIT HOURS BY COLLEGE AND LEVEL
COLLEGE OF BUSINESS
COLLEGE OF EDUCATION

HEGIS
CodeDiscipline Name
Lower
Division
Credit Hours
Upper
Division
Credit Hours
Graduate
Credit Hours
Doctoral
Credit Hours
Total Credit
Hours
401 Biology 2242 1942 106 0 4290
420 Sustainability Studies 60 0 0 0 60
601 Mass Communication 437 544 0 0 981
701 Computer Science 1888 739 336 0 2963
702 Information Technology 0 402 0 0 402
702 Secure Computing & Information 258 294 0 0 552
909 Electrical Engineering 42 346 0 0 388
910 Mechanical Engineering 48 457 0 0 505
1002 Art (Fine) 1853 669 3 0 2525
1004 Music-Applied 51 173 0 0 224
1005 Music 816.5 512 0 0 1328.5
1007 Theatre 429 174 0 0 603
1008 Dance 173 0 0 0 173
1101 Modern Foreign Lang & Lit 87 0 0 0 87
1102 French 54 6 0 0 60
1105 Spanish 210 120 0 0 330
1201 Health Science 150 23 0 0 173
1203 Nursing 0 2202 261 0 2463
1501 English 1921 2366 0 0 4287
1506 Communication Studies 693 306 0 0 999
1509 Philosophy 1152 271 0 0 1423
1701 Mathematics 3068 264 9 0 3341
1901 Physical Science 331 0 0 0 331
1902 Physics 554 103 0 0 657
1905 Chemistry 1100 432 0 0 1532
2001 Psychology 1968 1705 253 0 3926
2104 Social Work 0 663 0 0 663
2205 History 1365 249 0 0 1614
2206 Geography 1664 741 6 0 2411
2207 Political Science 855 768 0 0 1623
2208 Sociology 1428 1347 0 0 2775
2210 International Studies 189 0 0 0 189
2211 African American Studies 90 0 0 0 90
4901 Liberal Studies 0 0 0 0 0
4901 Leadership 18 0 0 0 18
4904 Engineering Science 294 285 0 0 579
4997 Women's Studies 165 0 0 0 165
4999 Interdisciplinary Studies 1485 196 0 0 1681
9530 Developmental Math 1176 0 0 0 1176
Total CLAS 28314.5 18299.0 974.0 0.0 47587.5
33181.5 28902.0 3695.0 354.0 66132.5
2212.1 1926.8 307.9 35.4 4482.2
Total University Credit Hours
Total Course-Level FTE
FROSTBURG STATE UNIVERSITY
Fall 2018
CREDIT HOURS BY COLLEGE AND LEVEL
COLLEGE OF LIBERAL ARTS & SCIENCES