frontline test system™ async user guide.pdfwithout prior written authorization of frontline test...
TRANSCRIPT

FRONTLINE TEST SYSTEM™
SERIALTEST ASYNC
USER MANUAL

Copyright © 2000‐2010 Frontline Test Equipment, Inc. All rights reserved. You may not reproduce, transmit, or store on magnetic media any part of this publication in any way without prior written authorization of Frontline Test Equipment, Inc.
FTS, Frontline and Frontline Test System are registered trademarks of Frontline Test Equipment, Inc. Frontline is a trademark of Frontline Test Equipment, Inc.
ll other trademarks and registered trademarks are property of their respective owners. A

iii
Table of Contents 1 Welcome to FTS_____________________________________________________ 1
2 Getting Started _____________________________________________________ 2
2.1 Control Window _______________________________________________________ 2
2.2 The Control Window Toolbar_____________________________________________ 2
2.3 Drop‐Down Menus _____________________________________________________ 3
2.4 Configuration Information on the Control Window ___________________________ 4
2.5 Status Information on the Control Window _________________________________ 4
2.6 Frame Information on the Control Window _________________________________ 5
2.7 Opening Serialtest Async ________________________________________________ 5
2.8 Minimizing Windows ___________________________________________________ 7
3 Hardware Settings __________________________________________________ 8
3.1 Serial Data Hardware Settings ____________________________________________ 8
3.2 Choosing Product and Com Ports__________________________________________ 8
3.3 Switching to Source DTE No Cables ________________________________________ 9
3.4 Using the Detect Now Button ___________________________________________ 10
3.5 Serial ComProbe Hardware Settings ______________________________________ 10
____________________________ 10
3.6 Establishing Serialtest MLT______________________________________________ 11
3.7 Troubleshooting the MLT and Serialtest ___________________________________ 11 3.7.1 Advanced Hardware Settings _________________________________________________ 12
3.8 I/O Settings __________________________________________________________ 14 3.8.1 Spy Mode Settings on the I/O Settings Dialog ____________________________________ 14 3.8.2 Operating Mode ‐ Choosing to Monitor or Source ________________________________ 15 3.8.3 Bit Order _________________________________________________________________ 15 3.8.4 Flow Control ______________________________________________________________ 16 3.8.5 Selecting a Custom Protocol Stack_____________________________________________ 16 3.8.6 I/O Settings Dialog in Capture File Viewer _______________________________________ 16 3.8.7 Saving Configurations_______________________________________________________ 17
3.9 Synchronous Serial Hardware Setup ______________________________________ 18 3.9.1 Defining RS‐232 ComProbe I/O Settings ________________________________________ 18

iv
3.9.2 I/O Settings _______________________________________________________________ 18
3.10 Connecting Cables_____________________________________________________ 19 3.10.1 Cable Configuration ______________________________________________________ 19 3.10.2 Creating a Dual Port Monitor Mode Cable Configuration_________________________ 20 3.10.3 Creating a Dual Port Source DCE Mode Cable Configuration ______________________ 20 3.10.4 Creating a Dual Port Source DTE Mode Cable Configuration ______________________ 21 3.10.5 Creating a Single Port Monitor DCE Mode Cable Configuration ____________________ 21 3.10.6 Creating a Single Port Monitor DTE Mode Cable Configuration ____________________ 22 3.10.7 Creating a Single Port Source DCE Mode Cable Configuration _____________________ 23 3.10.8 Creating a Single Port Source DTE Mode Cable Configuration _____________________ 23 3.10.9 Generic Channel Dependent Decodes Setup___________________________________ 24 3.10.10 Using a Converter________________________________________________________ 24 3.10.11 RS‐232 Pin‐outs _________________________________________________________ 25
3.11 Port Assignments _____________________________________________________ 26 3.11.1 Adding or Changing Port Assignments________________________________________ 26
3.12 Node Database _______________________________________________________ 27 3.12.1 Using The Node Database Manager _________________________________________ 27 3.12.2 Adding a Node Assignment ________________________________________________ 27 3.12.3 Modifying a Node Assignment______________________________________________ 28 3.12.4 Deleting a Node Assignment _______________________________________________ 28 3.12.5 Selecting and Applying a Node Assignment Template ___________________________ 29 3.12.6 Adding a Node Assignment Template ________________________________________ 29 3.12.7 Deleting a Node Assignment Template _______________________________________ 30
3.13 Decoder Parameters ___________________________________________________ 30 3.13.1 A2DP Decoder Parameters_________________________________________________ 31 3.13.2 Security Parameters______________________________________________________ 32 3.13.3 L2CAP Decoder Parameters ________________________________________________ 33 3.13.4 RFCOMM Decoder Parameters _____________________________________________ 35 3.13.5 Decoder Parameter Templates _____________________________________________ 36
3.14 Spy Mode____________________________________________________________ 37 3.14.1 Spy Mode Settings on the I/O Settings Dialog__________________________________ 38 3.14.2 FIFOs and Spy ___________________________________________________________ 38 3.14.3 Turning Off the FIFO Buffers _______________________________________________ 39
3.15 Modbus Special Instructions ____________________________________________ 40 3.15.1 Modbus Register Display Format Settings_____________________________________ 40 3.15.2 Setup For Modbus RTU and ASCII ___________________________________________ 41
4 Protocol Stacks ____________________________________________________ 43
4.1 Protocol Stack Wizard__________________________________________________ 43
4.2 Information Screen ____________________________________________________ 44
4.3 Creating and Removing a Custom Stack ___________________________________ 44
4.4 Saving User Defined Stacks _____________________________________________ 45
4.5 Reframing ___________________________________________________________ 46

v
4.6 Unframing ___________________________________________________________ 47
4.7 Providing Context For Decoding When Frame Information Is Missing ___________ 47
5 Capturing Data ____________________________________________________ 49
5.1 Capturing Data _______________________________________________________ 49
5.2 USB HCI Internal Software Tap Data Source Dialog __________________________ 50
6 Analyzing Byte Level Data ___________________________________________ 51
6.1 Event Display_________________________________________________________ 51
6.2 The Event Display Toolbar ______________________________________________ 51
6.3 Opening Multiple Event Display Windows _________________________________ 53
6.4 Calculating CRCs or FCSs ________________________________________________ 53
6.5 Calculating Delta Times and Data Rates ___________________________________ 54
6.6 Switching Between Live Update and Review Mode __________________________ 55
6.7 Data Formats and Symbols______________________________________________ 55 6.7.1 Switching Between Viewing All Events and Viewing Data Events _____________________ 55 6.7.2 Switching Between Hex, Decimal, Octal or Binary_________________________________ 56 6.7.3 Switching Between ASCII, EBCDIC, and Baudot ___________________________________ 56 6.7.4 Viewing Only ASCII (or EBCDIC or Baudot)_______________________________________ 56 6.7.5 Viewing Only Hex (Or Decimal or Octal or Binary)_________________________________ 56 6.7.6 Selecting Mixed Channel/Sides _______________________________________________ 57 6.7.7 List of All Event Symbols_____________________________________________________ 57 6.7.8 Font Size _________________________________________________________________ 59
7 Analyzing Protocol Decodes __________________________________________ 60
7.1 Frame Display Window_________________________________________________ 60 7.1.1 Frame Display Window______________________________________________________ 60 7.1.2 Frame Display Toolbar ______________________________________________________ 61 7.1.3 Frame Display Status Bar ____________________________________________________ 64 7.1.4 Hiding and Revealing Protocol Layers in the Frame Display _________________________ 64 7.1.5 Physical vs. Logical Byte Display_______________________________________________ 64 7.1.6 Sorting Frames ____________________________________________________________ 65 7.1.7 Synchronizing the Event and Frame Displays_____________________________________ 65 7.1.8 Working With Multiple Frame Displays _________________________________________ 65 7.1.9 Working With Panes________________________________________________________ 66 7.1.10 The Panes in the Frame Display_____________________________________________ 66 7.1.11 Protocol Layer Colors _____________________________________________________ 72 7.1.12 Protocol Filtering from the Frame Display_____________________________________ 72
7.2 Protocol Navigator Window_____________________________________________ 74 7.2.1 Protocol Navigator _________________________________________________________ 74 7.2.2 Protocol Navigator Toolbar __________________________________________________ 75 7.2.3 Protocol Navigator Status Bar ________________________________________________ 77 7.2.4 The Difference Between Filtering and Hiding ____________________________________ 77 7.2.5 Hiding and Revealing Protocol Layers in the Protocol Navigator _____________________ 77

vi
7.2.6 Filtering on a Protocol Layer__________________________________________________ 78 7.2.7 Filtering on all Frames with Errors from the Protocol Navigator______________________ 78 7.2.8 Expanding and Collapsing Protocol Layers_______________________________________ 79
8 Analyzing Control Signal Changes _____________________________________ 81
8.1 Viewing Signal Changes in Real‐time______________________________________ 81 8.1.1 Breakout Box Window ______________________________________________________ 81 8.1.2 The Breakout Box Toolbar ___________________________________________________ 82 8.1.3 Reading the Breakout Box Window ____________________________________________ 83 8.1.4 Selecting Breakout Box Options_______________________________________________ 83
9 Viewing Historical Signal Changes_____________________________________ 85
9.1 Signal Display Window _________________________________________________ 85
9.2 Signal Display Toolbar__________________________________________________ 86
9.3 Reading the Signal Display ______________________________________________ 86
9.4 Selecting Signal Display Options _________________________________________ 88
10 Statistics________________________________________________________ 89
10.1 Statistics ____________________________________________________________ 89
10.2 Statistics Window _____________________________________________________ 89
10.3 Session, Resettable and Capture File Tabs _________________________________ 89
10.4 Copying Statistics To The Clipboard_______________________________________ 90
10.5 Graphs ______________________________________________________________ 90 10.5.1 Statistics Graphs_________________________________________________________ 90 10.5.2 Printing Graphs__________________________________________________________ 91 10.5.3 Changing the Graph Refresh Rate ___________________________________________ 91 10.5.4 Viewing Percentages or Values _____________________________________________ 91
10.6 Information on Tables _________________________________________________ 91 10.6.1 Frames Per Second Table__________________________________________________ 91 10.6.2 Characters Per Second Table _______________________________________________ 92 10.6.3 Utilization Table _________________________________________________________ 92 10.6.4 Data Table _____________________________________________________________ 93 10.6.5 Buffer Information Table __________________________________________________ 94 10.6.6 Errors Table ____________________________________________________________ 95
11 Transmitting Data ________________________________________________ 98
11.1 Converting FTS Capture Files ____________________________________________ 99
11.2 Flow Control when Transmitting _________________________________________ 99
12 Find __________________________________________________________ 101
12.1 Starting a Search _____________________________________________________ 101
12.2 Using Go To _________________________________________________________ 101

vii
12.3 Searching for Control Signal Changes ____________________________________ 103
12.4 Searching for Data Errors ______________________________________________ 105
12.5 Searching for Frame Errors_____________________________________________ 107
12.6 Searching for Special Events____________________________________________ 108
12.7 Searching within Decodes _____________________________________________ 109
12.8 Side Restrictions _____________________________________________________ 110
12.9 Searching by Signal ___________________________________________________ 112
12.10 Changing Where the Search Lands_____________________________________ 112
12.11 Subtleties of Timestamp Searching ____________________________________ 113
12.12 Entering Search Patterns (String Searches) ______________________________ 113 12.12.1 Searching by Pattern ____________________________________________________ 113 12.12.2 Entering Characters _____________________________________________________ 114 12.12.3 Entering Hex or Binary ___________________________________________________ 115 12.12.4 Control Characters ______________________________________________________ 115 12.12.5 Wildcard Character _____________________________________________________ 115 12.12.6 Examples of Search Strings _______________________________________________ 116
12.13 Searching by Time__________________________________________________ 116 12.13.1 Searching by Time ______________________________________________________ 116 12.13.2 Searching with Absolute Timestamp ________________________________________ 117 12.13.3 Searching with Relative Timestamp_________________________________________ 118 12.13.4 Choosing "On or Before" or "On or After"____________________________________ 119
13 Bookmarks_____________________________________________________ 120
13.1 Bookmarks__________________________________________________________ 120
13.2 Adding, Modifying or Deleting a Bookmark _______________________________ 120
13.3 Displaying All and Moving Between Bookmarks____________________________ 121
14 Filtering _______________________________________________________ 122
14.1 Display Filters _______________________________________________________ 122 14.1.1 Including and Excluding Radio Buttons ______________________________________ 122 14.1.2 Creating a Display Filter __________________________________________________ 123 14.1.3 Named Display Filters ___________________________________________________ 124 14.1.4 Using Compound Display Filters ___________________________________________ 124 14.1.5 Defining Node and Conversation Filters _____________________________________ 125 14.1.6 Using Advanced Display Filtering Techniques _________________________________ 126 14.1.7 Deleting and Hiding Display Filters _________________________________________ 126 14.1.8 Editing Filters __________________________________________________________ 127
14.2 Protocol Filtering from the Frame Display_________________________________ 129 14.2.1 Easy Protocol Filtering ___________________________________________________ 129 14.2.2 Filtering On the Summary Layer Protocol ____________________________________ 129 14.2.3 Quick Filtering on a Protocol Layer _________________________________________ 129 14.2.4 Filtering on all Frames with Errors from the Frame Display ______________________ 130
viii
14.3 Protocol Filtering from the Protocol Navigator_____________________________ 130 14.3.1 Filtering on a Protocol Layer ______________________________________________ 130 14.3.2 Filtering on all Frames with Bookmarks______________________________________ 131 14.3.3 Filtering on all Frames with Errors from the Protocol Navigator __________________ 131 14.3.4 Filtering on all Frames with Special Information Nodes _________________________ 131 14.3.5 Named Filters __________________________________________________________ 132
15 Saving Data ____________________________________________________ 133
15.1 Saving Your Data_____________________________________________________ 133
15.2 Saving the Entire Capture File using File > Save or the Save icon ______________ 133
15.3 Saving the Entire Capture File with Save Selection__________________________ 134
15.4 Saving a Portion of a Capture File _______________________________________ 135
15.5 Confirm Capture File (CFA) Changes _____________________________________ 136
15.6 Adding Comments to a Capture File _____________________________________ 136
16 Loading and Importing Capture Files ________________________________ 137
16.1 Loading a Capture File ________________________________________________ 137
16.2 Importing Capture Files _______________________________________________ 137
16.3 Converting Timestamps _______________________________________________ 138
16.4 Adding Comments to a Capture File _____________________________________ 138
16.5 File Format for Merlin Files ____________________________________________ 139
17 Printing _______________________________________________________ 140
17.1 Printing from the Frame Display/HTML Export_____________________________ 140
17.2 Frame Display HTML Export ____________________________________________ 142
17.3 Printing from the Event Display _________________________________________ 143
17.4 Print Preview________________________________________________________ 145
18 Exporting ______________________________________________________ 147
18.1 Export _____________________________________________________________ 147
18.2 Export Filter Out _____________________________________________________ 147
18.3 Exporting Event Display to a File ________________________________________ 147
18.4 Exporting Baudot ____________________________________________________ 149
18.5 HTML Export ________________________________________________________ 149
19 System Settings and Program Options_______________________________ 151
19.1 System Settings______________________________________________________ 151
19.2 System Settings ‐ Disabled/Enabled Options ______________________________ 153

ix
19.3 Bluetooth ComProbe Maintenance ______________________________________ 153
19.4 Advanced System Options _____________________________________________ 154
19.5 Changing Default File Locations _________________________________________ 155
19.6 Selecting Start Up Options _____________________________________________ 156
19.7 Names _____________________________________________________________ 157
19.8 Timestamping _______________________________________________________ 158 19.8.1 Timestamping Options___________________________________________________ 158 19.8.2 Enabling/Disabling Timestamping __________________________________________ 158 19.8.3 Switching Between Relative and Absolute Time _______________________________ 159 19.8.4 Changing the Timestamping Resolution _____________________________________ 159 19.8.5 Displaying Fractions of a Second ___________________________________________ 160 19.8.6 Converting Timestamps __________________________________________________ 160 19.8.7 Performance Issues For High Resolution Timestamps __________________________ 160
20 Technical Information ____________________________________________ 162
20.1 Contacting Technical Support___________________________________________ 162
20.2 Technical Information_________________________________________________ 162
20.3 Asynchronous Serial Performance Notes _________________________________ 162
20.4 Changing Where the Search Lands_______________________________________ 164
20.5 Progress Bars________________________________________________________ 164
20.6 Event Numbering ____________________________________________________ 164
20.7 File Format for Merlin Files ____________________________________________ 165
20.8 Ring Indicator _______________________________________________________ 165
20.9 RS‐232 Pin‐outs ______________________________________________________ 166
20.10 Useful Character Tables _____________________________________________ 167 20.10.1 ASCII Codes____________________________________________________________ 167 20.10.2 Baudot Codes __________________________________________________________ 167 20.10.3 EBCDIC Codes __________________________________________________________ 168 20.10.4 Communication Control Characters ________________________________________ 168
20.11 The Serial Driver ___________________________________________________ 170 20.11.1 The FTS Serial Driver ____________________________________________________ 170
20.12 Frame Decoder ____________________________________________________ 170
21 Index _________________________________________________________ 171

1
1 Welcome to FTS
Welcome to Frontline Test System (FTS). The design of FTS allows you to conduct data analysis of protocols using your personal computer. The FTS interface is easy to use without training, but we recommend you read the online Help to take maximum advantage of all the features. We designed the online Help System with complete explanations and easy to use systematic instructions. Access the online Help by choosing Help Topics from the Help menu, or by ressing the F1 key on any window. p

2
2 Getting Started
2.1 Control Window
The analyzer displays information in multiple windows, with each window presenting a different type of information. The Control window provides access to each window as well as a brief overview of the data in the capture file. Each icon on the toolbar represents a different data analysis function.
Because the Control window can get lost behind other windows, every window has a Home
icon that brings the Control window back to the front. Just click on the Home icon to restore the Control window. When running the Capture File Viewer, the Control window toolbar and menus contain only those selections needed to open a capture file and display the About box. Once a capture file is opened, the analyzer limits Control window functions to those that are useful for analyzing data contained in the current file. Because you cannot capture data while using Capture File Viewer, data capture functions are unavailable. For example, when viewing Ethernet data, the Signal Display is not available. The title bar of the Control window displays the name of the currently open file. The status line (below the toolbar) shows the configuration settings that were in use when the capture file was created.
2.2 The Control Window Toolbar
Available options are in color, while unavailable options are grayed out. All toolbar icons have corresponding menu items. Toolbar icon displays vary according to operating mode and/or data displayed.
Open File ‐ Opens a capture file.
I/O Settings ‐ Opens the I/O Settings dialog.
Start Capture ‐ Begins data capture to disk.
Stop Capture ‐ Available after data capture has started. Click to stop data
d, but no new data can be captured. capture. Data can be reviewed and save
Clear ‐ Clears or saves the capture file.
Event Display ‐ (framed data only) Opens a Event Display, with the currently selected bytes highlighted.

3
Frame Display ‐ (framed data only) Opens a Frame Display, with the frame of the currently selected bytes highlighted.
Protocol Navigator ‐ (framed data only) Opens the Protocol Navigator window, with the currently selected frame highlighted.
Statistics Window ‐ Opens up the Statistics window.
Signal Display ‐ Opens The Signal Display dialog.
Breakout Box ‐ Opens the Breakout Box dialog.
Transmit ‐ Opens the Transmit dialog.
Cascade ‐ Arranges windows in a cascaded display.
Packet Timeline ‐ Opens the Packet Timeline display.
Extract Data ‐ Opens the Extract Data dialog.
Packet Error Rate Statistics ‐ Opens the Packet Error Rate Statistics window.
Audio Extraction ‐ Opens the Audio Extraction dialog.
2.3 DropDown Menus
The menus that you see on the Control Window and dialogs like Frame Display and Event Display vary depending on whether the data is being captured live or whether you are looking at a .cfa file. You will see File, View, Live, Options, Window, and Help. Most of the options are self explanatory.
• Many of the File menu items are standard Windows type commands: Open, Close, Save, Recent Files, etc. There are two exceptions:
• Recreate Companion File. This option is available when you are working with decoders. If you change a decoder while working with data, you can use Recreate Companion File to recreate the .frm file, the companion file to the .cfa file. Recreating the .frm file helps ensure that the decoders will work properly.

4
• Reload Decoders. When Reload Decoders is clicked, the plug‐ins are reset and received frames are redecoded.
• Under the View menu you can choose which FTS windows are available to open.
• Live contains commands that used in capturing data.
• Under Options you have opportunities to set/modify various system settings.
• The Window menu displays the open FTS dialogs and standard options like Cascade, Minimize, Tile, etc.
• Within the Help menu you can open the electronic Help file, About FTS, and access the FTS web site for additional help.
2.4 ation Information on the Control Window Configur
The Configuration bar (just below the toolbar) displays the hardware configuration and may include I/O settings. It also provides such things as name of the network card, address information, ports in use, etc. If the analyzer cannot find the MAC Address, it lists zeroes after the NIC name.
2.5 tus Information on ol WindoSta the Contr w
The Status bar located just below the Configuration bar on the Control window provides a uick look at current activity in the analyzer. q
• Capture Status displays Not Active, Paused or Running and refers to the state of data capture.
o Not Act pturing data ive means that the analyzer is not currently cao Paused means that data capture has been suspended o Running means that the analyzer is actively capturing data.

5
• % Used o The next item shows how much of the buffer or capture file has been filled.
For example, if you are capturing to disk and have specified a 200K capture file, the bar graph tells you how much of the capture file has been used. When the graph reaches 100%, capture either stops or the file begins to overwrite the oldest data, depending on the choices you made in the System Settings.
• Utilization/Events o The second half of the status bar gives the current utilization and total
number of events seen on the network. This is the total number of events monitored, not the total number of events captured. The analyzer is always monitoring the circuit, even when data is not actively being captured. These graphs allow you to keep an eye on what is happening on the circuit, without requiring you to capture data.
2.6 Frame Information on the Control dow Win
Frame Decoder information is located just below the Status bar on the Control window. It displays two pieces of information.
• Frame Decoder (233 fps) displays the number of frames per second being decoded. You can toggle this display on/off with Ctrl‐D, but it is available only during a live capture.
• #132911 displays the total frames decoded.
• 100% displays the percentage of buffer space used.
2.7 Opening Serialtest Async
On product installation, the installer creates a folder on the windows desktop labeled Frontline Serialtest Async.
1. Double‐click the Frontline Serialtest Async desktop folder .

6
This opens a standard Windows file folder window.
2. Double‐click on Serialtest Async.
Note: You can also access this dialog by selecting Start > All Programs > Frontline Serialtest Async (Version #) > Serialtest Async.
his dialog lists all the protocols Serialtest Async supports in a tree control. T Three buttons appear at the bottom of the dialog; Run, Cancel, and Help. When the dialog first opens, C n is inactive (grayed out). ancel and Help are active, and the Run butto
starts FTS using the selected protocol stack.
closes the dialog and exits the user back to the desktop.
takes the user to this help file as does pressing the F1 key.
3. Expand the folder containing the desired protocol and select the protocol that matches your configuration.
Note: If you don't need to ident the Run button to start the analyzer.
ify a capture method, then click
2.7.1.1 Data Capture Method
This pane is located on the Choose Protocol to Analyze dialog just below the protocol list, ture data. and lists the methods by which FTS can cap
The foll ions appear in this list: owing select• Serial Ports • rd Ethernet Ca• LiveImport • RS‐232 ComProbe • RS‐422/485 ComProbe
These selections are exclusive radio buttons and are inactive (grayed out) until a protocol selection is made.

7
If the protocol selection has only one method of data capture, then the system automatically selects that capture method and the buttons remain inactive (grayed out). If the selected protocol has more than one capture method, then the selection buttons that correspond to the possible capture methods become active, allowing you to make a
s. selection. When multiple selections are available, the system defaults to Serial PortAfter making a capture method selection, click the Run button to start the analyzer.
2.7.1.2 Creating a Shortcut
A checkbox labeled is located near the bottom of the dialog. This box is un‐checked by default. Select this checkbox, and the system creates a shortcut for the selected protocol, and places
n.
Create Shortcut When Run
it in the NetDecoder desktop folder and in the start menu when you click the Run buttoThis function allows you the option to create a shortcut icon that can be placed on the desktop. In the future, simply double‐click the shortcut to start the analyzer in the associated protocol.
2.8 Minimizing Windows
Windows can be minimized individually or as a group when the Control window is minimized. To minimize windows as a group:
he Window menu on the Contr1. Go to t ol window 2. Select Minimize Control Minimizes All. The analyzer puts a check next to the menu
item, indicating that when the Control window is minimized, all windows are minimized.
3. Select the menu item again to deactivate this feature. 4. The windows minimize to the top of the operating system Task Bar.

8
3 Hardware Settings
3.1 Serial Data Hardware Settings
The Hardware Settings box is used to tell the analyzer which parallel port your ComProbe® is connected to. which product mode you want to use and which COM ports to use. This box appears the first time you start the program. If you need to change your parallel port COM ports, you can do so at any time by choosing Hardware Settings from the Options menu in the Control Window. Click on the small down arrow in the Use This Parallel Port box to see a list of all ports available on your PC. Choose the port your ComProbe is connected to. Check that power is being supplied to the ComProbe, then click the Test button to be sure that the analyzer can find the ComProbe. If the analyzer can find the ComProbe, click OK to close the box.
3.2 Choosing Product and Com Ports
The foll ppear at the top of the Hardware Settings dialog: owing buttons a• FTS Cables Use • Spy • S Cables Source DTE, No FT• MLT, length 7 bits • MLT length 8 bits
Only the buttons for the products you have installed are active.
1. Click on to choose the product you want to use.
• Choose Use FTS Cables when you want to monitor an external circuit or transmit data to an external device using the cable set. Choose this mode also when you have
on a radio butt
connected your circuit directly to the serial ports on your PC. • Use Spy to "spy" on the data going in and out of an internal COM port or internal
em. mod• Use Source DTE, No FTS Cables to transmit data to an external or internal modem or
ithout uother communications device w sing the cable set. • If you have the MLT version of Serialtest choose either the 7 bits or 8 bits option
depending on the Length setting of your MLT device.

9
Choose COM ports
To change your COM ports: • Click on the down arrow in the top port box and choose one of the COM ports listed.
This list is generated from the registry of your computer, and so it only lists the COM ports that are available on your computer.
• Next, click on the down arrow of the second box and choose a second COM port to use. (If you chose Spy or Source DTE, No FTS Cables, you are only able to choose one COM port).
• Note that if you have more than one serial card in your PC, you must choose two ports from the same card. In other words, if you have a serial card from manufacturer A and a card from manufacturer B, you must choose either the two ports on card A or the two ports on card B. You can’t select one port from A and one from B.
If you have only one COM port on your computer: • Choose a port in the first box, and choose Not Used for the second box. FTS only
allows you to choose options appropriate for single port mode once you get into the program.
Changes in your COM ports take effect when you click on the OK button, or the next time you start FTS if you changed them from outside the program.
Choose Options
• Detect Now Button ‐ Click to determine which cables are connected to your computer.
• Notify If Auto Detect of Cables Fails ‐ FTS looks for the cables each time data capture is started. Uncheck this box if you do not want FTS to look for the cables before starting capture.
• Info button ‐ Click to see whether FIFOs are available on the selected COM ports and if they are enabled.
• Disable Control Signal Interrupts ‐ When checked, FTS ignores all interrupts generated by the control signals. This is primarily a troubleshooting tool used when
hich has large numbers of rapid signal changes. monitoring a circuit w• UART FIFO Settings.
3.3 Switching to Source DTE No Cables
Source DTE No Cables lets you transmit DTE data without using the cable set, which means that you can transmit data directly to an internal device on your computer such as an internal modem or COM port. This is probably most useful for testing internal modems. Using the Transmit dialog, you can send commands directly to the internal modem, and use the Event Display window to see the modem's response.

10
Ring Indicator control signal changes may not always be properly captured when using Source DTE No Cables mode. See the note on Ring Indicator changes for more information. To switch to de. this mo
1. Open the Hardware Settings dialog by choosing Hardware Settings from the Options the Control window. menu on
2. Click the Source DTE No Cables radio button.
3. Choose which COM port you want to communicate with. If you are testing a modem, COM port that th is connected to. choose the e modem
4. Close the Hardware Settings window.
5. Click the I/O Settings icon and set the baud rate, parity and other parameters.
6. TClick the ransmit icon to transmit data.
7. Use the Event Display to view the data you transmitted, plus the response from the device.
3.4 Using the Detect Now Button
To access t ion his funct
1. Open the Hardware Settings dialog by choosing Hardware Settings from the Options
the Controlmenu on window.
to the correct ports. 2. Click the Detect Now button to check that the cables are attached
er respondsThe analyz with a message listing the cables it has found.
To use the Detect Now button, you must have your cables connected to the computer (see Cable Configuration for help connecting your cables).
3.5 Serial ComProbe Hardware Settings
The Hardware Settings dialog is used to select a device to sniff/scan. To access the Hardware Settings dialog:
1. Select Hardware Settings from the Options menu on the Control window.

11
Note: This dialog is used for both RS422 and RS 422/485.
2. a Select
3. Select OK.
device from the drop‐down list.
If no devices are found, the list will be blank. You can also select Refresh List to make sure the list is complete.
3.6 Establishing Serialtest MLT
Serialtest MLT is designed for use with an MLT‐2400A, which is a Modem Line Tap device. It requires only one serial port to monitor the output from an MLT. Please refer to the MLT manual for help on setting up the MLT device.
Setup
1. Connect the MLTs Monitor port to a serial port on your PC using a standard RS‐232 cable.
2. Start Serialtest MLT by double‐clicking on the ST MLT icon in the Serialtest folder on your desktop.
3. From the Options menu on the Control window, choose Hardware Settings.
4. Select either MLT, length 7 bits or MLT, length 8 bits from the radio buttons at the top of the Hardware Settings window. Choose the option that matches the Length setting on the front of the MLT.
t the MLT is connected to from the Serial Ports box. 5. Select the serial port tha
6. Click OK when finished.
The output from an MLT is 9600 baud, 8 data bits, no parity and 1 stop bit. Serialtest MLT automatically uses these settings, so no further setup is required unless your data uses a protocol that you would like the analyzer to decode. See Protocol Stack for information on how to setup a protocol for decode. If your data has lots of red characters or is garbled, see Troubleshooting the MLT and Serialtest.
3.7 Troubleshooting the MLT and Serialtest
You can : encounter various problems when using MLT and Serialtest. Among these are
• Red bytes in the analyzer indicate errors. When using the MLT, the only errors should be overrun errors. These are not real overrun errors, but indicate a problem with the MLT, usually with the setup of the length parameter.

12
• If you are receiving large numbers of errors that do not go away, check that the length selection on the Hardware Settings window matches the Length setting on the MLT. This occurs when the MLT is set for 7 bits and the analyzer is set for 8 bits.
• If you are receiving clean data, but the data itself is not correct, check that the length selection on the Hardware Settings window matches the Length setting on the MLT. This problem occurs when the analyzer is set for 7 bits and the MLT is set for 8 bits. Also check that the data being monitored is not compressed or encoded.
• If you are using a word length of 8 and the power to the MLT is cycled, you see a group of errors right after the power is restored to the MLT. Subsequent data capture should appear normal. This occurs because the MLT sends out diagnostic messages on startup using a length of 7, and the analyzer interprets the data as errors when set for a length of 8.
• If you start the analyzer while the MLT is already capturing data, you may see a small amount of data from one side that looks like garbage, followed by an overrun error and then correct data. This happens when the length on both the analyzer and the MLT is set to 8 bits, and the analyzer begins capturing in the middle of a byte. The analyzer usually solves this problem itself as soon as data is received from the second side of the circuit.
• If the length on both the analyzer and the MLT are the same and are correct, and you see occasional overrun errors, this may indicate a bad MLT, a bad cable between the MLT and the computer, or a bad serial port. Contact Technical Support for assistance.
3.7.1 Advanced Hardware Settings
3.7.1.1 Accessing the Notify if Auto Cable Detection Fails
To access t ion: his funct
1. Open the Hardware Settings dialog by choosing Hardware Settings from the Options ontrol window. menu on the C
2. Un‐check the Notify If Auto Detect Fails box. This feature should be left on unless there is a reason why the analyzer cannot detect the cables but can still capture data.
The analyzer automatically checks to see if the cables are present when the software is first started, and every time data capture is initiated. If unchecked, the analyzer still looks for the ables when the program first starts up, but does not check when data capture is initiated. c
3.7.1.2 Disabling Control Signal Interrupts
This option is used as a troubleshooting device on circuits where a control signal lead is toggling too quickly for FTS to keep up with. The result is that the analyzer spends all its time processing signal interrupts and no time updating the user interface, giving the appearance that the computer has frozen. Check this box only on advice of technical support

13
To reac th n : h is optio
he Options menu on the Control 1. Open t window.
2. dware Settings. Select Har
3. Check the Disable Control Signal Interrupts box on the Hardware Settings dialog to disable processing of control signals.
FTS always checks the state of the control signals when retrieving a data byte, so the Breakout Box still shows control signal changes provided data is being received. However, FTS does not capture control signal changes that occur independent of data bytes when interrupt processing is disabled. FTS polls for control signal changes whenever it is not in Use FTS Cables mode in order to catch Ring Indicator changes. This polling still occurs when interrupt processing is disabled, which means that FTS captures control signal changes that occur independent of data, but may not capture them at the exact moment the change occurred. It also means
to miss a chan signal changes state twice in a short period that it is possible for FTS ge if theof time. olling does not occur in Use FTS Cables mode. P
3.7.1.3 Defining UART FIFO Settings
To access t ion : his funct
1. Open the Hardware Settings dialog by choosing Hardware Settings from the Options the Control window. menu on
2. Choose Use Optimal Settings for Serial Data Analysis. This is the default setting. tion are the most accurate with this seTimestamping and control signal informa tting.
3. If you are getting UART overruns, choose Use Windows Device Manager Settings. With this setting, timestamps are not as accurate and some control signal changes may be lost, but it helps reduce or eliminate the loss of data from overruns. For more information, see Performance Notes.
You may need to change the depth of the buffers in order to minimize problems with timestamping and signal changes while allowing for enough of a buffer to eliminate overruns. Note that changes to the buffer depth remains after the analyzer exits.
How to et uffe : s the FIFO b rs in Windows XP
Start button and choose Contr1. Click on the ol Panel.
2. Click on the Performance and Maintenance selection, then the System selection. OR
3. Simply right click the My Computer icon on your desktop and select Properties from the Popup menu.

14
4. On the System Properties dialog, click on the Hardware tab, then click the Device Manager button.
5. Expand the Ports section, and double‐click on the port you want to change to open the erties. Port Prop
6. Click the Port Settings tab on the Communications Port Properties dialog, followed by the Advanced button.
7. Use the slider bars to adjust the level of the transmit and receive buffers. If you are using the analyzer solely to monitor data and not transmit it, then you only need to change the level of the receive buffer.
8. Click OK on all windows to close the windows.
3.7.1.4 Accessing the Serial Port Info Button
To access t ion: his funct
1. Open the Hardware Settings dialog by choosing Hardware Settings from the Options menu on the Control window.
2. Click the Info button to get information on the status of the FIFO buffers for the selected ports. The analyzer provides information on whether the selected ports have FIFO Buffers, and if they do, whether the buffers are enabled.
This information is useful in Spy Mode for determining whether the application being monitored is using the FIFO buffers on the port, which would affect how the data is displayed in Spy Mode. See FIFOs and Spy Mode for more information.
3.8 O I/ Settings
3.8.1 Spy Mode Settings on the I/O Settings Dialog
Most of the settings on the I/O Settings window are grayed out in Spy mode because they are determined by the application using the COM port. The analyzer updates these settings to reflect changes made by the application, allowing you to see the actual settings being used by the application. If you are monitoring framed data, you need to choose a protocol stack in order to ensure that the data is framed correctly. You can also choose whether to monitor both sides of the circuit, or just the DTE or DCE side. You also have the option of choosing to monitor all incoming data, regardless of whether the application you are monitoring is running. You can also choose to monitor only when the application has opened the COM port and is actively communicating through the port. By default, the analyzer monitors all data, all the time, which means that the analyzer may show captured data before you have opened your application. To monitor the port only when the application has opened it, check the Capture Only When Spied Port is Open box on the I/O Settings dialog.

15
3.8.2 Operating Mode ‐ Choosing to Monitor or Source
Monitor Mode
Choose Monitor Both to monitor both sides of your circuit. You can also choose to monitor only one side of the circuit by choosing Monitor DTE or Monitor DCE. If you specified two COM ports in the Hardware Settings window, choose Monitor Both from the pull down list. This means that the analyzer monitors both sides of your circuit. To do this, you must use the routing cable and the monitor head. You can also choose to monitor only one side of the circuit by choosing Monitor DTE or Monitor DCE. If you specified one COM port in the Hardware Settings window, you are able to monitor either the DTE or the DCE side of a circuit, but not both. Choose Monitor DTE or Monitor DCE from the pull down list to specify which side you want to monitor.
Source Mode
The analyzer can act as either a DTE or a DCE device. Choose Source DTE or Source DCE from the pull down menu to specify which type of device you want to emulate. If you have two COM ports, you are able to send data to another device, change the state of the appropriate control signals, and see data and control signal states from the other device. If you have one COM port, you are able to send data to another device and see data sent by the device. If you are emulating a DTE device, you are able to change DTR and RTS , and you are able to see changes made by your DCE device on DSR and CTS , but you are not able to see changes on CD and RI . If you are emulating a DCE device, you can change DSR and CTS, but not CD and RI, and you can see DTR and RTS signal changes coming from your DTE device. You must use the routing cable and the source head when in source mode. The device under test must be connected to the correct side of the source head. See Cable Configuration for
an g up the cables. assist ce on settin
3.8.3 Bit Order
• Choose LSB (least significant bit) first or MSB (most significant bit) first. LSB first is normal, while MSB first is considered "reversed" from normal. This option reverses the order of the bits within each byte.
• All options on the I/O Settings window are valid when in MSB mode except for parity. The parity must be None when using MSB bit order.
• Bit reversal occurs when monitoring and transmitting data. For example, if the analyzer is monitoring data in LSB mode and sees 0000 0001 on the circuit, it displays this as hex 01. In MSB mode, the analyzer reverses the order of the bits as they come in and display this byte as 1000 0000, or hex $80.
16
• When transmitting data, the analyzer reverses the bits before they are sent out over the circuit. For example, if you are transmitting data in LSB mode and you enter the pattern $01, the analyzer sends out 0000 0001. If you are transmitting in MSB mode and you enter the pattern $01, the analyzer bit reverses this and transmit 1000 0000.
• The analyzer remembers what bit order was used to capture the data with. If you create a capture file with the bit order set to MSB, the data always is displayed in that form.
• If you are monitoring HDLC or SDLC data and the bit order is set to MSB, it is he CRC's is not calculated correctly. probable that t
3.8.4 Flow Control
Flow control (sometimes called "handshaking") is only available in source mode. There are four flow control options: None, RTS/CTS, DTR/DSR or Xon/Xoff. The default option is None. If you choose None, th tr . e analyzer does not employ any flow con ol techniquesHardware flow control can be accomplished using either the RTS /CTS pair or DTR /DSR pair. Choose which pair you would like the analyzer to use. To use software flow control, choose the Xon/Xoff option. The analyzer uses the Xon/Xoff characters given in the boxes below the flow control option. These numbers must be specified in hexadecimal (hex) characters. By default, the analyzer uses hex 11 for Xon and
3 fhex 1 or Xoff.
rotocol Stack 3.8.5 Selecting a Custom P
To chan tge he protocol stack:
1. Click on the Custom Protocol Stack button to start the Protocol Stack Wizard.
If you are capturing framed data but did not select a protocol stack before capturing, your data nee s e your data, complete the following steps: d to be framed. To fram
1. Select a protocol stack.
2. Go to the Control window and choose Reframe from the File menu. See Reframing a Function for more information.
3.8.6 I/O Settings Dialog in Capture File Viewer
The I/O Settings dialog only appears when viewing serial data. It displays the settings that were in effect when the file was captured. The window looks different depending on whether you are viewing asynchronous or synchronous data. When using capture file viewer, the I/O Settings dialog is grayed out except for the Custom Protocol Stack button and the Names button.

17
The analyzer knows which protocols were used when the file was captured, and automatically decodes the data in the file according to those protocols. If you need to change the protocol, click the Custom Protocol Stack button to create a custom stack. Click the Names button to change the labels for errors, control signals and the sides displayed in the other windows of the analyzer.
3.8.7 Saving Configurations
3.8.7.1 Saving a Configuration to a File
1. Set up your configuration on the I/O Settings window.
2. If a configuration is already open and you have altered it, go to the File menu and choose Save As; otherwise, click on the Save Settings icon.
3. In the File name box, type a name for your configuration. You do not need to add an extension. the system adds a .cfg extension automatically.
4. By default, the analyzer saves the configuration in the My Configurations directory. Choose a different directory to save the configuration elsewhere. Click here to see how
fault location for configurations. to change the de
5. Click on Save.
If you make a new configuration and do not save it, the system asks you if you want to save your configuration when you exit the program. If you want to save your configuration, choose Save and the Save File dialog box appears. If you do not want to save your onfiguration, choose Cancel. c
3.8.7.2 Opening a Saved Configuration File
1. Click on the Open Configuration icon, or choose Open Configuration from the File menu on the I/O Settings dialog. If other configurations have been used recently, a menu listing the last four configurations used is displayed.
2. Select a recent configuration file, or choose Open to load an unlisted configuration.
3. If you have saved your configurations in the default directory, they are listed in the are saved elsewhere. window. Choose a different directory if your configurations
4. Select the configuration you want to use, and click on Open.
Configurations are saved with a .cfg extension, and are located in the C:\Program Files\Common Files\FTE\My Configurations directory by default. The name of the open configuration file is displayed at the top of the Set I/O Configuration indow. If no configuration file is open, "Untitled" is displayed. w

18
3.9 ynS upchronous Serial Hardware Set
3.9.1 Defining RS‐232 ComProbe I/O Settings
Before you can begin capturing data, you must tell indicate whether you intend to monitor or transmit data, and at what data rate. You give FTS this information in the I/O Settings window.
1. Click on the I/O Settings icon on the Control window toolbar, or choose I/O Settings from the Options menu.
2. In the Operating Mode box, choose Monitor Both. If you want to transmit data, select either Source DTE or Source DCE.
3. If your circuit is asynchronous, set your Communication Mode to Async.
4. If your circuit is synchronous, set the Communication Mode to either Sync (NRZ External Clock) or Sync (NRZI External Clock). Do not choose Internal Clock when monitoring synchronous data. Set the Sync Mode to Monosync, Bisync, or HDLC/SDLC. Choose HDLC/SDLC if you are monitoring HDLC, SDLC, Frame Relay or other protocol that uses hex 7e as the framing byte. If your circuit is Monosync or Bisync, you also need to set the parity and sync characters, and tell FTS when to strip sync characters and when to drop sync.
5. Set the baud, parity, word length and stop bits to the correct settings for both sides of the circuit.
6. [optional] Click the Custom Protocol Stack button to select a protocol stack. Select the correct stack (stacks are usually named by their base layer) and click Finish. To set up a stack not listed, select the "Build Your Own" option from the top of the list and click Next. For more information on how to set up a custom stack see Creating and Removing a Custom Stack.
7. Click the Close button on the I/O Settings window.
3.9.2 I/O Settings
Before you can begin capturing data, you must tell indicate data rate and several other variables. You give FTS this information in the I/O Settings window.

19
1. Click on the I/O Settings icon on the Control window toolbar, or choose I/O from the OptionSettings s menu.
the Da (bps), select a rate from 300 t 60 ique data rate. 2. For ta Rate o 921, 0 or enter a un
rk or Non . 3. For Parity, select None, Odd, Even, Ma Space. e is the default
Data Bits 4. For (size of the bits), select 5, 6, 7, or 8. Eight is the default.
f the bit) select 1, 1.5, or 2.5. For Stop Bits (end point o One is the default
u want to 6. If yo disable the Control Signal Interrupts, select the checkbox.
ficant Bit). 7. For Bit Order, select LSB (Least Significant Bit) or MSB (Most Signi
8. For Monitor, select Capture DTE, Capture DCE, or Both (DCE & TE)
9. Click the OK button on the I/O Settings window top close the dialog.
3.10 Connecting Cables
3.10.1 Cable Configuration
The cables included with the analyzer are: • a routing cable, which is a y‐cable with a 25‐pin connector on one end and two 9‐pin
led DTE and DCE on the other ends, used to connect to the monitor connectors labeor source head
• a monitor head• a source head • two 25‐pin female to 9‐pin male adapters• one 25‐pin male to 9‐pin female adapter

20
The 25‐pin female adapters are used to connect the 9‐pin routing cable connectors to 25‐pin serial ports. One of the 25‐pin female adapters can be used in conjunction with the 25‐pin male adapter to connect the monitor head to a 9‐pin circuit. All cables have their name molded into the plastic on one end.
3.10.2 Creating a Dual Port Monitor Mode Cable Configuration
1. Attach the DTE connector of the routing cable to one COM port, and the DCE connector
to the other COM port. Adapters are provided for attaching the 9‐pin connectors to 25‐pin serial ports.
2. On the end of the routing cable, attach the monitor head. The monitor head has the words "Monitor Head" molded into the plastic on the connector that hooks up to the routing cable.
3. Place the monitor head between the two devices you wish to monitor. If you have a y‐cable connecting your two devices, you can also connect the monitor head to the third end of the y‐cable. Adapters are provided for attaching the 25‐pin monitor head to a 9‐pin circuit.
Note: the monitor head is a straight‐through RS‐232 cable. You can insert it between your two devices and they can communicate with each other through the monitor head, whether or not the analyzer is running.
3.10.3 Creating a Dual Port Source DCE Mode Cable Configuration
1. Attach the DTE connector of the routing cable to one COM port, and the DCE connector
to the other COM port. Adapters are provided for attaching the 9‐pin connectors to 25‐pin serial ports.
21
2. On the end of the routing cable, attach the source head. The source head has the words "Source Head" molded into the plastic on the connector that hooks up to the routing cable. It also has the words "DTE" and "DCE" on the other end, with arrows pointing to each side of the source head.
3. Connect your DTE device to the side of the source head marked "DCE ". This arrow means that your DCE data is coming out of this side of the source head, and so that is the side your DTE device needs to be connected to. An adapter is provided for attaching the 25‐pin source head to a 9‐pin circuit.
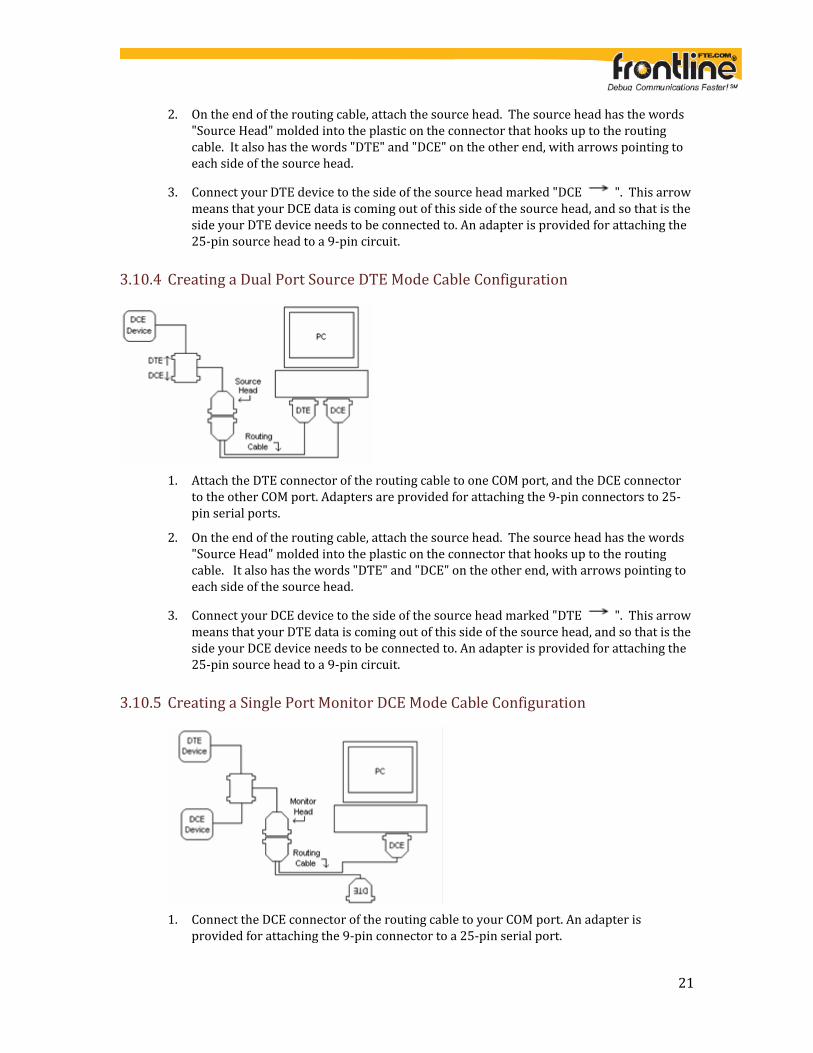
3.10.4 Creating a Dual Port Source DTE Mode Cable Configuration
1. Attach the DTE connector of the routing cable to one COM port, and the DCE connector
to the other COM port. Adapters are provided for attaching the 9‐pin connectors to 25‐pin serial ports.
2. On the end of the routing cable, attach the source head. The source head has the words "Source Head" molded into the plastic on the connector that hooks up to the routing cable. It also has the words "DTE" and "DCE" on the other end, with arrows pointing to each side of the source head.
3. Connect your DCE device to the side of the source head marked "DTE ". This arrow means that your DTE data is coming out of this side of the source head, and so that is the side your DCE device needs to be connected to. An adapter is provided for attaching the 25‐pin source head to a 9‐pin circuit.
3.10.5 Creating a Single Port Monitor DCE Mode Cable Configuration
1. Connect the DCE connector of the routing cable to your COM port. An adapter is
provided for attaching the 9‐pin connector to a 25‐pin serial port.

2 2
2. On the end of the routing cable, attach the monitor head.
3. If you are monitoring one side of a circuit, you can connect the monitor head between your two devices. The monitor head is a straight‐through RS‐232 cable, so your 2
. devices are still be able to communicate, but the analyzer only monitors the DCE side
4. If you are monitoring a DCE device only, connect the DCE device to either side of the monitor head. It does not matter which side you choose. An adapter is provided for attaching the 25‐pin monitor head to a 9‐pin circuit.
Note:
If you are monitoring a circuit, you can switch to monitoring DTE by going into the Set I/O Parameters screen and switching to Monitor DTE mode. Then disconnect the DCE head of he routing cable from your COM port and connect the DTE head, and you see DTE data. You o not need to do anything with the monitor head cable. td
3.10.6 Creating a Single Port Monitor DTE Mode Cable Configuration
1. Connect the DTE connector of the routing cable to your COM port. An adapter is
ial port. provided for attaching the 9‐pin connector to a 25‐pin ser
2. On the end of the routing cable, attach the monitor head.
3. If you are monitoring one side of a circuit, you can connect the monitor head between your two devices. The monitor head is a straight‐through RS‐232 cable, so your 2 devices still communicate, but the analyzer only monitors the DTE side.
4. If you are monitoring a DTE device only, connect the DTE device to either side of the monitor head. It does not matter which side you choose. An adapter is provided for attaching the 25‐pin monitor head to a 9‐pin circuit.
Note:
If you are monitoring a circuit, you can switch to monitoring DCE by going to the I/O Settings window and switching to Monitor DCE mode. Then disconnect the DTE head of the routing cable from your COM port and connect the DCE head, and you see DCE data. You do ot need to do anything with the monitor head cable. n

23
3.10.7 Creating a Single Port Source DCE Mode Cable Configuration
1. Connect the DTE connector of the routing cable to your COM port. Even though you are
in source DCE mode, you need to use the DTE connector on the routing cable. An adapter serial port. is provided for attaching the 9‐pin connector to a 25‐pin
2. On the end of the routing cable, attach the source head.
3. Connect your DTE device to the side of the source head marked "DCE ". This arrow means that your DCE data is coming out of this side of the source head, and so that is the side your DTE device needs to be connected to. An adapter is provided for attaching the 25‐pin source head to a 9‐pin circuit.
Note:
You are able to send data to your DTE device and set the DCE control signals, but the nalyzer is not able to see any responses from your DTE device. a
3.10.8 Creating a Single Port Source DTE Mode Cable Configuration
1. Connect the DTE connector of the routing cable to your COM port. An adapter is
erial port. provided for attaching the 9‐pin connector to a 25‐pin s
2. On the end of the routing cable, attach the source head.
3. Connect your DCE device to the side of the source head marked "DTE ". This arrow means that your DTE data is coming out of this side of the source head, and so that is the side your DCE device needs to be connected to. An adapter is provided for attaching the 25‐pin source head to a 9‐pin circuit.

24
Note:
You are able to send data to your DCE device and set the DTE control signals, but the nalyzer is able to see any responses from your DCE device. a
3.10.9 Generic Channel Dependent Decodes Setup
Channel dependent decodes are decodes for protocols where frames do not contain information about what type of data it contains. A common situation in which this occurs are simple master/slave circuits, where there is one master which sends commands and a slave responds to the most recent command. In these types of protocols, there may not be any indication that the data is in the form of a command or is a response to a command. The decodes for each are usually different, but without a field in the data specifying which is being carried, the analyzer has no way to know whether to use the decode for a command frame or a response frame. Usually the only way to know which decode to use is to assume that master data is always coming from the DTE side and the slave data is always on the DCE side (or vice versa). This often means the analyzer must be connected to the circuit in such a way that master data is on TxD and slave data is on RxD. These diagrams assume the two devices are a master and a slave, but they might be a host and a controller or two PCs or any other type of device. The diagrams assume that the data from the master must be on the DTE channel and data from the slave on the DCE channel. This may differ for your particular protocol.
DTE device connected to DCE device
DTE device connected to another DTE device with a null modem cable
3.10.10 Using a Converter
If your circuit is RS‐422, RS‐485 or conforms to any other electrical standard other than RS‐232, you need a converter to change the voltage levels to RS‐232. If the converter has a standard RS‐232 connector, then the simplest thing to do is to connect the analyzer's cable set to the two serial ports on the PC running the analyzer, and connect the converter's RS‐232 connector to the Monitor or Source Head.

25
If you need to connect your circuit directly to the PC without using the cable set (a scenario common when developing hardware or software), here's what you need to do. In order for the analyzer to correctly capture data when not using the cable set, the TxD, RxD and Signal Ground signals need to be fed to the proper pins on the serial ports of the PC running the analyzer. In this scenario, the analyzer is not able to monitor control signals.
1. Connect TxD and Signal Ground to RxD and Signal Ground of one serial port. RxD is usually pin 2 on 9‐pin serial ports, and Signal Ground is pin 7. (Click for RS‐232 Pin‐outs.)
d serial port. 2. Connect RxD and Signal Ground to RxD and Signal Ground of the secon
3. It is important that the data signals both go to RxD on each serial port.
4. When you run the analyzer, open the Hardware Settings window and un‐check the "Notify if Auto Detect Fails" checkbox. This prevents the analyzer from displaying a message about not finding the cables every time data capture is started. You'll still get the message once when the analyzer starts up for the first time.
3.10.11 RS‐232 Pin‐outs
25pin connector
Pin Name Abbreviation
1 Frame Ground FG
2 Transmit Data TxD
3 Receive Data RxD
4 Request To Send RTS
5 Clear to Send CTS
6 Data Set Ready DSR
7 Signal Ground GND
8 Carrier Detect CD or DCD
20 Data Terminal Read DTR
22 Ring Indicator RI

26
9pin connector
Pin Name Abbreviation
1 Carrier Detect CD or DCD
2 Receive Data RxD
3 Transmit Data TxD
4 Data Terminal Ready DTR
5 Signal Ground GND
6 Data Set Ready DSR
7 Request To Send RTS
8 Clear To Send CTS
9 Ring Indicator RI
3.11 Port Assignments
3.11.1 Adding or Changing Port Assignments
The analyzer autotraverses the stack from TCP, UDP and IPX based on the source or destination port number. Many systems use user‐defined port numbers for both standard and custom protocols. Here’s how to tell the analyzer about a custom port assignment on the system you are monitoring.
Add a New Port Assignment
1. Choose Set Initial Decoder Parameters from the Options menu on the Control window.
P2. Click the TC DP or IPX for those protocols).
the Sin the Port Number box.
tab (or U
3. Choose gle Port radio button, and enter the port number in
toc4. In the Pro ol drop‐down list, choose the protocol to traverse to.
5. Click the Add button. The system adds new entry to the bottom of the port number list.
Modify n g Port Assignment a Existin
1. Choose Set Initial Decoder Parameters from the Options menu on the Control window.

27
2. Click the TCP tab (or UDP or IPX for those protocols).
3. Select (click on and highlight) the port assignment to modify.
e port4. Change th number and/or choose the protocol to traverse to.
changes in5. Click the Modify button. The system displays the port number list.
6. You can also specify a range of ports. Select the Port Range radio button and specify the s inclu ive. starting and ending port numbers. The range i s
7. To remove an entry, select the entry and click Delete.
Two considerations are:
• atch The analyzer traverses an entry if either the source or destination port m• The analyzer processes port number entries in order from top to bottom
If you need to move an entry to ensure it is processed before or after another entry, select the entry in the list and then click the Move Up or Move Down buttons.
3.12 Node Database
3.12.1 Using The Node Database Manager
In order to correctly decode Modbus TCP or ROC Plus over Ethernet, the FTS software needs to know the IP Addresses of the Master and Slave devices. The system allows the user to define any number of IP Address and Node Type combinations and save them in a template for later use. The Template function provides the capacity to create multiple templates that contain different node assignments. This capability allows the user to maintain individual templates for each network monitored. Applying a template containing the node assignments necessary to monitor transmissions particular to an individual network, enhances the
ta. efficiency of the analyzer to decode da
3.12.2 Adding a Node Assignment
This procedure adds one or more node assignments to an existing Node Assignment Template. To create a new template, see Add e Assiging a Nod nment Template.
1. Select Set Initial Decoder Parameters from the Options menu on the Control
window, the Frame Display window, or the Protocol Navigator window to display the Set Initial Decoder Parameters dialog.
2. Click on the tab of the desired protocol (Modbus TCP or ROC Plus over Ethernet). The dialog displays the most recently selected template content in the list at the bottom of the tab.

28
3. If the node assignment must reside in another template, then click the Open File icon late from t list. and select the desired temp he Popup
P Address n the IP Address text box. 4. Enter the I i
5. Select the Node Type.
6. Click the Add button above the list. The system displays the new node assignment in the ssignm ded. list window. Repeat steps 3 and 4 until all desired node a ents are ad
the Sav7. Click the Save icon at the top of the dialog to display e As dialog.
8. Ensure that the name of the template is listed in the Save As text box and click Ok. The ispl e system d ays a dialog asking for confirmation of the change to the existing templat
9. Click the Yes button. The system saves the new node assignment to the template and Sacloses the ve As dialog.
10. Click the Ok button on the Set Initial Decoder Parameters dialog to apply the template and close the dialog.
3.12.3 o g a Node Assignment M difyin
1. Select Set Initial Decoder Parameters from the Options menu on the Control window, the Frame Display window, or the Protocol Navigator window to display the Set Initial Decoder Parameters dialog.
2. Click on the tab of the desired protocol (Modbus TCP or ROC Plus over Ethernet). The dialog displays the most recently selected template content in the list at the bottom of the tab. If the node assignment to be modified resides in another template, then click the
he desired ist. Open File icon and select t template from the Popup l
3. Edit the IP Address in the IP Address text box and/or Select the Node Type.
4. Click the Modify button above the list. The system displays the modified node assignment in the list window. Repeat steps 3 and 4 until all desired node assignments are modified.
the Sav5. Click the Save icon at the top of the dialog to display e As dialog.
6. Ensure that the name of the template is listed in the Save As text box and click Ok. The ispl e system d ays a dialog asking for confirmation of the change to the existing templat
7. Click the Yes button. The system saves the modified node assignment to the template s t g. and close he Save As dialo
8. Click the Ok button on the Set Initial Decoder Parameters dialog to apply the template and close the dialog.
3.12.4 Deleting a Node Assignment
1. Select Set Initial Decoder Parameters from the Options menu on the Control
window, the Frame Display window, or the Protocol Navigator window to display the Set Initial Decoder Parameters dialog.
2. Click on the tab of the desired protocol (Modbus TCP or ROC Plus over Ethernet). The dialog displays the most recently selected template content in the list at the bottom of

29
the tab. If the node assignment marked for deletion resides in another template, then click the Open File button and select the desired template from the Popup list.
3. Select (click on and highlight) the node assignment marked for deletion from the list and click the Delete button above the list. The system removes the selected node assignment from the list.
ay the S4. Click the Save button at the top of the dialog to displ ave As dialog.
5. Ensure that the name of the template is listed in the Save As text box and click Ok. The ispl e exist late. system d ays a dialog asking for confirmation of the change to th ing temp
Ye stem saves the template and c6. Click the s button. The sy loses the Save As dialog.
7. Click the Ok button on the Set Initial Decoder Parameters dialog to apply the template and close the dialog.
3.12.5 Selecting and Applying a Node Assignment Template
1. Select Set Initial Decoder Parameters from the Options menu on the Control
window, the Frame Display window, or the Protocol Navigator window to display the Set Initial Decoder Parameters dialog.
2. Click on the tab of the desired protocol (Modbus TCP or ROC Plus over Ethernet). The dialog displays the most recently selected template content in the list at the bottom of the tab. If the template displayed is the desired template , then skip to step 4. If it is not, then continue with step 3.
3. Click the Open File icon at the top of the dialog and select the desired template from the Popup list. The system displays the content of the selected template in the list at the
f thbottom o e dialog.
4. Click the OK button to apply the selected template and exit the Set Initial Decoder Parameters dialog.
3.12.6 Adding a Node Assignment Template
This procedure adds a Node Assignment Template to the system and saves it for later use. A template is a collection of node assignments required to completely decode communications between multiple devices. To add a o ignment to an existing tem n de ass plate, see g a Node AssignmenAddin t.
1. Select Set Initial Decoder Parameters from the Options menu on the Control
window, the Frame Display window, or the Protocol Navigator window to display the Set Initial Decoder Parameters dialog.
2. Click on the tab of the desired protocol (Modbus TCP or ROC Plus over Ethernet). The dialog displays the most recently selected template content in the list at the bottom of the tab.
con at the dialog to clear the list. 3. Click the Reset to Defaults i top of the
4. Enter the IP Address in the IP Address text box.

30
5. Select the Node Type.
6. Click the Add button above the list. The system displays the new node assignment in the ssignm ded. list window. Repeat steps 4 and 5 until all desired node a ents are ad
is7. Click the Save icon at the top of the dialog to d play the Save As dialog.
8. Enter a name for the new template and click Ok. The system saves the template and Sacloses the ve As dialog.
9. Click the Ok button on the Set Initial Decoder Parameters dialog to apply the template and close the dialog.
3.12.7 Deleting a Node Assignment Template
1. Select Set Initial Decoder Parameters from the Options menu on the Control
window, the Frame Display window, or the Protocol Navigator window to display the Set Initial Decoder Parameters dialog.
2. Click on the tab of the desired protocol (Modbus TCP or ROC Plus over Ethernet). The dialog displays the most recently selected template content in the list at the bottom of the tab.
3. Click the Delete icon at the top of the dialog. The system displays the Delete dialog with a list of saved templates.
4. Select (click on and highlight) the template marked for deletion and click the Delete button on the Delete dialog.
lected5. The system removes the se template from the list of saved templates.
6. Click the Ok button on the Delete dialog to complete the deletion process and close the loDelete dia g.
7. Click the Ok button on the Set Initial Decoder Parameters dialog to apply the deletion and close the dialog.
3.13 Decoder Parameters
Some protocol decoders have user‐defined parameters. These are protocols where some information cannot be discovered by looking at the data and must be entered by the user in order for the decoder to correctly decode the data. For example, such information might be a field where the length is either 3 or 4 bytes, and which length is being used is a system option. If you have decoders loaded which require decoder parameters, a window with one tab for every decoder that requires parameters appears the first time the decoder is loaded. For help on setting the parameters, click the Help button on each tab to get help information specific to that decoder. If you need to change the parameters later,

31
• Choose Set Initial Decoder Parameters from the Options menu on the Control, Frame Display or Protocol Navigator windows.
• Each entry in the Set Initial Decoder Parameters dialog takes effect from the beginning of the capture onward or until redefined in the Set Subsequent Decoder Parameters dialog.
The Set Subsequent Decoder Parameters dialog allows the user to override an existing parameter at any frame in the capture where the parameter is used.
If you h meter ave a parameter in effect and wish to change that para• Select the frame where the change should take effect • Select Set Subsequent Decoder Parameters from the Options menu, and make the
needed changes. • Each entry in the Set Subsequent Decoder Parameters dialog takes effect from the
specified frame onward or until redefined in this dialog on a later frame. If you do not have decoders loaded that require parameters, the menu item does not appear nd you don't need to worry about this feature. a
3.13.1 A2DP Decoder Parameters
3.13.1.1 Selecting A2DP Decoder Parameters
The decoding of SBC frames in the A2DP decoder can be slow if the analyzer decodes all the parts (the header, the scale factor and the audio samples) of the frame in detail. You can increase the decoding speed by decoding only the header fields and not all the parts if they are not required. You can select the detail‐level of decoding using the Set Initial Decoder arameters dialog. P
Note: By default the decoder decodes only the header fields of the frame.
1. Select Set Initial Decoder Parameters from the Options menu on the Control window, the Frame Display window, or the Protocol Navigator window to display the Set Initial
mete alog. Decoder Para rs di
2. Click on the A2DP tab.
3. Choose the desired decoding method.
4. Click the OK button to apply the selection and exit the Set Initial Decoder Parameters dialog.

32
3.13.2 Security Parameters
3.13.2.1 Security Key
On the Set Initial Decoder Parameters dialog, the security tab allows specifying a key for software decryption of 802.11 frames. One can enter two types of keys. The types are a
Access) pre‐shared key and a WEP (Wired Equivalent Privacy) key. WPA (Wi‐Fi Protected
To access this dialog: 1. Go to the Options menu on the Control window and choose Set Initial Decoder
s. Parameter
2. Select the Security tab.
There are three types of types of encrypted data on the security tab, each one selectable via a radio button.
• WPA, WPA2 (Wi‐Fi Protected Access), and WEP (Wired Equivalent Privacy) data that is transmitted over a Wi‐Fi communications link. There are two values you have to enter for the WPA/WPA2 and WEP to be decrypted properly.
• The Bluetooth® alternative MAC/PHY (AMP) enables Bluetooth to support data rates up to 24Mbps by using additional wireless radio technologies.
• The Pre‐Shared Key: The third way is to specify the pre‐shared key in its raw hex forum. This is a 32 byte hex number. Note: When you use WPA/WPA2, the Pre‐Shared key is generated automatically.
Depending on which Encrypted Data type you select, the options for entering data on the rest of the dialog varies.

33
3.13.3 L2CAP Decoder Parameters
There may be times when the context for decoding a frame is missing. For example, if the analyzer captured a response frame but did not capture the command frame, then the decode for the response may be incomplete. The Set Initial Decoder Parameters dialog provides a means to supply the context for any frame. The system allows the user to define any number of parameters and save them in a Parameter Template for later use. To access this ial d og:
1. Select Set Initial Decoder Parameters from the Options menu on the Control
window, the Frame Display window, or the Protocol Navigator window to display the Set Initial Decoder Parameters dialog.
The Template function provides the capacity to create multiple templates that contain different parameters. This capability allows the user to maintain individual templates for each Bluetooth® network monitored. Applying a template containing only those parameters necessary to decode transmissions particular to an individual network, enhances the efficiency of the analyzer to decode data. Each entry in the Set Initial Decoder Parameters dialog takes effect from the beginning of
g. the capture onward or until redefined in the Set Subsequent Decoder Parameters dialoThe L2CAP Set Initial Decoder Parameters dialog requires the following user inputs to complete a Parameter :
• Stream ies the role of the device initiating the frame (master or slave) This identif
• Channel ID r 0 through 78 The channel numbe
• Connection Handle sical connection values for the devices This is the actual phy
• Data Source Number When only one data source is employed, set this parameter to 0 (zero), otherwise,
ed data source set to the desir• Carries (PSM)
Select th t L2CAP traverses to from the following: e protocol tha• AMP Manager • Test Manager AMP• SDP • MM RFCO• TCS • LPMP • BNEP • HCRP Control

34
• P Data HCR• HID • AVCTP • AVDTP• CMTP • MCAP Control • 3 20601 IEEE P1107• ‐Raw Data‐
3.13.3.1 L2CAP Parameters
3.13.3.1.1 ADDING AN L2CAP PARAMETER
This procedure adds one or more parameters to an existing Parameter Template. To create a new te p ee m late, s plateAdding a Parameter Tem .
1. Select Set Initial Decoder Parameters from the Options menu on the Control window
, the Frame Display window , or the Protocol Navigator window to display the Set Initial Decoder Parameters dialog.
2. Click on the L2CAP tab. The dialog displays the most recently selected template content in the Initial Connections list at the top of the tab. If the parameter must reside in another template , then click the Open File icon and select the desired template from the Popup list.
3. Select the Stream. This identifies the role of the device initiating the frame (master or slave).
4. Enter the Channel ID. Enter the channel number 0 through 78, it can be entered as a decimal or a hexadecimal.
5. Enter the Connection Handle. This is the L2CAP address.
6. Enter the Data Source Number. When only one data source is employed, set this parameter to 0 (zero), otherwise, set to the desired data source.
7. Select the Carries (PSM). Select the protocol that L2CAP traverses to from the list.
8. Click the Add button. The system displays the new parameter in the Initial Connection window. Repeat steps 3

35
through 8 until all desired parameters are added.
9. Click the Save icon at the top of the dialog to display the Save As dialog.
10. Ensure that the name of the template is listed in the Save As text box and click Ok. The system displays a dialog asking for confirmation of the change to the existing template.
11. Click the Yes button. The system saves the new parameter to the template and closes the Save As dialog.
12. Click the Ok button on the Set Initial Decoder Parameters dialog to apply the template and close the dialog.
3.13.4 RFCOMM Decoder Parameters
There may be times when the context for decoding a frame is missing. For example, if the analyzer captured a response frame, but did not capture the command frame, then the decode for the response may be incomplete. The Set Initial Decoder Parameters dialog provides a means to supply the context for any frame. The system allows the user to define any num e rameters and save them in b r of pa Parameter Templates for later use.
1. Select Set Initial Decoder Parameters from the Options menu on the Control
window, the Frame Display window, or the Protocol Navigator window to display the Set Initial Decoder Parameters dialog.
The Template function provides the capacity to create multiple templates that contain different parameters. This capability allows the user to maintain individual templates for each Bluetooth® network monitored. Applying a template containing only those parameters necessary to decode transmissions particular to an individual network, enhances the efficiency of the analyzer to decode data. Each entry in the Set Initial Decoder Parameters dialog takes effect from the beginning of the capture onward or until redefined in the Set Subsequent Decoder Parameters dialog. The RFCOMM Set Initial Decoder Parameters dialog requires the following user inputs to complete a parameter:
• Stream e role of the device initiating the frame (master or slave) This identifies th
• Server Channel hannel number 0 through 78 The c
• DLCI This is the Data Link Connection Identifier, and identifies the ongoing connection between a client and a server

36
• Data Source Number When only one data source is employed, set this parameter to 0 (zero), otherwise,
d data source set to the desire• Carries (UUID)
Select from the list to apply the Universal Unique Identifier (UUID) of the application layer th OMM traverses to from the following: at RFC
• X OBE• SPP • yncPPP encap as• set Head• FAX • Hands Free • ccess SIM A• VCP • UDI • ‐Raw Data‐
3.13.5 Decoder Parameter Templates
3.13.5.1 Adding a New or Saving an Existing Template
A template is a collection of parameters required to completely decode communications between multiple devices. This procedure adds a template to the system and saves it for later us e:
1. Click the Save button at the top of the Set Initial Decoder Parameters dialog to display the Save As dialog.
2. Enter a name for the new template and click Ok.
The sys mte saves the template and closes the Save As dialog.
3. Click the Ok button on the Set Initial Decoder Parameters dialog to apply the template and close the dialog.
Save Changes to a Template
This pro edc ure saves changes to parameters in an existing template. 1. After making changes to parameter settings in a user defined template, click the Save
button at the top of the Set Initial Decoder Parameters dialog to display the Save As dialog.
2. Ensure that the name of the template is listed in the Save As text box and click Ok.
The system displays a dialog asking for confirmation of the change to the existing template.
3. Click the Yes button.

37
The sys mte saves the parameter changes to the template and closes the Save As dialog.
4. Click the Ok button on the Set Initial Decoder Parameters dialog to apply the template and close the dialog.
3.13.5.2 Deleting a Template
1. After opening the Set Initial Decoder Parameters dialog click the Delete button at the top of the dialog.
The system displays the Delete dialog with a list of saved templates.
2. e Select (click on and highlight) the template marked for deletion and click the Deletbutton on the Delete dialog.
The system removes the selected template from the list of saved templates.
3. Click the Ok button on the Delete dialog to complete the deletion process and close the Delete dialog.
4. Click the Ok button on the Set Initial Decoder Parameters dialog to apply the deletion and close the dialog.
3.14 Spy Mode
Spy Mode lets you run the analyzer on a computer, and "spy" on the data going in and out of a COM port or internal modem. This means that you can run both the analyzer and a communications application on the same computer, and use the analyzer to monitor the conversation between the application and another device. Since internal modems look like COM ports to the computer, the analyzer can monitor data passing through an internal modem as well as a regular COM port. There are some limitations on using Spy Mode. the analyzer uses a custom version of the standard serial device driver in order to "spy" on COM ports and internal modems. This means that the analyzer must be started before the communications application to ensure that the analyzer's driver is being used by both the analyzer and the application. As a corollary, the port you are monitoring must normally use the standard serial driver, and not a custom driver. To ente pr S y Mode, you must follow the steps below in the order given.
1. Start the analyzer. The analyzer must be started before the application you are monitoring is started, or the application does not use the correct driver and the analyzer is not able to monitor the port.
ntr l window, choose Hardware Settings. 2. From the Options menu on the Co o
3. Click on the radio button labeled Spy.
itor. 4. Select the COM port you want to mon
5. Exit the Hardware Settings window.
6. Start the application. Be sure to have the application use the same COM port as the one chosen for the analyzer.

38
7. Monitor data.
8. Close your application when finished. If you want to monitor another application, repeat steps 6 ‐ 8.
9. Close the analyzer.
It is important to follow the steps in the order given because this ensures that the analyzer's driver is the one being used by the application you are monitoring. Please note that the analyzer's driver is designed to behave like the standard serial driver when used by any other application. However, because it is not the standard serial driver, total compatibility cannot be guaranteed. See The FTS Serial Driver for more information. he use of FIFO buffers may cause incorrectly sequenced data when in Spy Mode. T
3.14.1 Spy Mode Settings on the I/O Settings Dialog
Most of the settings on the I/O Settings window are grayed out in Spy mode because they are determined by the application using the COM port. The analyzer updates these settings to reflect changes made by the application, allowing you to see the actual settings being used by the application. If you are monitoring framed data, you need to choose a protocol stack in order to ensure that the data is framed correctly. You can also choose whether to monitor both sides of the circuit, or just the DTE or DCE side. You also have the option of choosing to monitor all incoming data, regardless of whether the application you are monitoring is running. You can also choose to monitor only when the application has opened the COM port and is actively communicating through the port. By default, the analyzer monitors all data, all the time, which means that the analyzer may show captured data before you have opened your application. To monitor the port only when the application has opened it, check the Capture nly When Spied Port is Open box on the I/O Settings dialog. O
3.14.2 FIFOs and Spy
The 8250 UART generates an interrupt every time a byte enters the UART. If the UART is receiving data at a high rate of speed, it generates frequent interrupts which the central processor has to deal with, leaving the central processor less time for other tasks. If the central processor cannot retrieve the bytes quickly enough, data is lost as new data overwrites the information stored in the UART. The solution to this problem was the development of new UART chips that had buffers. The 16550 UART, one of the most common UARTs currently in use, has a 16 byte buffer. The buffer operates on the First In, First Out (FIFO) principle. The first byte in the buffer is the first byte to go out of the buffer. The buffer allows the UART to store bytes until a specified number of bytes have come in, at which point it generates an interrupt telling the central

39
processor to retrieve the data. The ability to store bytes means that the UART is not generating as many interrupts, giving the central processor more time for other tasks. There are two problems with the buffering system and Spy mode. One is that data may not be timestamped accurately, and the other is that control signal states may not be correct. the analyzer timestamps the byte and records the state of the control signals at the time it retrieves the byte from the UART. If the buffers are being used, an interrupt is generated until several bytes have already come in, possibly resulting in incorrect timestamps and signal states. The analyzer solves the problem by telling the UART to generate an interrupt every time a byte comes in, but the analyzer cannot do this when operating in Spy mode. In Spy mode, the application being monitored has control of the UART and specifies how the buffers is used. The result is that the captured data may not be completely accurate. If you are using Spy mode, we recommend turning off the FIFOs on the UART if accurate ecording of timestamps or control signal states is important. r
3.14.3 Turning Off the FIFO Buffers
In Wind wo s XP
Start button and choose Contr1. Click on the ol Panel.
2. Click on the Performance and Maintenance selection, then the System selection. OR: Simply right click the My Computer icon on your desktop and select Properties from the
Popup menu.
3. On the System Properties dialog, click on the Hardware tab, then click the Device Manager button.
4. Expand the Ports section, and double‐click on the port you want to change to open the erties. Port Prop
5. Click the Port Settings tab on the Communications Port Properties dialog, followed by the Advanced button.
ires 16550 compatible UART). 6. Un‐check the box labeled Use FIFO buffers (requ
7. Click OK on all windows to close the windows.
8. Follow this same process to turn the FIFOs back on.

40
3.15 Modbus Special Instructions
3.15.1 Modbus Register Display Format Settings
Modbus protocol messages do not provide data formatting information but simply transmit holding and input registers as byte streams. The Modbus Register Display Settings dialog provides a method for users to define display formats to be utilized when displaying the
rs. values in these registeTo access this dialog:
1. Go to the Options menu on the Control window and choose Set Initial Decoder s Parameter
2. Select the Modbus tab.
3. To add a new entry, fill in the fields and click the Add button. Double‐clicking a setting, copies its values to the input fields.
4. To replace a setting with a new setting created from the input fields, click the setting to replace and then click the Modify button.
When you close a capture file, you are asked whether you want to save the current register settings t ure file: in o it. To save settings independent of a specific capt
1. Type any string in the "Apply Template" field and click Save.
2. To restore those settings to the dialog, select the desired setting in the "Apply Template" drop down list.
New settings do not take effect in a currently opened capture file until the frame display is losed and then reopened. c
Register Display Settings
• Default Display Format_Bits
This field specifies the default display format for registers that have no user defined setting (such registers are always assumed to be 2 bytes long). The default display format is limited to single‐register display formats to prevent implicit register range overlap and to ensure that explicitly defining a setting in which one display format item uses multiple registers does not change the locations of subsequent default settings.
• Station Address
The IP Address or Station Address field (its name changes to reflect the loaded decoder) is used to enter the desired IP or station address for each setting. Enter an asterisk to specify that a setting applies to all IP or station addresses. Station address ranges are from 0 to 248 and IP address ranges can be any valid IP Address.
• Register Type

41
The Register Type field specifies the type of register, either HOLDING or INPUT. • Bytes Per Register
This field defaults to 2, indicating that standard Modicon registers are 2 bytes each. If you are dealing with a third party implementation of Modbus, you may need to adjust this field to reflect the actual number of bytes in a single register.
• Register Start Address
Enter the address of the first register you want to specify settings for. • Display Format_Bits
The Display Format_Bits field specifies the desired display format. Display formats ASCII and HEX are variable‐length and display a char or hex byte respectively for each byte in a register. The other display formats (INT_16, FLOAT_32, etc) have a bit count suffix in their names and use as many registers as they need, based on the bytes per register field. Choose a format for the specified register range.
• Length
This field is the desired number of data items (e.g. INT_32s), not the number of registers. The number of registers are calculated and displayed in the text description.
Example
If you want to specify Station 3's input registers 0‐99 as INT_16s, you would enter 3 for the Station Address, INPUT for the Register Type, 0 for the Start Address, 2 for Bytes Per Register, INT_16 for the Display Format and 100 for the Length, indicating that you have 00 INT_16s starting at Input Register Address 0 where each register is 2 bytes long. 1
3.15.2 Setup For Modbus RTU and ASCII
Modbus ASCII and Modbus RTU protocols have three selections on the launcher menu. The appropriate selection depends upon physical characteristics of your network. If your system is running over a physical layer that is 2 wire RS‐422/485, select either the Modbus RTU on 2Wire RS422/485 or the Modbus ASCII on 2Wire RS422/485, depending upon which protocol your system is using. In this case there are no special wire tapping instructions. If your system is not a 2 wire RS422/485 system, you must select the correct launcher item based upon the following information. There are two decodes for Modbus RTU: Modbus RTU Master and Modbus RTU Slave. Similarly, there are two decodes for Modbus ASCII: Modbus ASCII Master and Modbus ASCII Slave. The Master and Slave refer to where in the circuit the analyzer is connected. The rest of this topic simply refers to Modbus Master or Modbus Slave, as the principles are the same. Modbus Master assumes that data from the Master is on the DTE side (i.e. master data is on the TxD pin and slave data on the RxD pin). If the analyzer is connected to a Master device, choose the Modbus Master decode.

42
Modbus Slave assumes that data from the slave is on the DTE side (i.e. slave data is on the TxD pin and master data on the RxD pin). If the analyzer is connected to any Slave device, choose the Modbus Slave decode. The diagram below illustrates conceptually which decoder to choose. Your configuration may be different from the diagram. The important thing is to choose Modbus Master if the
. master data is on the transmit line, or Modbus Slave if the slave data is on the transmit lineOnce you have selected the correct protocol, be sure to set the Register Display Settings soyour data is decoded correctly. If you have a custom protocol and need help connecting the analyzer to the right location, see
Generic Channel Dependent Decodes Setup.

43
4 Protocol Stacks
4.1 Protocol Stack Wizard
The Protocol Stack wizard is where you define the protocol stack you want the analyzer to ames. use when decoding fr
To start the : wizard1. Choose Protocol Stack from the Options menu on the Control window or click the
Protocol Stack icon on the Frame Display.
2. Select a protocol stack from the list, and click Finish. Click for information on how the analyzer auto‐traverses the protocol stack.
Most stacks are pre‐defined here. If you have special requirements and need to set up a custom acst k, see Creating a Custom Stack.
1. If you select a custom stack (i.e. one that was defined by a user and not included with the analyzer), the Remove Selected Item From List button becomes active.
2. Click the Remove button to remove the stack from the list. You cannot remove stacks ain in provided with the analyzer. If you remove a custom stack, you need to define it ag
order to get it back.
If you are changing the protocol stack for a capture file, you may need to reframe. See Reframing for more information.
You cannot select a stack or change an existing one for a capture file loaded into the Capture File Viewer (the Capture File Viewer is used only for viewing capture files and cannot capture data). Protocol Stack changes can only be made from a live session.
Note for BCSP:
If you are using the BCSP protocol stack, you must connect the analyzer to the circuit such that the data on the DTE line comes from the host, and data on the DCE line comes from the controller. Click here
Note for Modbus RTU:
If you are using the Modbus RTU protocol stack, you must select either Modbus RTU Master or Modbus RTU Slave depending on where the analyzer taps into the circuit. Click here for more information.
Note for Modbus TCP:
If you are using Modbus TCP over Ethernet, you need to set up a node database giving the IP addresses for the Master and Slave devices. Click here for more information.
Note for Data Highway Plus (DH+):

44
There are special hardware and software configuration instructions for setting up the DL3000 DHM device used to tap into the Data Highway Plus network. Click here for more information.
Note for IEC 8705101:
You need to give the decoder information on the sizes of some fields and whether or not other fields are present. There are all system configurable options and therefore the decoder has no way of knowing this information from the data. Click here for more information.
Note for DeviceNet
You need to install the DeviceNet card before beginning data capture. Then you need to setup the device in the Hardware Settings window, and optionally select any capture filters.
4.2 Information Screen
The second screen of the Protocol Stack Wizard gives information to help you decide if you need to define a custom stack or if a pre‐defined stack has what you need.
4.3 Creating and Removing a Custom Stack
To create a custom stack: 1. Choose Protocol Stack from the Options menu on the Control window or click the
ol Stack icon Protoc on the Frame Displa
y.
2. Select Build Your Own from the list and click Next.
3. The system displays an information screen that may help you decide if you need to define your own custom stack. Defining a custom stack means that the analyzer uses the stack for every frame. Frames that do not conform to the stack are decoded incorrectly. Click Next to continue.
Select P otr ocols
1. Select a protocol from the list on the left.
2. Click the right arrow button to move it to the Protocol Decode Stack box on the right, or double‐click the protocol to move it to the right.
3. To remove a protocol from the stack, double‐click it or select it and click the left arrow button.
4. If you need to change the order of the protocols in the stack, select the protocol you want to move, and click on the Move Up and Move Down buttons until the protocol is in the correct position.
5. The lowest layer protocol is at the top of the list, with higher layer protocols listed underneath.
Autotraversal (Have the analyzer Determine Higher Layers)

45
If you need to define just a few layers of the protocol stack, and the remaining layers can be determi edn based on the lower layers:
1. Click the All additional stack layers can be determined automatically button.
2. If your protocol stack is complete and there are no additional layers, click the There are no additional stack layers button.
3. If you select this option, the analyzer uses the stack you defined for every frame. Frames that do use this stack are decoded incorrectly.
Save the Stack
To save ou y r stack: n. 1. Click the Add To Predefined List butto
2. Give the stack a name, and click Add.
In the future, the stack appears in the Protocol Stack List on the first screen of the Protocol Stack wizard.
Remove a Stack
To remo e v the stack: 1. Select it in the first screen and click Remove Selected Item From List.
2. If you remove the stack, you must to recreate it if you need to use it again.
Note:
If you do not save your custom stack, it does appear in the predefined list, but applies to the frames in the current session. However, it is discarded at the end of the session.
4.4 Saving User Defined Stacks
You can create protocol stacks for one time use that disappear at the end of the session. If you want to use the stack again in a subsequent session, then you need to recreate it. However, if you save the stack, then it is available every time you start the analyzer, until
elete it. you dThe Add To Predefined Stack List dialog allows the user to save a custom stack for future use.
1. After creating a custom stack using the Protocol Stack Wizard, click the Add To Predefined List button on the last screen of the wizard.

46
Your newly oto l Stack pane on the left. defined stack appears in the Current Pr co
2. Simply enter a name for the stack and click Add.
he name of the stack now appears as a selection in the Select a Protocol Stack dialog. T
4.5 Reframing
If you need to change the protocol stack used to interpret a capture file and the framing is different in the new stack, you need to reframe in order for the protocol decode to be correct. You can also use Reframe to frame unframed data. The original capture file is not altered during this process. Note: You cannot reframe from the Capture File Viewer (accessed by selecting Capture File Viewer or Load Capture File to start the software and used only for viewing capture files). To reframe your data, load your capture file, select a protocol stack, and then select Reframe
er from the File menu on the Control window. Reframe is only available if the frame recognizused to capture the data is different from the current frame recognizer. In addition to choosing to Reframe, you can also be prompted to Reframe by the Protocol Stack Wizard.
1. Load your capture file by choosing Open from the File menu on the Control window, and select the file to load.
2. Select the protocol stack by choosing Protocol Stack from the Options menu on the Control window, select the desired stack and click Finish.
3. If you selected a protocol stack that includes a frame recognizer different from the one used to capture your data, the Protocol Stack Wizard asks you if you want to reframe your data. Choose Yes.
4. The analyzer adds frame markers to your data, puts the framed data into a new file, and opens the new file. The original capture file is not altered.
See Unframing for instructions on removing framing from data.

47
4.6 Unframing
This function removes start‐of‐frame and end‐of‐frame markers from your data. The original capture file is not altered during this process. You cannot unframe from the Capture File Viewer (accessed by selecting Capture File Viewer or Load Capture File to start the software and used only for viewing capture files). To manually unframe your data, select Unframe from the File menu on the Control window. Unframe is only available if a protocol stack was used to capture the data and there is currently no protocol stack selected. In addition to choosing to Unframe, you can also be prompted to Unframe by the Protocol Stack Wizard.
1. Load your capture file. To do this, choose Open from the File menu on the Control window, and select the file to load.
2. Remove the protocol stack. To do this, choose Protocol Stack from the Options menu on the Control window, select None from the list, and click Finish.
3. The Protocol Stack Wizard asks you if you want to unframe your data and put it into a new file. Choose Yes.
4. The system removes the frame markers from your data, puts the unframed data into a e file is not altered. new file, and opens the new file. The original captur
ee S Reframing for instructions on framing unframed data.
4.7 Providing Context For Decoding When Frame Information Is Missing
There may be times when you need to provide information to the analyzer because the context for decoding a frame is missing. For example, if the analyzer captured a response frame, but did not capture the command frame indicating the command. The analyzer provides a way for you to supply the context for any frame, provided the decoder supports it. (The decoder writer has to include support for this feature in the decoder, so not all decoders support it. Note that not all decoders require this feature.) If the decoder supports user‐provided context, three items are active on the Options menu of the Control Window, Frame Display and Protocol Navigator windows. These items are Set Initial Decoder Parameters, Automatically Request Missing Decoding Information, and Set Subsequent Decoder Parameters. (These items are not present if no decoder is loaded that supports this feature.) Set Initial Decoder Parameters is used to provide required information to decoders that is not context dependent but instead tends to be system options for the protocol.

48
Choose Set Initial Decoder Parameters in order to provide initial context to the analyzer for a decoder. A dialog appears that shows the data for which you can provide information. If you n dee to change this information for a particular frame :
me Display window 1. Right‐click on the frame in the Fra
2. Choose Provide <context name>.
Alternative nu. ly, you can choose Set Subsequent Decoder Parameter from the Options me 3. This brings up a dialog showing all the places where context data was overridden.
4. If you know that information is missing, you can't provide it, and you don't want to see n. dialogs asking for it, un‐check Automatically Request Missing Decoding Informatio
5. When unchecked, the analyzer doesn't bother you with dialogs asking for frame information that you don't have. In this situation, the analyzer decodes each frame until it cannot go further and then simply stop decoding.

49
5 Capturing Data
5.1 Capturing Data
Note: Data Capture is not available in Viewer mode.
1. Click the Start Capture icon to begin capturing to a file. This icon is located on the
Control , Event Display , and Frame Display windows.
2. Files are placed in My Capture Files by default and have a .cfa extension. Choose Directories from the Options menu on the Control window to change the default file location.
3. Watch the status bar on the Control window to monitor how full the file is. When the file is full, it begins to wrap, which means the oldest data will be overwritten by new data.
4. Click the Stop icon to temporarily stop data capture. Click the Start Capture icon again to resume capture. Stopping capture means no data will be added to the capture
usly captured date remains in the file. file until capture is resumed, but the previo
5. To clear captured data, click the Clear icon .
• If you select Clear after selecting Stop, a dialog appears asking whether you want to save the data.
• prompted . You can click Save File and enter a file name when
• If you choose Do Not Save, all data will be cleared.
anges. • If you choose Cancel, the dialog closes with no ch
• If you se while a capture is occurring: lect the Clear icon
• The capture stops.
• A dialog appears asking if you want to save the capture
• You can select Yes and save the capture or select No and close the dialog. In either case, the existing capture file is cleared and a new capture file is started.
• If you choose Cancel, the dialog closes with no changes.
To change the size of the capture file, choose System Settings from the Options menu on the ontrol window. C

50
5.2 USB HCI Internal Software Tap Data Source Dialog
The USB HCI Internal Software Tap Data Source Dialog allows the user to select which Bluetooth® device to sniff and to initiate and terminate the sniffing process. This dialog has a list control containing the Bluetooth Devices connected to your system. If the Show Connected Only checkbox is unchecked then all USB devices that have ever been connected to your system are listed.
1. Select the device you wish to sniff.
2. Click on the Start Sniffing button. You must click on the Start Capture icon on the indow to cControl w apture data. For more details see USB HCI Sniffing.
3. Click the Refresh List button if you have connected or disconnected a device while this dialog is open to update the list.

51
6 Analyzing Byte Level Data
6.1 Event Display
To open this window
Click the Event Display icon on the Control window toolbar. The Event Display window provides detailed information about every captured event. Events include data bytes, data related information such as start‐of‐frame and end‐of‐frame flags, and the analyzer information, such as when the Data Capture Was Paused. Data bytes are displayed in hex on the left side of the window, with the corresponding ASCII character on the right. Click on an event to find out more about it. The three status lines at the bottom of the window are updated with information such as the time the event occurred (for data bytes, the time the byte was captured), the value of the byte in Hex, Decimal, Octal, and Binary, any errors associated with the byte, and more. Events with errors are shown in red to make them easy to spot. When capturing data live, the analyzer continually updates the Event Display as data is
captured. Make sure the Lock icon is displayed on the toolbar to prevent the display from updating (Clicking on the icon again will unlock the display). While locked, you can review your data, run searches, determine delta time intervals between bytes, and check CRCs. To resume updating the display, click the Lock icon again.
You can have more than one Event Display open at a time. Click the Duplicate View icon to create a second, independent Event Display window. You can lock one copy of the Event Display and analyze your data, while the second Event Display updates as new data is captured.
6.2 The Event Display Toolbar
Home – Brings the Control window to the front.
Open File ‐ Opens a capture file.
Start Capture ‐ Begins data capture to disk.
Stop Capture ‐ Closes a capture file and stops data capture to disk.
Save ‐ Prompts user for a file name. If the user supplies a name, a .cfa file is saved.

52
lear‐ Discards the temporary file and clears the display. C
Lock ‐ In the Lock state, the window is locked so you can review a portion of data. Data capture continues in the background. Clicking on the Lock icon nlocks the window. u
Unlock ‐ In the Unlock state, the screen fills in the data captured since the screen lock and moves down to display incoming data again. Clicking on the nlock icon locks the window. U
Duplicate View ‐ Creates a second Event Display window identical to the first.
Frame Display ‐ (framed data only) Brings up a Frame Display, with the frame of the currently selected bytes highlighted.
Focus Protocol Navigator ‐ (framed data only) Brings up the Protocol Navigator window, with the currently selected frame highlighted.
Display Capture Notes ‐ Brings up the Capture Notes window where you can view or add notes to the capture file.
Add/Modify Bookmark ‐ Add a new or modify an existing bookmark.
Display All Bookmarks ‐ Shows all bookmarks and lets you move between bookmarks.
Find ‐ Search for errors, string patterns, special events and more.
Go To ‐ Opens the Go To dialog, where you can specify which event number to go to.
CRC ‐ Change the algorithm and seed value used to calculate CRCs. To calculate a CRC, select a byte range, and the CRC appears in the status lines at the bottom of the Event Display.
Mixed Sides ‐ (Serial data only) By default, the analyzer shows data with the DTE side above the DCE side. This is called DTE over DCE format. DTE data has a white background and DCE data has a gray background. The analyzer can also
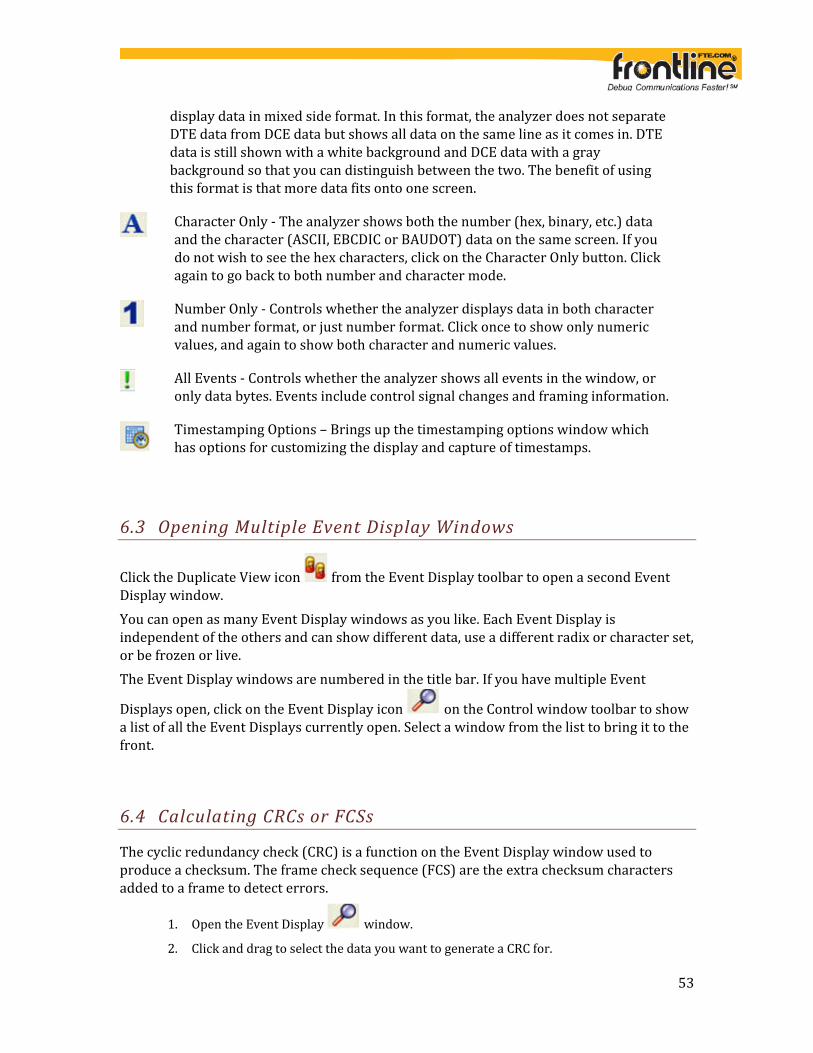
53
display data in mixed side format. In this format, the analyzer does not separate DTE data from DCE data but shows all data on the same line as it comes in. DTE data is still shown with a white background and DCE data with a gray background so that you can distinguish between the two. The benefit of using this format is that more data fits onto one screen.
Character Only ‐ The analyzer shows both the number (hex, binary, etc.) data and the character (ASCII, EBCDIC or BAUDOT) data on the same screen. If you do not wish to see the hex characters, click on the Character Only button. Click again to go back to both number and character mode.
Number Only ‐ Controls whether the analyzer displays data in both character and number format, or just number format. Click once to show only numeric values, and again to show both character and numeric values.
All Events ‐ Controls whether the analyzer shows all events in the window, or
n. only data bytes. Events include control signal changes and framing informatio
Timestamping Options – Brings up the timestamping options window which has options for customizing the display and capture of timestamps.
6.3 Opening Multiple Event Display Windows
Click the Duplicate View icon from the Event Display toolbar to open a second Event Display window. You can open as many Event Display windows as you like. Each Event Display is independent of the others and can show different data, use a different radix or character set, or be frozen or live. The Event Display windows are numbered in the title bar. If you have multiple Event
Displays open, click on the Event Display icon on the Control window toolbar to show a list of all the Event Displays currently open. Select a window from the list to bring it to the ront. f
6.4 Calculating CRCs or FCSs
The cyclic redundancy check (CRC) is a function on the Event Display window used to produce a checksum. The frame check sequence (FCS) are the extra checksum characters added t a f o rame to detect errors.
1. Open the Event Display window.
2. Click and drag to select the data you want to generate a CRC for.

54
3. Click on the CRC icon .
4. In the CRC dialog box, click on the down arrow to show the list of choices for CRC algorithms. Choose an algorithm to use. Choose CRC 32 (Ethernet). Choose CRC 32
te CRC type for serial data. (Ethernet) for Ethernet data or the appropria
5. Enter a seed value in hexadecimal if desired.
6. Click OK to generate the CRC. It appears in the byte information lines at the bottom of the Event Display window. Whenever you select a range of data, a CRC using the algorithm you selected is calculated automatically.
"CRC!" in Ethernet data
Ethernet network cards do not normally send the CRC with the frame to the upper layers of the system. The hardware on the card checks that the CRC is correct and then throws it away. FTS marks the place where the CRC would be in the data with "CRC!". When viewing Ethernet capture files made with other programs, the CRC may or may not be included, depending on the specifications of the capturing software/hardware.
Reversed CRCs on the Event Display with Ethernet data
The CRC calculated in the Event Display window is reversed from the CRC shown in the data. CRCs are calculated in network data order from Most Significant Byte (MSB) to Least Significant Byte (LSB). The Ethernet specification says to send data in host data order (LSB
. to MSB). Therefore the CRC as captured in the data is the reverse of the CRC as calculatedExample: If the CRC in the data is shown as 00 01 02 03, the Event Display calculated the CRC and show it in the status lines as 03 02 01 00. This is correct.
Calculating CRC for interwoven data
FTS calculates the CRC for either side of the interwoven data. Which side it calculates is determined by the first byte selected. If the first byte is from one side, then FTS calculates the CRC for just the bytes on that side. If the first byte is from the other side, then FTS calculates the CRC for just the bytes on that side.
Incorrect results with CRC16 for serial data
If you are calculating CRCs using the CRC16 algorithm and the CRCs do not match what you know they should be, try CRC16rev. What hardware often calls CRC16 is what software alls CRC16rev. c
6.5 Calculating Delta Times and Data Rates
1. Click on the Event Display icon on the Control window to open the Event Display window.
2. Use the mouse to select the data you want to calculate a delta time and rate for.

55
3. The Event Display window displays the delta time and the data rate in the status lines at the bottom of the window.
6.6 Switching Between Live Update and Review Mode
The Event Display and Frame Display windows can update to display new data during live capture, or be frozen to allow data analysis. By default, the Event Display continually updates it ame D w h new data, and the Fr isplay is locked.
1. Make sure the Lock icon is active so the display is locked and unable to scroll.
2. Click the Unlock icon again to resume live update.
The analyzer continues to capture data in the background while the display is locked. Upon resuming live update, the display updates with the latest data. You can have more than one Event Display or Frame Display window open at a time. Click
the Duplicate View icon to open additional Event or Frame Display windows. The Lock/Resume function is independent on each window. This means that you can have two Event Display windows open simultaneously, and one window can be locked while the ther continues to update. o
6.7 atD a Formats and Symbols
6.7.1 Switching Between Viewing All Events and Viewing Data Events
analyzer on the Event Display dialog shows all events. By default, the
This includes: • Data bytes • Start‐of‐frame • End‐of‐frame characters
• Data Captured Was Paused.
Click on the Display All Events icon to remove the non‐data events. Click again to display all events. See List of All Event Symbols for a list of all the special events shown in the analyzer and hat they mean. w

56
6.7.2 Switching Between Hex, Decimal, Octal or Binary
On the Event Display window the analyzer displays data in Hex by default. There are several ways to ha c nge the radix used to display data.
1. Go to the View menu and select the radix you want. A check mark next to the radix indicates which set is currently being used.
2. Right‐click on the "Hex" header label and choose a different radix.
If you want to see only the numerical values, click on the Numbers Only icon on the vent Display toolbar. E
6.7.3 Switching Between ASCII, EBCDIC, and Baudot
On the Event Display window, the analyzer displays data in ASCII by default. There are several ayw s to change the character set used to display data.
1. Go to the View menu and select the character set you want. A check mark next to the character set indicates which set is currently being used.
ara2. Right‐click on the "ASCII" header label and choose a different ch cter set.
f you want to see only characters, click on the Characters Only icon I on the Event isplay toolbar. D
6.7.4 Viewing Only ASCII (or EBCDIC or Baudot)
On the Event Display toolbar you can choose to view data in ASCII, EBCDIC, or Baudot format only.
1. Click on the Characters Only icon on the Event Display toolbar.
To add t e ay: h numerical values back to the displ
1. Click the Characters Only icon again.
6.7.5 Viewing Only Hex (Or Decimal or Octal or Binary)
On the Event Display toolbar you can choose to view data as numeric only.
1. Click on the Numbers Only icon on the Event Display toolbar.
To display t y: he characters back to the displa
1. Click the Number Only icon again.

57
6.7.6 Selecting Mixed Channel/Sides
If you want to get more data on the Event Display window, you can switch to mixed sides mode. This mode puts all the data together on the same line. Data from one side is shown on a white cba kground and data from the other is shown on a gray background.
1. Click once on the Mixed Sides icon to pu
t the display in mixed sides mode.
2. Click again to return to side over side mode.
3. You can right click on the labels in the center of the data display window to change between mixed and side over side modes.
4. Choose Display Sides Together to go to Mixed Sides Mode or Display Sides Separately to go to side over side mode.
6.7.7 List of All Event Symbols
By default, the Event Display shows all events, which includes control signal changes, start and end of frame characters and flow control changes. If you want to see only the data
bytes, click on the All Events button . Click again to display all events. Click on a symbol, and the analyzer displays the symbol name and sometimes additional information in the status lines at the bottom of the Event Display window. For example,
ged. clicking on a control signal change symbol displays which signal(s) chanIn addition to data bytes, the events shown are (in alphabetical order):

58
Abort
Broken Frame ‐ The frame did not end when the analyzer expected it to. This occurs most often with protocols where the framing is indicated by a specific character, control signal change, or other data related event.
Buffer Overflow ‐ Indicates a buffer overflow error. A buffer overflow always causes a broken frame.
Control Signal Change ‐ One or more control signals changed state. Click on the symbol, and the analyzer displays which signal(s) changed at the bottom of the Event Display window.
Data Capture Paused ‐ The Pause icon was clicked, pausing data capture. No data is recorded while capture is paused.
Data Capture Resumed ‐ The Pause icon was clicked again, resuming data apture. c
Dropped Frames ‐ Some number of frames were lost. Click on the symbol, and the analyzer displays many frames were lost at the bottom of the Event Display window.
End of Frame ‐ Marks the end of a frame.
Flow Control Active ‐ An event occurred which caused flow control to become active (i.e. caused the analyzer to stop transmitting data) Events which activate flow control are signal changes or the receipt of an XON haracter. c
Flow Control Inactive ‐ An event occurred which caused flow control to become inactive (i.e. caused the analyzer to transmit data). Events which deactivate flow control are signal changes or the receipt of an XOFF haracter. c
Frame Recognizer Change ‐ A lowest layer protocol was selected or removed here, causing the frame recognizer to be turned off or on.

59
6.7.8 Font Size
The font size can be changed on several windows. Changing the font size on one window ize on any other window. does not affect the font s
To chan t ize: ge he font s
e the Font Size. 1. Click on Options, and select Chang
font size from the list. 2. Choose a
3. Click OK.

60
7 Analyzing Protocol Decodes
7.1 raF owme Display Wind
7.1.1 Frame Display Window
To open this window
Click the Frame Display icon on the Control window toolbar, or select Frame Display from the Window menu.
Frame Display Panes
The Frame Display window is used to view all frame related information. It is composed of a number of different sections or "panes", where each pane shows a different type of information about a frame. The image below gives the name of each pane. Click on the links below th n more about each pane. e image to lear
• Summary Pane The Summary Pane displays a one line summary of each frame for every protocol found in the data, and can be sorted by field for every protocol. Click here for an
f the symbols next to the frame numbers. explanation o• Decode Pane
The Detail Pane displays a detailed decode of the highlighted frame. Fields selected in the Decode pane have the appropriate bit(s) or byte(s) selected in the Radix,
acter and Event panes. Binary, Char• Radix Pane
The Radix Pane displays the logical data bytes in the selected frame in either decimal or octal. hexadecimal,
• Binary Pane displays a binary representation of the logical data bytes. The Binary Pane
• Character Pane The Character Pane displays the character representation of the logical data bytes in
, EBCDIC or Baudot. either ASCII• Event Pane
The Event Pane displays the physical data bytes in the frame, as received on the network.
By default, all panes except the Event pane are displayed when the Frame Display is first opened.
Protocol Tabs
The Frame Display adds a tab to the top of the Summary Pane for every protocol found in the in the data. You can click on these tabs to filter on the protocol. Select the Unfiltered tab
61
to display all protocols. The Unfiltered tab is automatically selected when multiple protocols are being filteredin using other filtering methods.
Comparing Frames
If you need to compare frames, you can open additional Frame Display windows by clicking
on the Duplicate View icon . You can have as many Frame Display windows open at a time as you wish.
7.1.2 Frame Display Toolbar
The buttons that appear in the Frame Display window vary according to the particular conf uraig tion of the analyzer.
Home – Brings the Control window to the front.
Open File ‐ Opens a capture file.
I/O Settings ‐ Opens the I/O Settings dialog.
Start Capture ‐ Begins data capture to a user designated file.
Stop Capture ‐ Closes a capture file and stops data capture to disk.
Save ‐ Save the currently selected bytes or the entire buffer to file. Clear‐ Discards the temporary file and clears the display.
Event Display – Brings the Event Display window to the front.
Protocol Navigator – Brings the Protocol Navigator window to the front.
Statistics ‐ Brings the Statistics window to the front. This icon does not display in this location when running the analyzer in Air Sniffer. See Packet Error Rate Statistics below.
Signal Display ‐ Opens the Signal Display. This icon does not display when running the analyzer in Air Sniffer.
Breakout Box ‐ Opens the Breakout Box dialog.

62
Duplicate View ‐ Creates a second Frame Display window identical to the first.
Apply/Modify Display Filters ‐ Opens the Display Filter dialog.
Quick Protocol Filter ‐ brings up a dialog box where you can filter or hide one or more protocol layers.
Find ‐ Search for errors, string patterns, special events and more.
Display Capture Notes ‐ Brings up the Capture Notes window where you can view or add notes to the capture file.
Add/Modify Bookmark ‐ Add a new or modify an existing bookmark.
Display All Bookmarks ‐ Shows all bookmarks and lets you move between bookmarks.
Protocol Stack ‐ brings up the Protocol Stack Wizard where you can change the stack used to decode framed data
Reload Decoders ‐ When Reload Decoders is clicked, the plug‐ins are reset and received frames are redecoded. For example, If the first frame occurs more than 10 minutes in the past, the 10‐minute utilization graph stays blank until a frame from 10 minutes ago or less is decoded.
Packet Timeline – Opens the Packet Timeline display.
Extract Data ‐ Opens the Extract Data dialog.
Packet Error Rate Statistics ‐ Opens the Packet Error Rate Statistics display.
Audio Extraction ‐ Opens the Audio Extraction dialog. Pie Chart ‐ This icon displays a chart that displays the number of frames with and without errors.
Network View ‐ Opens the Network View Window. Dashboard ‐ Opens the Dashboard Dialog

63
Filter: Text giving the filter currently in use. If no filter is being used, the text reads "All Frames" which means that nothing is filtered out. To see the text of the entire filter, place the cursor over the text and a ToolTip pops up with the full text of the filter. The following icons all change how the panes are arranged on the Frame Display. Additional layouts are listed in the View menu.
Show Default Panes ‐ Returns the panes to their default settings.
Show Only Summary Pane ‐ Displays only the Summary pane.
Toggle Expanded Decode Pane ‐ Makes the Decode pane taller and the Summary pane narrower.
Toggle Display Freeze ‐ Prevents the display from updating.
Go To Frame ‐ Opens the Go To dialog, where you can specify which event number to go to.
First Frame ‐ Moves to the first frame in the buffer.
Previous Frame ‐ Moves to the previous frame in the buffer.
Next Frame ‐ Moves to the next frame in the buffer.
Note that if the frames are sorted in other than ascending frame number order, the order of the frames in the buffer is the sorted order. Therefore the last frame in the buffer may not have the last frame number.
Last Frame ‐ Moves to the last frame in the buffer.
Summary dropdown box
Lists all the protocols found in the data in the file. This box does not list all the protocol decoders available to the analyzer, merely the protocols found in the data. Selecting a protocol from the list changes the Summary pane to display summary information for that protocol. When a FBLEA predefined Named Filter (like Nulls and Polls) is selected, the Summary drop‐down is disabled.
Text with Protocol Stack
To the right of the Summary Layer box is some text giving the protocol stack currently in se. u

64
7.1.3 Frame Display Status Bar
The Frame Display Status bar appears at the bottom of the Frame Display. It contains the following information:
• Total Frames: The total number of frames in the capture buffer or capture file in real‐time
• Frames Filtered In: The total number of frames displayed in the filtered results from user applied filters in real‐time
• Frame #s Selected: Displays the frame number or numbers of selected (highlighted) frames, and the total number of selected frames in parentheses
7.1.4 Hiding and Revealing Protocol Layers in the Frame Display
Hiding protocol layers refers to the ability to prevent a layer from being displayed on the Decode pane. Hidden layers remain hidden for every frame where the layer is present, and can be revealed again at any time. You can hide as many layers as you wish. Note: Hiding from the Frame Display affects only the data shown in the Frame Display and not any information in any other window.
There a e twor ways to hide a layer.
1. Right‐click on the layer in the Decode pane, and choose Hide [protocol name] Layer In All Frames.
2. Click the Set Protocol Filtering button on the Summary pane toolbar. In the Protocols to Hide box on the right, check the protocol layer(s) you want hidden. Click OK when finished.
To reve l aa hidden protocol layer:
1. Right‐click anywhere in the Decode pane
2. Choose Show [protocol name] Layer from the right‐click menu, or click the Set Protocol yer or layers you want revealed. Filtering button and un‐check the la
7.1.5 Physical vs. Logical Byte Display
The Event Display window and Event Pane in the Frame Display window show the physical bytes. In other words, they show the actual data as it appeared on the circuit. The Radix, Binary and Character panes in the Frame Display window show the logical data, or the resulting byte values after escape codes or other character altering codes have been applied (a process called frame transformation). As an example, bytes with a value of less than 0x20 (the 0x indicates a hexadecimal value) cannot be transmitted in Async PPP. To get around this, a 0x7d is transmitted before the byte. The 0x7d says to take the next byte and subtract 0x20 to obtain the true value. In this ituation, the Event pane displays 0x7d 0x23, while the Radix pane displays 0x03. s

65
7.1.6 Sorting Frames
By default, frames are sorted in ascending numerical sequence by frame number. Click on a column header in the Summary pane to sort the frames by that column. For example, to sort the frames by size, click on the Frame Size column header. An embossed triangle next to the header name indicates which column the frames are sorted by. The direction of the triangle indicates whether the frames are in ascending or descending order, with up being ascending.
tha frames. Note t it may take some time to sort large numbers of
7.1.7 Synchronizing the Event and Frame Displays
The Frame Display is synchronized with the Event Display. Click on a frame in the Frame Display and the corresponding bytes is highlighted in the Event Display. Each Frame Display has its own Event Display. As an ex e folample, here's what happens if th lowing sequence of events occurs.
1. Click on the Frame Display icon in Control window toolbar to open the Frame Display.
2. icon Click on the Duplicate View to create Frame Display #2.
3. Click on Event Display icon in Frame Display #2. Event Display #2 opens. This Event Display is labeled #2, even though there is no original Event Display, to indicate that it is synchronized with Frame Display #2.
4. Click on a frame in Frame Display #2. The corresponding bytes are highlighted in Event Display #2.
5. Click on a frame in the original Frame Display. Event Display #2 does not change.
7.1.8 Working With Multiple Frame Displays
Multiple Frame Displays are useful for comparing two frames side by side. They are also useful for comparing all frames against a filtered subset or two filtered subsets against each other.
• To create a second Frame Display, click the Duplicate View icon on the Frame Display toolbar.
This creates another Frame Display window. You can have as many Frame Displays open as you wish. Each Frame Display is given a number in the title bar to distinguish it from the others.
• To navigate between multiple Frame Displays, click on the Frame Display icon in the Control window toolbar.

66
A drop‐ . down list appears, listing all the currently open Frame Displays• Select the one you want from the list and it comes to the front.
Note: When you create a filter in one Frame Display, that filter does not automatically appear in other Frame Display windows. You must use the Hide/Reveal feature to
rame Display in different Frame Display window. display a filter created in one F
7.1.9 Working With Panes
When the Frame Display first opens, all panes are displayed except the Event pane. The panes include:
• To view all the panes, select Show All Panes from the View menu.
• The Toggle Expand Decode Pane icon makes the decode pane longer to view lengthy decodes better.
• The Show Default Panes icon returns the Frame Display to its default settings.
• The Show only Summary Pane icon displays on the Summary Pane. 1. To close a pane, right‐click on the pane and select Hide This Pane from the pop‐up menu,
or de‐select Show [Pane Name] from the View menu.
2. To open a pane, right‐click on the any pane and highlight Show Hidden Panes from the pop‐up menu and select the pane from the fly‐out menu, or select Show [Pane Name] from the View menu.
3. To resize a pane, place the cursor over the pane border until a double‐arrow cursor appears. Click and drag on the pane border to resize the pane.
7.1.10 The Panes in the Frame Display
7.1.10.1 Summary Pane
The Summary pane displays a one‐line summary of every frame in a capture buffer or file, including frame number, timestamp, length and basic protocol information. The protocol information included for each frame depends on the protocol selected in the summary layer box (located directly below the main toolbar).

67
On a two‐channel circuit, the background color of the one‐line summary indicates whether the frame came from the DTE or the DCE device. Frames with a white background come from the DTE device, frames with a gray background come from the DCE device. The Summary pane in FTS4USB displays a one‐line summary of every transaction in a capture buffer or file. Whenever there is a transaction it is shown on a single line instead of showing the separate messages that comprise the transaction. The Msg column in that case says “Transaction”. Each message in a transaction contains a packet identifier (PID). All of the PIDs in a transaction are shown in the transaction line. All IN transactions (i.e. transactions that contain an IN token message) are shown with a purple background. All other transactions and all non‐transactions are shown with a white background. IN transactions have special coloring because that is the only place where the primary data flow is from a device to the Host. The protocol information included for each frame depends on the protocol selected in the summary layer box (located directly below the main toolbar). Frame numbers in red indicate errors, either physical (byte‐level) or frame errors. If the error is a frame error in the displayed protocol layer, the bytes where the error occurred is displayed in red. The Decode Pane gives precise information as to the type of error and where it occurred. The Summary pane is synchronized with the other panes in this window. Click on a frame in the Summary pane, and the bytes for that frame is highlighted in the Event pane while the Decode pane displays the full decode for that frame. Any other panes which are being viewed are updated accordingly. If you use one pane to select a subset of the frame, then only that subset of the frame is highlighted in the other panes.
Use the navigation icons, keyboard or mouse to move through the frames. The icons
and move you to the first and last frames in the buffer, respectively. Use the Go To
con i to move to a specific frame number.
7.1.10.2 Customizing Fields in the Summary Pane
You can modify the Summary Pane in Frame Display.
Changing Column Widths
To chan tge he width of a column: 1. Place the cursor over the right column divider until the cursor changes to a solid double
arrow.
2. Click and drag the divider to the desired width.
3. To auto‐size the columns, double‐click on the column dividers.

68
Hiding Columns
To hide co a lumn: 1. Drag the right divider of the column all the way to the left.
2. The cursor changes to a split double arrow when a hidden column is present.
3. To show the hidden column, place the cursor over the divider until it changes to a split double arrow, then click and drag the cursor to the right.
4. The Frame Size, Timestamp, and Delta columns can be hidden by right‐clicking on the header and selecting Show Frame Size Column, Show Timestamp Column, or Show Delta Column. Follow the same procedure to display the columns again.
Moving Columns Cha
To mov a cnging Column Order
e olumn : 1. Click and hold on the column header
2. Drag the mouse over the header row.
3. A small white triangle indicates where the column is moved to.
4. When the triangle is in the desired location, release the mouse.
Restoring Default Column Settings
To restore columns to their default locations, their default widths, and show any hidden columns
1. Right‐click on any column header and choose Restore Default Column Widths, or select Restore Default Column Widths from the Format menu.
7.1.10.3 Frame Symbols in the Summary Pane
A green dot means the frame was decoded successfully, and the protocol listed in the Summary Layer drop‐down box exists in the frame. No dot means the frame was decoded successfully, but the protocol listed in the Summary Layer drop‐down box does not exist in the frame.
A green circle means the frame was not fully decoded. There are several reasons why this might happen. One reason is that the frame compiler hasn't caught up to that frame yet. It takes some time for the analyzer to compile and decode frames. Frame compilation also has a lower priority than other tasks, such as capturing data. If the analyzer is busy capturing data, frame compilation may fall behind. When the analyzer catches up, the green circle changes to either a green dot or no dot. Another reason is if some data in the frame is context dependent and we don't have the context. An example is a compressed header where the first frame gives the complete header, and subsequent frames just give information on what has

69
changed. If the analyzer does not capture the first frame with the complete header, it cannot decode subsequent frames with partial header information.
A magenta triangle indicates that a bookmark is associated with this frame. Any comments associated with the bookmark appear in the column next to the bookmark symbol.
7.1.10.4 Frame Display ‐ Right Click Filtering
In Frame Display, protocols are displayed as tabs in the Summary Pane. When you select a tab, the protocol layers are displayed. The layers vary depending on the protocol.
You can create additional protocol tabs that highlight specific layers in the Summary Pane using the Filtering Results dialog.
Note: The Filtering Results dialog is not available for all layers because the s not sortable, like time. information within those layers i
To use t e Fh iltering Results dialog:
ummary Pane. For example, the "S" for Slave under Role 1. Right‐click on a value in the S
2. On the drop‐down list select Filter in "Name = Value"
Note: The "Name" and "Value" chan
The Filt in
ge depending on the layer.
er g Results dialog appears.
e for the Filter. 3. Enter a nam
4. Select OK.
A new protocol tab with the Filter Name you just created appears in the Summary Pane. The new tab displays data specific to the layer you selected.
7.1.10.5 Decode Pane
The Decode pane (aka detail pane) is a post‐process display that provides a detailed decode of each frame transaction (sometimes referred to as a frame). The decode is presented in a layered format that can be expanded and collapsed depending on which layer or layers you are most interested in. Click on the plus sign to expand a layer. The plus sign changes to a minus sign. Click on the minus sign to collapse a layer. Select Show All or Show Layers from the Format menu to expand or collapse all the layers. Layers retain their expanded or collapsed state between frames. Protocol layers can be hidden, preventing them from being displayed on the Decode pane. Right‐click on any protocol layer and choose Hide [protocol name] from the right‐click menu. In a USB transaction, all messages that comprise the transaction are shown together in the detail pane. The color coding that is applied to layers when the detail pane displays a single

70
message is applied to both layers and messages when the detail pane displays a transaction. To keep the distinction between layers and messages clear, each header of each message in the detail pane ends with the word “Message” or “Messages”. The latter is used because data and handshake messages are shown as a single color‐coded entry Each protocol layer is represented by a color, which is used to highlight the bytes that belong to that protocol layer in the Event, Radix, Binary and Character Panes. The colors are not assigned to a protocol, but are assigned to the layer. The Event, Radix, Binary, Character and Decode panes are all synchronized with one another. Clicking on an element in any one of the panes highlights the corresponding element in all the other panes.
Click the Toggle Expand Decode Pane icon to make the Decode pane taller. This allows or more of a lengthy decode to be viewed without needing to scroll. f
7.1.10.6 Radix or Hexadecimal Pane
The Radix pane displays the logical bytes in the frame in either hexadecimal, decimal or octal. The radix can be changed from the Format menu, or by right‐clicking on the pane and choosing Hexadecimal, Decimal or Octal. Because the Radix pane displays the logical bytes rather than the physical bytes, the data in the Radix pane may be different from that in the Event pane. See Physical vs. Logical Byte Display for more information. Colors are used to show which protocol layer each byte belongs to. The colors correspond to the layers listed in the Decode pane. The Event, Radix, Binary, Character and Decode panes are all synchronized with one another. Clicking on an element in any one of the panes highlights the corresponding ement in all the other panes. el
7.1.10.7
7.1.10.8 Character Pane
The Character pane represents the logical bytes in the frame in ASCII, EBCDIC or Baudot. The character set can be changed from the Format menu, or by right‐clicking on the pane and choosing the appropriate character set. Because the Character pane displays the logical bytes rather than the physical bytes, the data in the Character pane may be different from that in the Event pane. See Physical vs. Logical Byte Display for more information. Colors are used to show which protocol layer each byte belongs to. The colors correspond to he layers listed in the Decode pane. t

71
The Event, Radix, Binary, Character and Decode panes are all synchronized with one another. Clicking on an element in any one of the panes highlights the corresponding lement in all the other panes. e
7.1.10.9 Binary Pane
The Binary pane displays the logical bytes in the frame in binary. This pane is synchronized with the Decode pane so that individual bit fields can be highlighted. Because the Binary pane displays the logical bytes rather than the physical bytes, the data in the Binary pane may be different from that in the Event pane. See Physical vs. Logical Byte Display for more information. Colors are used to show which protocol layer each byte belongs to. The colors correspond to the layers listed in the Decode pane. The Event, Radix, Binary, Character and Decode panes are all synchronized with one another. Clicking on an element in any one of the panes highlights the corresponding lement in all the other panes. e
7.1.10.10 Event Pane
The Event pane shows the physical bytes in the frame. You can choose between displaying
only the data events or displaying all events by clicking the All Events icon . Displaying all events means that special events, such as Start of Frame/End of Frame and any signal change events, are displayed as special symbols within the data. The status lines at the bottom of the pane give the same information as the status lines in the Event Display window. This includes physical data errors, control signal changes (if appropriate), and timestamps. Because the Event pane displays the physical bytes rather than the logical bytes, the data in the Event pane may be different from that in the Radix, Binary and Character panes. See Physical vs. Logical Byte Display for more information. Colors are used to show which protocol layer each byte belongs to. The colors correspond to the layers listed in the Decode pane. The Event, Radix, Binary, Character and Decode panes are all synchronized with one another. Clicking on an element in any one of the panes highlights the corresponding lement in all the other panes. e
72
7.1.11 Protocol Layer Colors
7.1.11.1 Data Byte Color Notation
The color of the data in the panes specifies which layer of the protocol stack the data is from. All data from the first layer is bright blue, the data from the second layer is green, the third layer is pink, etc. The protocol name for each layer in the Decode pane is in the same color. Note that the colors refer to the layer, not to a specific protocol. In some situations, a protocol may be in two different colors in two different frames, depending on where it is in the stack. You can change the default colors for each layer. Red is reserved for bytes or frames with errors. In the Summary pane, frame numbers in red mean there is an error in the frame. This could be a physical error in a data byte or an error in the protocol decode. Bytes in red in the Radix, Character, Binary and Event panes ean there is a physical error associated with the byte. m
7.1.11.2 Red Frame Numbers and Bytes
Red is reserved for bytes or frames with errors. In the Summary pane, frame numbers in red mean there is an error in the frame. This could be a physical error in a data byte or an error in the protocol decode. Bytes in red in the Radix, Character, Binary and Event panes ean there is a physical error associated with the byte. m
7.1.11.3 Changing Protocol Layer Colors
You can differentiate different protocol layers in the Decode, Event, Radix, Binary and Charact per anes.
1. Choose Select Colors from the Options menu to change the colors used
2. To change a color, click on the arrow next to each layer and select a new color.
7.1.12 Protocol Filtering from the Frame Display
7.1.12.1 Easy Protocol Filtering
There are two types of easy protocol filtering. The first method lets you filter on the protocol shown in the Summary pane, and the second lets you filter on any protocol iscovered on the network so far. d
7.1.12.2 Fil n the Summary Layer Protocol tering O
To filter n o the protocol in the Summary in the Frame Display window pane: protocol, or open the Summary Layer combo box. 1. Select the tab of the desired
2. Select the desired protocol.
3. To filter on a different layer, just select another tab, or change the layer selection in the combo box.

73
7.1.12.3 Quick Filtering on a P errotocol Lay
1. To filter on any protocol layer, open either the Frame Display or Protocol Navigator window.
2. On the Frame Display window, click the starred Quick Filtering icon or select "Quick Filtering" from the Filter menu.
This opens a dialog that lists all the protocols discovered so far. The protocols displayed
the data received. change depending onThe box on the left is Protocols To Filter In.
• When you select the checkbox for a protocol in the Protocols to Filter In, the Summary Pane will only display those frames that contain data from that protocol.
If you filter on more than one protocol, the result are all frames that contain at least one of those protocols. For example, if you filter on IP and IPX NetBIOS, you receive all frames that contain either IP or IPX NetBIOS (or both). A Quick Filter tab then appears on the Frame Display labeled Quick Filter. Changing the filter definition on the Quick Filter dialog changes the filter applied on the Quick Filter tab. Quick filters are persistent during the session, but
ion is closed. are discarded when the sessThe box in the center is the Protocols To Hide.
• When you select the checkbox for a protocol in the Protocols To Hide, data for that protocol will not appear in the Decode, Binary, Radix, and Character Panes. The
hat type data w in Radix, and Cha
frames containing t ill still appear in the Summary Pane, but notthe Decode, Binary, racter Panes.
The box on the right is the Named Filters. It contains filters that you create using the Named Filter and Set Condition dialogs.
• When you select the checkbox for the Name Filters, a tab appears on the Summary Pane that displays the frame containing the specific data identified in the filter. The named Filter tab remains on the Frame Display Summary Pane unless you hide it using the Hide/Show Display Filters dialog.
With FBLEA, the Configured BT Low energy devices and Exclude NULLSs and POLLs are efault named filters. d
1. Check the small box next to the name of each protocol you want to filter in, hide, or er display. Named Filt to
. Then click OK. 2

74
7.1.12.4 Filtering on all Frames with Errors from the Frame Display
To filter on all frames with errors:
1. Open the Frame Display window.
2. uiClick the starred Q ck Filter icon o u r select "Quick Filtering" from the Filter men
h Errors in the "Protocols to filter OK. 3. Check the box for All Frames Wit in" pane, and click
4. The system creates a tab on the Frame Display labeled Quick Filter that displays the results of the All Frames With Errors filter.
7.1.12.5 Frame Display ‐ Right Click Filtering
In Frame Display, protocols are displayed as tabs in the Summary Pane. When you select a tab, the protocol layers are displayed. The layers vary depending on the protocol.
You can create additional protocol tabs that highlight specific layers in the Summary Pane using the Filtering Results dialog.
Note: The Filtering Results dialog is not available for all layers because the s not sortable, like time. information within those layers i
To use t Fhe iltering Results dialog:
ummary Pane. For example, the "S" for Slave under Role 1. Right‐click on a value in the S
2. On the drop‐down list select Filter in "Name = Value"
Note: The "Name" and "Value" chan
The Filt in
ge depending on the layer.
er g Results dialog appears.
e for the Filter. 3. Enter a nam
4. Select OK.
A new protocol tab with the Filter Name you just created appears in the Summary Pane. The new tab displays data specific to the layer you selected.
7.2 roP ortocol Navigat Window
7.2.1 ator
The Protocol Navigator displays the decode for more than one frame at a time, and has several features for controlling which frames and/or parts of frames are displayed. The main part of the window displays the decode for multiple frames. When you first open the window, every protocol layer of every frame is collapsed. By expanding the protocols, the Protocol Navigator displays the equivalent of the Decode pane on the Frame Display, with the added convenience of displaying multiple frame decodes in one place.
Protocol Navig

75
Click the Protocol Navigator icon to display the ProtocThere are three methods for controlling the display in the Protocol Navigator; xpanding/collapsing protocols
ol Navigator.
e , filtering, and hiding.
7.2.2 Protocol Navigator Toolbar
The buttons that appear in the Protocol Navigator window vary according to the particular conf uraig tion of the analyzer.
Home – Brings the Control window to the front.
Open File ‐ Opens a capture file.
I/O Settings ‐ Opens the I/O Settings dialog.
Start Capture ‐ Begins data capture to a user designated file.
Stop Capture ‐ Closes a capture file and stops data capture to disk.
Save ‐ Save the currently selected bytes or the entire buffer to file. Clear‐ Discards the temporary file and clears the display.
Event Display – Brings the Event Display window to the front.
Frame Display ‐ (framed data only) Opens a Frame Display, with the frame of the currently selected bytes highlighted.
Breakout Box ‐ Opens the Breakout Box dialog.
Duplicate View ‐ Creates a second Frame Display window identical to the first.
Apply/Modify Display Filters ‐ Opens the Display Filter dialog.
Quick Protocol Filter ‐ brings up a dialog box where you can filter or hide one or more protocol layers.
Find ‐ Search for errors, string patterns, special events and more.
76
Display Capture Notes ‐ Brings up the Capture Notes window where you can view or add notes to the capture file.
Add/Modify Bookmark ‐ Add a new or modify an existing bookmark.
Display All Bookmarks ‐ Shows all bookmarks and lets you move between bookmarks.
Protocol Stack ‐ brings up the Protocol Stack Wizard where you can change the stack used to decode framed data
Reload Decoders ‐ When Reload Decoders is clicked, the plug‐ins are reset and received frames are redecoded. For example, If the first frame occurs more than 10 minutes in the past, the 10‐minute utilization graph stays blank until a frame from 10 minutes ago or less is decoded.
Packet Timeline – Opens the Packet Timeline display.
Extract Data ‐ Opens the Extract Data dialog.
Packet Error Rate Statistics ‐ Opens the Packet Error Rate Statistics display.
Audio Extraction ‐ Opens the Audio Extraction dialog.
Network View ‐ Opens the Network View Window. Dashboard ‐ Opens the Dashboard Dialog
The following icons all change how the panes are arranged on Protocol Navigator. Additional layouts are listed in the View menu.
First Frame ‐ Moves to the first frame in the buffer.
Previous Frame ‐ Moves to the previous frame in the buffer.
Next Frame ‐ Moves to the next frame in the buffer.
Last Frame ‐ Moves to the last frame in the buffer.

77
7.2.3 Protocol Navigator Status Bar
The Protocol Navigator Status bar appears at the bottom of the Protocol Navigator. It contains the following information:
• Total Frames: The total number of frames in the capture buffer or capture file in real‐time
• Frames Filtered In: The total number of frames displayed in the filtered results from user applied filters in real‐time
• Frame #s Selected: Displays the frame number(s) of selected (highlighted) frames, heses. and the total number of selected frames in parent
7.2.4 The Difference Between Filtering and Hiding
You can filter on one or more protocol layers. The filter is inclusive, which means that filtering on a protocol means that only frames that contain that protocol are shown in the window. Frames that do not contain the protocol do not appear. You can filter on one protocol or several. (Filtering on the Protocol Navigator window is display filtering only.) Hiding means that the selected layer is not displayed in the window, even though it may be present in the frame. This allows you to zoom in on a particular layer by hiding every layer but the one of interest. An example using the IP stack may help to illustrate the difference. Assume that you only want to see frames that have TCP in them. You create a filter on TCP. The results displayed in the Protocol Navigator (or Frame Display) window have only those frames that carry TCP. Now you're ready to look at the TCP decode in your frames. You don't care about what has happened at the IP layer or any other layer, so you hide everything but TCP. The window shows just the TCP decode for each frame. With those two steps, you've eliminated looking at any frame that doesn't have TCP in it, and you've narrowed down what you see to just the TCP decode.
7.2.5 Hiding and Revealing Protocol Layers in the Protocol Navigator
Hiding means that the selected protocol is not displayed in the window, even though it may be present in the frame. This allows you to zoom in on a particular protocol by hiding every proto hen ed. col but the one of interest. This is especially effective w all the layers are expand
Note: Hiding affects only the view in the Protocol Navigator and not the view in any other window. There a re two ways to hide a protocol in the Protocol Navigator window :
1. Right‐click on the protocol and choose Hide [Protocol Layer Name].
2. There are three panes on the left side of the window. The middle box is the Hidden From View pane. Check the boxes next to the protocols you want to hide.

78
To reve a al hidden protocol: 1. Right‐click anywhere in the main window
2. Select the protocol you want to show from the right‐click menu, or un‐check the box next to the protocol name in the Hidden From View pane.
When one or more layers are hidden, a note appears at the top of the Protocol Navigator saying, "Some layers are hidden. Right‐click to see." This warns you that some layers are hidden. Two special options are All But the Last Layer and All Special Information Nodes.
• All But the Last Layer hides all layers in each frame except for the last one, regardless of which protocol is present in the last layer.
• All Special Information Nodes hides the information line present in some protocol decoders.
7.2.6 Filtering on a Protocol Layer
You can filter on one or more protocol layers. The filter is inclusive which means only frames matching the filter you select are shown in the window. Frames that do not contain the protocol do not appear. You can filter on one protocol or several. On the left side of the Protocol Navigator window are three panes. The top pane is the Frames ilt he circuit. F ered In pane. In the pane is a list of all the protocols seen so far on t
ilter in. 1. Check the boxes next to the names of the protocols you want to f
n matches the filtering selected. The data on the right side of the screeThree additional filters available are:
• All Frames With Bookmarks ‐ filters in all frames with a bookmark associated with them.
• All Frames With Errors ‐ filters in all frames•
with errors. All Special Information Nodes ‐ filters in all special information nodes .
th E7.2.7 Filtering on all Frames wi
To filter on all frames with errors :
rrors from the Protocol Navigator
1. roOpen the P tocol Navigator window.
the top pane on the left side of the window. 2. Check the All Frames With Errors box in
To remove the filter, un‐check the box. 3.

79
7.2.8 Expanding and Collapsing Protocol Layers
You can expand any collapsed frame or protocol layer by clicking on the plus sign next to the frame number or protocol name. Expanding a protocol layer in one frame expands it for all frames.
1. To collapse a layer or frame, click on the minus sign next to the frame number or protocol name.
What do you want to see?
Everything Choose Show All from the Format menu.
Click the plus sign next to the frame you want to see. Then click the plus signs next to each protocol name to see the full
Everything for just one frame
decode.
Choose Show Frames AND Show Protocol Stack When Frame Is Completely Collapsed from the Format menu. This makes
ook similar to the following:
Just the stack for each frame
the display l
Frame 1: Len=104 Ethernet ‐> IP ‐> TCP
Frame 2: Len=98 Ethernet ‐> IP ‐> TCP ‐> NBSS
Choose Show Layers AND un‐check Show Summary Decode When Detailed Decode Is Collapsed on the Format menu. This makes the display look similar to the following:
Just the stack without summary information
Frame 1: Len=104
et: + Ethern
+ IPv4:
Frame 2:
+ TCP:
Len=98
et: + Ethern
+ IPv4:
+ TCP:
+ NBSS:
Just the stack including summary information
Choose Show Layers AND Show Summary Decode When Detailed Decode Is Collapsed from the Format menu. This makes the display look similar to the following:
Frame 1: Len=104
urce Address: XYZ etc.
+ Ethernet: ‐‐‐ Dest. Address: BROADCAST So
+ IPv4: ‐‐‐ Protocol: TCP Length: 80 etc.

80
Frame 2:
+ TCP: ‐‐‐ Source Port: 9988 Destination Port: NETBIOS etc.
Len=98
+ Ethernet: ‐‐‐ Dest. Address: etc.
+ IPv4: ‐‐‐ Protocol: TCP Length: 56 etc.
9988 etc.
+ TCP: ‐‐‐ Source Port: NETBIOS Destination Port:
+ NBSS: ‐‐‐ Length: 23 Fragment: Entire Message
The full decode for a protocol layer
Click on the plus sign next to the protocol name. This expands just that protocol in every frame.
Choose Collapse All Nodes AND Show Last Layer When Frame is Completely Collapsed from the Tree menu.
The decode for just the last layer in each rame f
81
8 Analyzing Control Signal Changes
8.1 ieV ngwing Signal Cha es in Realtime
8.1.1 Breakout Box Window
The Breakout Box window provides a real‐time graphical view of control signals. The window is customizable based on the control signals you wish to view and your preference of indicators (+/‐, 1/0, T/F, arrows, and simulated LEDs). Also included are counters showing the number of times a control signal has changed.
To open this window :
1. Click the Breakout Box icon on the Control window.
Name Pin 1, 2, 3, and 4
FTS4USB monitors four control signals. Digital inputs provide a means for users to insert events into the data stream. There are four digital inputs that can be enabled individually. Whenever an enabled input changes state it will issue an event and be tagged with a timestamp of when the input was interpreted by the analyzer. Digital inputs can not exceed a rate of 30 MHz. Digital inputs that occur faster than that are not guaranteed to be interpreted correctly by the analyzer. Also, only one digital input event may occur per active packet. All other digital input events can only be handled after the packet has completed. Digital inputs, although guaranteed to have the correct timestamp given the previous conditions, have the possibility of being presented out of order because they are provided randomly by the user and have no direct correlation to the bus. It is important to note that the digital inputs are susceptible to cross‐talk if they are not being actively driven. A situation like this could occur if a digital input has been enabled, but has not been tied to a signal. Any other nearby signal (i.e., other digital inputs or outputs) could cause the input to activate. It is recommended that all undriven digital inputs e disabled or tied to ground. b FTS six RS232 control signals. They are listed below : monitorsDTE Signals
• DTR Data Terminal Ready • RTS Request to Send DCE Signals • CTS Clear to Send • DSR Data Set Ready • CD Carrier Detect • RI Ring Indicator (see the special note on capturing Ring Indicator changes)

82
When monitoring a synchronous circuit, FTS also displays clock signals at the bottom of the window. These signals rotates when clock is present, and has an X over them if clock is not etected. d When using the SST interface cards for analyzing DeviceNet traffic, the following signals are displayed:
• er BP ‐ Bus Pow• OL ‐ Online • BW ‐ Bus warning, either the receive or transmit error counter (incremented and
decremented at various rates according to the Bosch CAN specification) has reached 128.
• BO ‐ Bus off, either the receive or transmit error counter has reached 255 and the CAN chip has been forced offline.
• RO ‐ Receive buffer overrun, one or more messages has been lost due to a full queue in the on‐card firmware.
• ML ‐ Message lost, one or more messages has been lost due to a slow interrupt response by the on‐card firmware.
• ER ‐ Error, one or more CAN error frames has been detected. Note: The messages received by NetDecoder are still correct when the ER flag shows some ctivity, as re‐transmission is automatic and only error‐free frames result in a receive nterrupt from the CAN controller. ai
8.1.2 The Breakout Box Toolbar
Home ‐ brings the Control window to the front.
Reset ‐ resets the Breakout Box window.
Lock ‐ Locks the display. Clicking on the Lock icon, unlocks the window.
Unlock ‐ In the Unlock state, the screen fills in the data captured since the screen lock and moves down to display incoming data again. Clicking on the Unlock icon, locks the window.
Options ‐ Brings up the Breakout Box Options window. This window allows you to change the window refresh rate and choose which control signals to display. Type topic text here.

83
8.1.3 Reading the Breakout Box Window
The Breakout Box display is divided into three main parts. The first part (to the far left of the screen) shows the abbreviated name of the control signal being monitored. These
names can be changed in the I/O Settings window by clicking the Names button. The second part shows the control signal counters. The counters show how many times each control signal has changed state. This is useful in situations when signals may be changing state too rapidly to be displayed graphically. Below the counters are the clock indicators. The indicators rotate when clock is present, and have an X over them when clock is not detected. The third part of the Breakout Box shows the current states of the control signals. The indicators show the state that the control signal is currently in, and the line graph displays the state of the signal over time. A single line means that the signal is logically off, while a double line means that the signal is logically on. A half‐height "tick" means that a signal has gone through one full transition (from off to on to off, or vice versa) since the analyzer last updated the screen. To change the indicators, hide the clock signals, or change the rate at which the analyzer
on updates the window, click on the Options ic .
8.1.4 Selecting Breakout Box Options
To a cec ss options
1. Click the Options icon on the Breakout Box toolbar or choose Breakout Box options under the Options menu.
Display Signal
This box shows which control signals FTS monitors. • ys A check mark next to a control signal name indicates that the breakout box displa
the status of that control signal. • To prevent FTS from displaying the status of a signal, un‐check the box next to it.
Display Clocks
Click to place a check mark in this box if you want the Breakout Box window to display the clock indicators. Un‐check to hide the clock indicators. (This option is only shown when in synchronous or isochronous mode.)
Window Refresh Rate
The refresh rate is the rate at which FTS updates the window. • By default, FTS refreshes the display once every 1,000 milliseconds (one second.) • To change the rate, highlight the number in the box and enter a new number. See
item 7 in Performance Notes for information on how Window Refresh Rate can affect performance.

84
Indicators
You can choose what type of indicators FTS uses. • The default indicators are a green "+" sign to show a logically high state, and a red "‐
" sign to show a logically low state. • To change the indicators, click on the down arrow and choose a pair of indicators
from the list. • As a reminder, FTS gives the definition of the indicators in the top part of the
Breakout Box window.

85
9 Viewing Historical Signal Changes
9.1 Signal Display Window
The Signal Display window provides a graphical view of control signal transitions that you can manipulate. You can zoom in to view the state of control signals for a range of events, or zoom out to view control signal changes over the course of an entire capture session.
To open this window
Click the Signal Display icon on the Control window toolbar, or choose Signal Display from the Window menu. The Signal Display window does not provide a real‐time view of control signal changes. It is intended to be used as a post‐process review screen. Use the Breakout Box window to view real‐time control signal changes. Note that if you bring up the Signal Display window while data is being captured, the window shows you the state of the control signals at the time the window was opened. This is called a "snapshot" because it is a picture of the buffer at the time the Signal Display was opened. To update the display to reflect the current state of the
buffer, use the New Snapshot icon . When you open Signal Display IN FTS4USB you will see Pin Codes 1, 2, 3, and 4. These correspond to the four Digital Input Enabling Options explained in USB I/O Settings. When using the SST interface cards for analyzing DeviceNet traffic, the following signals are displayed:
• er BP ‐ Bus Pow• OL ‐ Online • BW ‐ Bus warning, either the receive or transmit error counter (incremented and
decremented at various rates according to the Bosch CAN specification) has reached 128.
• BO ‐ Bus off, either the receive or transmit error counter has reached 255 and the CAN chip has been forced offline.
• RO ‐ Receive buffer overrun, one or more messages has been lost due to a full queue in the on‐card firmware.
• ML ‐ Message lost, one or more messages has been lost due to a slow interrupt response by the on‐card firmware.
• ER ‐ Error, one or more CAN error frames has been detected. Note: The messages received by NetDecoder are still correct when the ER flag shows some activity, as re‐transmission is automatic and only error‐free frames result in a receive nterrupt from the CAN controller. i

86
9.2 Signal Display Toolbar
Home ‐ brings the Control window to the front.
Take New Snapshot ‐ Takes a new "picture" of the capture buffer. If you are capturing data when you open the Signal Display window, the window shows only the state of the control signals that were in the buffer when the window was opened. Click this button to update the window with the contents of the current buffer.
Zoom In ‐ "Zooms in" on the signal display. How much you zoom in is determined by your selection in the Signals menu. You can zoom in by a factor of 2, 4, or 8.
Zoom Out ‐ Reverse of Zoom In.
Zoom to Selection ‐ Zooms to show only the region highlighted on the screen. If the highlighted area contains few events, the Signal Display window may also display additional events in order to fill up the screen.
Display Entire Buffer ‐ Zooms all the way out to display the contents of the entire buffer in the window.
Find ‐ Opens the Find Control Signal change window.
Snap to Nearest Change ‐ Moves the cursor to the nearest signal change whenever you click on the line graphics in the window. Find the line for the control signal whose changes you want to see. Click on that line, and the analyzer moves to the nearest signal change for that control signal. You can also highlight a range, and the analyzer snaps to the 2 nearest changes on either side of the range.
Timestamping Options ‐ Opens the Timestamping Options window, where you can change the timestamping resolution and how timestamps are displayed.
9.3 Reading the Signal Display
Control signal changes are displayed in a graphical format. On the left side of the screen is a list of the signals currently being displayed, and to the right of each name is a line displaying the state of the signal over time. A single line means that the signal was logically off, while a double line means that the signal was logically on. Dotted lines are used for signals that were not present at the time of capture. For example, if you are monitoring a circuit that does not use CD, that line appears as a dotted line in the control signal display.

87
The four information lines at the bottom of the window tell you what events are being shown in the window, and where you are in relation to the buffer as a whole.
• The first line tells you what event numbers are in the current snapshot, the total number of events, and the amount of time that passed between the first event in the snapshot and the last event (called Delta).
• The second line gives the same information about the events that are currently visible in the window. Because you can zoom in and out, often the events being shown in the window are not the same as the number of events in the current snapshot.
• The third line gives the same information for the currently selected events. You can highlight a range of events by clicking at any point on the graphical display and dragging the mouse to the left or the right. The third line shows information for the selected range.
• The fourth and last line shows the exact timestamps of the first and last bytes in the currently selected range. Note that this does not tell you the timestamp for the entire snapshot or the events displayed in the window, just the highlighted events.
A single mouse click places the cursor in the window. The analyzer highlights all six signal changes in one color, and uses a different color to specify the control signal line clicked on. You can highlight a range by clicking and dragging the mouse to the right or left. You can also use the arrow keys to move the cursor to the right or left. The Signal Display window is synchronized with other windows in the analyzer. A range highlighted in the Signal Display window is also highlighted in the Event Display and Frame Display windows.
The Snap to Nearest Change icon lets you place the cursor on the signal change you want to look at without needing to click on exactly the right spot. Find the line corresponding to the control signal you want to look at. Click on the line, and the analyzer moves the cursor to the nearest change. If you highlight a range, the analyzer "snaps to" the nearest changes on either side. This feature is active when the Snap To button is pressed, and inactive when the button is not pressed. Use the Zoom In and Zoom Out buttons to increase and decrease the magnification of the window. The analyzer changes the magnification by a factor of 2, 4 or 8, depending on the option selected in the Signals menu. If you want to see a range in greater detail, highlight the range you want to view and click
on the Zoom to Selection icon . The analyzer zooms in to show only that range in the window. If the range is small, the analyzer may add additional events to fill up the window.
To view the entire snapshot in the window, click on the Display Entire Buffer icon . Note that if you bring up the Signal Display window while data is being captured, the window shows you the state of the control signals at the time the window was opened. To
update the display, use the New Snapshot icon .

88
9.4 Selecting Signal Display Options
To access Signal Display Op s
lick the Signal Display icon
tion
C on the Control window toolbar. From the Options menu, elect Signal Display Options. s To choo w. se which control signals to display in the Signal Display windo
• Click on a box to check or un‐check it the control signal name. • A check mark next to a control signal name means that the signal is displayed.
89
10 Statistics
10.1 Statistics
Statistics displays vary according product configuration. Select the help topics that apply to the mode you are running.
10.2 Statistics Window
NOTE: T s when running FTS4BT in any of the following modes or when viewin eated using any of these modes:
his information applieg a capture file cr
• High Speed Serial HCI • ed UART (HSU) High Spe• USB HCI
To open the Statistics window, click the Statistics icon on the Control window toolbor choose Statistics from the View menu on the Control window. The Statistics window supplies basic information about the data on the network. When
ar,
reviewing a capture file, the Statistics window shows a summary of the data in the file. The analyzer monitors the network and collects statistics all the time, even when data is not
actively being captured. Activate the Lock icon to stop the window from updating.
Click the Unlock icon again to resume updating. The analyzer continues to monitor network traffic while the Statistics window is locked, so you may see the numbers jump right after updating has resumed, reflecting all the statistics that were gathered while the window was locked.
10.3 Session, Resettable and Capture File Tabs
The Session and Resettable tabs are parts of the Statistics window.
NOTE: This information applies when running FTS4BT in any of the following modes or when viewin eated using any of these modes: g a capture file cr
• High Speed Serial HCI • ed UART (HSU) High Spe• USB HCI
Information about all data collected since the analyzer was started is shown in the Session tab. The Session tab cannot be reset; in this sense, it is like the odometer on a car. The odometer on a car shows you all the miles driven since the car was built, and the Session tab shows you all the data collected since the analyzer was started.

90
If you think of the Session tab as the odometer, then the Resettable tab is the trip odometer. It can be reset, and allows you to record statistics for a new "trip". In this way you can effectively start a new session without having to restart the analyzer. If the Reset button was pressed during the capture, then the numbers on this tab differs from the numbers on the Session tab. The Capture File tab shows information on the data that is currently in the capture. If the capture file had become full, the analyzer began to overwrite the oldest data and put new
re data in its place. This is called "wrapping". If the file wrapped, the numbers on the CaptuFile tab is smaller than those on the Session tab. Occasionally some of the statistics read n/a, for Not Available. This happens for various reasons. For example, many of the items on the Capture File tab become not available (n/a) if the buffer becomes full and wraps. When this happens, the analyzer can no longer provide accurate statistics for the data in the file, because some of the data that the statistics are based on has been lost.
10.4 Copying Statistics To The Clipboard
NOTE: This information applies when running FTS4BT in any of the following modes or when viewin eated using any of these modes: g a capture file cr
• High Speed Serial HCI • ed UART (HSU) High Spe• USB HCI
To copy the information from an individual table to the clipboard (where it can be pasted into ny a application),
enu. 1. Choose the name of the table from the Edit m2. To copy the contents of all the tables, choose Copy All to Clipboard.
10.5 Graphs
10.5.1 Statistics Graphs
Open the Statistics window and click on the picture of a graph on the table header, or choose the graph name from the Graph menu on the Statistics window. The Frame Sizes Graph window has Session, Resettable and Buffer tabs that correspond to the tabs on the Statistics window. Each tab shows the data that corresponds to the appropriate tab on the Statistics window. The Frame Sizes Graph window displays the number of frames of each length in either a pie
chart or bar graph format. Click the Pie icon to display a pie chart, and click the Bar
icon to display a bar graph.

91
For networks with more than one side, the analyzer displays one graph for each side. To
e ides, click the Aggregate icon view th aggregate of all s .
10.5.2 Printing Graphs
1. Click the Print icon to print the graph. The analyzer prints exactly what is shown on the window.
10.5.3 Changing the Graph Refresh Rate
es once every second. The graphs window refreshTo change the refresh rate:
1. Click the Options icon on the Statistics window.
conds in the Time Interval (ms) text box. 2. Enter a new refresh rate in millise
10.5.4 Percentages or Values
On the S indow y ew data expressed as a percentage.
Viewing
tatistics w ou can vi 1. Open the Statistics window
to display. 2. Select the graphOn the g dow, raph win
Percentages3. Click the icon to view data expressed as a percentage. Percentages ico in to4. Click the n aga view the actual number of items of each type.
5. Click the Show Data Grid icon to view both the number and percentage of the total for each item. The analyzer places a grid in the legend.
10.6 I fn s ormation on Table
10.6.1 Frames Per Second Table
The Frames Per Second Table is found on the Statistics window. The window displays the following information.
NOTE: This information applies when running FTS4BT in any of the following modes or when viewin eated using any of these modes: g a capture file cr
• High Speed Serial HCI • High Speed UART (HSU)

92
• USB HCI
Current The current number of frames per second.
Average The average number of frames per second.
The highest number of frames per second. Peak
The Data Terminal Equipment (DTE) and Data Communication Equipment (DCE)
e peak utilization. timestamps correspond to the time of th
10.6.2 Characters Per Second Table
The Characters/Sec Table is found on the Statistics window. The window displays the following information.
NOTE: This information applies when running FTS4BT in any of the following modes or when viewin eated using any of these modes: g a capture file cr
• High Speed Serial HCI • ed UART (HSU) High Spe• USB HCI
Baud The current baud. Current The current number of characters per second. Average . The average number of characters per secondPeak The highest number of characters per second.
The Data Terminal Equipment (DTE) and Data Communication Equipment (DCE) the time of the peak utilization. timestamps correspond to
10.6.3 Utilization Table
The Utilization Table is found on the Statistics window. The window displays the following information.
NOTE: This information applies when running FTS4BT in any of the following modes or when viewin eated using any of these modes: g a capture file cr
• High Speed Serial HCI • ed UART (HSU) High Spe• USB HCI
Current The current number of bits per second divided by the maximum speed of the network, expressed as a percentage.

93
Average The average number of bits per second divided by the maximum speed of as a percentage. the network, expressed
The highest utilization. Peak
The Data Terminal Equipment (DTE) and Data Communication Equipment (DCE) imestamps correspond to the time of the peak utilization. t
10.6.4 Data Table
The Data Table is found on the Statistics window. The window displays the following information.
NOTE: This information applies when running FTS4BT in any of the following modes or when viewin eated using any of these modes: g a capture file cr
• High Speed Serial HCI • ed UART (HSU) High Spe• USB HCI
The information in the Data table relates to the amount of data captured by the analyzer. Data information varies depending on the type of data in the capture. When Ethernet data passes through a capture filter, this table displays statistics only for the data kept by FTS, i.e. only the data that passes the filter. The Unfiltered Data table always displays statistics for the entire network, regardless of the state of any capture filter.
Ethernet Data
This includes frames received with and without errors, and frames transmitted by the PC running the analyzer, if the PC is an active node on the network. This field and the Total Frames field in the Unfiltered Data table should be roughly equal, unless a capture filter is active. They are
he counters are updated at different times.
Frames
not exactly equal because t
Bytes The total number of bytes.
The total number of events captured. Events include data bytes and start‐of‐frame and end‐of‐frame markers. For a description of all events and
bols
Events
their symbols, see the List of Event Sym .
Multicast The total number of multicast frames.
The total number of broadcast frames. Broadcast

94
Serial Data
The total number of frames, if applicable, with a breakdown by DTE and DCE Frames device.
ce. Chars The total number of characters, with a breakdown by DTE and DCE devi
The total number of events captured. Events include data bytes, control signal changes, flow control changes, etc. For a description of all events and their symbols, see the
Events
List of Event Symbols.
Wireless Data
wn by device. Frames The total number of frames, if applicable, with a breakdo
Octets The total number of octets, with a breakdown by device.
The total number of events captured. Events include data bytes, start and end‐of‐frame markers, etc. For a description of all events and their symbols, see the
Events
List of Event Symbols.
10.6.5 Buffer Information Table
NOTE: This information applies when running FTS4BT in any of the following modes or when viewin eated using any of these modes: g a capture file cr
• High Speed Serial HCI • ed UART (HSU) High Spe• USB HCI
These errors do not indicate problems on the network, but rather indicate that FTS was not able to keep up with the amount of incoming data. They usually indicate that a faster PC was needed. See Performance Notes for more information.
Driver Buffer Overflow
The number of times the analyzer lost frames because it could not retrieve them from the driver buffer fast enough.
The remaining three items are for Ethernet data only.
The number of frames lost because the analyzer driver could not retrieve them from the NDIS buffers before they were overwritten by new, incoming frames.
Frames Missed, No Buffer
Receive The number of times that frames are lost because NDIS could not retrieve data quickly enough from the buffer on the network card.

95
Overrun
Frames ost L
The number of frames lost due to driver buffer overflows.
10.6.6 Errors Table
The Errors Table is found on the Statistics window. The table provides the number of each type of error seen on the network. Error types vary depending on the type of data. When analyzing Ethernet data, not all errors are supported by all NDIS drivers. Errors not upported are marked "n/a". s
NOTE: This information applies when running FTS4BT in any of the following modes or when viewin reated using any of these modes: g a capture file c
• Serial Asynchronous • High Speed Serial HCI • High Speed UART (HSU)
To graph, click the bar graph icon on the Errors table header.
Ethernet Errors
The number of frames with CRC errors. A CRC error occurs when the frame is properly aligned on a byte boundary but does not pass the Cyclic Redundancy Check. The CRC verifies that the data was not corrupted in
CRC Errors
transit.
The number of frames with alignment errors. Alignment errors occur when the frame does not end on a byte boundary. For example, frames
Alignment Errors
may not be 95 and 2 bits long. It must be either 92 or 93 bytes.
The total number of frames received with errors (includes frames with CRC and Alignment errors).
Rx Frames With Errors
Tx Frames With Errors
The total number of frames transmitted with errors.
Tx One Collision
The number of frames successfully transmitted after detecting one collision.

96
Tx More Collisions
The number of frames successfully transmitted after detecting multiple collisions.
The number of frames successfully transmitted after transmission has Tx Deferred been deferred at least once.
The number of frames not transmitted due to excessive collisions. Tx Max Collisions
Tx Underrun
The number of frames not transmitted due to underrun errors.
Tx Heartbeat Failure
The number of frames transmitted without detecting the collision detection heartbeat.
Tx Times CRS Lost
The number of times carrier sense was lost during frame transmission.
Tx Late Collisions
The number of collisions detected after the normal window.
Serial Asynchronous Errors
Overrun The number of overrun errors broken down by DTE and DCE device.
The number of parity errors broken down by DTE and DCE device. If you Parity have a large number of parity errors, check your I/O Settings for accuracy.
The number of framing errors broken down by DTE and DCE device. If you have a large number of framing errors, check your I/O Settings for accuracy.
Framing
Serial Synchronous Errors
The number of overrun errors broken down by DTE and DCE device. USART Overrun
Parity The number of parity errors broken down by DTE and DCE device. If you cy. have a large number of parity errors, check your I/O Settings for accura
The number of framing errors broken down by DTE and DCE device. If you have a large number of framing errors, check your I/O Settings for
Framing
accuracy.
The number of CRC errors detected. CRC counting is done only when CRC monitoring HDLC or SDLC data.
The number of underrun errors broken down by DTE and DCE device. Underrun errors occur when FTS is unable to transmit data quickly
Underrun
97
enough. These errors only occur when transmitting in sync mode.
High Speed Serial HCI and High Speed UART (HSU) Errors
Parity The number of parity errors broken down by device.
The number of framing errors broken down by device. Framing
ZigBee Errors
The number of FCS errors detected. FCS

98
11 Transmitting Data
The Transmit tool is an application used to send Ethernet or Serial data to test and/or verify network integrity. The Transmit tool is not a part of the FTS application, however. It is a separate application included with the FTS installation.
On product installation, the installer creates a folder on the windows desktop labeled Fro lin e]. nt e [Product Nam
1. Double‐click the Frontline [Product Name] desktop folder.
This opens a standard Windows file folder window.
Note: You can also access this dialog by selecting Start > All Programs > Frontline [Pro u ion #) > [Prodd ct Name] (Vers uct Name].
2. Double‐click on Transmit Data and the application opens.
nce the tool is open, select F1 to access the Help file to learn how to send the transmit files. O

99
11.1 Converting FTS Capture Files
One of the files that you can use to transmit data is a Frontline Test System (FTS) capture file. The capture file, extension .cfa, is a proprietary file type created using the FTS application.
To use a format. .cfa file in the Transmit tool, it first has to be converted to a binary
1. Open the capture file containing the data you want to transmit. , choose Export Events from the File menu. 2. On the Control window 3. Choose Binary Output.
4. In the Available Fields box, choose Char/Event Name. Click the Move One Item Right button (looks like ">") to add it to the Displayed Fields box. Remove any other fields in the Displayed Fields box.
5. Choose a filename in the Export box. The default file name is the name of your capture file, followed by the word "Events" (to distinguish it from a Frame export), with a .bin extension.
k 6. By default the file is saved in the same directory as the original capture file. Clicon the Browse button to save your file to another location.
transmit just DTE data or DCE data, be sure to 7. If you want to filter out the side ou probably want to filter out Special Events. you do not want. Also, y
8. Click Export. 9. The result is a .bin file, which you can use in the Transmit tool.
11.2 Flow Control when Transmitting
Flow Control is an option that you set in the I/O Settings window . Flow control (sometimes called "handshaking") is only available in source mode. There are four flow control options: None, RTS/CTS, DTR/DSR or Xon/Xoff.
When flow control is active, the analyzer waits for a specified condition before sending data. This feature is typically used for testing printers, stat muxes, and other devices which must throttle the data flowing to them.
1. Select I/O Settings from the Options menu or I/O Settings from the toolbar.

100
The analyzer supports both software and hardware flow control . Software flow control uses the Xon and Xoff values specified in the I/O Settings window. This means that if the analyzer receives an Xoff character while in source mode it stops sending data until an Xon character is received. DC1 and DC3 (hex 11 and hex 13 respectively) are most often used for software flow control. If you need to use other characters, simply enter the hex values that you want to use in the flow control boxes on the I/O Settings screen.
The analyzer supports both RTS/CTS and DTR/DSR hardware flow control. Selecting RTS/CTS means that the analyzer uses the RTS/CTS control signals to control data transmission. When sourcing DTE, the analyzer automatically asserts RTS and send data when CTS is asserted. While CTS is not asserted, the analyzer does NOT send data. When the analyzer is finished sending data, it de‐asserts RTS. In DCE mode the analyzer reverses the meaning of RTS and CTS, responding to RTS as the flow control indicator even though this is a non‐standard use of the signal.
Selecting DTR/DSR tells the analyzer to use the DTR/DSR control signals for flow control. When sourcing DCE, the analyzer automatically asserts and de‐assert DSR and responds to DTR. When sourcing DTE, the analyzer automatically asserts and de‐assert DTR and espond to DSR. r

101
12 Find
12.1 Starting a Search
You can search your data in several different ways. Some types of searches are relevant only for framed data and is not offered if the data is not framed. Other types of searches are available depending on the type of data being viewed.
To B gie n a Search
ptur1. Open a capture file, or ca e some data to search.
nt D y 2. Open the Eve ispla or Frame Display window.
3. Click on the Find icon or choose Find from the Edit menu. 4. The Find window has a tab for each type of search. Click on the appropriate tab for
the type of search you want to do. 5. Select the parameters for your search, and click Find Next. Find Next looks for the
next occurrence of the search criteria, while Find Previous looks for an earlier occurrence of the search criteria.
6. Press F3 to repeat the last search. Search results are highlighted in the Event or Frame Displays, or both if appropriate. The selection in the Event Display appears on the third line down from the top of the window by default: this value can be changed.
12.2 Using Go To
This type of search allows you to go to a particular frame or event, or to move through the mes at a time. You can move either forward or backwards data X number of events or fra
through the data. To acce th o funss e Go T ction:
1. Select Go To from the Edit menu on the Frame Display, Event Display, or the Protocol
Navigator. You can also click the Find icon on the toolbar
2. The system displays the Find dialog with the Go To tab selected.

102
Note: The tabs displayed on the Find dialog depend on the product you are running and the content of the capture file or buffer you are viewing. To go to par r frame : a ticula
on 1. Select the Frame Number radio butt
frame in the box. 2. Type the number
3. Click the Go To button.
4. To move forward or backward a set number of frames, type in the number of frames you want to move
5. Then click the Move Forward or Move Back button.
To go to par a ticular event :
vents Number radio button. 1. Select the Data Event Number or All E
nt in the box. 2. Type the number of eve
3. Click the Go To button.
4. To move forward or backwards through the data, type in the number of events that you want to move each time.
5. Then click on the Move Forward or Move Backward button.
6. For example, to move forward 10 events, type the number 10 in the box, and then click on Move Forward. Each time you click on Move Forward, FTS moves forward 10 events.
See Event Numbering for why the Data Event Number and All Events Number may be
different. As a general rule, if you have the Show All Events icon depressed on the Event Display window or Frame Display Event pane, choose All Events Number. If the Show All vents button is up, choose Data Event Number. E

103
12.3 Searching for Control Signal Changes
Control signal searching allows you to search for changes in control signal states for one or more control signals. You can also search for a specific state involving one or more control signals, with the option to ignore those control signals whose states you don’t care about. The analyzer takes the current selected byte as its initial condition when running searches that rely on finding events where control signals changed. To access the control signal search function
1. Select Find from the Edit menu on the Frame Display, Event Display, or the Protocol
ou ma nd icon Navigator. Y y choose to click the Fi from one of the toolbars
2. Click on the Signal tab of the Find dialog.
Note:
The tabs displayed on the Find dialog depend on the product you are running and the content of the capture file you are viewing.
Selecting Control Signals to Search
The section with the check boxes allows you to specify which control signals the analyzer should pay attention to when doing the search. The analyzer pays attention to any control signal with a check mark.
• mark next to a control signal Click on a box to place a check • Click again to uncheck the box • By default, the analyzer searches all control signals, which means all boxes start out
checked.

104
For example, if you are only interested in finding changes in RTS and CTS, you would check those two boxes and uncheck all the other boxes. This tells the analyzer to look only at the RTS and CTS lines when running the search. The other signals are ignored.
Searching for On, Off, or Changed States
The first three options are all fairly similar, and are described together. These options are searching for an event where:
• One or more control signals changed • One or more control signals changed from off to on • One or more control signals changed from on to off
Searching for an event where one or more signals changed means that the analyzer looks at every control signal that you checked, and see if any one of those signals changed state at any time. If you w l signal: ant to look at just one contro
• Check the box for the signal. • Uncheck all the other boxes. • Choose to search for an event where one or more signals changed. • The analyzer notes the state of the selected signal at the point in the buffer where
the cursor is, search the buffer, and stop when it finds an event where RTS changed state.
• If the end of the buffer is reached before an event is found, the analyzer tells you that no matches were found.
Searching for events where control signals changed state from off to on, or vice versa, is most useful if the signals are usually in one state, and you want to search for occasions
anged state. where they chFor example,
• If DTR is supposed to be on all the time but you suspect that DTR is being dropped• Tell the analyzer to look only at DTR by checking the DTR box and unchecking the
others • Do a search for where one or more control signals changed from on to off. • The analyzer would search the DTR signal and stop at the first event where DTR
dropped from on to off.
Searching for an Exact State
To search for an exact state means that the analyzer finds events that match exactly the state of the control signals that you specify.
• First, choose to search for an event where your choices exactly describe the state. • This changes the normal check boxes to a series of radio buttons labeled On, Off and
Don’t Care for each control signal. • Choose which state you want each control signal to be in.

105
• Choose Don’t Care to have the analyzer ignore the state of a control signal. • When you click Find Next, the analyzer searches for an event that exactly matches
the conditions selected, beginning from the currently selected event. • If the end of the buffer is reached before a match is found, the analyzer asks you if
you want to continue searching from the beginning. • If you want to be sure to search the entire buffer, place your cursor on the first
event in the buffer.
12.4 Searching for Data Errors
The analyzer can search for several types of data errors. You can choose which errors you want to search for and whether to search the DTE or DCE data or both. Bytes with errors are shown in red in the Event Display window, making it easy to find errors visually when looking through the data. To acce th errss e data ors search function
1. Select Find from the Edit menu on the Frame Display, Event Display, or the Protocol
ou ma Find icon Navigator. Y y choose to select the from one of the toolbars
2. Click on the Error tab of the Find dialog.
Note:
The tabs displayed on the Find dialog depend on the product you are running and the content of the capture file you are viewing.
Selecting Which Errors to Search
The section with the check boxes allows you to choose which errors the analyzer should look for. Click on a box to check or un‐check it

106
If you w verrun errors ant to search only for o• check the overrun box
s. • un‐check the other boxeTo searc f errors h for all types o
• check all boxes
Searching for Error Conditions
The first three options are all fairly similar, and are described together. These options are searching for an event where:
• one or more error conditions changed • one or more error conditions occurred
• one or more error conditions were off (i.e. no errors occurred) is looking for a few scattered errors in otherwise clean data. The most common search
To do this type of search: • ere one or more error conditions occurred choose to search for an event wh• choose which errors to look for • By default, the analyzer looks for all types of errors.
In contrast, searching for an event where one or more error conditions were off means that the analyzer looks for an event where the errors were not present. For example, if you have data that is full of framing errors, and you know that somewhere in your 20 megabyte capture file the framing got straightened out, you could choose to search for an event where one or more error conditions were off, and choose to search only for framing. The analyzer searches the file, and finds the point at which framing errors stopped occurring. Searching for an event where the error conditions changed means that the analyzer searches the data and stop at every point where the error condition changed from on to off, or off to on. For example, if you have data where sometimes the framing is wrong and sometimes right, you would choose to search framing errors where the error condition changed. This first takes you to the point where the framing errors stopped occurring. When you click Find Next, the analyzer stops at the point when the errors began occurring again. The analyzer takes the current selected byte as its initial condition when running searches that rely on finding events where error conditions changed. The analyzer searches until it finds an event where error conditions changed or it reaches the end of the buffer, at which point the analyzer tells you that there are no more events found in the buffer. If you are searching for an exact match, the analyzer asks you if you want to continue searching from the beginning of the buffer.
Searching for Exact Error Conditions
To search for an exact state means that the analyzer finds events that exactly match the error conditions that you specify.

107
• Select the "This exactly describes the state" radio button. • This changes the normal check boxes to a series of radio buttons labeled On, Off and
Don’t Care for each error. • On means that the error occurred • Off means that the error did not occur • or condition. Don’t Care means that the analyzer ignores that err• Select the appropriate state for each type of error.
Example:
If you need to find an event where just an overrun error occurred, but not any other type of error, you would choose overrun error to be On, and set all other errors to Off. This causes the analyzer to look for an event where only an overrun error occurred. If you want to look for events where overrun errors occurred, and other errors may have also occurred but it really doesn’t matter if they did or not, choose overrun to be On, and set the others to Don’t Care. The analyzer ignores any other type of error, and find events where overrun errors occurred. To find the next error, click the Find Next button. To find an error that occurred earlier in he buffer to where you are, click the Find Previous button. t
12.5 Searching for Frame Errors
There are several options for error searching: • Search for All Errors finds frame errors as well as frames with byte‐level errors
(such as parity or CRC errors). • Search for Frame Errors Only finds Frame specific errors, such as Frame Check
errors. • Search for Information Frame only searches Information Frames
To acce th ch wss e sear ithin decodes function:
1. Select Find from the Edit menu on the Frame Display, Event Display, or the Protocol
ou may nd icon Navigator. Y choose to select the Fi from one of the toolbars
2. Click on the Decode tab of the Find dialog.
3. Click the appropriate radio button for the type of search you want to perform or enter a value
4. Click Find Next.
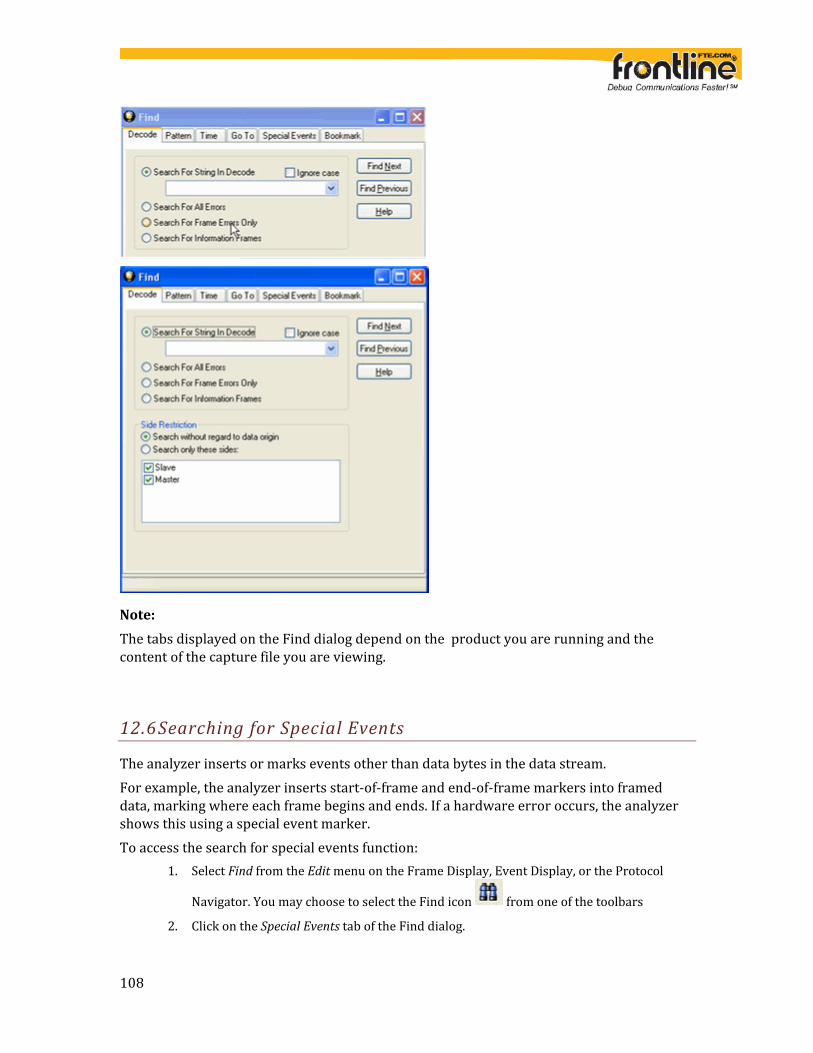
108
Note:
The tabs displayed on the Find dialog depend on the product you are running and the ontent of the capture file you are viewing. c
12.6 Searching for Special Events
The analyzer inserts or marks events other than data bytes in the data stream. For example, the analyzer inserts start‐of‐frame and end‐of‐frame markers into framed
. If a hardware error occurs, the analyzer data, marking where each frame begins and endsshows this using a special event marker. To acce th ch fss e sear or special events function:
1. Select Find from the Edit menu on the Frame Display, Event Display, or the Protocol
ou may choos Navigator. Y e to select the Find icon from one of the toolbars
2. Click on the Special Events tab of the Find dialog.

109
s you wa3. Check the event or event
4. Click Find Next.
nt to look for in the list of special events.
Note:
The tabs displayed on the Find dialog depend on the product you are running and the content of the capture file you are viewing.
• Not all special events are relevant to all types of data. For example, control signal changes are relevant only to serial data and not to Ethernet data.
For a list of all special events and their meanings, see List of All Event Symbols.
12.7 Searching within Decodes
Searching within decodes lets you to do a string search on the data in the Decode Pane of the Frame Display window. You can search one or both sides of the circuit, and your search can include wildcards. You can use characters, hex or binary digits, wildcards or a combination of any of the formats when entering your string. To acce th ch wss e sear ithin decodes function:
1. Select Find from the Edit menu on the Frame Display, Event Display, or the Protocol
ou may nd icon Navigator. Y choose to select the Fi from one of the toolbars.
2. Click on the Decode tab of the Find dialog.

110
Note:
The tabs displayed on the Find dialog depend on the product you are running and the ontent of the capture file you are viewing. c
12.8 Side Restrictions
Side Restriction means that the analyzer looks for a pattern coming wholly from the DTE or DCE side. If you choose to search without regard for data origin, the analyzer looks for a pattern coming from one or both sides. For example, if you choose to search for the pattern ABC and you choose to search without regard for data origin, the analyzer finds all three instances of ABC shown below.

111
The first pattern, with the A and the C coming from the DTE device and the B coming from the DCE is a good example of how using a side restriction differs from searching without regard to data origin. While searching without regard for data origin finds all three patterns, searching using a side restriction never finds the first pattern, because it does not come wholly from one side or the other. If you choose to search for the pattern ABC, and you restrict the search to just the DTE side, the analyzer finds the following pattern:
In this example, the analyzer finds only the second pattern (highlighted above) because we restricted the search to just the DTE side. The first pattern doesn't qualify because it is split between the DTE and DCE sides, and the third pattern, though whole, comes from just the DCE side. If we choose both the DTE and the DCE sides in the above example, then the analyzer finds the second pattern followed by the third pattern, but not the first pattern. This is because each side has one instance in which the whole pattern can be found. The analyzer
ide. completely searches the DTE side first, followed by the DCE side Restriction is available for pattern and error searching. S

112
12.9 Searching by Signal
You can riginating t Box. search using information o from the Breakou
1. Select one or more of the checkboxes for Pin 1, 2, 3, or 4. Click here to learn more about the Breakout Box and Pins 1 ‐ 4.
2. Select one of the four radio buttons to choose the condition that must be met in the search
3. Click Find Next to locate the next occurrence of the search criteria or Find Previous to locate an earlier occurrence of the search criteria.
12.10 Changing Where the Search Lands
When doing a search in the analyzer, the byte or bytes matching the search criteria are highlighted in the Event Display. The first selected byte appears on the third line of the display. To chan tge he line on which the first selected byte appears:
m Files\Common Files\FTE) 1. Open fts.ini (located in the C:\Progra
2. Go to the [CVEventDisplay] section
3. Change the value for SelectionOffset.
4. If you want the selection to land on the top line of the display, change the SelectionOffset to 0 (zero).

113
12.11 Subtleties of Timestamp Searching
Timestamping can be turned on and off while data is being captured. As a result, the capture uffer may have some data with a timestamp, and some data without. When doing a search y timestamp, the analyzer ignores all data without a timestamp. bb
12.12 Entering Search Patterns (String Searches)
12.12.1 Searching by Pattern
Search by Pattern lets you perform a traditional string search. You can combine any of the formats when entering your string, and your search can include wildcards. You can search
terwoven data such as serial communication. one or both sides of a circuit containing inTo acce th ch bss e sear y pattern function:
1. Select Find from the Edit menu on the Frame Display, Event Display, or the Protocol
ou can Navigator. Y also click the Find icon from one of the toolbars.
2. Click on the Pattern tab of the Find dialog.

114
Note:
The tabs displayed on the Find dialog depend on the product you are running and the of the c ing. content apture file you are view
12.12.2 Entering Characters
Various characters are used when creating a search string on the Find dialog. You can enter any character from a character set, with the following exceptions: \$&^?. These characters are used s card characters. a prefixes to let you to enter hex, binary, control or wild
1. Place the cursor in the Pattern box and type in your string.
2. Click Find Next in order to find the next occurrence of the string.
3. Click on Find Next as many times as necessary until the analyzer has searched all the data.
4. Clicking on Find Previous searches the buffer backwards.
The escape character is the backslash \. Use this character when you want to search for one of the above restricted characters. For example, to search for a $, you enter \$. To search for a \, enter \\. heck Ignore Case to do a case‐insensitive search. C

115
12.12.3 Entering Hex or Binary
re used when creating a search string on the Find dialog. Hex or Binary values aTo enter a hex value :
1. Enter a $ followed by two hex digits.
1. 2. For example, to search for hex 00 01, enter $00$0
3. If you need to specify the $ as a character, use \$.
4. The $ symbol tells the analyzer that the following characters are hex digits
To enter a binary value: • The & symbol tells the analyzer that a binary number comes next. For example, to
1111. search for binary 00001111, you would use &0000• If you need to specify the & as a character, use \&.
12.12.4 Control Characters
Various control characters are used when creating a search string on the Find dialog. You can enter any character from a character set, with the following exceptions: \$&^?. These characters are unavailable. The ^ (caret) is used to enter the control characters Ctrl‐A through Ctrl‐Z and Ctrl‐@,[,\,],‐ when using the ASCII character set. For example, ^A
($00). specifies Ctrl‐A ($01) and ^@ specifies ASCII NUL If you need to specify the ^ as a character, use \^. Note that neither the ^ character nor control characters exist in Baudot, so attempts to search for the ^ character results in an error message. The ^ character exists in EBCDIC, but control characters do not. A search for ^A in EBCDIC matches any occurrence of ^A $5F$C1). You do not need to use the escape character to search for a ^ character in EBCDIC. (
12.12.5 Wildcard Character
wildcard can be used when creating a search string on the Find dialog. A The wildcard character is the question mark (?). The analyzer supports wildcard searching at the byte, nibble and bit level. Wildcards can be used in place of characters, hex digits, and inary digits. If you need to search for a ?, you can use \?. b

116
12.12.6 Examples of Search Strings
In the Find function on the Frame Display, Event Display, or Protocol Navigator, you can search for any single byte in the range of hex $10 through $1F, type $1?.
&111111?? searches for binary numbers beginning with 111111 and ending with any combination of 1 and 0. 11111100, 11111101, 11111110, and 11111111 are all strings that match the search criteria. To search for any four character string which starts with an L and ends with an ES, type L?ES. You can combine formats in one string. For example, another way to specify a search for the tring L?ES is $4C&????????&01000101S. s
12.13 Searching by Time
12.13.1 Searching by Time
The analyzer can search by time in two different ways.
• Absolute
An absolute timestamp search means that the analyzer searches for an event at the exact date and time specified. If no event is found at that time, the analyzer goes to the nearest event either before or after the selected time, based on the "Go to the timestamp" selection.
• Relative
A relative search means that the analyzer begins searching from whatever event you are currently on, and search for the next event a specific amount of time away.
Note that the analyzer skips some special events that do not have timestamps, such as frame markers. Data events that do not have timestamps because timestamping was turned off
skipped. either before or during capture are alsoTo access the search by time function:

117
1. Select Find from the Edit menu on the Frame Display, Event Display, or the Protocol
ou m Find icon Navigator. Y ay choose to select the from one of the toolbars.
2. Click on the Time tab of the Find dialog.
3. Use the "Search for" radio buttons at the top of the dialog to indicate the search type
Note:
The tabs displayed on the Find dialog depend on the product you are running and the ontent of the capture file you are viewing. c
te Tim12.13.2 Searching with Absolu
To acce th ch b
estamp
ss e sear y time function: 1. Select Find from the Edit menu on the Frame Display, Event Display, or the Protocol
ou m icon Navigator. Y ay also select the Find from one of the toolbars
2. Click on the Time tab of the Find dialog.
Note: The tabs displayed on the Find dialog depend on the product you are running and the content of the capture file you are viewing.
3. Specify the time to search for by using the counters in the middle of the window.

118
• Click on the arrows next to each item to increase or decrease the value of each counter.
• By default, the counters display the timestamp of the first event in the file
4. After selecting the time, click on the Go To button to start the search.
Sometimes there can be more than one event with the same timestamp. The system ighlights all events with the specified timestamp. h
ve Tim12.13.3 Searching with Relati
To acce th ch b
estamp
ss e sear y time function: 1. Select Find from the Edit menu on the Frame Display, Event Display, or the Protocol
ou ca on Navigator. Y n also select the Find ic from one of the toolbars.
2. Click on the Time tab of the Find dialog.
Note: The tabs displayed on the Find dialog depend on the product you are running and the ontent of the capture file or buffer you are viewing. c
3. Click on the event in the Event Display window that you want to begin the search from. The event must have a timestamp in order for relative timestamp search to work.
4. In the Find dialog, use the counters in the middle of the window to specify the time interval you want to jump.

119
You can specify intervals in days, hours, minutes, seconds, and fractions of a second, or any combination of these.
5. When you have specified the time interval you want to use, click on the Move Forward or Move Backward buttons to start the search from the current event.
For example, to search for an event occurring 10 seconds after the currently selected event, choose to do a relative timestamp search, use 10 seconds for your time interval, and click on Move Forward. As with absolute timestamping, the analyzer highlights all events with the specified
p. timestam
12.13.4 Choosing "On or Before" or "On or After"
The analyzer searches for an event that matches the time specified. If no event is found at the time specified, the analyzer goes to the nearest event either before or after the specified time. Choose whether to have the analyzer go to the nearest event before the specified time or after the specified time by clicking the appropriate radio button in the "Go to the timestamp" box. If you are searching forward in the buffer, you usually want to choose the "On or After" utton. If you choose the "On or Before" option, it may be that the analyzer finishes the earch and not move from the current byte, if that byte happens to be the closest match. bs

120
13 Bookmarks
13.1 Bookmarks
• Bookmarks are a way to mark frames or events in a capture file. You can search for bookmarks and move quickly between bookmarks.
• Bookmarks appear as a magenta triangle next to the frame number in the Frame Display window. Any comment associated with the bookmark appears in the Bookmark column.
• When you add or change a bookmark, you are asked if you want to save your changes when you close the capture file, and given the option of saving the bookmarks to the current file or to a new one. See Confirming CFA Changes for more information.
13.2 Adding, Modifying or Deleting a Bookmark
You can Add, Modify, or Delete a Bookmark from the Add Bookmark dialog from the Frame Display, Event Display, or the Protocol Navigator.
Add:
1. the frSelect ant to boo ark.
2. Select Add or Modify Bookmark from the Edit menu on the Frame Display, Event Display,
or the Protocol Navigator. Or simply select the Add or Modify Bookmark
ame or event you w km
icon on one of the toolbars.
di log box, add a comment if you wish. 3. In the a
. Click OK. 4
You can also add a bookmark by right‐clicking on the frame and choosing Add Bookmark from the right‐click menu.
Modify nda Delete:
the frame or event with ark1. Select the bookm to be edited.
2. Select Add or Modify Bookmark from the Edit menu on the Frame Display , Event
Display , or the Protocol Navigator . Or simply select the Add or Modify
Bookmark icon on one of the toolbars.
the dialog box and click OK. 3. To modify a bookmark, change the comment in
4. To delete a bookmark, click the Delete button.

121
You can also modify or delete a bookmark by right‐clicking on the frame and choosing Modify Bookmark from the right‐click menu.
13.3 Displaying All and Moving Between Bookmarks
There are two ways to move between bookmarks. 1. Press the F2 key to move to the next frame or event with a bookmark.
2. Click the Display All Bookmarks icon . Select the bookmark you want to move to and click the Go To button, or simply double‐click on the bookmark. Click the Move Forward and Move Back buttons to cycle through the bookmarks.
• To delete a bookmark, select it and click the Delete button. • odifyTo modify a bookmark, select it and click the M button. • Click Remove All to delete all the bookmarks.

122
14 Filtering
14.1 Display Filters
Display filters allow a user to look at a subset of captured data without affecting the capture content general classes of display filters: . There are three
• Protocol Filters• Named Filters• Quick Filters
Protocol Filters
Protocol filters test for the existence of a specific single layer. The system creates a protocol ssion. filter for each decoder that is loaded if that layer is encountered in a capture se
There a pose filters that are treated as protocol filters: re also three special pur• All Frames with Errors • All Frames with Bookmarks • All Special Information Nodes
Named Filters
• Named filters test for anything other than simple single layer existence. Named filters can be constructed that test for the existence of multiple layers, field values in layers, frame sizes, etc., as well as combinations of those things. Named filters are persistent across sessions.
• Named filters are user‐defined. User‐defined filters persist in a template file. User defined filters can be deleted.
Quick Filters
• ilters that are Quick Filters are combinations of Protocol Filters and/or Named Fdisplayed on the Quick Filter tab.
• Quick Filters cannot be saved and do not persist across sessions. • Quick Filters are created on the Quick Filter Dialog or through filter selection on the
Protocol Navigator.
14.1.1 Including and Excluding Radio Buttons
All filter dialog boxes contain an "Include" and an "Exclude" radio button. These buttons are mutually exclusive. The "Include/Exclude" selection becomes part of the filter definition, and appears as part of the filter description displayed to the right of the Toolbar.
Include:

123
A filter constructed with the "Include" button selected, returns a data set that includes frames that meet the conditions defined by the filter and omits frames that do not.
Exclude:
A filter constructed with the "Exclude" button selected, returns a data set that excludes rames that meet the conditions defined by the filter and consists of frames that do not. f
14.1.2 Creating a Display Filter
There are two steps to using a display filter. Define the filter conditions, and then apply the filter to the data set. The system combines both filter definition and application in one dialog.
1. Click the Display Filters icon on either the Protocol Navigator or the Frame
Display window or select Apply/Modify Display Filters from the Filter menu to open the Set Condition dialog box.
2. Select Include or Exclude to
3. Select the initial condition for the filter from the drop‐down list.
4. Set the parameters for the selected condition in the fields provided. The fields that appear in the dialog box are dependent upon the previous selection. Continue to enter the requested parameters in the fields provided until the condition statement is
letcomp e.
5. Click OK. The system displays the Save Named Condition dialog. Provide a name for the filter condition or accept the default name provided by the system and click OK. Prohibited characters are left bracket '[', right bracket ']' and equal sign '='. The Set Condition dialog box closes, creates a tab on the Frame Display with the filter name, and applies the filter.
The filter appears in the Quick Filtering and Hiding Protocols dialog also. When a display filter is applied, a description of the filter appears to the right of the toolbar in both the Protocol Navigator and the Frame Display windows.
Notes:
aming and saThe system requires n ving of all filters created by the user. The OK button on the Set Condition dialog box is unavailable (grayed out) until the condition selections are complete. When you have multiple Frame Display windows with a display filter or filters, those filter do not automatically appear in other Frame Display windows. You must use the Hide/Reveal feature to display a filter created in one Frame Display in different Frame isplay window. D

124
14.1.3 Named Display Filters
You can create a unique display filter by selecting a data type on the Frame Display and using a right click menu. When you create a Name Filter, it appears in the Quick Filtering ialog, where you can use it do customize the data you see in the Frame Display panes. d
1. Select a frame in the Frame Display Summary Pane.
2. Right click in the one of the data columns in the Summary Pane: CRC, NESN, DS, Packet Address, etc. Success, Ethertype, Source
3. Select Filter in (data type)
he Filtering Results dialog appears. T
4. e Enter a nam for the filter
5. Select OK.
med Filters section of the The filter you just created appears in the Na Quick Filtering dialog.
14.1.4 Using Compound Display Filters
Compound filters use Boolean logic to create complex and precise filters. There are three primary Boolean logic operators: AND, OR, and NOT. The AND operator narrows the filter, the OR operator broadens the filter, and the NOT operator excludes conditions from the filtered results. Include parentheses in a compound filter to nest condition sets within larger condition sets, and force the filter‐processing order. There are two steps to using a compound filter. Define the filter conditions, and then apply the filter to the data set. The analyzer combines both filter definition and application in one dialog.
1. Click the Display Filters icon on either the Protocol Navigator or the Frame Display window or select "Apply/Modify Display Filters" from the filter menu to open the Set
dialog boCondition x.
2. Click the Advanced button on the Set Condition dialog box.
3. Select the initial condition for the filter from the combo box.
4. Set the parameters for the selected condition in the fields provided. The fields that appear in the dialog box are dependent upon the previous selection. Continue to enter the requested parameters in the fields provided until the conditions statement is complete.
5. Click the Plus icon on the left side of the dialog box and repeat steps 3 and 4 for the omplete. next condition. Continue adding conditions until your filter is c
6. Include parentheses as needed and set the Boolean operators.

125
7. Click OK. The system displays the Save Named Condition dialog. Provide a name for the filter condition or accept the default name provided by the system and click OK. The Set Condition dialog box closes, creates a tab on the Frame Display with the filter name, and applies the filter.
When a display filter is applied, a description of the filter appears to the right of the toolbar in both the Protocol Navigator and the Frame Display windows.
Note:
Use the Up and Down arrow icons on the left side of the dialog box to order your
lete button conditions, and the De to delete conditions from your filter. he OK button on the Set Condition dialog box is unavailable (grayed out) until the condition elections are complete. Ts
14.1.5 Defining Node and Conversation Filters
There are two steps to using Node and Conversation display filter. Define the filter conditions, and then apply the filter to the data set. The analyzer combines both filter definitio a ation in one g. n nd applic dialo
1. Click the Display Filters icon on either the Protocol Navigator or the Frame Display window or select "Apply/Modify Display Filters" from the filter menu to open the Set Condition dialog box.
2. Choose "frames with the conversation" as the initial condition from the Select combo box.
3. Select an address type from the Type combo box (The address type selection populates both Address combo boxes with node address in the data set that match the type selection).
4. Select a node address from the first combo box.
5. Choose a direction arrow from the Direction box. The left arrow filters on all frames where the top node address is the destination, the right arrow filters on all frames where the top node address is the source, and the double arrow filters on all frames
Address
where the top node address is either the source or the destination.
9. 6. If you want to filter on just one node address, skip step 7 & 8, and continue with step
7. If you want to filter on traffic going between two address nodes (i.e. a conversation), add e Type combo box. select an address type for the second node ress from th
a address from8. Select node the second Address combo box.
9. Click OK. The Set Condition dialog box closes and the analyzer applies the filter.
When a display filter is applied, a description of the filter appears to the right of the toolbar in both the Protocol Navigator and the Frame Display windows.

26 1
Note
ion selections are complete. :
The OK button is unavailable (grayed out) until the condit
14.1.6 Using Advanced Display Filtering Techniques
Intermediate to advanced users, with a solid knowledge of filter definition and application may find it useful to create some of the more common filters "on the fly" using the advanced filtering techniques. Choose eon of the panes in either the Frame Display or Protocol Navigator windows:
1. Place the cursor over a parameter you wish to filter on such as a node address or protocol type, and right click.
ppears with selections for filtering. 2. A pop up menu a
3. Select the filter.
4. The system either closes the menu and applies the filter, or displays the Set Conditions dialog box with the known parameters filled in and the additional options available to complete the conditions statement.
14.1.7 D aeleting nd Hiding Display Filters
14.1.7.1 The Difference Between Deleting and Hiding Display Filters
If you wish to remove a filter from the system permanently, then use the Delete procedure. However, if all you want to do is remove a filter as a means to un‐clutter the display, then use the Hide procedure. Deleting a saved filter removes the filter from the current session and all subsequent sessions. In order to retrieve a deleted filter, the user must recreate it using the Set Conditions dialog. Hiding a filter merely removes the filter from the display. A hidden filter can be reapplied sing the u Show/Hide procedure.
14.1.7.2 Deleting Saved Display Filters
1. Select Delete Display Filters from the Filter menu in either the Protocol Navigator or
the Frame Display window to open the Delete Named Condition dialog. The system f all user defined filters. displays the Delete Named Condition dialog with a list o
filter to be deleted from the drop‐down list. 2. Select the
button. 3. Click the Delete
4. Click OK. The Delete Named Condition dialog box closes and the system deletes the filter.

127
Hiding/ eR vealing a Display Filter
1. Select "Hide/Show Display Filters" from the filter menu on either the Protocol Navigator
or the Frame Display window to open the Hide/Show dialog. The system r defined filters. displays the Hide/Show dialog with a list of all use
idden from the combo box. 2. Select the filter to be h
button. 3. Click the Hide
4. Click OK. The Hide/Show dialog box closes, and the system hides the filter and removes the filter tab from the Frame Display.
Revealing a Hidden Display Filter
There are several ways to reveal a hidden filter. One can open the Quick Filter dialog and check the box next to the hidden filter, or check the box next the hidden filter in the Protocol Navigator display. Perform he t following actions to reveal a hidden filter:
1. Select "Hide/Show Display Filters" from the filter menu in either the Protocol Navigator
or the Frame Display window to open the Hide/Show dialog. The system efined filters. displays the Hide/Show dialog with a list of all user d
filte vealed from the combo box. 2. Select the r to be re
button. 3. Click the Show
4. Click OK. The Hide/Show dialog box closes and the system reveals the filter and adds the filter tab to the Frame Display.
Note: When you have multiple Frame Display windows with a display filter or filters, those filter do not automatically appear in other Frame Display windows. You must use the Hide/Reveal feature to display a filter created in one Frame Display in different Frame Display window.
14.1.8 Editing Filters
14.1.8.1 Modifying a Condition in a Filter
1. Click the Display Filters icon on either the Protocol Navigator or the Frame
Display window or select "Apply/Modify Display Filters" from the Filter menu to open the Set Condition dialog box. The Set Condition dialog box displays the current filter definition. To display another filter, click the Open icon, and select the filter from the Popup list of all the saved filters.
2. Edit the desired parameter of the condition. Because the required fields for a condition statement depend upon previously selected parameters, the Set Condition dialog box may display additional fields that were not

128
present in the original filter. In the event this occurs, continue to enter the requested et until the condition staparam ers in the fields provided tement is complete.
3. Click OK. The system displays the Save Named Condition dialog. Ensure that the filter name is displayed in the text box at the top of the dialog, and click OK. (If you choose to create an additional filter, then provide a new name for the filter condition or accept the default name provided by the system and click OK.) The Set Condition dialog box closes, and the system applies the modified filter.
Note:
When a display filter is applied, a description of the filter appears to the right of the toolbar vigator and in both the Protocol Na the Frame Display windows.
The OK button on the Set Condition dialog box is unavailable (grayed out) until the condition elections are complete. s
14.1.8.2 Deleting a Condition in a Filter
1. Click the Display Filters icon on either the Protocol Navigator or the Frame Display window or select "Apply/Modify Display Filters" from the Filter menu to open the Set Condition dialog box. The Set Condition dialog box displays the current filter definition. To display another filter, click the Open icon, and select the filter from the Popup list of all the saved filters.
2. dition from the filter definition. Select the desired con
3. Click the Delete icon.
he rentheses as needed. 4. Edit t Boolean operators and pa
5. Click OK. The system displays the Save Named Condition dialog. Ensure that the filter name is displayed in the text box at the top of the dialog, and click OK. (If you choose to create an additional filter, then provide a new name for the filter condition or accept the default name provided by the system and click OK.) The Set Condition dialog box closes, and the system applies the modified filter.
Note:When a display filter is applied, a description of the filter appears to the right of e Protocol Nthe toolbar in both th avigator and the Frame Display windows.
The OK button on the Set Condition dialog box is unavailable (grayed out) until the condition elections are complete. s
14.1.8.3 Renaming a play Filter Dis
1. Select "Rename Display Filters" from the Filter menu in either the Protocol Navigator
or the Frame Display window to open the Rename Filter dialog. The system efined filters. displays the Rename Filter dialog with a list of all user d
box. 2. Select the filter to be renamed from the combo
a n ame for the fi3. Enter ew n lter in the text box.
4. Click OK. The Rename Filter dialog box closes and the system renames the filter.

129
14.2 Protocol Filtering from the Frame Display
14.2.1 Easy Protocol Filtering
There are two types of easy protocol filtering. The first method lets you filter on the protocol shown in the Summary pane, and the second lets you filter on any protocol discovered on the network so far.
ar14.2.2 Filtering On the Summ er Protocol
To filter n
y Lay
o the protocol in the Summary in the Frame Display window pane: protocol, or open the Summary Layer combo box. 1. Select the tab of the desired
2. Select the desired protocol.
3. To filter on a different layer, just select another tab, or change the layer selection in the combo box.
14.2.3 Quick Filtering on a Protocol Layer
1. To filter on any protocol layer, open either the Frame Display or Protocol Navigator window.
2. On the Frame Display window, click the starred Quick Filtering icon or select "Quick Filtering" from the Filter menu.
This opens a dialog that lists all the protocols discovered so far. The protocols displayed hange depending on the data received. c The box on the left is Protocols To Filter In.
• When you select the checkbox for a protocol in the Protocols to Filter In, the Summary Pane will only display those frames that contain data from that protocol.
If you filter on more than one protocol, the result are all frames that contain at least one of those protocols. For example, if you filter on IP and IPX NetBIOS, you receive all frames that contain either IP or IPX NetBIOS (or both). A Quick Filter tab then appears on the Frame Display labeled Quick Filter. Changing the filter definition on the Quick Filter dialog changes the filter applied on the Quick Filter tab. Quick filters are persistent during the session, but re discarded when the session is closed. a

130
The box in the center is the Protocols To Hide. • When you select the checkbox for a protocol in the Protocols To Hide, data for that
protocol will not appear in the Decode, Binary, Radix, and Character Panes. The frames containing that type data will still appear in the Summary Pane, but not in the Decode, Binary, Radix, and Character Panes.
The box on the right is the Named Filters. It contains filters that you create using the Named Filter and Set Condition dialogs.
• When you select the checkbox for the Name Filters, a tab appears on the Summary Pane that displays the frame containing the specific data identified in the filter. The named Filter tab remains on the Frame Display Summary Pane unless you hide it using the Hide/Show Display Filters dialog.
With FBLEA, the Configured BT Low energy devices and Exclude NULLSs and POLLs are efault named filters. d
3. Check the small box next to the name of each protocol you want to filter in, hide, or er display. Named Filt to
4. Then click OK.
ith E14.2.4 Filtering on all Frames w
To filter on all frames with errors:
rrors from the Frame Display
1. Open the Frame Display window.
2. uiClick the starred Q ck Filter icon o u r select "Quick Filtering" from the Filter men
h Errors in the "Protocols to filter OK. 3. Check the box for All Frames Wit in" pane, and click
4. The system creates a tab on the Frame Display labeled Quick Filter that displays the results of the All Frames With Errors filter.
14.3 Protocol Filtering from the Protocol Navigator
14.3.1 Filtering on a Protocol Layer
You can filter on one or more protocol layers. The filter is inclusive which means only frames matching the filter you select are shown in the window. Frames that do not contain he protocol do not appear. You can filter on one protocol or several. t

131
On the left side of the Protocol Navigator window are three panes. The top pane is the Frames ilt he circuit. F ered In pane. In the pane is a list of all the protocols seen so far on t
1. Check the boxes next to the names of the protocols you want to filter in.
he data on the right side of the screen matches the filtering selected. T Three additional filters available are:
• All Frames With Bookmarks ‐ filters in all frames with a bookmark associated with them.
• All Frames With Errors ‐ filters in all frames•
with errors. All Special Information Nodes ‐ filters in all special information nodes .
ookma14.3.2 Filtering on all Frames with B
To filter n s with bookmark :
rks
o all frame s
rotocol Navigator 1. Open the P window.
ox in the top pane on the left side of the window. 2. Check the All Frames With Bookmarks b
3. To remove the filter, un‐check the box.
th Er14.3.3 Filtering on all Frames wi
To filter on all frames with errors :
rors from the Protocol Navigator
1. roOpen the P tocol Navigator window.
the top pane on the left side of the window. 2. Check the All Frames With Errors box in
3. To remove the filter, un‐check the box.
ation Nodes 14.3.4 Filtering on all Frames with Special Inform
To filter n rma es: o all frames with special info tion nod
1. Open the Protocol Navigator window.
2. Check the All Special Information Nodes box in the top pane on the left side of the window.
3. To remove the filter, un‐check the box.

132
14.3.5 Named Filters
You can create, modify, and delete filters using the Filter menu items on the Protocol Navigator and Frame Display dialogs.
If you create a Named filter using the Filters dialog, the filter appears in the Named Frame Filters pane . in the bottom left corner of the Protocol Navigator window
1. Check the boxes next to the names of the filters you want to use.
ote that using a named filter affects the contents of the Frame Display window as well. N

133
15 Saving Data
15.1 Saving Your Data
You can save all or part of a capture file. You can also load a previously saved capture file, and save a portion of that file to another file. This feature is useful if someone else needs to see only a portion of the data in your capture file. On the Control toolbar you can set up to capture a single file or series of files. Click here to see those settings. There are two ways to save portions or all of the data collected during a data capture. Click here to see how to capture data.
15.2 Saving the Entire Capture File using File > Save or the Save icon
This option is only available when you select Single File from the Capture Mode on System Settings. Click here to learn more about selecting Save options from System Settings.
1. If you are capturing data, click on the Stop icon to stop data capture. You cannot save data to file while it is being captured.
2. EvOpen the t Display en or Fr ame Display w
3. Click the Save icon, or select Save from the File menu.
indow.

134
4. Type a filename in the File name box at the bottom of the screen.
5. Browse to select a specific directory. Otherwise your file is saved in the default capture file directory.
6. When you are finished, click OK.
15.3 Saving the Entire Capture File with Save Selection
1. If you are capturing data, click on the Stop icon to stop data capture. You cannot save data to file while it is being captured.
2. Open the Event Display or Frame Display window.
3. lick in the datRight c a
4. Select Save Selection or Save As from the right click menu
1. ioClick on the rad ton ntire File.
2. Choose to save Events or Frames. Choosing to save Events saves the entire contents of capture
but labeled E
the capture file. Choosing to save Frames does not save all events in the file.
3. Type a filename in the Save As box at the bottom of the screen. Click the Browse icon to browse to a specific directory. Otherwise your file is saved in the default capture file directory.
4. When you are finished, click OK.

135
15.4 Saving a Portion of a Capture File
1. If you are capturing data, click on the Stop icon to pause data capture. You cannot to a file while it is being captured. save data
2. Open the Event Display or Frame Display window , depending on whether you want to specify a range in bytes or in frames.
3. Select the portion of the data that you want to save. Click and drag to select data, or click on the first item, move to the last item and Shift+Click to select the entire range, or use the Shift key with the keyboard arrows or the navigation icons in the Frame Display toolbar. If the range you want to save is too large to select, note the numbers of the first
ge. and last item in the ran
lick in the dat4. Right c a
5. Select Save Selection or Save As from the right click menu
6. Click on the radio button labeled Selection. If you selected a range, make sure the
starting and ending numbers are correct. To specify a range, type the numbers of the items e rangfirst and last in th e in the boxes.
7. Select either Events or Frames to indicate whether the numbers are event or frame numbers.
8. Type a filename in the Save As box at the bottom of the screen. Click the Browse icon to browse to a specific directory. Otherwise your file is saved in the default capture file
ordirect y.
9. Click OK when you are finished.

136
15.5 Confirm Capture File (CFA) Changes
This dialog appears when you close a capture file after changing the Notes, the protocol stack, or bookmarks. The dialog lists information that was added or changed and allows you to select which information to save, and whether to save it to the current file or to a new ne. o
Changes made to the file appear in a list in the left pane. You can click on each item to see details in the right pane about what was changed for each item. You simply check the boxes next to the changes you want to keep. Once you decide what changes to keep, select one of the following:
• have made to the current capture file. Save To This File – Saves the changes you • Save As – Saves the changes to a new file. • Cancel the Close Operation – Closes the file and returns you back to the display. No
changes are saved. • Discard Changes – Closes the file without saving any of the changes made to the
notes, bookmarks, or protocol stack.
15.6 Adding Comments to a Capture File
The Notes feature allows you to add comments to a CFA file. These comments can be used for many purposes. For example, you can list the setup used to create the capture file, record why the file is useful to keep, or include notes to another person detailing which frames to look at and why. (Bookmarks are another useful way to record information about individual frames.)
To open th e Notes window :
1. Click the Show Notes icon . This icon is present on the toolbars of the Frame Display
, the Protocol Navigator , as well as the Event Display . Notes can be selected from the Edit menu on one of these windows.
2. Type your comments in the large edit box on the Notes window. The Cut, Copy, Paste, re alUndo and Redo features a l supported.
3. Click the thumbtack icon to keep the Notes window
on top of any other windows.
4. When you're done adding comments, close the window.
5. When you close the capture file, you are asked to confirm the changes to the capture file. See Confirming Capture File (CFA) Changes for more information.

137
16 Loading and Importing Capture Files
16.1 Loading a Capture File
From th Coe ntrol Window: 1. Go to the File menu.
. 2. Choose a file from the recently used file list
3. If the file is not in the File menu list, select Open Capture File from the File menu or
simply click on the Open icon on the Toolbar.
se if necessary to find your capture file. 4. Capture files have a .cfa extension. Brow
5. Click on your file, and then click Open.
16.2 Importing Capture Files
1. From the Control Window , go to the File menu and select Open Capture File or click on the Open icon on the Toolbar.
s. 2. Change the Files of Type box to All Importable File Types or All Supported File TypeSelect the file and click Open.
The analyzer automatically converts the file to the analyzer's format while keeping the original file in its original format. You can save the file in the analyzer's format, close the file without saving it in the analyzer's format, or have the analyzer automatically save the file in the analyzer's format (see the System Settings to set this option). All of these options keep your original file untouched. When you first open the file, the analyzer brings up the Protocol Stack window and ask you what protocol decodes, if any, you want to use. You must choose a protocol decode at this point for the analyzer to decode the data in the file. If you open a file without using any
, choose decodes, and decide later that you want to apply a decode Reframe from the File menu on the Control window. At present, the analyzer supports the following file types:
• Frontline Serialtest* Async and Serialtest ComProbe® for DOS – requires the .byt for data and the .tim for timestamps (see note on importing DOS timestamps).
• Greenleaf ViewComm* 3.0 for DOS ‐ requires the .byt for data and the .tim for timestamps (see note on importing DOS timestamps).
• Frontline Ethertest* for DOS – requires 3 files: filename.cap, filename.ca0 and filename.ca1.
• Sniffer Type 1 – supports files with the .enc extension. Does not support Sniffer files with a .cap extension.
• Snoop or Sun Snoop – files with a .cap extension based on RFC 1761. For file format, see http://www.faqs.org/rfcs/rfc1761.html.

138
• Shomiti Surveyor files in Snoop format – files with a .cap extension. For file format, contact Technical Support.
• CATC Merlin ‐ files with a .csv extension. Files must be exported with a specific format. See File Format for Merlin Files for in
• CATC Chief ‐ files with a .txt extension. formation.
16.3 Converting Timestamps
Serialtest for DOS uses a timebase of Pacific Standard Time during non daylight savings time hours and Pacific Daylight Time during daylight savings time hours. The analyzer always uses Greenwich Mean Time (also known as Universal Time Coordinates). When importing a Serialtest for DOS file, the analyzer must determine if the file was recorded during daylight savings time or not before converting the timestamps. Because the rules for determining this can change, it is possible for the analyzer to convert the timestamps incorrectly, resulting in timestamps that are off by one hour.
16.4 Adding Comments to a Capture File
The Notes feature allows you to add comments to a CFA file. These comments can be used for many purposes. For example, you can list the setup used to create the capture file, record why the file is useful to keep, or include notes to another person detailing which frames to look at and why. (Bookmarks are another useful way to record information about individual frames.)
To open the Notes window :
1. Click the Show Notes icon . This icon is present on the toolbars of the Frame Display
, the Protocol Navigator , as well as the Event Display . Notes can be selected from the Edit menu on one of these windows.
2. Type your comments in the large edit box on the Notes window. The Cut, Copy, Paste, re alUndo and Redo features a l supported.
3. Click the thumbtack icon to keep the Notes window
on top of any other windows.
4. When you're done adding comments, close the window.
5. When you close the capture file, you are asked to confirm the changes to the capture file. See Confirming Capture File (CFA) Changes for more information.

139
16.5 File Format for Merlin Files
FTS imports Merlin’s export files that have been exported with Merlin’s default settings. These files should have an extension of ".csv". It is possible with the Merlin software to hide or change a field’s format. If you do this before exporting the Merlin file then FTS may have trouble importing the file. If you are experiencing problems importing Merlin files, then check to make sure that no fields were hidden and that the default field formats were being used, when the file was xported from Merlin. e

140
17 Printing
17.1 Printing from the Frame Display/HTML Export
The Frame Display Print dialog and the Frame Display HTML Export are very similar. This discusses both dialotopic gs.
The Frame Display Print dialog is directly below. The Frame Display HTML Export is located midway in this discussion.
About Frame Display Print
The Frame Display Print feature provides the user with the option to print the entire capture buffer or the current selection. When Print Preview is selected, the output displays in a browser print preview window, where the user can select from the standard print options. The output file format is in html, and uses the Microsoft Web Browser Control print options for background colors and images (see below).
Print Background Colors Using Internet Explorer
nu bar 1. Open the Tools menu on the browser me
ons…” menu entry. 2. Select “Internet Opti
3. Click Advanced tab.
mages” under the Printing section 4. Check “Print background colors and i
5. Click the Apply button, then click OK
Configure the Print File Range in the Frame Display Print Dialog
Selecting more than one frame in the Frame Display window defaults the radio button in the Frame Display Print dialog to Selection and allows the user to choose the All radio button. When only one frame is selected, the All radio button in the Frame Display Print dialog is selected.
How to ri me play Data P nt Fra Dis
1. Select Print or Print Preview from the File menu on the Frame Display window to display the Frame Display Print dialog. Select Print if you just want to print your data to your default printer. Select Print Preview if you want access to printer options.
2. Choose to include the Summary Pane (check the box) in the print output. The summary Pane appears at the beginning of the printed output in tabular format. If you select All layers in the Detail Section, the Data Bytes option becomes available.
3. In the Detail Section, choose to exclude the decode from the Detail Pane in the Frame Display, or include All Layers or Selected Layers Only. If you choose to include selected layers, then select (click on and highlight) the layers from the list box. Click on selected layers in the list to de‐select, or click the Reset button to de‐select all selected layers.

141
CAUTION: Decode layers printout expanded regardless of the state of the Detail Pane in the Frame Display at the time of the request to print. This can produce a print output consisting of hundreds of pages or more. We recommend that you use Print Preview to determine the number of pages in your print output prior to printing.
Select the range of frames to include All or Selection in the Frame Range section of the Frame Display Print dialog. Choosing All prints all of the frames in the capture file or buffer. If more than 1000 frames in the Frame Range, All will be disabled. You can still select more than 1000 frames using the Selection option, but when printing more than 1000 frames, there is the possibility that Print will not work properly. Choosing Selection prints only the frames you select in the Frame Display window.
Note: Selecting the Delete File deletes the temporary html file that was used during printing..
lick the OK but4. C ton.
If you chose Print Preview, the system displays your data in a browser print preview display with options for printing such as page orientation and paper size. You can also use your Printer Preferences dialog to make some of these selections. When printing your data, the analyzer creates an html file and prints the path to the file at the bottom of the page. This file can be opened in your browser, however, it may appear different than the printed ersion. v

142
17.2 Frame Dis L Export play HTM
The Frame Display HTML Export feature provides the user with the option to export the entire capture buffer to an .html file.
How to xp splay data ml e ort di to an .ht file
1. Select HTML Export from the File menu on the Frame Display window to display the Frame Display HTML Export.
2. Choose to include the Summary Pane (check the box) in the .html output. If you select All layers in the Detail Section, the Data Bytes option becomes available.
3. In the Detail Section, choose to exclude the decode from the Detail Pane in the Frame Display, or include All Layers or Selected Layers Only. If you choose to include selected layers, then select (click on and highlight) the layers from the list box. Click on selected
the set buttolayers in the list to de‐select, or click Re n to de‐select all selected layers.
4. Select the range of frames to include All or Selection in the Frame Range section of the dialog.
es you Choosing Selection includes only the fram select in the Frame Display window.
Note: If the file size is too big, the Frame Range, All, will not be available. It will be grayed out.
5. Click the OK button.

143
The Save As dialog appears.
6. Enter a name for the file you want to save.
Note: Th to choose a file type. The file is saved as a .htm. ere is no need7. Select Save
The file is saved as a .htm file in the file location you chose.
17.3 Printing from the Event Display
About Event Display Print
The Event Display Print feature provides the user with the option to print either the entire capture buffer or the current selection. When Print Preview is selected, the output displays in a browser print preview window where the user can select from the standard print options. The output file format is in html, and uses the Microsoft Web Browser Control print options for background colors and images (see below).
Print Background Colors Using Internet Explorer
nu bar 1. Open the Tools menu on the browser me
ons…” menu entry. 2. Select “Internet Opti
3. Click Advanced tab.
mages” under the Printing section 4. Check “Print background colors and i
5. Click the Apply button, then click OK
The Event Display Print feature uses the current format of the Event Display as specified by the user.

144
Note: See About Event Display for an explanation on formatting the Event Display prior to initiating the print feature.
Configure the Print File Range in the Event Display Print Dialog
Selecting more than one event in the Event Display window defaults the radio button in the Event Display Print dialog to Selection and allows the user to choose the All radio button. When only one event is selected (can’t have None selected), the All radio button in the Event Display Print dialog is selected.
How to ri nt Display Data to er P nt Eve a Brows
1. Select Print or Print Preview from the File menu on the Event Display window to display the Event Display Print dialog. Select Print if you just want to print your data to your
cc to printedefault printer. Select Print Preview if you want a ess r options.
2. Select the range of events to include from either All or Selection in the Event Range section of the Event Display Print dialog. Choosing All prints all of the events in the capture file or buffer. Choosing Selection prints only the selected events in the Event Display window.
Note: In order to prevent a Print crash, you cannot select All if there are more than 100,000 events in the capture buffer.
Note: See Configure the Print File Range in the Event Display Print Dialog above for an explanation of these selections
3. Click the OK button.
If you chose Print Preview, the system displays your data in a browser print preview display with options for printing such as page orientation and paper size. You can also use your Printer Preferences dialog to make some of these selections. When printing your data, the analyzer creates an html file and prints the path to the file at the bottom of the page. This file can be opened in your browser, however, it may appear different than the printed ersion. v

145
17.4 Print Preview
Print Preview gives a preview of how the data looks printed. You can scroll through the a closer look. The line of buttons across the top of the window.
pages and zoom in on the data to getwindow controls the functions of theTo open he t Print Preview window:
1. Choose Print Preview from the File menu in any window that supports printing.
2. Choose to include the Summary Pane (check the box) in the print output. The summary Pane appears at the beginning of the printed output in tabular format. If you select All layers in the Detail Section, the Data Bytes option becomes available.
3. In the Detail Section, choose to exclude the decode from the Detail Pane in the Frame Display, or include All Layers or Selected Layers Only. If you choose to include selected layers, then select (click on and highlight) the layers from the list box. Click on selected
Resetlayers in the list to de‐select, or click the button to de‐select all selected layers.
CAUTION: Decode layers printout expanded regardless of the state of the Detail Pane in the Frame Display at the time of the request to print. This can produce a print output consisting of hundreds of pages or more. We recommend that you use Print Preview to determine the number of pages in your print output prior to printing.
4. Select the range of frames to include All or Selection in the Frame Range section of the Frame Display Print dialog. Choosing All prints all of the frames in the capture file or buffer. If there are more than 1000 frames in the capture file or buffer, All will not be available. Choosing Selection prints only the selected frames in the Frame Display window.
Note: See Configure the Print File Range in the Frame Display Print Dialog above for an explanation of these selections.

146
Note: Selecting the Delete File deletes the temporary html file that was used during printing..
5. Click the OK button.
You can print directly from the Print Preview window.
• data looks Next Page shows you how the next page in your• Prev Page takes you back to the previous page. • Two Page changes the display to show two pages of data. When in the Two Page
display, the button reads One Page. Click on the One Page button to return to viewing one page.
• Zoom In and Zoom Out allow you to change the magnification of the pages. Click on Zoom In to increase the magnification, and on Zoom Out to decrease the magnification. When you have reached the limit in either direction, the buttons is grayed out.
• You can also zoom in and out by clicking on the page itself. When the cursor looks like a magnifying glass, you can click on the page to increase the magnification. When you have reached the top level of magnification, the cursor changes back to an
. arrow. Click on the page to return to normal magnification• Click on the Close button to return to the regular display.

147
18 Exporting
18.1 Export
You can dump the contents of the Summary pane on the Frame Display into a Comma Separated File (CSV). To acce thss is feature:
ane 1. Right click on the Summary P
menu item 2. Select the Export
ame 3. Enter a file n
4. Select Save
Another port is : option to access quick ex menu 1. Click on the File
2. Choose Export
ame 3. Enter a file n
4. Select Save
18.2 Export Filter Out
You can filter out data you don't want or need in your text file. (This option is available only for serial data.) In the Filter Out box, choose which side to filter out: the DTE data, the DCE data or neither side (don't filter any data.) For example, if
rt you choose the radio button for DTE data, the DTE data would be filtered out of your expofile and the file would contain only the DCE data. You can also filter out Special Events (which is everything that is not a data byte, such as control signal changes and Set I/O events), Non‐printable characters or both. If you choose to filter out Special Events, your export file would contain only the data bytes. Filtering out the non‐printable characters means that your export file would contain only special events and data bytes classified as printable. In ASCII, printable characters are those with hex values between $20 and $7e.
18.3 Exporting Event Display to a File
About Event Display Export
The Event Display Export feature provides the following options: • e current selection Export either the entire capture buffer or th• Output file format as text, CSV, html, or bin.

148
The Event Display Export feature uses the current format of the Event Display as specified by the user. Note: See About Event Display for an explanation on formatting the Event Display prior to initiating the export feature.
Accessing the Event Display Export Dialog
Selecting Export Events… from the File menu in the Event Display brings up the following dialog:
Configure the Export File Range in the Event Display Export Dialog
• Selecting more than one event in the Event Display window defaults the radio button in the Event Display Export dialog to Selection and allows the user to choose
the All radio button. • When only one event is selected (something must be selected), the All radio button
in the Event Display Export dialog is selected by default. • Side is used to determine whether you want to export data from a DCE/DTE,
Slave/Master, Host/Function device or both.
How to xp E ort Event Display Data to a File
1. Select Export Events… from the File menu on the Event Display window to display the Event Display Export dialog.
2. Enter a file path and name, or click the browser button to display the Windows Save As dialog and navigate to the desired storage location.
3. Select a file type from the Save as type: drop‐down List Menu on the Event Display Export dialog.
4. Select from among the following file formats: Text File (*.txt)
CSV File (*.csv)
HTML File (*.html)
Binary File (*.bin)

149
5. Select the range of events to include in the file from either All or Selection in the Event Range section of the Event Display Export dialog. Note: See Configure the Export File Range in the Event Display Export Dialog above for an explanation of these selections.
e, either Host, Function, or Both 6. Select a Sid
7. Click Save.
18.4 Exporting Baudot
When exporting Baudot, you need to be able to determine the state of the shift character. In a text export, the state of the shift bit can be determined by the data in the Character field. When letters is active, the character field shows letters and vice versa.
18.5 HTML Export
The Frame Display HTML Export feature provides the user with the option to export the entire capture buffer to an .html file.
How to xp splay data ml e ort di to an .ht file
1. Select HTML Export from the File menu on the Frame Display window to display the Frame Display HTML Export.
2. Choose to include the Summary Pane (check the box) in the .html output. If you select
All layers in the Detail Section, the Data Bytes option becomes available.
3. In the Detail Section, choose to exclude the decode from the Detail Pane in the Frame Display, or include All Layers or Selected Layers Only. If you choose to include selected layers, then select (click on and highlight) the layers from the list box. Click on selected layers in the list to de‐select, or click the Reset button to de‐select all selected layers.
4. Select the range of frames to include All or Selection in the Frame Range section of the dialog.

150
Choosing Selection includes only the fram select in the Frame Display window.
Note: If the file size is too big, the Frame Range, All, will not be available. It will be grayed out.
es you
5. Click the OK button.
The Save As dialog appears.
6. Enter a name for the file you want to save.
Note: Th d to choose a file type. The file is saved as a .htm. ere is not nee
7. Select Save

151
19 System Settings and Program Options
19.1 System Settings
Open the System Settings window by choosing System Settings from the Options menu on the Control window. To enable a setting, click in the box next to the setting to place a checkmark in the box. To disable a setting, click in the box to remove the checkmark. When viewing a capture file, settings related to data capture are grayed out.
Capture Mode
• Series of files
This option lets you capture to a series of files. The size of each file is no larger than the number given in File Size (in K),which has a maximum limit of approximately 176,000KB (1.7 GB) or 1/2 of the available hard disk space, whichever is smaller. The name of each file is the name you give it in the Name box followed by the date, time and a number. The date and time are when the series was opened. The number
names are created. increments with each file. This guarantees unique fileSet the maximum number of files in the series in the Maximum number of files box. The next file starts when the currently open file is full. If you want to start a new file on a periodic basis, check the box for Start new file after and put in the number of hours after which a new file is started. Note that if the currently open file becomes full before the time limit has been reached, a new file is opened immediately rather than lose data. Capturing stops if the maximum number of files has been used unless Wrap Files has been checked. If Wrap Files has been checked the analyzer erases the oldest file in he series and make a new file. t

152
• Single File
This option allows the analyzer to capture data to a file without prompting you for a file name each time. The size of each file is not larger than the number given in File Size (in K). The name of each file is the name you give it in the Name box followed by the date and time. The date and time are when the series was opened.
Common Options
• Restart Capturing After Saving or Clearing Capture File
If the Automatically Restart feature is enabled, the analyzer restarts capture to the file immediately after the file is closed.
• Wrap File
When enabled, the analyzer wraps the file when it becomes full. The oldest events are moved out of the file to make room for new events. Any events moved out of the file are lost. When disabled, the analyzer stops capture when the file becomes full. Either reset the file or close your capture file to continue.
• File Size (in K)
Enter the maximum size of the capture file, which is 176,000 KB, or 1/2 of the available hard drive space, whichever is smaller. If you enter a number larger than he maximum allowable size, the analyzer will display the allowable size. t
• Default Enter a name for the capture file in the Default text box. Each saved file will begin with this name.
• Append Series Start/Date & File Number Select this radio button to automatically append a start date (yyyy‐mm‐dd_hhmmss) and file number (001) when capturing a series of files.
• Append File Start Date/Time Select this radio button to automatically append a start date (yyyy‐mm‐dd_hhmmss) when capturing a single file.
• Start up
Opens the Program Start up Options window. Start up options let you choose whether to start data capture immediately on opening the analyzer.
• Advanced Opens the Advanced System Options window. The Advanced Settings should only be changed on advice of technical support.
153
19.2 Syste Disabled/Enabled Options m Settings
Some of the System Settings options are disabled depending upon the status of the data capture session.
• As the default, all the options on the System Settings dialog are enabled.
• Once the user begins to capture data by selecting the Start Capture button, some of the options on the System Settings dialog are disabled until the user stops data capture and either saves or erases the captured data.
• The user can go into the Startup Options and Advanced System Options on the System Settings dialog and make changes to the settings at any time.
19.3 Bluetooth ComProbe Maintenance
The Bluetooth® ComProbe® Maintenance Utility is used to configure Bluetooth ComProbes and to upgrade the firmware. Bluetooth ComProbes should be upgraded to the newest firmware release to take advantage of new features and fixes.
Upgrading Your Bluetooth ComProbe
To start the Bluetooth ComProbe Maintenance Utility:
1. Open the FTS4BT desktop folder > Setup folder.
2. Double click the shortcut to the utility.
OR
1. From your WindSetup > Bluetoo
The mai d rs.
ows operating system click Start > Programs > FTS4BT [version#] > th ComProbe Maintenance Utility.
n ialog appea
2. Connect the ComProbe to the PC
3. Click on the Select Device button.
To avoid mistakes, we recommended that only one ComProbe be connected at a time. Also, it is very important that you do not remove any connections to the ComProbe while the firmware update is in progress!

154
4. Select Yes.
Older ComProbes will display an error indicating the ComProbe is older and needs replacing. Note that when you do this, the [Device Information], [Check Configuration] and [Update Firmware] buttons should become available. [Update Firmware] will not be accessible i sing an older Cof you are u mProbe®.
5. Select the Update Firmware button.
The utility will display a dialog titled “Select the firmware file to download”. There may be more than one firmware file with extension “.dfu” in the directory. The version number of the firm be in the name of the file. ware will
6. Please select the version you want (typically you should choose the highest version number).
O7. Then press the button.
When th u om dialog appears confirming the download.
pen
e pdate is c plete, a
8. Press the OK button.
19.4 Advanced System Options
These parameters affect fundamental aspects of the software, and it is unlikely that you ever have to change them. If you do change them and need to return them to their original values, the default value is listed in parentheses to the right of the value box. Most technical support problems are not related to these parameters, and as changing them could have serious consequences for the performance of the analyzer, we strongly
before changing any of these parameters. recommend contacting technical supportTo access the Advanced System Options:
1. e Go to th Control window.
enu. 2. Choose System Settings from the Options m
3. On the System Settings window, click the Advanced button.
• Driver Receive Buffer Size in Kbytes
This is the size of the buffer used by the driver to store incoming data. This value is expressed in Kbytes.
• Driver Action Queue Size In Operating System Pages
This is the size of the buffer used by the driver to store data to be transmitted. This value is expressed in operating system pages.
• Frame Completion Timeout in Seconds

155
This is the number of seconds that the analyzer waits to receive data on a side while in the midst of receiving a frame on that side. If no data comes in on that side for longer than the specified number of seconds, an "aborted frame" event is added to the Event Display and the analyzer resumes decoding incoming data. This can occur when capturing interwoven data (DTE and DCE) and one side stops transmitting in the middle of a frame. Aborted frames (just like broken frames and regular frames) are decoded and displayed in the Frame Display. If you experience aborted frames and suspect that your framed data may have pauses in it that exceed the specified timeout time, then you may want to increase that value. The range for this value is from 0 to 999,999 seconds. Setting it to zero disables the timeout feature. Note: This option is disabled when capturing data over Ethernet networks.
19.5 Changing Default File Locations
The analyzer saves user files in specific locations by default. Capture files are placed in the My Capture Files directory and configurations are put in My Configurations. These locations are set at installation. Follow t e h steps below to change the default locations.
1. Choose Directories from the Options menu on the Control window to open the File Locations window.
ult location you wish to change. 2. Select the defa
3. Click Modify.
a new location. 4. Browse to
5. Click OK.
6. Click OK when finished.
Note: If a user sets the My Decoders directory such that it is up‐directory from an installation path, multiple instances of a personality entry may be detected, which causes a failure when trying to launch FTS. For example, if an FTS product is installed at C:\FTS Stuff\My Products\Frontline FTS4BT w.x.y.z, then "My Decoders" cannot be set to any of the following:
• C:\
• C:\FTS Stuff
• C:\FTS Stuff\My Products
• C:\FTS Stuff\My Products\Frontline FTS4BT w.x.y.z

156
• C:\FTS Stuff\My Products\Frontline FTS4BT w.x.y.z\App Data
• C:\FTS Stuff\My Products\Frontline FTS4BT w.x.y.z\App Data\Decoders
• or to any directory that already exists under C:\FTS Stuff\My Products\Frontline FTS4BT w.x.y.z\App Data\Decoders
Default Capture File Folder Checkbox
If the “Use Last Opened Folder for Capture Files” checkbox is checked, then the system automatically changes the default location for saving capture files each time you open a file from or save a file to a new location. For example, let's say the default location for saving capture files is Drive A > Folder A. Now you select the “Use Last Opened Folder for Capture Files” checkbox. The next time, however, you open a capture file from a different location, Folder B > Removable Flash Drive. Now when you save the capture file, it will be saved to Folder B > Removable Flash Drive. Also, all subsequent files will be saved to that location. This remains true until you open a file from or save a file to a different location. There is one caveat to this scenario, however. Let's say you have selected "Use Last Opened Folder for Capture Files" and opened a file from a location other than the default directory. All subsequent capture files will be saved to that location. Suppose, however, the next time you want to save a capture file, the new file location is not available because the directory structure has changed: a folder has been moved, a drive has been reassigned, a flash drive has been disconnected, etc. In the case of a "lost" directory structure, subsequent capture files will be saved to the default location. FTS will always try to save a file to the folder where the last file was opened from or saved to, if “Use Last Opened Folder for Capture Files” is checked. If, however, the location is not accessible, files are saved to the default directory that is set at installation. If the checkbox is unchecked, then the system always defaults to the directory listed in the File Locations dialog.
19.6 S le Options e cting Start Up
1. To open this window:
2. enu on rChoose System Settings from the Options m the Cont ol window.
3. On the System Settings window, click the Start Up button.
4. Choose one of the options to determine if the analyzer starts data capture immediately on starting up or not.
157
Don't start capturing immediately.
This is the default setting. The analyzer begins monitoring data but does not begin
capturing data until the Start Capture icon on the Control, Event Display or Frame Display windows is clicked. Start capturing to a file immediately.
When the analyzer starts up, it immediately opens a capture file and begin data capture to
it. This is the equivalent of clicking the Start Capture icon. The file is given a name based on the settings for capturing to a file or series of files in the System Settings window. Start capturing immediately to the following file:
Enter a filename in the box below this option. When the analyzer starts up, it immediately begins data capture to that file. If the file already exists, the data in it is overwritten. Use this capture filter:
The drop down box lists all named filters. Select one that you want to use immediately on start up.
19.7 Names
The Names dialog is used to change the names of objects and events that appear in various disp ysla .
Names Options1. To open the Names dialog, choose from the menu on the Control window. Changes to the Names are used throughout the program.
To change a name, click on the name given in the current column, and then click again to modify the name (a slow double‐click). To restore the default values, click the Defaults button. The names used in the system fall into one of three general categories. Because of variations associated with different types of communications, the Names dialog may display all or only a subset of the following categories:
• Sides
The Sides section allows you to give each side on a network more descriptive names. This is useful on network with more than one side.
• Errors
This section allows you to change the error names. The errors listed are appropriate for the type of circuit/network you are monitoring.
• Signals
Signals refers to the six control signals used in RS‐232 data communications, and g. may not apply to the type of communications you are monitorin
FTS4USB has four Control Signals: Pin 1, Pin 2, Pin 3, and Pin 4. Default Labels and their Meaning

158
Label Control Signal
RTS
CTS
Request to Send
Clear to Send
DSR
DTR
Data Set Ready
Ready Data Terminal
CD Carrier Detect
RI Ring Indicator
If you are used to different abbreviations for the same signals, you can change them in this section. For example, if you normally refer to Carrier Detect as DCD, highlight CD and type in DCD.
19.8 Timestamping
19.8.1 Timestamping Options
The Timestamping Options window allows you to enable or disable timestamping, and the timestamps for both capture and display purposes. change the resolution of
To open hi w: t s windo stem Settings from the menu on the Control window. 1. Choose Sy Options
2. Click the Set Timestamp Format button.
OR
1. Click the Timestamping Options icon from either the Event Display or Statistics window.
OR 1. Click the Timestamping Options icon from the Event Display window.
19.8.2 a Disabling Timestamping En bling/
1. Choose System Settings from the Options menu on the Control window, and click the Timestamping Options button, or click the click the Timestamping Options icon
from Display either the Event or Statistics window.
2. Check the Store Timestamps box to enable timestamping. Remove the check to disable timestamping. If you disable timestamping, you are not able to do delta or rate calculations.

159
19.8.3 Switching Between Relative and Absolute Time
With Times g you can cho ploy Rtampin ose to em elative Time or Absolute time.
1. Choose System Settings from the Options menu on the Control window, and click the
Timestamping Options button, or click the click the Timestamping Options icon
r the Event Disfrom eithe play or Statistics window.
2. Go to the Display Options section at the bottom of the window and find the Display Relative Timestamps checkbox.
3. Check the box to switch the display to relative timestamps. Remove the check to return to absolute timestamps.
Note: The options in this section affect only how the timestamps are displayed on the screen, ot how the timestamps are recorded in the capture file. n
• Display Raw Timestamp Value shows the timestamp as the total time in hundred
nanoseconds from a specific point in time.
• Display Relative Timestamps shows the timestamp as the amount of time that has passed since the first byte was captured. It works just like a stop watch in that the timestamp for the first byte is 0:00:00.0000 and all subsequent timestamps increment from there. The timestamp is recorded as the actual time, so you can flip back and forth between relative and actual time as needed.
• Selecting both values displays the total time in nanoseconds from the start of the capture as opposed to a specific point in time.
• Selecting neither value displays the actual chronological time. When you select Relative Timestamp, you can set the number of digits to display using the up or down arrows on the numeric list.
19.8.4 Changing the Timestamping Resolution
This option affects the resolution of the timestamp stored in the capture file. The default timestamp is 10 milliseconds. This value is determined by the operating system and is the smallest "normal" resolutions possible. It is also possible to use "high resolution" timestamping. High resolution timestamp values are marked by an asterisk as high resolution in the drop down list. To change timestamping resolutions:

160
1. Choose System Settings from the Options menu on the Control window, and click
the Timestamping Options button, or click the click the Timestamping Options icon
from either the Event Display or Statistics window.
f 2. Go to the Capture Options section o
3. Change the resolution listed in the Storage Resolution box. Note that if you change the resolution, you need to exit the analyzer and restart in order for the change to take
the window.
effect.
19.8.5 Displaying Fractions of a Second
1. Choose System Settings from the Options menu on the Control window, and click
the Timestamping Options button, or click the click the Timestamping Options icon
r the Event Disfrom eithe play or Statistics window.
2. Go to the Display Options section at the bottom of the window, and find the Number of Digits to Display box.
3. Click on the arrows to change the number. You can display between 0 and 6 digits to the right of the decimal point.
The options in this section affect only how the timestamps are displayed on the screen, not
ata. the resolution used to capture the d
19.8.6 Converting Timestamps
Serialtest for DOS uses a timebase of Pacific Standard Time during non daylight savings time hours and Pacific Daylight Time during daylight savings time hours. The analyzer always uses Greenwich Mean Time (also known as Universal Time Coordinates). When importing a Serialtest for DOS file, the analyzer must determine if the file was recorded during daylight savings time or not before converting the timestamps. Because the rules for determining this can change, it is possible for the analyzer to convert the
hour. timestamps incorrectly, resulting in timestamps that are off by one
19.8.7 Performance Issues For High Resolution Timestamps
There are two things to be aware of when using high resolution timestamps. The first is that high resolution timestamps take up more space in the capture file because more bits are required to store the timestamp. Also, more timestamps need to be stored than at normal resolutions. The second issue is that using high resolution timestamping may affect performance on slower machines

161
For example, if 10 bytes of data are captured in 10 milliseconds at a rate of 1 byte per millisecond, and the timestamp resolution is 10 milliseconds, then only one timestamp needs to be stored for the 10 bytes of data. If the resolution is 1 millisecond, then 10 timestamps need to be stored, one for each byte of data. If you have two capture files, both of the same size, but one was captured using normal resolution timestamping and the other using high resolution, the normal resolution file has more data events in it, because less room is used to store timestamps. ou can increase the size of your capture file in the Y System Settings.

162
20 Technical Information
20.1 Contacting Technical Support
Technical support is available in several ways. The online help system provides answers to many user related questions. Frontline's website has documentation on common problems,
r products. as well as software upgrades and utilities to use with ousupport/default.aspOn the Web: http://www.fte.com/
Email: [email protected]
If you need to talk to a technical support representative, support is available between 9am and 5pm, U.S. Eastern time, Monday through Friday. Technical support is not available on U.S. national holidays.
Phone: +1 (434) 984‐4500Fax: +1 (434) 984‐4505
20.2 Technical Information
The following information is provided to assist you with troubleshooting problems with this analyzer.
20.3 Asynchronous Serial Performance Notes
As a software‐based product, the speed of your computer’s processor affects FTS’s performance. Overrun errors and buffer overflows are indicators that FTS is unable to keep up with the data. The information below describes what happens to the data as it comes in the port, what the two types of errors mean, and how various aspects of FTS affect performance. Also included are suggestions on how to improve performance. Data captured by the serial port first goes into the buffer of the UART chip of the serial port. The UART generates an interrupt, which tells the FTS driver to check the port. The driver takes the data from the UART and counts each byte as they are put into the driver’s own buffer. The driver tells FTS that data is ready to be processed. FTS takes the data from the driver’s buffer and puts the data into the capture buffer. Overrun errors occur when the data in the buffer of the UART is not retrieved before new data comes in. In this case, FTS knows that it has lost information, but it does not know how much. FTS indicates overrun errors in the Event Display screen by marking a byte near the overrun in red. You can search for overrun errors using the Find feature. Driver buffer overflow errors occur when the data in the buffer of the driver is not retrieved before new data comes in. Since the driver counts the bytes as it retrieves them from the

163
UART, it not only knows that it has lost data, it also knows how much. Buffer overflows are indicated in the Event Display screen by a plus sign within a circle. Clicking on the buffer overflow symbol shows how many events have been lost. The Statistics window is a good place to check for buffer overflow errors. Both overrun errors and buffer overflows indicate that data is coming in too quickly for FTS to proce do to try and solve this problem. ss. There are several things that you can
• In the Hardware Settings window, select Use Windows Device Manager Settings. This means that Windows does not generate an interrupt every time a byte comes in, but rather waits until several bytes have accumulated in the UART buffer before telling FTS to retrieve them. This increases performance at the cost of timestamp accuracy, since all the bytes in a group have the same timestamp regardless of when they actually arrived at the UART. Some control signal changes may also be lost.
• FTS’s number one priority is capturing data; updating windows is secondary. However, updating windows still takes a certain amount of processor time, and may cause FTS to lose data while the window is being updated. Some windows require more processing time than others, because the information being displayed in them is constantly changing. Refrain from displaying data live in the Event Display and Frame Display windows. Try closing the Breakout Box and Statistics windows. FTS can capture data with no windows other than the Control window open.
• Increase the value of the window refresh rate for any windows you have open while capturing data. This decreases the frequency of window updates, leaving more time for capturing data. Changing the refresh rate can be done from the Options screen in each window.
• If you suspect or know that your circuit has control signals that are changing very rapidly, go to the Hardware Settings window and choose to Disable Control Signal Interrupts. This prevents FTS from capturing control signal changes on an interrupt basis, giving more time for capturing byte data. (You can use the counters in the Breakout Box to help determine if a control signal is changing quickly.) FTS still notes the state of the control signals whenever a byte is captured. You must restart FTS for this change to take effect.
• Close all other programs that are working while FTS is running. Refrain from doing searches in the Event Display window or other processor intensive activities while FTS is capturing data.
• Timestamping takes up processor time, primarily not in timestamping the data, but in writing the timestamp to the buffer or file. Try turning off timestamping from the Timestamping Options window.
• Change the size of the driver buffer. This value is changed from the Advanced System Settings. Go to the Control Window and choose System Settings from the Options menu. Click on the Advanced button. Find the value labeled Driver Receive Buffer Size in Operating System Pages. Take the value listed there and double it.

164
NOTE: This procedure might help buffer overflow errors, but does not help overrun errors.
• Slow down the speed of the communications circuit, if possible.
If you are still experiencing overruns and/or buffer overflows after trying all of the above options, then you may need to use a faster PC.
20.4 Changing Where the Search Lands
When doing a search in the analyzer, the byte or bytes matching the search criteria are highlighted in the Event Display. The first selected byte appears on the third line of the display. To c nha ge the line on which the first selected byte appears:
m Files\Common Files\FTE) 1. Open fts.ini (located in the C:\Progra 2. Go to the [CVEventDisplay] section 3. Change the value for SelectionOffset.
4. If you want the selection to land on the top line of the display, change the SelectionOffset to 0 (zero).
20.5 Progress Bars
The analyzer uses progress bars to indicate the progress of a number of different processes. Some progress bars (such as the filtering progress bar) remain visible, while others are hidden. The title on the progress bar indicates the process underway.
20.6 Event Numbering
This section talks about how events are numbered when they are first captured and how this affects the display windows in the analyzer. The information in this section applies to rame numbering as well. f When the analyzer captures an event, it gives the event a number. If the event is a data byte event, it receives a byte number in addition to an event number. There are usually more events than bytes, with the result is that a byte might be listed as Event 10 of 16 when
viewingviewing all events, and Byte 8 of 11 when only the data bytes. The numbers assigned to events that are wrapped out of the buffer are not reassigned. In other words, when event number 1 is wrapped out of the buffer, event number 2 is not renumbered to event 1. This means that the first event in the buffer may be listed as event 11520 of 16334, because events 1‐11519 have been wrapped out of the buffer. Since row numbers refer to the event numbers, they work the same way. In the above example, the first row would be listed as 2d00 (which is hex for 11520.)

165
The advantage of not renumbering events is that you can save a portion of a capture file, send it to a colleague, and tell your colleague to look at a particular event. Since the events are not renumbered, your colleague’s file use the same event numbers that your file does.
20.7 File Format for Merlin Files
FTS imports Merlin’s export files that have been exported with Merlin’s default settings. These files should have an extension of ".csv". It is possible with the Merlin software to hide or change a field’s format. If you do this before exporting the Merlin file then FTS may have trouble importing the file. If you are experiencing problems importing Merlin files, then check to make sure that no fields were hidden and that the default field formats were being used, when the file was exported from Merlin.
20.8 Ring Indicator
The following information applies when operating the analyzer in Spy mode or Source DTE, No FTS Cables mode. When using the cables supplied with the analyzer to capture or source
upts data, Ring Indicator (RI) is routed to a different pin which generates interr normally. There is a special case involving Ring Indicator and computers with 8250 UARTs or UARTs from that family where the state of RI may not be captured accurately. Normally when a control signal changes state from high to low or low to high, an interrupt is generated by the UART, and the analyzer goes to see what has changed and record it. Ring Indicator works a little differently. An interrupt is generated when RI changes from high to low, but not when RI changes from low to high. If Ring Indicator changes from low to high, the analyzer does not know that RI has changed state until another event occurs that generates an interrupt. This is simply the way the UART works, and is not a deficiency in the analyzer software. To minimize the chance of missing a Ring Indicator change, the analyzer polls the UART every millisecond to see if RI has changed. It is still possible for the analyzer to miss a Ring Indicator change if RI and only RI changes state more than once per millisecond. UARTs in the 8250 family include 8250s, 16450s, 16550s and 16550 variants. If you have any questions about the behavior of your UART and Ring Indicator, please contact technical support.

166
20.9 RS232 Pinouts
25pin connector
Pin Name Abbreviation
1 Frame Ground FG
2 Transmit Data TxD
3 Receive Data RxD
4 Request To Send RTS
5 Clear to Send CTS
6 Data Set Ready DSR
7 Signal Ground GND
8 Carrier Detect CD or DCD
20 Data Terminal Read DTR
22 Ring Indicator RI
9pin connector
Pin Name Abbreviation
1 Carrier Detect CD or DCD
2 Receive Data RxD
3 Transmit Data TxD
4 Data Terminal Ready DTR
5 Signal Ground GND
6 Data Set Ready DSR
7 Request To Send RTS
8 Clear To Send CTS
9 Ring Indicator RI

167
20.10 Useful Character Tables
20.10.1 ASCII Codes
20.10.2 Baudot Codes

168
20.10.3 EBCDIC Codes
20.10.4 Communication Control Characters
Listed below in alphabetical order are the expanded text meanings for common ANSI communication control characters, and two‐character system abbreviation for each one. Some abbreviations have forward slash characters between the two letters. This is to differentiate the abbreviations for a control character from a hex number. For example, the abbreviation for Form Feed is listed as F/F, to differentiate it from the hex number FF.
Abbreviation Control acter Char
Text
AK ACK Acknowledge
BL BEL Bell
BS BS Backspace
CN CAN Cancel
CR CR Carriage Return
D/1‐4 DC1‐4 Device l 1‐4 Contro
D/E DEL Delete
DL DLE Data Link Escape
EM EM End of

169
Medium
EQ ENQ Enquiry
ET EOT End of ission Transm
E/C ESC Escape
E/B ETB End of Transmission Block
EX ETX End of Text
F/F FF Form Feed
FS FS File tor Separa
GS GS Group Separator
HT HT Horizontal Tabulation
LF LF Line Feed
NK NAK Negative owledge Ackn
NU NUL Null
RS RS Record or Separat
SI SI Shift In
SO SO Shift Out
SH SOH Start of Heading
SX STX Start of Text
SB SUB Substitute
SY SYN Synchronous Idle

170
US US Unit r Separato
VT VT Vertical Tabulation
20.11 The Serial Driver
20.11.1 The FTS Serial Driver
FTS uses custom versions of the standard Windows serial drivers in order to capture data. These drivers are usually installed during the routine product installation. However, if you need to install the serial driver after FTS has already been installed, please refer to the instructions available in the Setup folder installed under Start | Programs | [Product Name and version #] | Setup | How to Install the FTS Serial Driver.
20.12 Frame Decoder
Frame Decoder is for the development of add‐on components to extend the functionality of your FTS protocol analyzer. Those add‐on components are generally used to decode existing or custom protocols. The core of each such “decoder” is a program that defines how the protocol data are to be broken up into fields and displayed in the Frame Display window of the analyzer software. The DecoderScript Manual provides instruction on how to create custom decoders and use them just like any of the decoders supplied with the protocol analyzer. You can also apply this knowledge to modify decoders supplied with the protocol analyzer. For more information about Frame Decoder, consult the DecoderScript Manual located in the desktop folder under Optional Components, or simply select Start | Programs | Frontline Product Name and Version Number] | Optional Components | DecoderScript Manual. [

171
21 Index
A
A2DP Decoder Parameters ∙ 31 About Statistics ∙ 89 Absolute Time ∙ 159 Absolute Timestamp Search ∙ 117 Add a New or Save an Existing Template ∙ 36 Adding a New Predefined Stack ∙ 44 Adding Comments To A Capture File ∙ 136, 138 Advanced Display Filtering Techniques ∙ 126 Apply Capture Filters ∙ 122 Apply Display Filters ∙ 122, 123, 124, 125, 126, 127,
128 ASCII ∙ 56, 114
character set ∙ 167 removing the numbers on the Event Display ∙ 56 searching for ASCII strings ∙ 114 transmitting in ∙ 99 viewing data in ∙ 56
ASCII Codes ∙ 167 ASCII Pane ∙ 70 Asynchronous Serial Performance Notes ∙ 162 Auto Cable Detection Fails ∙ 12 Auto Detect Now ∙ 10 Automatically Request Missing Decoding Information
∙ 47 Auto‐Sizing Column Widths ∙ 67 Auto‐traversal ∙ 44
B
Bar Charts ∙ 90 Baudot ∙ 56, 99, 149 Baudot Codes ∙ 167 BCSP ∙ 24 Binary ∙ 113, 115 Binary Pane ∙ 71 BlueCore Serial Protocol ∙ 24 Bookmarks ∙ 120, 121, 131 Boolean ∙ 124, 127, 128 Breakout Box ∙ 12, 82, 83
Breakout Box Options ∙ 83 Buffer ∙ 134
Buffer Tabs ∙ 89 Byte ∙ 71, 164
C
Cable Configuration ∙ 19, 20, 21, 22, 23 Cables ∙ 10, 12, 19 Calculating Data Rates and Delta Times ∙ 54 Capture Buffer ∙ 134 Capture File ∙ 134, 136, 138
changing default location of ∙ 155 loading ∙ 137 removing framing markers ∙ 47 saving ∙ 134
CFA file ∙ 136, 138 Changing Default File Locations ∙ 155 Character ∙ 113, 114
Character Pane ∙ 70 Character Set ∙ 56, 167, 168 Character Strings in Searching ∙ 114 Characters Per Second Table ∙ 90 Color of Data Bytes ∙ 72 Colors ∙ 72 Column Width ∙ 67 Comma Separated File ∙ 147 Compound Display Filters ∙ 124 Configuration ∙ 19 Confirm CFA Changes ∙ 136 Connecting BCSP ∙ 24 Connecting Without Using The Cable Set ∙ 24 Context For Decoding ∙ 47 Control Characters ∙ 99, 115 Control Signals ∙ 12, 13, 83, 85, 86, 88, 157 Control Window ∙ 4, 7
Configuration Information ∙ 4 Control Window Toolbar ∙ 2
Conversation Filters ∙ 125 Converter to RS‐232 ∙ 24 Copying Statistics ∙ 90 CSV Files ∙ 147 Custom Protocol Stack ∙ 44 Custom Stack ∙ 44 Customizing Fields in the Summary Pane ∙ 67
D
Data ∙ 54, 133, 134 Data Byte Color Denotation ∙ 72 Data Rates ∙ 54 Decode Pane ∙ 69

172
Decodes ∙ 47, 60, 69, 109 Default File Locations ∙ 155 Delete a Template ∙ 37 Deleting Display Filters ∙ 126 Delta Times ∙ 54 Detect Cables ∙ 10 Detect Now Button ∙ 10 Direct Connect to Serial Ports ∙ 24 Direction ∙ 125 Directories ∙ 155 Disable Control Signal Interrupts ∙ 12 Disabling ∙ 12, 158 Display Entire Buffer ∙ 86 Display Filters ∙ 126, 127, 128 Display Options ∙ 160 Dots ∙ 68 Driver ∙ 170 Duplicate View ∙ 53, 65
E
Easy Protocol Filtering ∙ 72, 129 EBCDIC ∙ 56
EBCDIC Codes ∙ 168 Enable UART FIFOs ∙ 13 Enabling/Disabling Timestamping ∙ 158 Errors ∙ 72, 74, 78, 130, 131, 157 Event Display ∙ 65, 143, 147
Event Display Export ∙ 147 Event Display Print ∙ 143 Event Numbering ∙ 164 Event Pane ∙ 71
Exclude ∙ 122 Exclude Radio Buttons ∙ 122 Expand All/Collapse All ∙ 69 Expand Decode Pane ∙ 66 Export
Export Baudot ∙ 149 Export Events… ∙ 147 Export Filter Out ∙ 147
F
Field Width ∙ 67 FIFOs ∙ 13 File ∙ 133, 134, 137 File Format Required for Merlin Capture Files ∙ 139,
165 File Locations ∙ 155 Filtering ∙ 72, 129, 131 Filters ∙ 72, 74, 77, 78, 122, 123, 124, 125, 126, 127,
128, 129, 130, 131, 132 Find ∙ 109, 113, 114, 115, 116, 117, 118, 119
Flow Control ∙ 99 Font Size ∙ 59 Fractions Of A Second ∙ 160 Frame Display ∙ 60, 64, 65, 66, 67, 68, 69, 70, 71, 72
Frame Display Status Bar ∙ 64 Frame Display Window ∙ 60 Frame Symbols ∙ 68
Frame Display ‐ Right Click Filtering ∙ 69, 74 Frames Per Second Table ∙ 91 Freeze ∙ 55 FTS Serial Driver ∙ 170
G
Generic Channel Dependent Decodes Setup ∙ 24 Graph Refresh Rate ∙ 91 Graphs ∙ 90, 91 Green Dots in Summary Pane ∙ 68
H
Hardware Settings ∙ 8, 9, 10, 12, 14 Hex ∙ 115 Hexadecimal ∙ 70 Hiding ∙ 77 Hiding Display Filters ∙ 126, 127 Hiding Layers ∙ 77 High Resolution Timestamping ∙ 159, 160
I
Include ∙ 122 Include/Exclude ∙ 122 Information Screen ∙ 44 Internal Modems ∙ 9 Interrupts ∙ 12
L
L2CAP ∙ 34 L2CAP Parameter ∙ 34
Add ∙ 34 Layer ∙ 77 Layer Colors ∙ 72 Live Update ∙ 55
M
Menus ∙ 3

173
Merlin Files ∙ 139, 165 Minimizing ∙ 7 Mixed Channel/Sides ∙ 57 Mixed Sides Mode ∙ 57 MLT ∙ 11 Modbus
Modbus TCP ∙ 27, 28, 29, 30 Modem Lead Names ∙ 157 Modem Leads ∙ 12, 85 Modem Line Tap ∙ 11 Modify Display Filters ∙ 127, 128 Monitoring ∙ 21, 22 Multiple Event Displays ∙ 53 Multiple Frame Displays ∙ 65
N
Named Filters ∙ 132 Names ∙ 157 New Snapshot ∙ 86 Node Assignment ∙ 27, 28
Add ∙ 27 Delete ∙ 28 Modify ∙ 28
Node Assignment Template ∙ 29, 30 Add ∙ 29 Apply ∙ 29 Delete ∙ 30
Node Database ∙ 27 Node Filters ∙ 125 Nonprintables ∙ 147 Notes ∙ 136, 138 Notify if Auto Cable Detection Fails ∙ 12 Numbers ∙ 164
O
Open ∙ 53 Open Capture File ∙ 137
Options ∙ 83, 88, 156, 158 Overriding Frame Information ∙ 47 Overrun Errors ∙ 13
P
Panes ∙ 66 Pattern ∙ 99, 113 Percentages ∙ 91 Performance Issues For High Resolution Timestamps ∙
160 Performance Notes ∙ 162 Physical Errors ∙ 72
Pie Charts ∙ 90 Port Monitoring ∙ 21, 22 Printing ∙ 91, 143 Printing from the Frame Display ∙ 140 Progress Bars ∙ 164 Protocol
Protocol Layer Colors ∙ 72 Protocol Navigator ∙ 74 Protocol Stack ∙ 44, 45
Q
Quick Export ∙ 147 Quick Filtering ∙ 74, 130
R
Radix ∙ 70 Red Frame Numbers ∙ 72 Relative Time ∙ 116, 159 Relative Timestamp Search ∙ 118 Remove
Bookmarks ∙ 120 Columns ∙ 67 Filters ∙ 126, 127 Framing Markers ∙ 47
Renaming ∙ 128 Reset Panes ∙ 66 Resetable Tab ∙ 89 Resolution ∙ 159 Revealing Display Filters ∙ 127 Revealing Layers ∙ 77 Revealing Protocol Layers ∙ 77 ROC Plus ∙ 27, 28, 29, 30 RS‐232 ComProbe I/O Settings ∙ 18 RS‐422 ∙ 24 RS‐485 ∙ 24
S
Save ∙ 123, 133, 134 Save As ∙ 133 Saving ∙ 133, 134
Display Filter ∙ 123 Saving the Capture File using File > Save or the Save
icon ∙ 133 Search ∙ 109, 113, 114, 115, 116, 117, 118, 119, 121
binary value ∙ 113 bookmarks ∙ 121 character string ∙ 113 control characters ∙ 115 entering character strings ∙ 114

174
hex or binary characters ∙ 115 hex pattern ∙ 113 pattern ∙ 113 strings in decodes ∙ 109 timestamp ∙ 116 wildcards ∙ 113
Send string ∙ 99
Serial Driver ∙ 170 Serialtest MLT ∙ 11 Sides ∙ 157 Signal Display ∙ 85, 86 Signal Display Options ∙ 88 Signal Display Toolbar ∙ 86 Sorting Frames ∙ 65 Source DTE No Cables ∙ 9 Spy ∙ 14, 38 Spy Mode Settings ∙ 14, 38 Start Up Options ∙ 156 Statistics ∙ 89 Statistics Graphs ∙ 90 Strings ∙ 99 Summary Layer Protocol ∙ 72, 129 Summary Pane ∙ 67, 68 Synchronization ∙ 65
T
Technical Information ∙ 162
Templates ∙ 29, 30 Timestamp ∙ 117, 118, 119, 159, 160 Timestamping ∙ 118, 158, 160 Timestamping Options ∙ 158 Timestamping Resolution ∙ 159 Timestamps ∙ 158, 160 Transmit ∙ 99
U
UART ∙ 13 UART FIFO Settings ∙ 13 Unframe ∙ 47 Unframe Function ∙ 47 Unframing ∙ 47 USB ∙ 50 USB HCI Internal Software Tap Data Source Dialog ∙ 50 User Defined Stacks ∙ 45 Using Named Filters ∙ 132 Using The Node Database Manager ∙ 27 Utilization Table ∙ 92
V
Values ∙ 91 Viewing Data Events ∙ 55