frontier (fybr) investor day presentation
TRANSCRIPT

• • • • • • •
Frontier (FYBR)
Investor Day Presentation
August 5, 2021
2© Frontier Communications.
Safe Harbor statement
This presentation contains "forward-looking statements" related to future events. Forward-looking statements address
our expectations or beliefs concerning future events, including, without limitation, our future operating and financial
performance, our ability to comply with the covenants in the agreements governing our indebtedness and other
matters. These statements are made on the basis of management’s views and assumptions, as of the time the
statements are made, regarding future events and performance and contain words such as “expect,” “anticipate,”
“intend,” “plan,” “forecast,” “believe,” “seek,” “see,” “may,” “will,” “would,” or “target.” Forward-looking statements
by their nature address matters that are, to different degrees, uncertain. A wide range of factors could materially
affect future developments and performance, including but not limited to: our significant indebtedness, our ability to
incur substantially more debt in the future, and covenants in the agreements governing our current indebtedness that
may reduce our operating and financial flexibility; our ability to successfully implement strategic initiatives, including
our fiber buildout and other initiatives to enhance revenue and realize productivity improvements and cost savings;
competition from cable, wireless and wireline carriers, satellite, fiber “overbuilders” and “over the top” companies,
and the risk that we will not respond on a timely or profitable basis; our ability to successfully adjust to changes in the
communications industry, including the effects of technological changes and competition on our capital
expenditures, products and service offerings; risks related to disruption in our networks, infrastructure and information
technology that result in customer loss and/or incurrence of additional expenses; the impact of potential information
technology or data security breaches or other cyber-attacks or other disruptions; our ability to retain or attract new
customers and to maintain relationships with customers, including wholesale customers; our reliance on a limited
number of key supplies and vendors; declines in revenue from our voice services, switched and non-switched access
and video and data services that we cannot stabilize or offset with increases in revenue from other products and
services; our ability to secure, continue to use or renew intellectual property and other licenses used in our business;
our ability to hire or retain key personnel; our ability to dispose of certain assets or asset groups or to make acquisition
of certain assets on terms that are attractive to us, or at all; the effects of changes in the availability of federal and
state universal service funding or other subsidies to us and our competitors and our ability to obtain future subsidies,
including participation in the proposed RDOF program; our ability to meet our CAF II and RDOF obligations and the risk
of penalties or obligations to return certain CAF II and RDOF funds; our ability to defend against litigation and
potentially unfavorable results from current pending and future litigation; our ability to comply with applicable federal
and state consumer protection requirements; the effects of governmental legislation and regulation on our business,
including costs, disruptions, possible limitations on operating flexibility and changes to the competitive landscape
resulting from such legislation or regulation; the impact of regulatory, investigative and legal proceedings and legal
compliance risks; our ability to effectively manage service quality in the states in which we operate and meet
mandated service quality metrics; the effects of changes in income tax rates, tax laws, regulations or rulings, or federal
or state tax assessments; the effects of changes in accounting policies or practices; our ability to successfully
renegotiate union contracts; the effects of increased medical expenses and pension and postemployment expenses;
changes in pension plan assumptions, interest rates, discount rates, regulatory rules and/or the value of our pension
plan assets; the likelihood that our historical financial information may no longer be indicative of our future
performance and our implementation of fresh start accounting; adverse changes in economic, political and market
conditions in the areas that we serve, the U.S. and globally; potential adverse impacts of the COVID-19 pandemic on
our business and operations, including potential disruptions to the work of our employees arising from health and
safety measures such as social distancing and working remotely, our ability to effectively manage increased demand
on our network, our ability to maintain relationships with our current or prospective customers and vendors, as well as
their abilities to perform under current or proposed arrangements with us, and stress on our supply chain; risks
associated with our emergence from the Chapter 11 Cases, including, but not limited to, the continuing effects of the
Chapter 11 Cases on us and our relationships with our suppliers, customers, service providers or employees and
changes in the composition of our board of directors and senior management; volatility in the trading price of our
common stock, which has a limited trading history; substantial market overhang from the common stock issued in the
Chapter 11 reorganization; certain provisions of Delaware law and our certificate of incorporation that may prevent
efforts by our stockholders to change the direction or management of our Company; and certain other factors set
forth in our other filings with the SEC. This list of factors that may affect future performance and the accuracy of
forward-looking statements is illustrative and is not intended to be exhaustive. You should consider these important
factors, as well as the risks and other factors contained in Frontier’s filings with the U.S. Securities and Exchange
Commission, including our most recent reports on Form 10-K and Form 10-Q. These risks and uncertainties may cause
actual future results to be materially different than those expressed in such forward-looking statements. We do not
intend, nor do we undertake any duty, to update any forward-looking statements.
Non-GAAP Financial Measures
Certain financial measures included herein, including Adjusted EBITDA, Adjusted EBITDA Margin, Adjusted Operating
Expenses and Operating Free Cash Flow, are not made in accordance with U.S. GAAP, and use of such terms varies
from others in the same industry. Non-GAAP financial measures should not be considered as alternatives to net
income (loss), net income margin or any other performance measures derived in accordance with U.S. GAAP as
measures of operating performance or cash flows as measures of liquidity. Non-GAAP financial measures have
important limitations as analytical tools, and you should not consider them in isolation or as substitutes for results as
reported under U.S. GAAP. This presentation includes a reconciliation of certain non-GAAP financial measures to the
most directly comparable financial measures calculated in accordance with U.S. GAAP. Projected GAAP financial
measures and reconciliations of projected non-GAAP financial measures are not provided herein because such GAAP
financial measures are not available on a forward-looking basis and such reconciliations could not be derived without
unreasonable effort.
This presentation uses the term “Implied Enterprise Value”, “Implied EV” and other similar terms, which is calculated
using a trend line implied by our peers and certain assumed levels of broadband penetration. This term does not
necessarily represent our actual enterprise value.
Note Regarding Classifications of Results
Unless otherwise indicated, the information presented herein, including operational, non-GAAP measures, and
commentary pertain to the Remaining Properties only. “Remaining Properties,” as defined in Frontier’s 10-K for the year
ended December 31, 2020, comprises the 25 states Frontier currently operates in and excludes Washington, Oregon,
Idaho, and Montana due to the divestiture of operations and assets in these states effective May 1, 2020.
“Consolidated” refers to the entire business, which may include financial data from Washington, Oregon, Idaho, and
Montana for the periods through May 1, 2020. References to “Northwest Ops” refer to the metrics of the four Northwest
states.
Forward looking language
3© Frontier Communications.
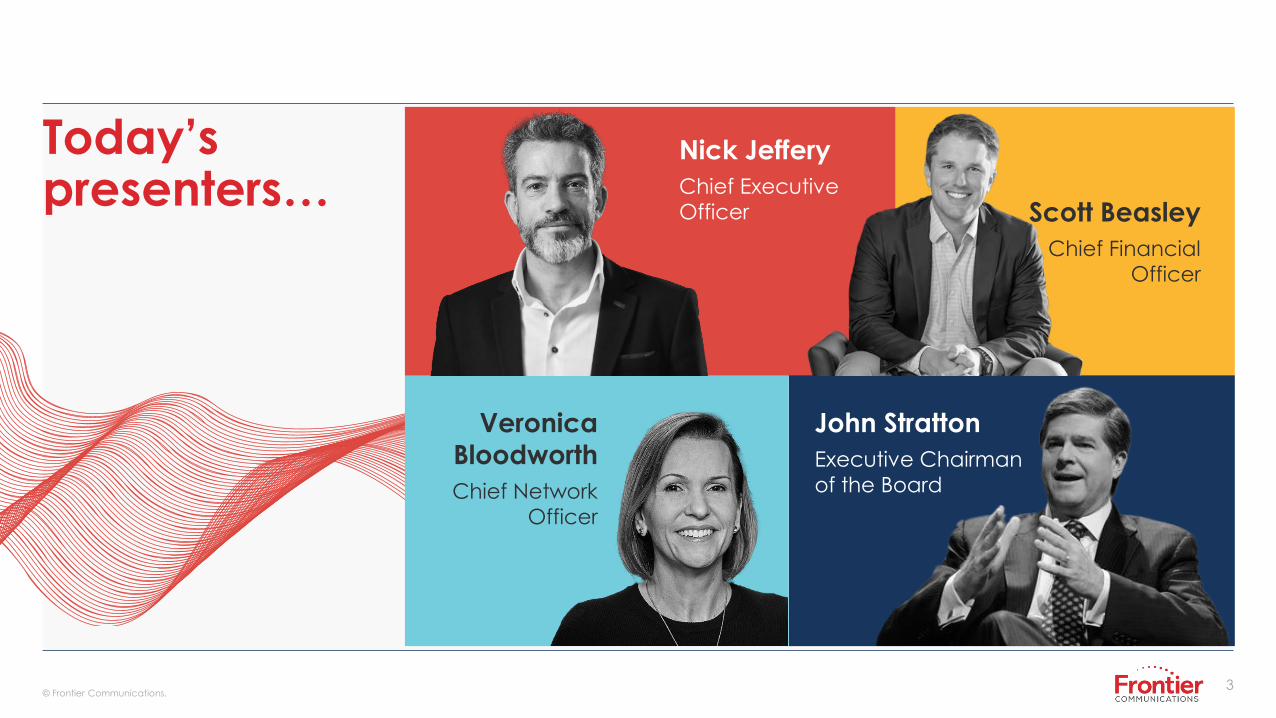
Today’spresenters…
Scott Beasley
Chief Financial
Officer
Veronica
Bloodworth
Chief Network
Officer
John Stratton
Executive Chairman
of the Board
Nick Jeffery
Chief Executive
Officer
4© Frontier Communications.
Today’sAgenda
Company overview &
FY 21 momentum
Strategic review
5© Frontier Communications.
5© Frontier Communications.
Company overview &
FY 21 momentum
01
• • • • • • •
6© Frontier Communications.
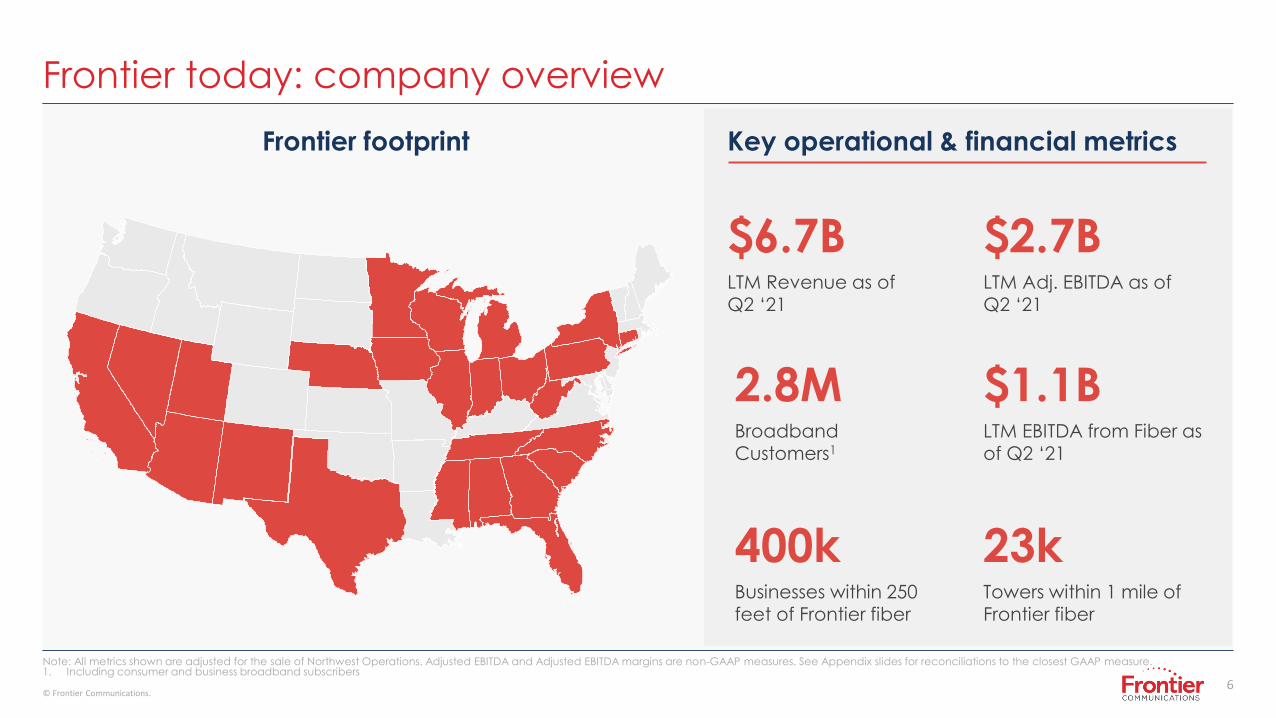
Frontier today: company overview
Key operational & financial metrics
Note: All metrics shown are adjusted for the sale of Northwest Operations. Adjusted EBITDA and Adjusted EBITDA margins are non-GAAP measures. See Appendix slides for reconciliations to the closest GAAP measure.1. Including consumer and business broadband subscribers
Frontier footprint
$6.7BLTM Revenue as ofQ2 ‘21
2.8MBroadband Customers1
$2.7BLTM Adj. EBITDA as ofQ2 ‘21
$1.1BLTM EBITDA from Fiber as of Q2 ‘21
23kTowers within 1 mile of Frontier fiber
400kBusinesses within 250 feet of Frontier fiber
7© Frontier Communications.
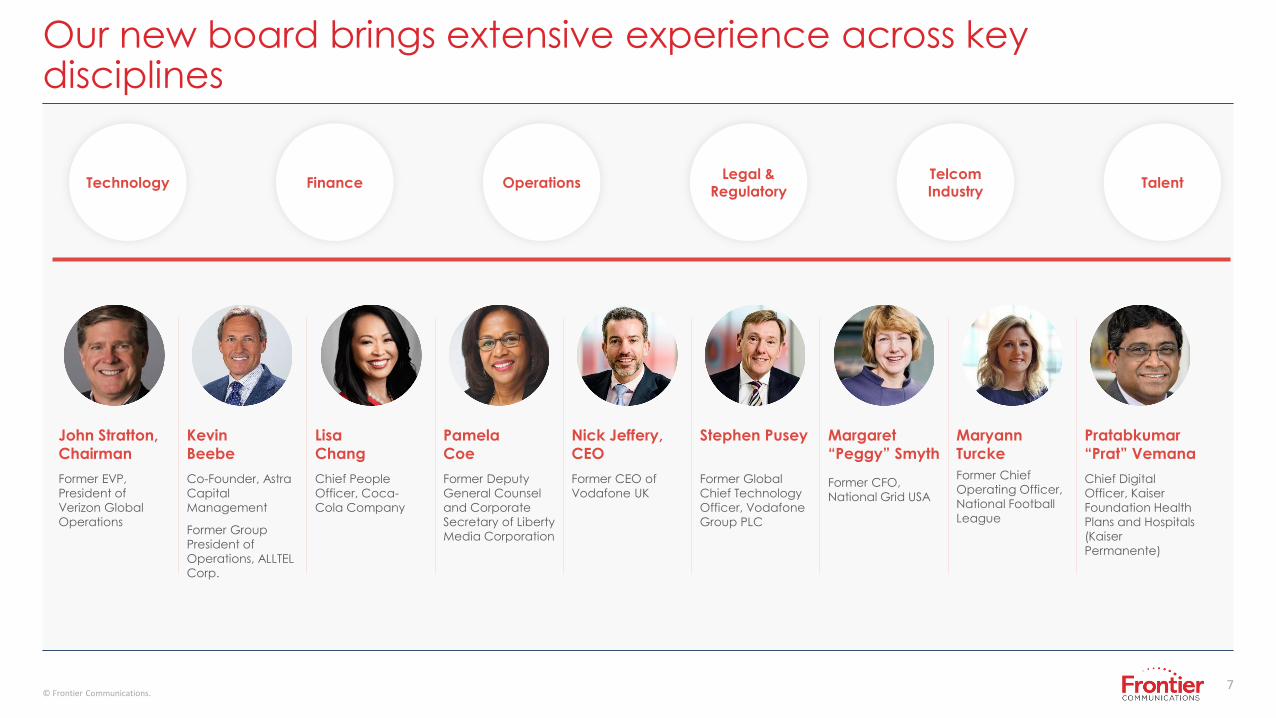
Our new board brings extensive experience across key disciplines
Operations TalentTechnologyTelcom Industry
FinanceLegal &
Regulatory
John Stratton,
Chairman
Former EVP,
President of
Verizon Global
Operations
Kevin
Beebe
Co-Founder, Astra
Capital
Management
Former Group
President of
Operations, ALLTEL
Corp.
Nick Jeffery,
CEO
Former CEO of
Vodafone UK
Lisa
Chang
Chief People
Officer, Coca-
Cola Company
Pamela
Coe
Former Deputy
General Counsel
and Corporate
Secretary of Liberty
Media Corporation
Pratabkumar
“Prat” Vemana
Chief Digital
Officer, Kaiser
Foundation Health
Plans and Hospitals
(Kaiser
Permanente)
Stephen Pusey
Former Global
Chief Technology
Officer, Vodafone
Group PLC
Margaret
“Peggy” Smyth
Former CFO,
National Grid USA
Maryann
Turcke
Former Chief
Operating Officer,
National Football
League
8© Frontier Communications.
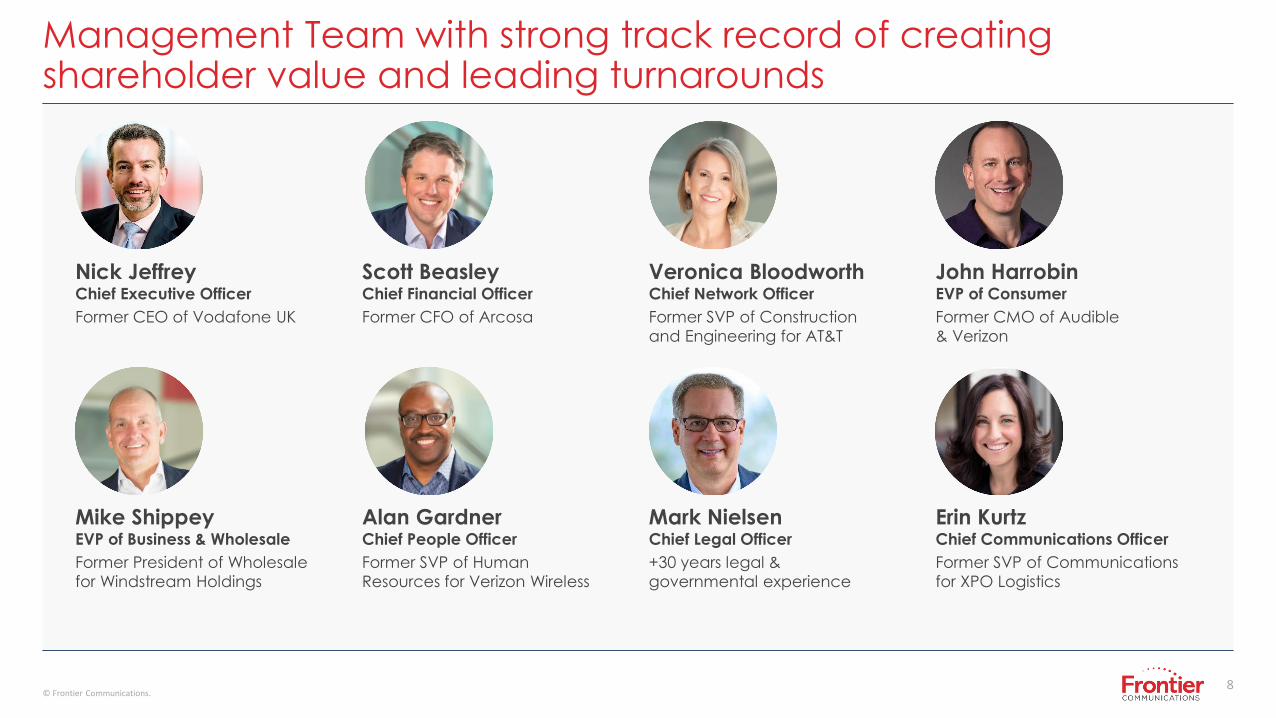
Management Team with strong track record of creating shareholder value and leading turnarounds
Nick JeffreyChief Executive Officer
Former CEO of Vodafone UK
Scott BeasleyChief Financial Officer
Former CFO of Arcosa
Veronica BloodworthChief Network Officer
Former SVP of Construction
and Engineering for AT&T
John HarrobinEVP of Consumer
Former CMO of Audible
& Verizon
Mark NielsenChief Legal Officer
+30 years legal &
governmental experience
Alan GardnerChief People Officer
Former SVP of Human
Resources for Verizon Wireless
Mike ShippeyEVP of Business & Wholesale
Former President of Wholesale
for Windstream Holdings
Erin KurtzChief Communications Officer
Former SVP of Communications
for XPO Logistics
9© Frontier Communications.
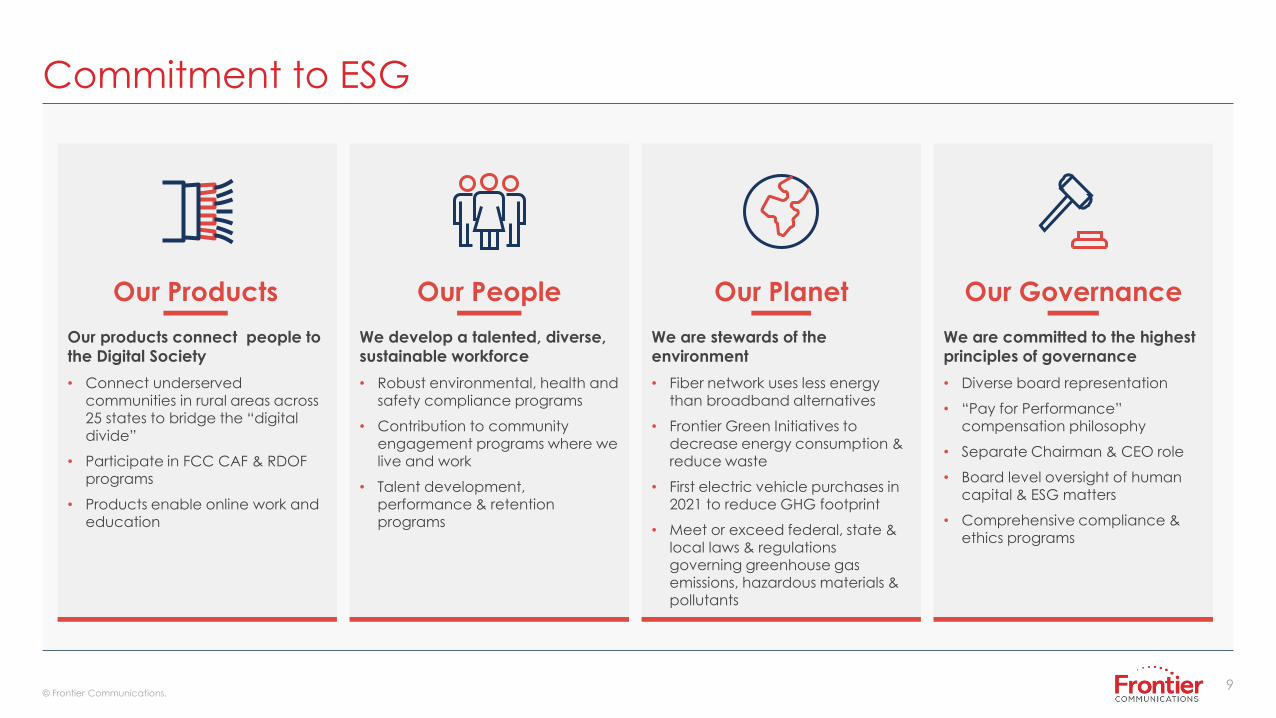
Commitment to ESG
• Fiber network uses less energy than broadband alternatives
• Frontier Green Initiatives to decrease energy consumption & reduce waste
• First electric vehicle purchases in 2021 to reduce GHG footprint
• Meet or exceed federal, state & local laws & regulations governing greenhouse gas emissions, hazardous materials & pollutants
• Diverse board representation
• “Pay for Performance” compensation philosophy
• Separate Chairman & CEO role
• Board level oversight of human capital & ESG matters
• Comprehensive compliance &
ethics programs
• Connect underserved communities in rural areas across 25 states to bridge the “digital divide”
• Participate in FCC CAF & RDOF programs
• Products enable online work and education
• Robust environmental, health and safety compliance programs
• Contribution to community engagement programs where we live and work
• Talent development, performance & retention programs
We are stewards of the
environment
We are committed to the highest
principles of governance
Our products connect people to
the Digital Society
We develop a talented, diverse,
sustainable workforce
Our Planet Our GovernanceOur Products Our People
10© Frontier Communications.
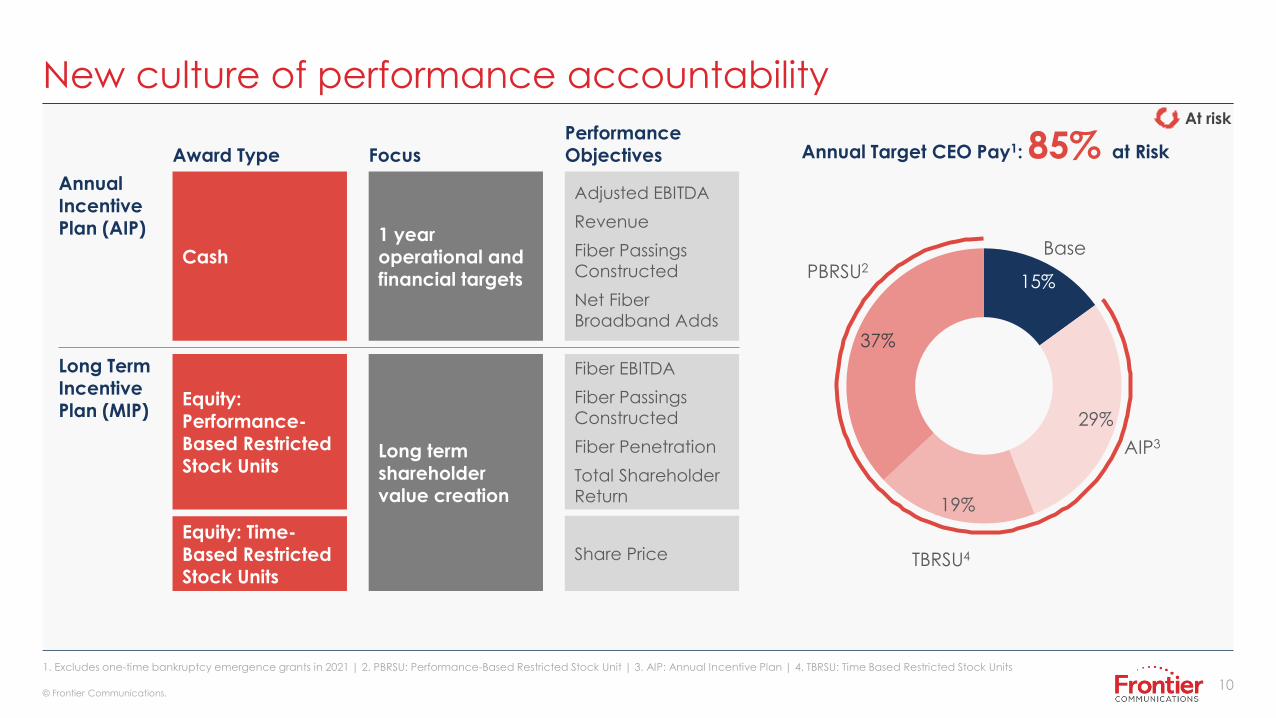
New culture of performance accountability
1. Excludes one-time bankruptcy emergence grants in 2021 | 2. PBRSU: Performance-Based Restricted Stock Unit | 3. AIP: Annual Incentive Plan | 4. TBRSU: Time Based Restricted Stock Units
15%
29%
19%
37%
PBRSU2
Base
AIP3
TBRSU4
At risk
Long Term Incentive Plan (MIP)
Award TypePerformance Objectives
Annual Incentive Plan (AIP)
Adjusted EBITDA
Revenue
Fiber Passings
Constructed
Net Fiber
Broadband Adds
Fiber EBITDA
Fiber Passings
Constructed
Fiber Penetration
Total Shareholder
Return
Share Price
Focus
1 year operational and financial targets
Long term shareholder value creation
Cash
Equity: Performance-Based Restricted Stock Units
Equity: Time-Based Restricted Stock Units
Annual Target CEO Pay1: 85% at Risk
11© Frontier Communications.
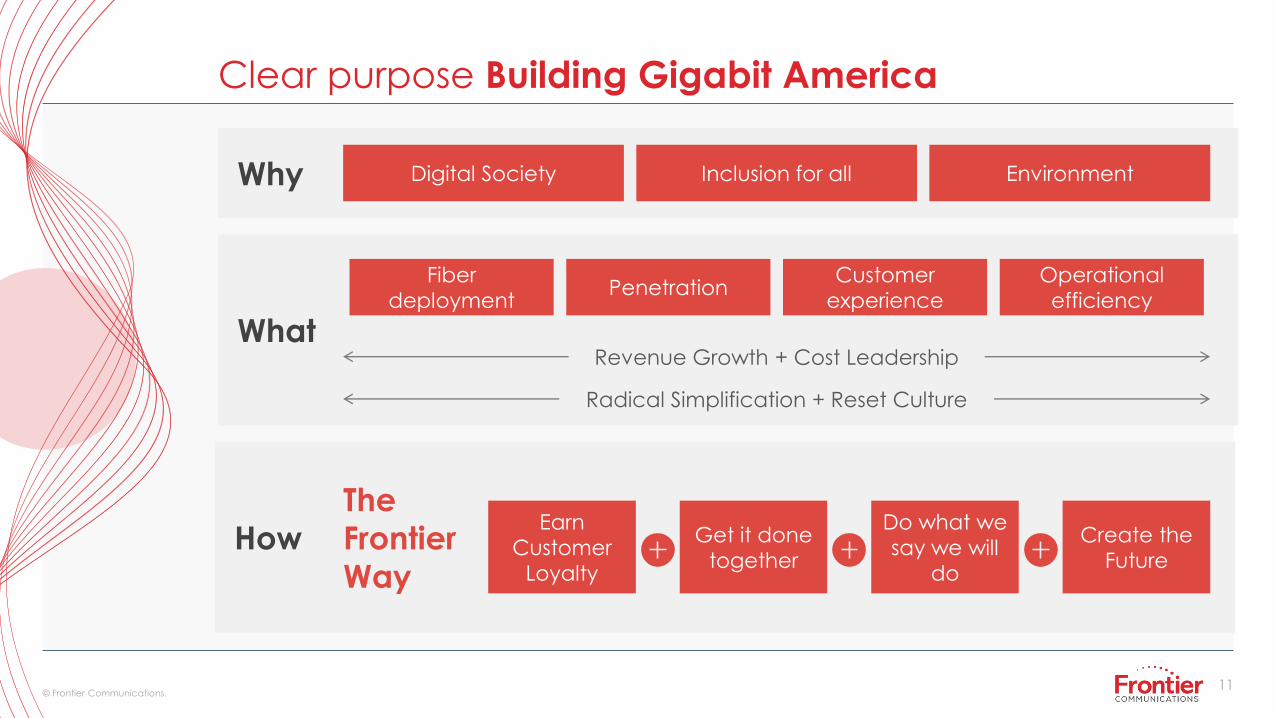
How
What
The
Frontier
Way
Get it done
together
Create the
Future
Earn
Customer
Loyalty
Do what we
say we will
do
Why Digital Society Inclusion for all Environment
Fiber
deployment
Customer
experiencePenetration
Operational
efficiency
Revenue Growth + Cost Leadership
Radical Simplification + Reset Culture
Clear purpose Building Gigabit America
12© Frontier Communications.
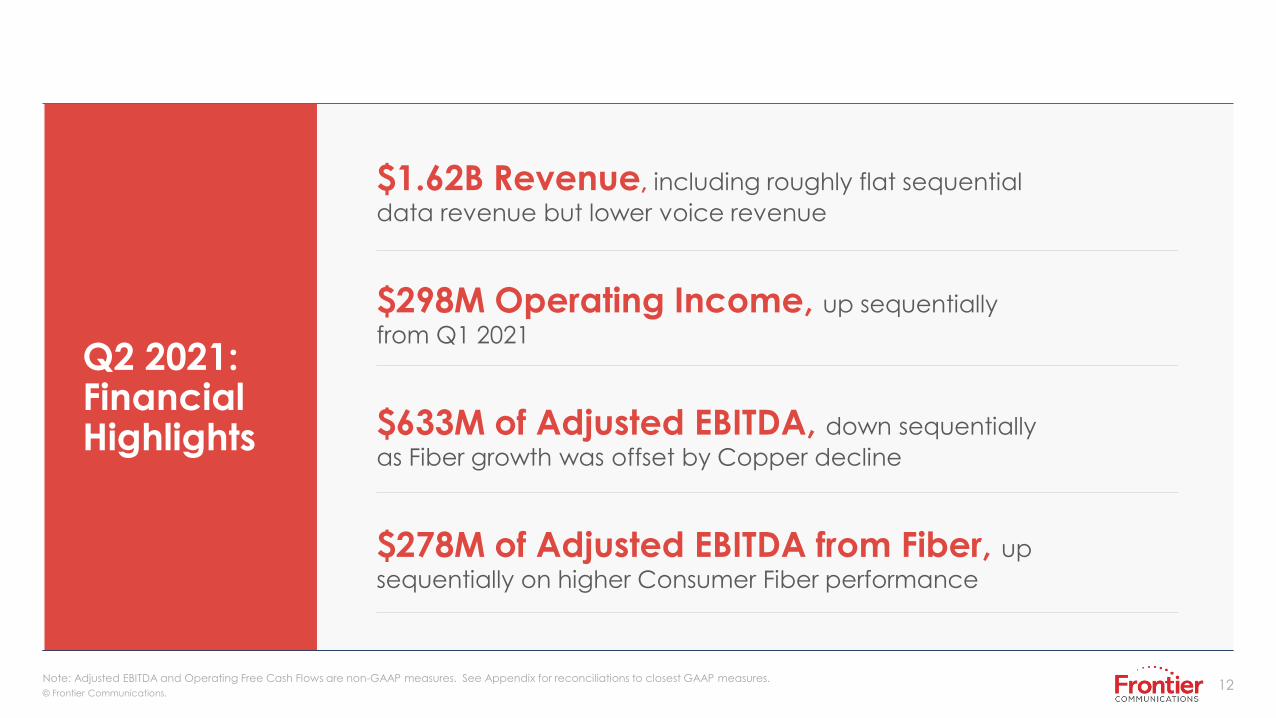
Q2 2021: Financial Highlights
$1.62B Revenue, including roughly flat sequential
data revenue but lower voice revenue
$298M Operating Income, up sequentially
from Q1 2021
$633M of Adjusted EBITDA, down sequentially
as Fiber growth was offset by Copper decline
$278M of Adjusted EBITDA from Fiber, up
sequentially on higher Consumer Fiber performance
Note: Adjusted EBITDA and Operating Free Cash Flows are non-GAAP measures. See Appendix for reconciliations to closest GAAP measures.
13© Frontier Communications.
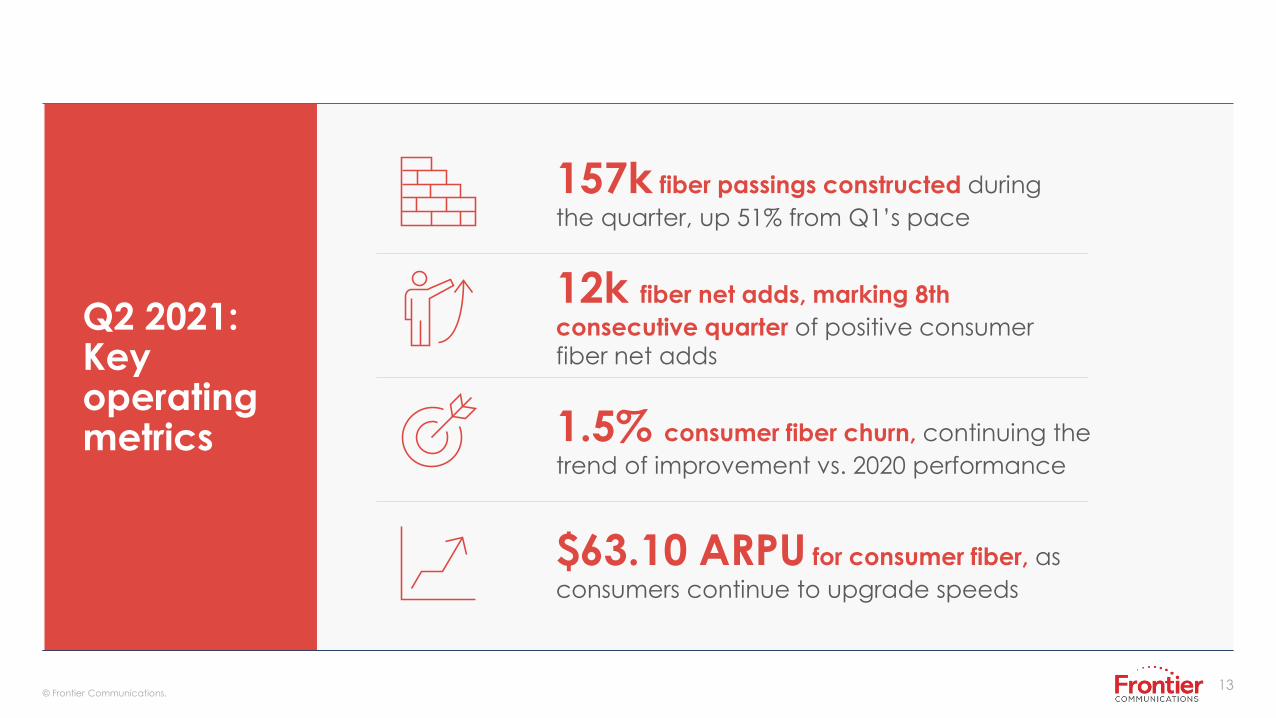
Q2 2021: Key operating metrics
157k fiber passings constructed during
the quarter, up 51% from Q1’s pace
12k fiber net adds, marking 8th
consecutive quarter of positive consumer
fiber net adds
1.5% consumer fiber churn, continuing the
trend of improvement vs. 2020 performance
$63.10 ARPU for consumer fiber, as
consumers continue to upgrade speeds
14© Frontier Communications.
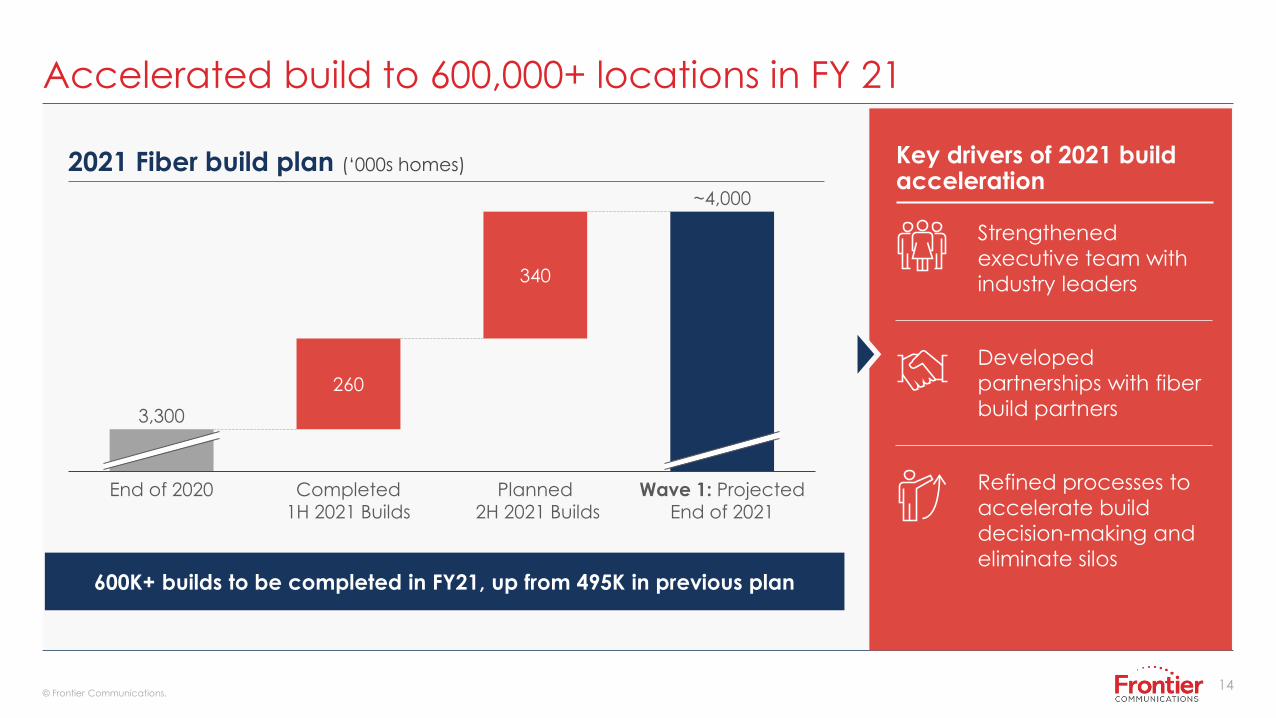
Accelerated build to 600,000+ locations in FY 21
End of 2020
260
Completed 1H 2021 Builds
340
Planned2H 2021 Builds
Wave 1: Projected End of 2021
3,300
~4,000
2021 Fiber build plan (‘000s homes) Key drivers of 2021 build acceleration
Strengthened
executive team with
industry leaders
Developed
partnerships with fiber
build partners
Refined processes to
accelerate build
decision-making and
eliminate silos600K+ builds to be completed in FY21, up from 495K in previous plan
15© Frontier Communications.
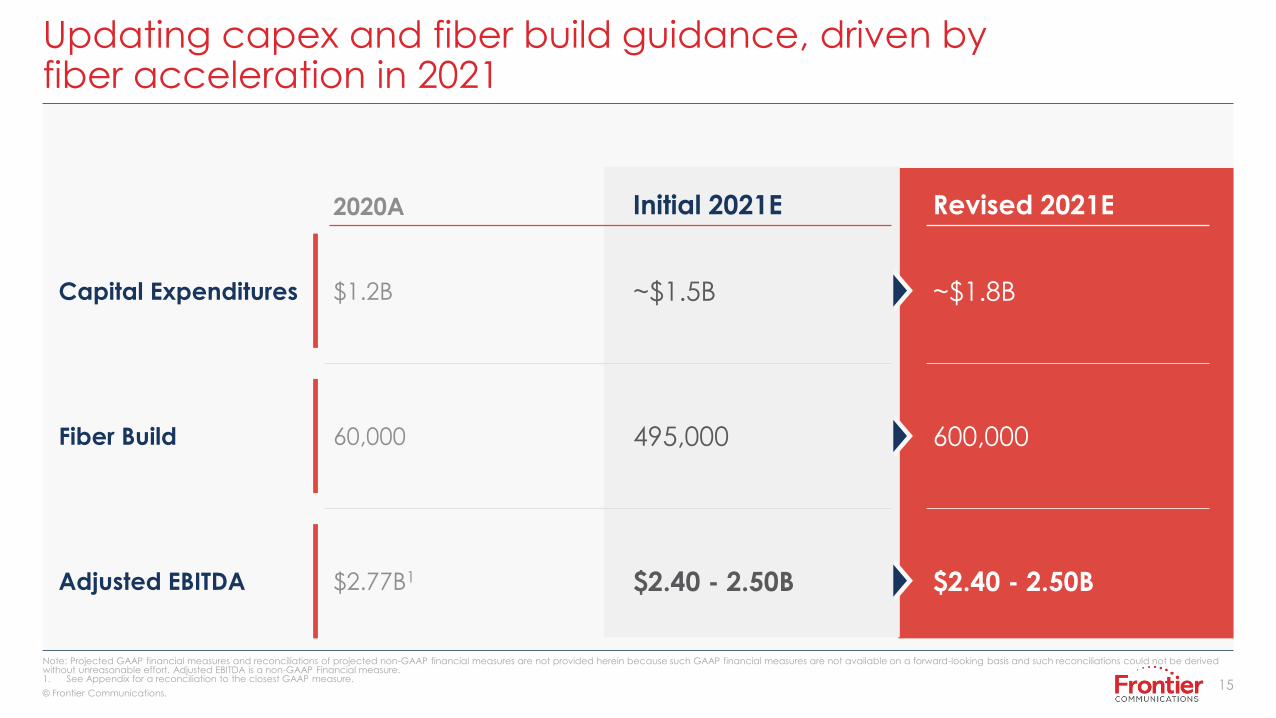
Updating capex and fiber build guidance, driven by fiber acceleration in 2021
Note: Projected GAAP financial measures and reconciliations of projected non-GAAP financial measures are not provided herein because such GAAP financial measures are not available on a forward-looking basis and such reconciliations could not be derived without unreasonable effort. Adjusted EBITDA is a non-GAAP Financial measure. 1. See Appendix for a reconciliation to the closest GAAP measure.
2020A Initial 2021E
Adjusted EBITDA $2.77B1 $2.40 - 2.50B $2.40 - 2.50B
Capital Expenditures $1.2B ~$1.5B ~$1.8B
Fiber Build 60,000 495,000 600,000
Revised 2021E
16© Frontier Communications.
16© Frontier Communications.
Strategic review
02
• • • • • • •
17© Frontier Communications.
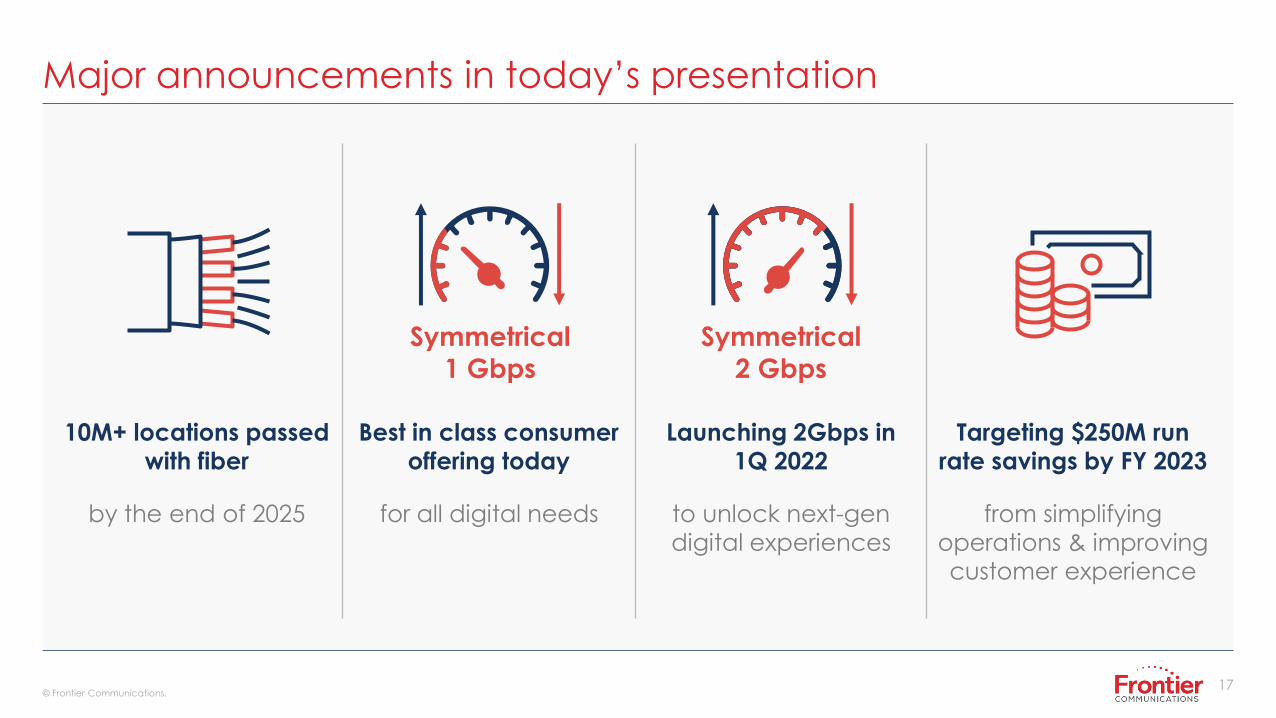
Major announcements in today’s presentation
10M+ locations passed
with fiber
Best in class consumer
offering today
by the end of 2025 for all digital needs
Launching 2Gbps in
1Q 2022
to unlock next-gen
digital experiences
Targeting $250M run
rate savings by FY 2023
from simplifying
operations & improving
customer experience
Symmetrical
1 Gbps
Symmetrical
2 Gbps
18© Frontier Communications.
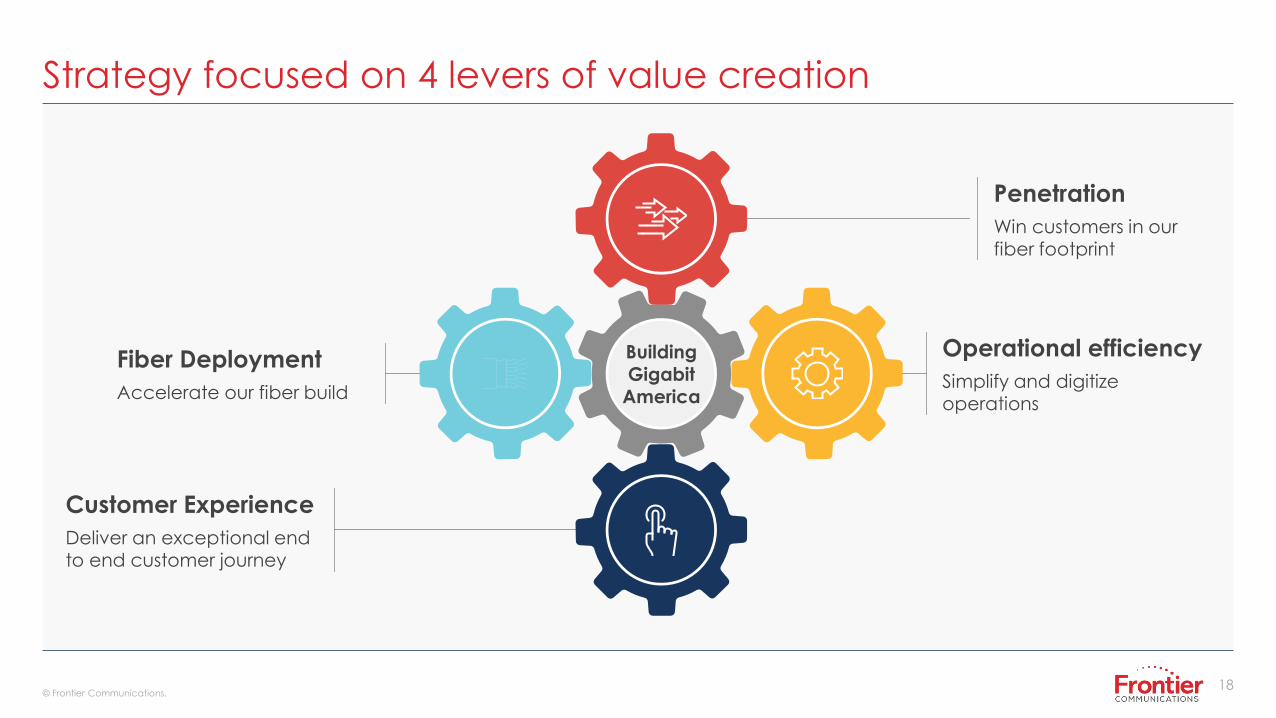
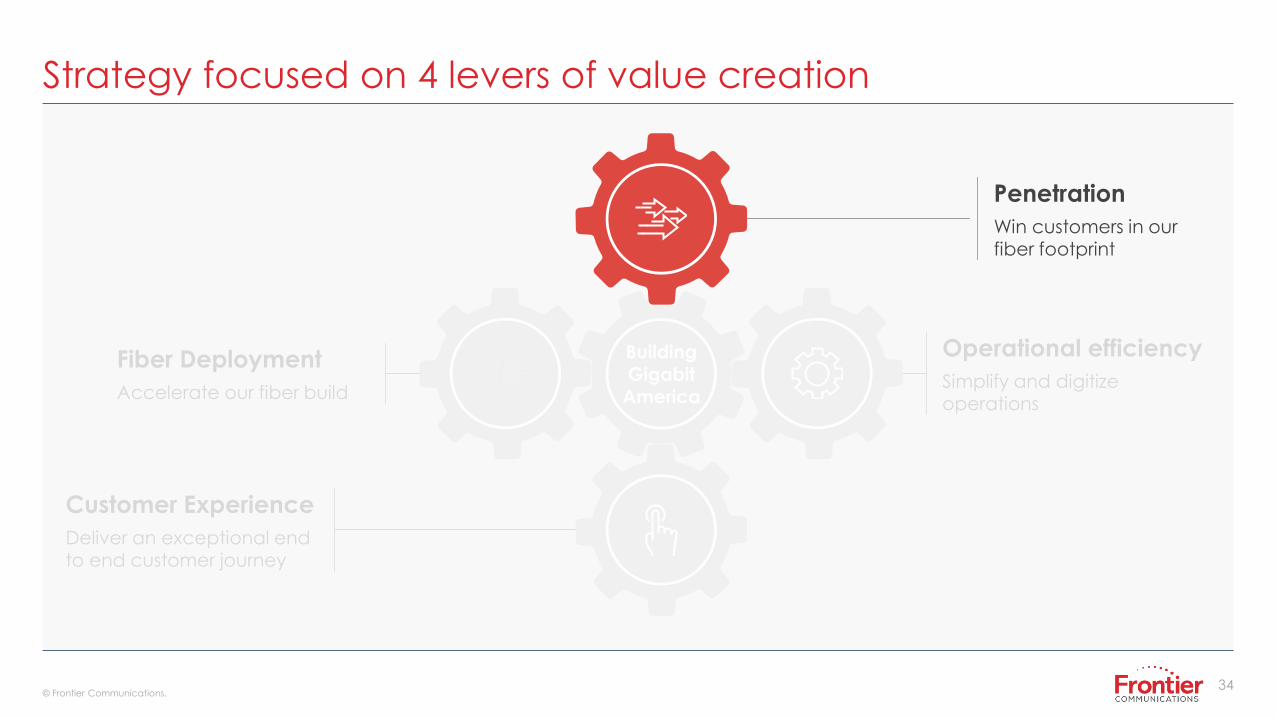
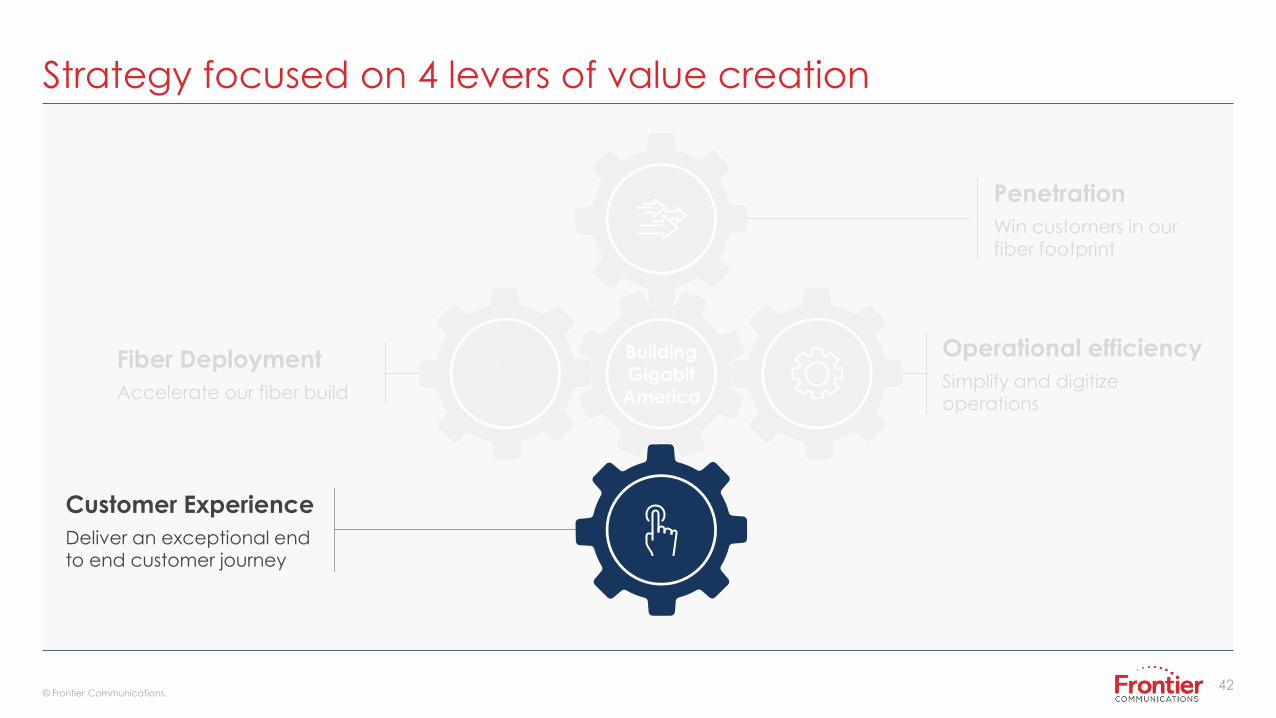
Strategy focused on 4 levers of value creation
Customer Experience
Deliver an exceptional endto end customer journey
Fiber Deployment
Accelerate our fiber build
Operational efficiency
Simplify and digitize operations
Penetration
Win customers in our fiber footprint
BuildingGigabit
America
19© Frontier Communications.
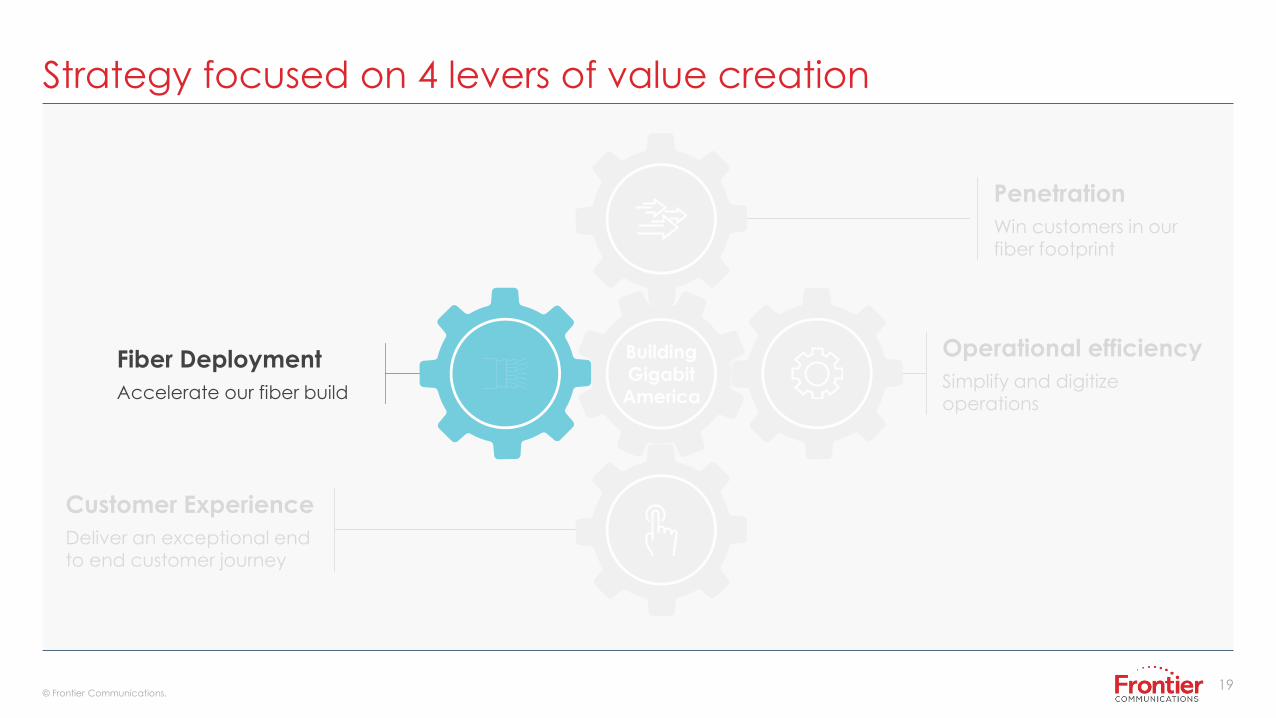
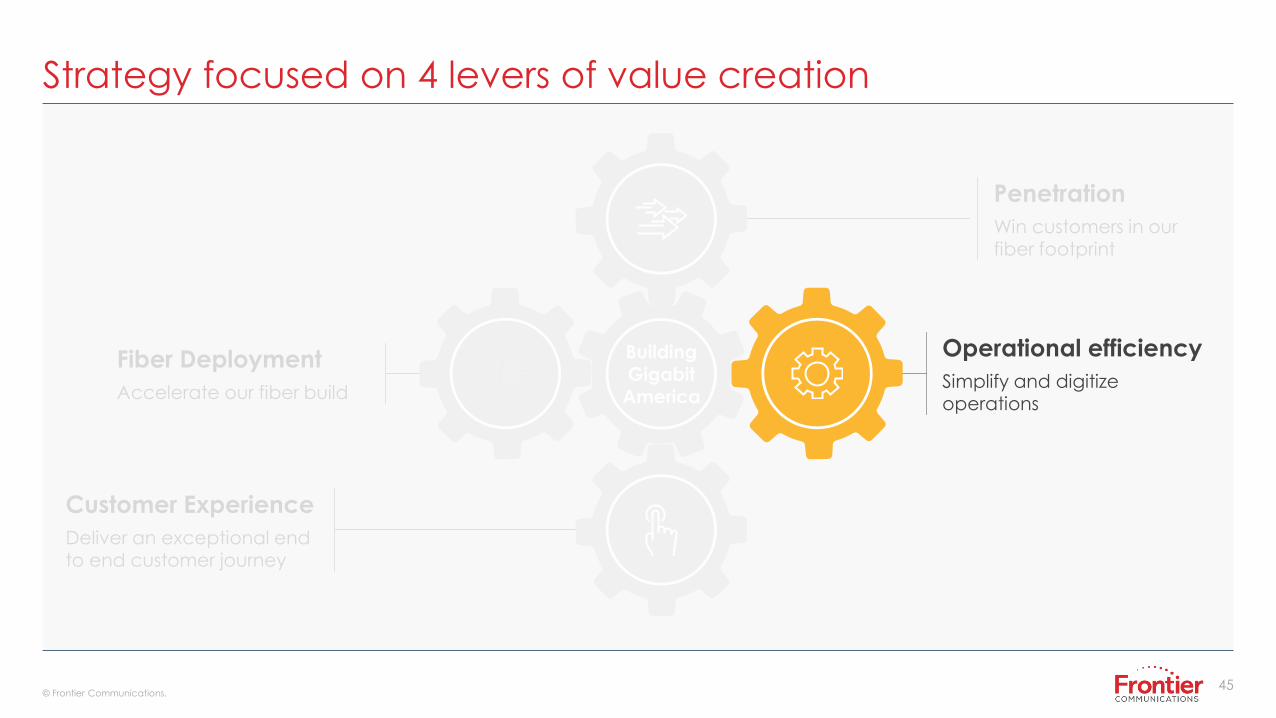
Strategy focused on 4 levers of value creation
Customer Experience
Deliver an exceptional endto end customer journey
Fiber Deployment
Accelerate our fiber build
Operational efficiency
Simplify and digitize operations
Penetration
Win customers in our fiber footprint
BuildingGigabit
America
20© Frontier Communications.
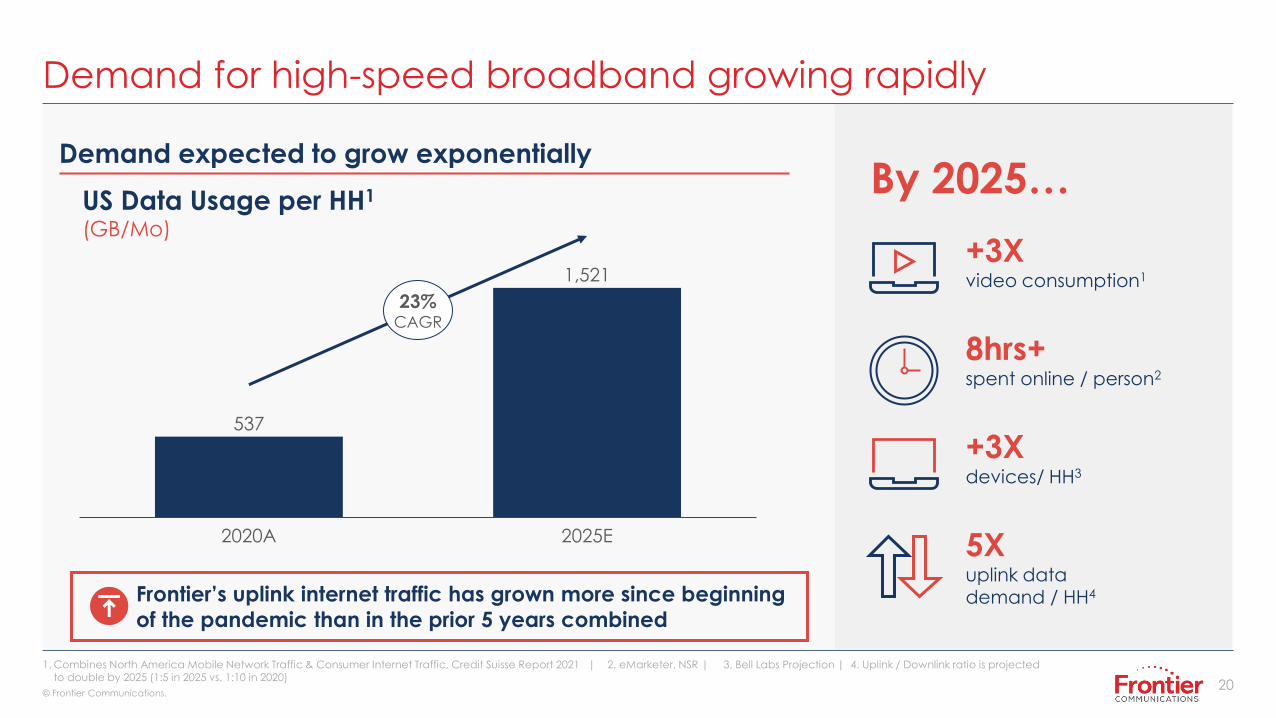
Demand for high-speed broadband growing rapidly
1. Combines North America Mobile Network Traffic & Consumer Internet Traffic, Credit Suisse Report 2021 | 2. eMarketer, NSR | 3. Bell Labs Projection | 4. Uplink / Downlink ratio is projectedto double by 2025 (1:5 in 2025 vs. 1:10 in 2020)
Demand expected to grow exponentially
537
1,521
2020A 2025E
23%CAGR
US Data Usage per HH1
(GB/Mo)
By 2025…
+3X devices/ HH3
+3X video consumption1
8hrs+ spent online / person2
5Xuplink data demand / HH4Frontier’s uplink internet traffic has grown more since beginning
of the pandemic than in the prior 5 years combined
21© Frontier Communications.
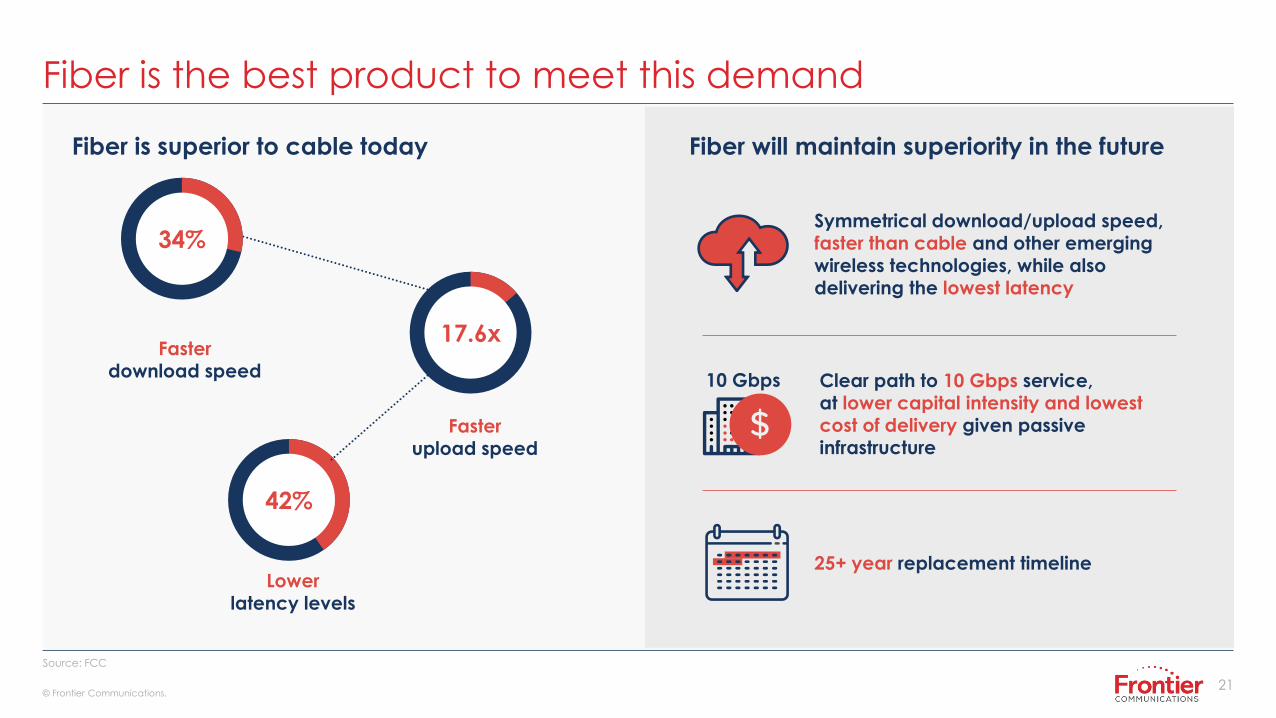
Fiber is the best product to meet this demand
Faster download speed
Faster upload speed
Lower latency levels
Source: FCC
Fiber is superior to cable today Fiber will maintain superiority in the future
25+ year replacement timeline
Clear path to 10 Gbps service, at lower capital intensity and lowest cost of delivery given passive infrastructure
10 Gbps
Symmetrical download/upload speed, faster than cable and other emerging wireless technologies, while also delivering the lowest latency
42%
34%
17.6x
22© Frontier Communications.
22
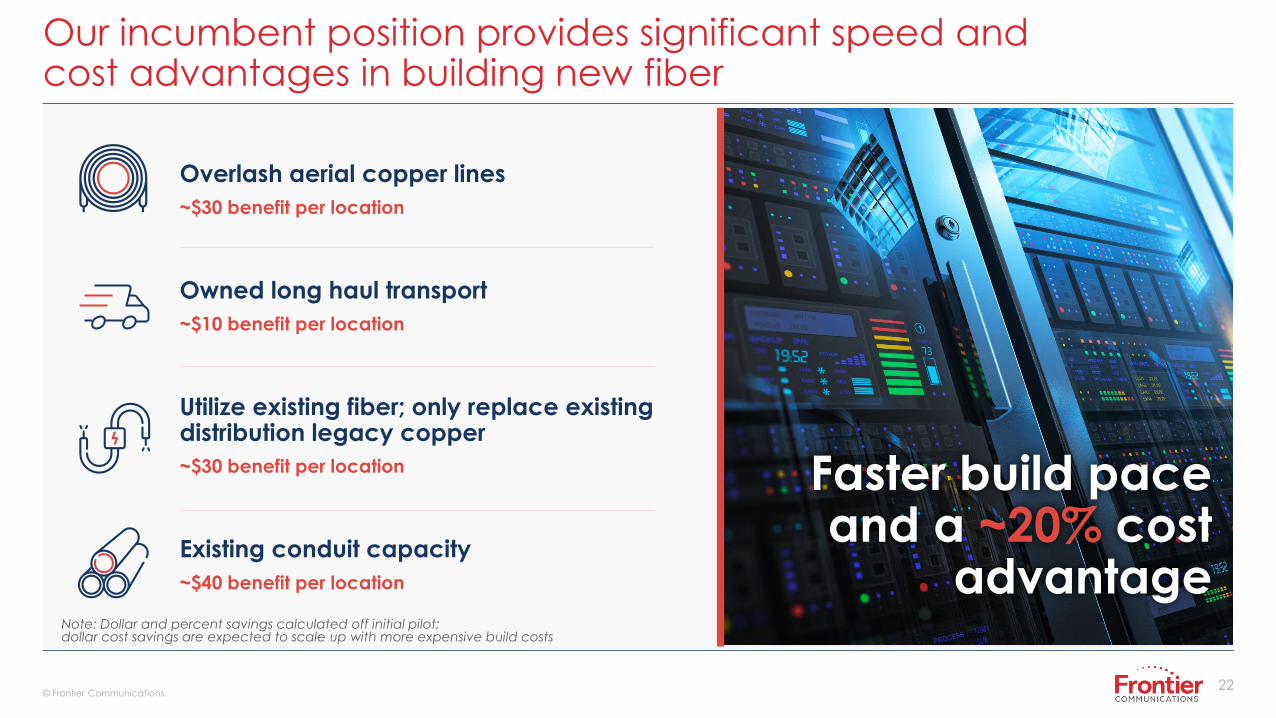
Our incumbent position provides significant speed and cost advantages in building new fiber
Overlash aerial copper lines
~$30 benefit per location
Owned long haul transport
~$10 benefit per location
Utilize existing fiber; only replace existing distribution legacy copper
~$30 benefit per location
Existing conduit capacity
~$40 benefit per location
Faster build pace and a ~20% cost
advantage Note: Dollar and percent savings calculated off initial pilot; dollar cost savings are expected to scale up with more expensive build costs
23© Frontier Communications.
23© Frontier Communications.
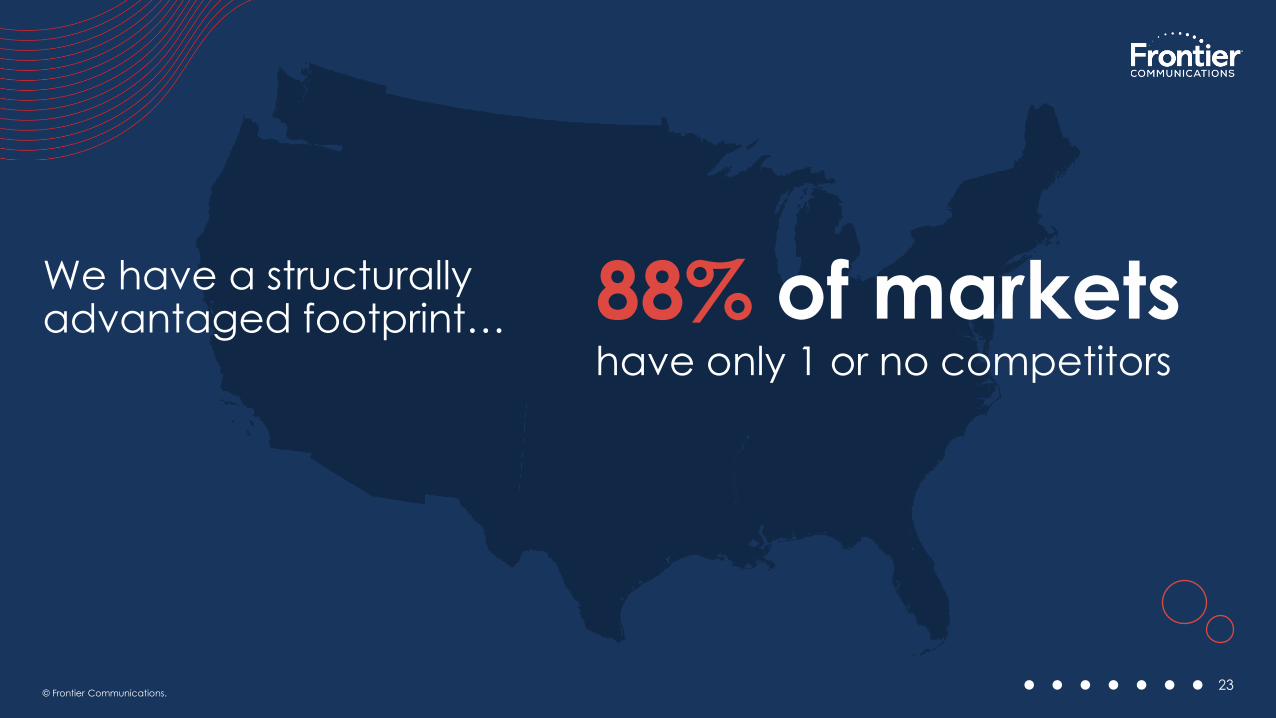
We have a structurally advantaged footprint… 88% of markets
have only 1 or no competitors
• • • • • • •
24© Frontier Communications.
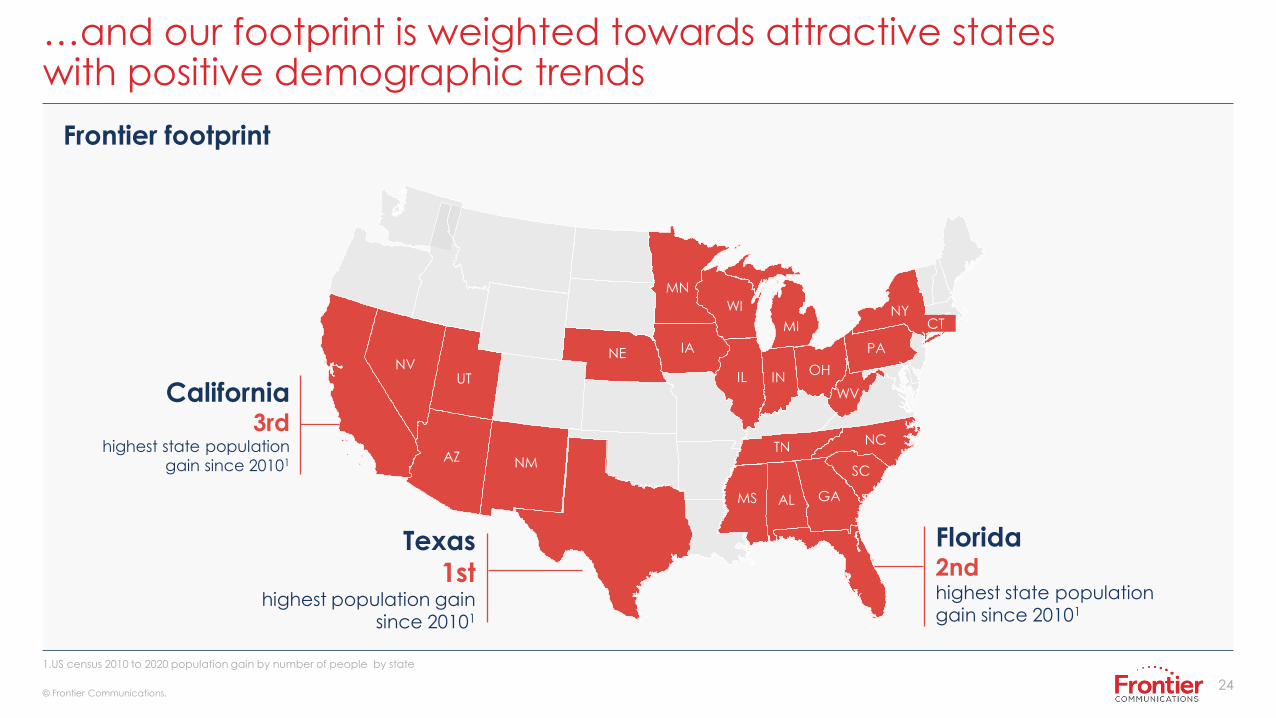
…and our footprint is weighted towards attractive states with positive demographic trends
1.US census 2010 to 2020 population gain by number of people by state
NVUT
AZ NM
NE
MN
IA
IL
WI
MI
INOH
WV
PA
NYCT
NCTN
MS AL GA
SC
California3rd
highest state population
gain since 20101
Texas
1sthighest population gain
since 20101
Florida2ndhighest state population gain since 20101
Frontier footprint
25© Frontier Communications.
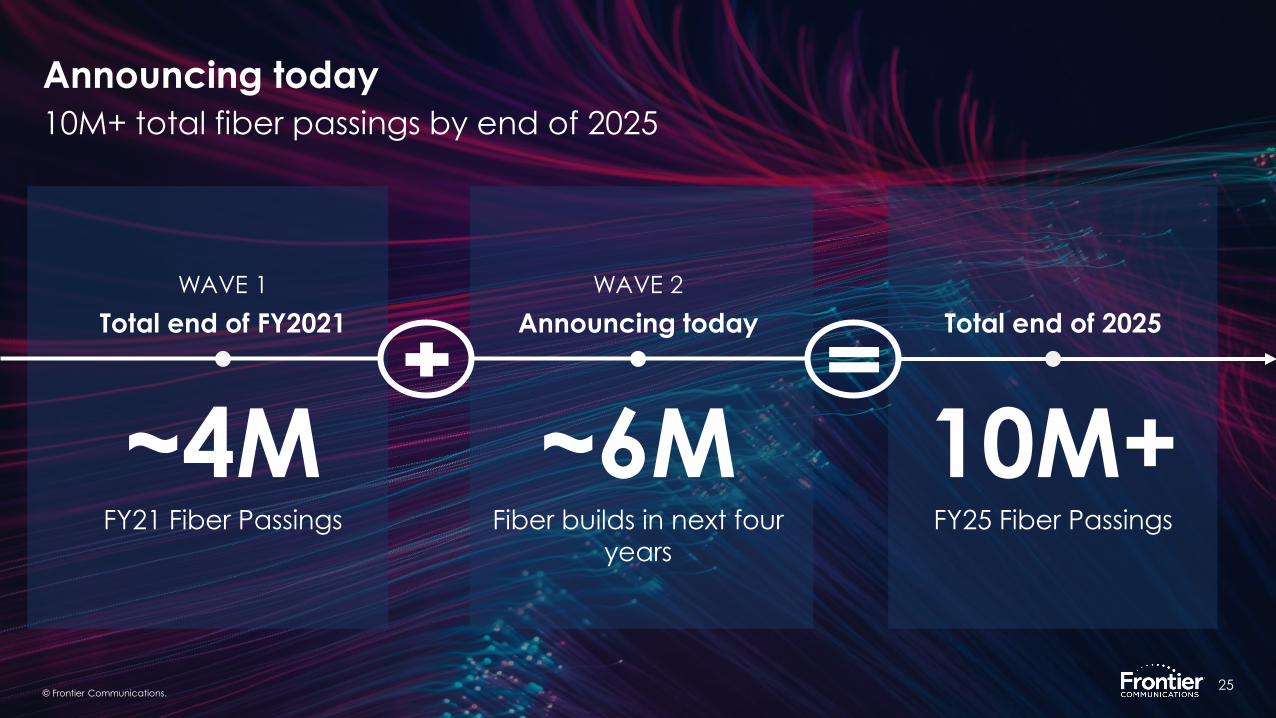
Announcing today
25© Frontier Communications.
10M+ total fiber passings by end of 2025
Total end of 2025
10M+FY25 Fiber Passings
WAVE 2
Announcing today
~6MFiber builds in next four
years
WAVE 1
Total end of FY2021
~4MFY21 Fiber Passings
26© Frontier Communications.
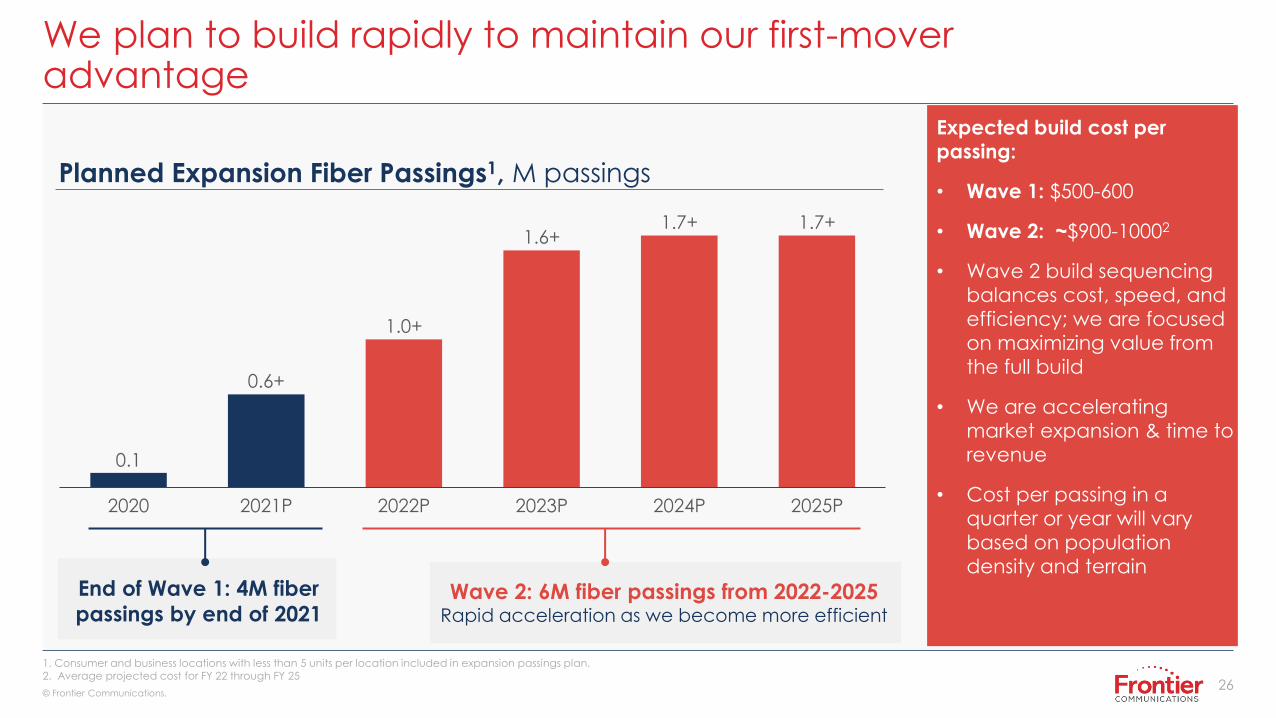
We plan to build rapidly to maintain our first-mover advantage
0.1
1.0+
2024P2020 2022P2021P 2023P 2025P
0.6+
1.6+1.7+ 1.7+
Planned Expansion Fiber Passings1, M passings
Expected build cost per
passing:
• Wave 1: $500-600
• Wave 2: ~$900-10002
• Wave 2 build sequencing
balances cost, speed, and
efficiency; we are focused
on maximizing value from
the full build
• We are accelerating
market expansion & time to
revenue
• Cost per passing in a
quarter or year will vary
based on population
density and terrain
Wave 2: 6M fiber passings from 2022-2025 Rapid acceleration as we become more efficient
1. Consumer and business locations with less than 5 units per location included in expansion passings plan.2. Average projected cost for FY 22 through FY 25
End of Wave 1: 4M fiber
passings by end of 2021
27© Frontier Communications.
27
Foundation
for scaled
build in
place
Materials
Permitting
Labor
28© Frontier Communications.
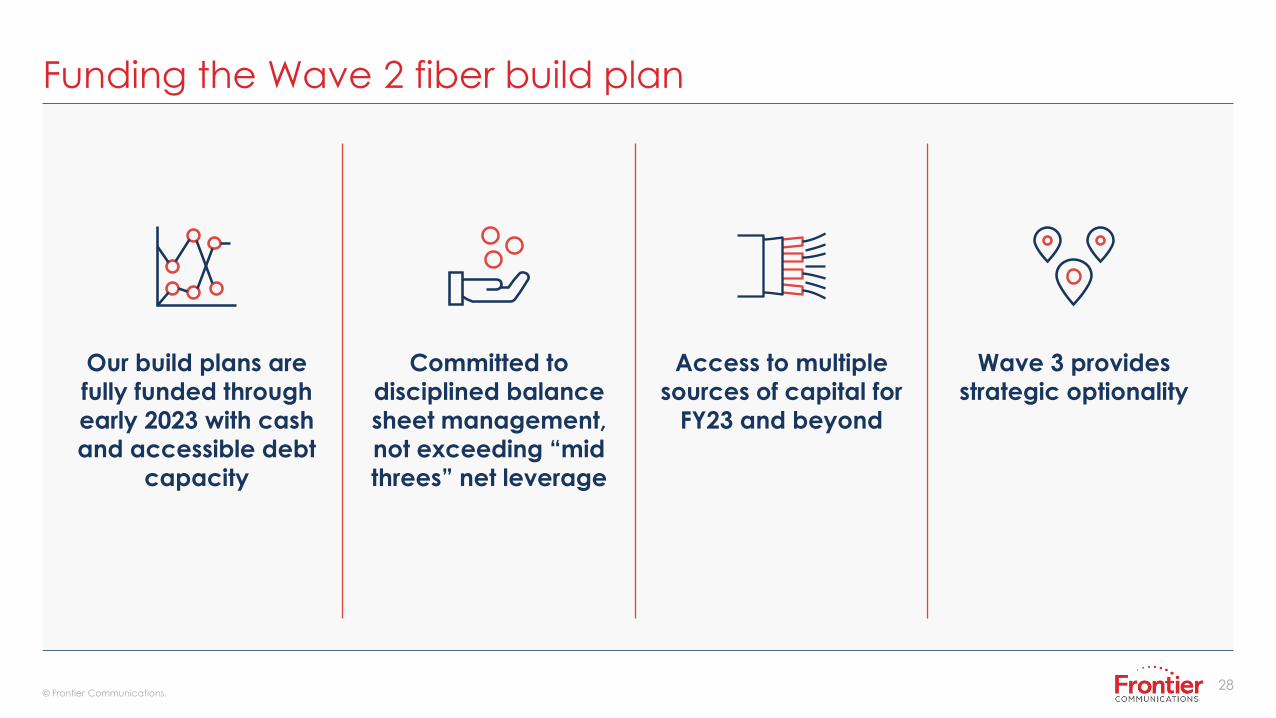
Funding the Wave 2 fiber build plan
Our build plans are
fully funded through
early 2023 with cash
and accessible debt
capacity
Wave 3 provides
strategic optionality
Committed to
disciplined balance
sheet management,
not exceeding “mid
threes” net leverage
Access to multiple
sources of capital for
FY23 and beyond
29© Frontier Communications.
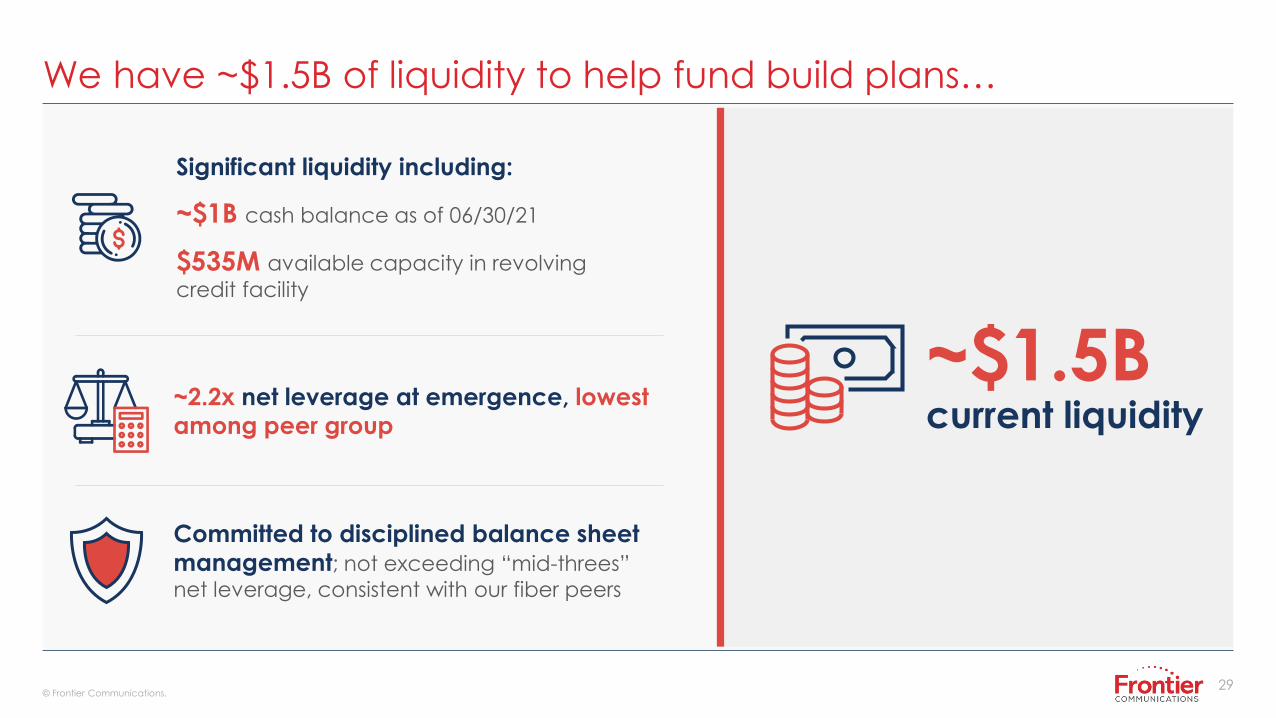
We have ~$1.5B of liquidity to help fund build plans…
~$1.5B current liquidity
Significant liquidity including:
~$1B cash balance as of 06/30/21
$535M available capacity in revolving
credit facility
~2.2x net leverage at emergence, lowest
among peer group
Committed to disciplined balance sheet
management; not exceeding “mid-threes”
net leverage, consistent with our fiber peers
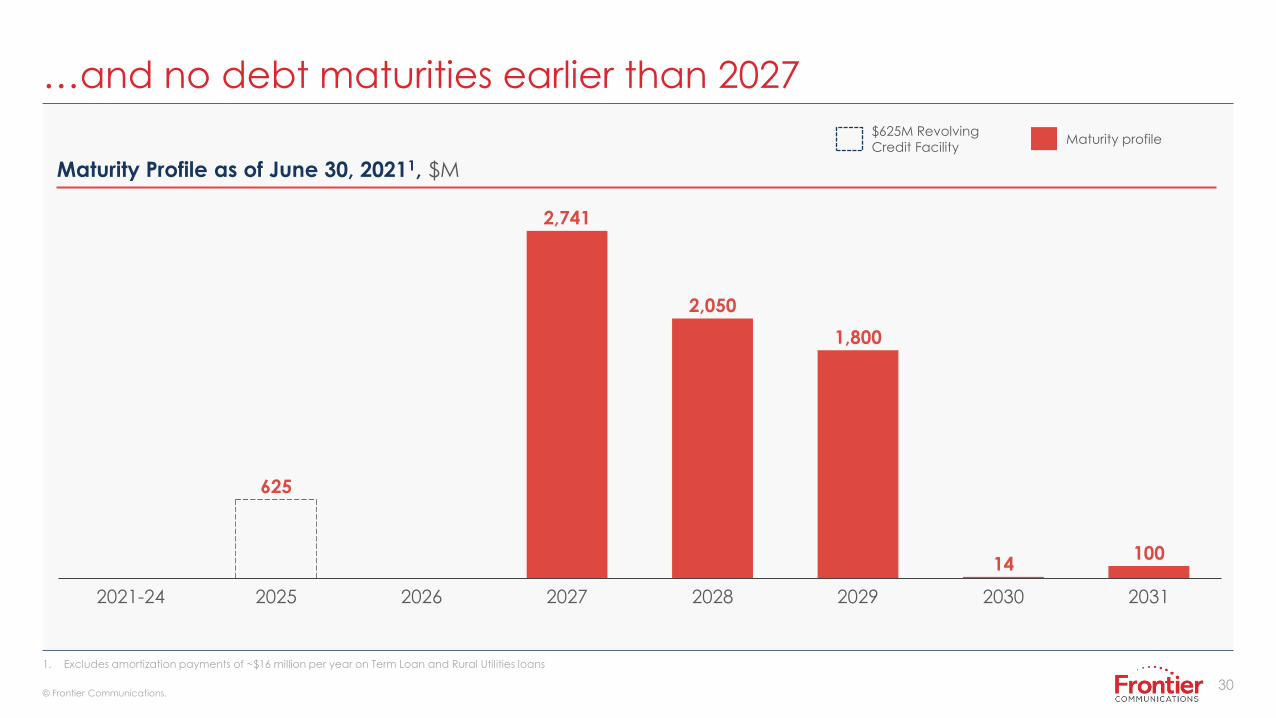
30© Frontier Communications.
…and no debt maturities earlier than 2027
$625M Revolving
Credit FacilityMaturity profile
1. Excludes amortization payments of ~$16 million per year on Term Loan and Rural Utilities loans
Maturity Profile as of June 30, 20211, $M
625
2,741
2,050
1,800
14100
20312021-24 202820262025 2027 2029 2030
31© Frontier Communications.
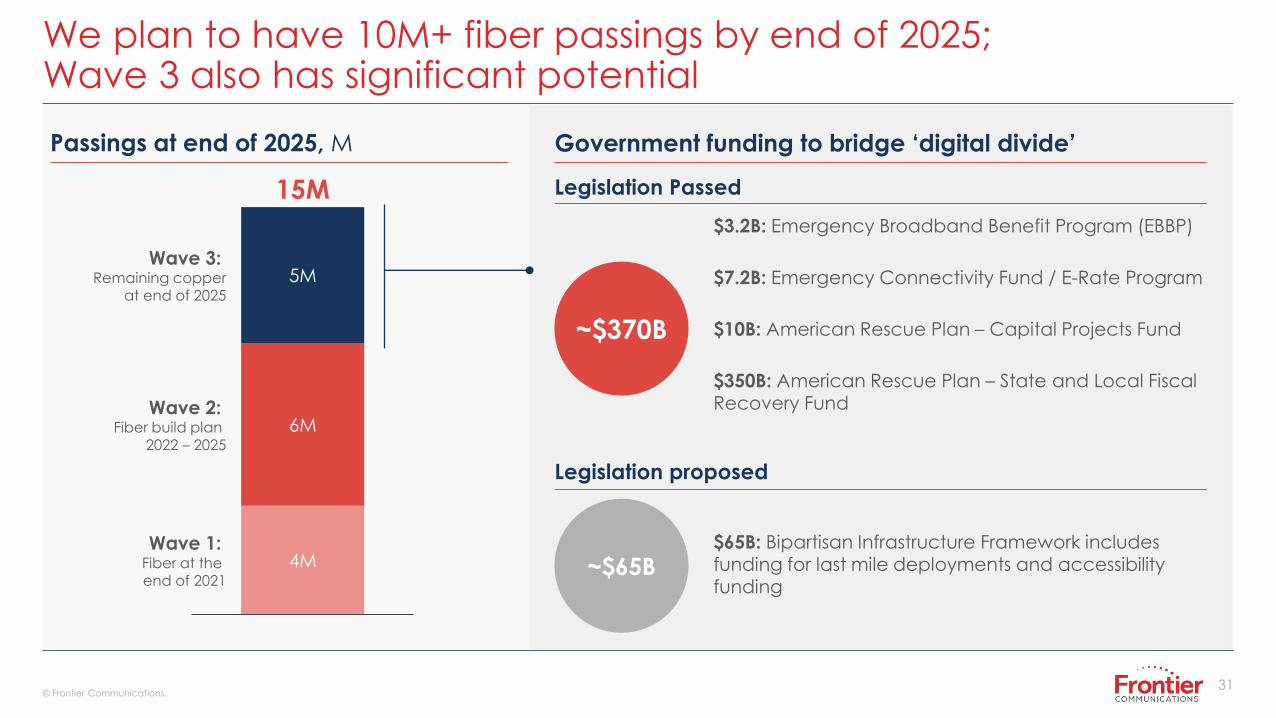
We plan to have 10M+ fiber passings by end of 2025; Wave 3 also has significant potential
Passings at end of 2025, M
Wave 3: Remaining copper
at end of 2025
5M
6M
15M
Wave 2: Fiber build plan
2022 – 2025
4MWave 1:
Fiber at the end of 2021
Government funding to bridge ‘digital divide’
Legislation Passed
$3.2B: Emergency Broadband Benefit Program (EBBP)
$7.2B: Emergency Connectivity Fund / E-Rate Program
$10B: American Rescue Plan – Capital Projects Fund
$350B: American Rescue Plan – State and Local Fiscal Recovery Fund
~$370B
$65B: Bipartisan Infrastructure Framework includes funding for last mile deployments and accessibility funding
~$65B
Legislation proposed
32© Frontier Communications.
Wave 3 provides strategic optionality
Upgrade to fiber Optimize & Hold Strategic Options
33© Frontier Communications.
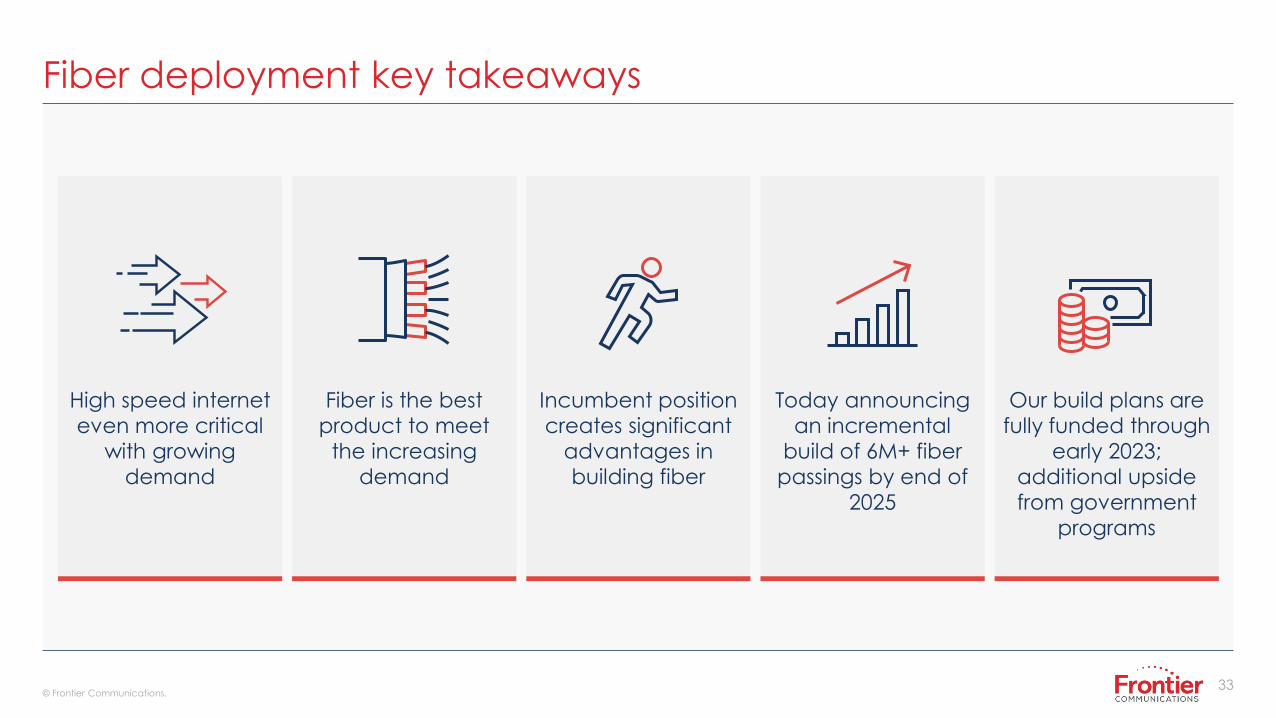
Fiber deployment key takeaways
High speed internet
even more critical
with growing
demand
Our build plans are
fully funded through
early 2023;
additional upside
from government
programs
Fiber is the best
product to meet
the increasing
demand
Today announcing
an incremental
build of 6M+ fiber
passings by end of
2025
Incumbent position
creates significant
advantages in
building fiber
34© Frontier Communications.
Strategy focused on 4 levers of value creation
Customer Experience
Deliver an exceptional endto end customer journey
Fiber Deployment
Accelerate our fiber build
Operational efficiency
Simplify and digitize operations
Penetration
Win customers in our fiber footprint
BuildingGigabit
America
35© Frontier Communications.
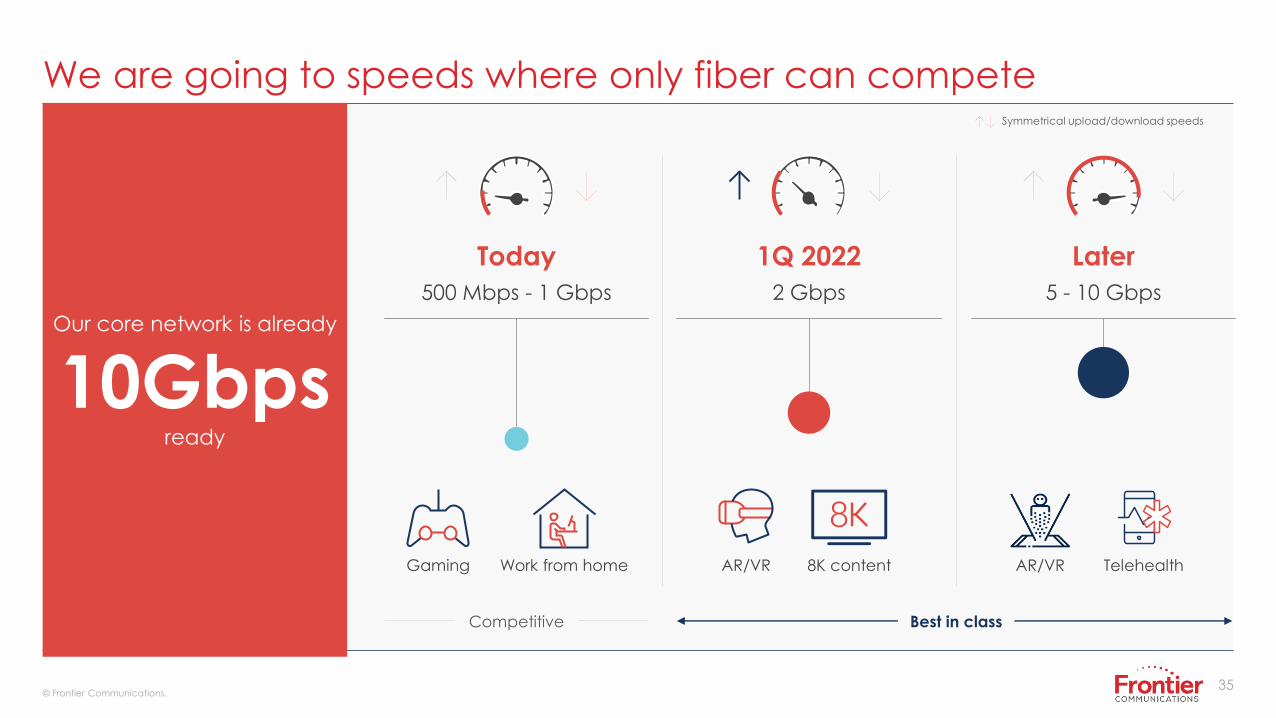
We are going to speeds where only fiber can competeSymmetrical upload/download speeds
Our core network is already
10Gbpsready
Today
500 Mbps - 1 Gbps
1Q 2022
2 Gbps
Later
5 - 10 Gbps
Work from homeGaming AR/VR AR/VR Telehealth8K content
Competitive Best in class
36© Frontier Communications.
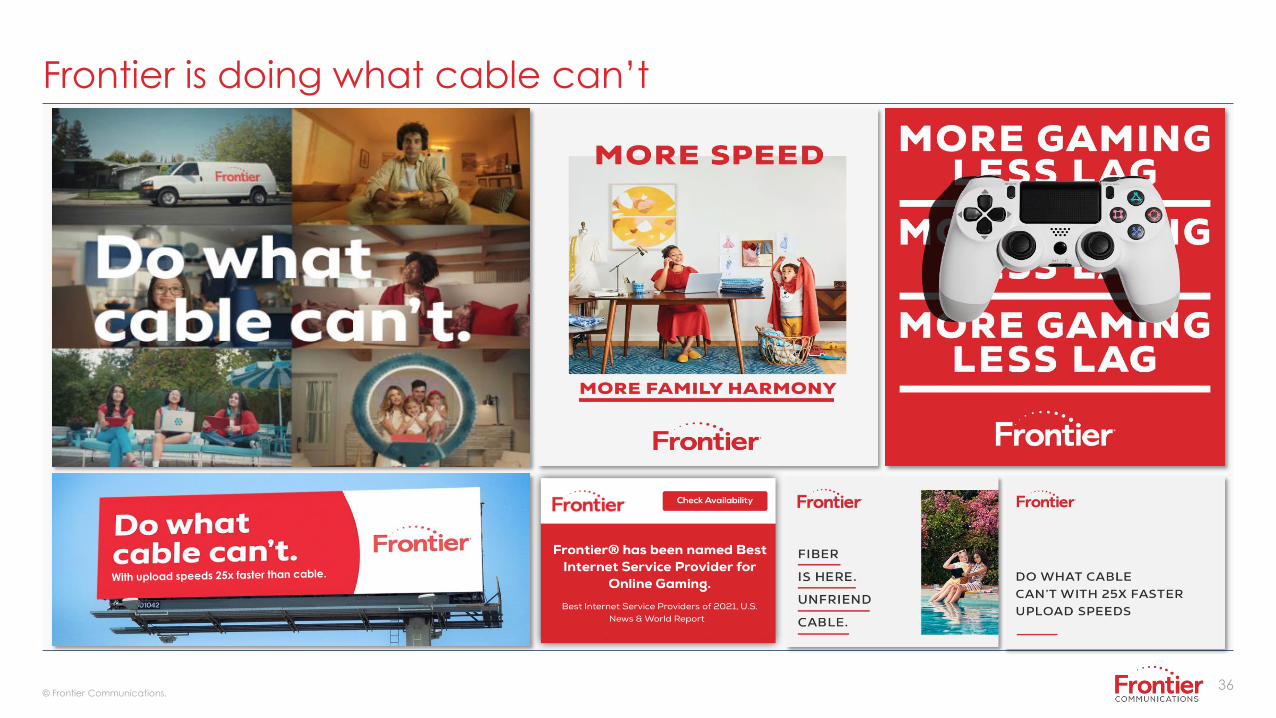
Frontier is doing what cable can’t
37© Frontier Communications.
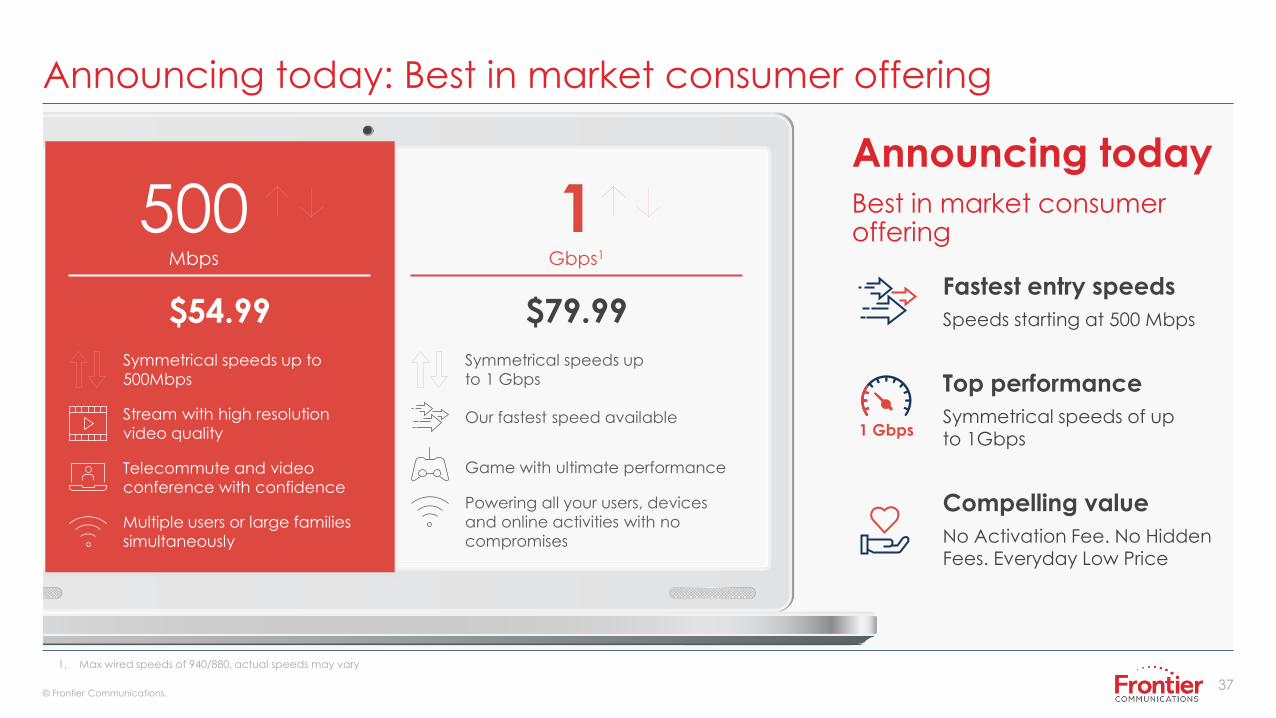
Announcing today: Best in market consumer offering
Announcing todayBest in market consumer offering
$54.99
500Mbps
1Gbps1
$79.99Fastest entry speeds
Speeds starting at 500 Mbps
Top performance
Symmetrical speeds of upto 1Gbps
Compelling value
No Activation Fee. No Hidden Fees. Everyday Low Price
1 Gbps
1. Max wired speeds of 940/880, actual speeds may vary
Stream with high resolution
video quality
Multiple users or large families
simultaneously
Telecommute and video
conference with confidencePowering all your users, devices
and online activities with no
compromises
Symmetrical speeds up to
500Mbps
Symmetrical speeds up
to 1 Gbps
Game with ultimate performance
Our fastest speed available
38© Frontier Communications.
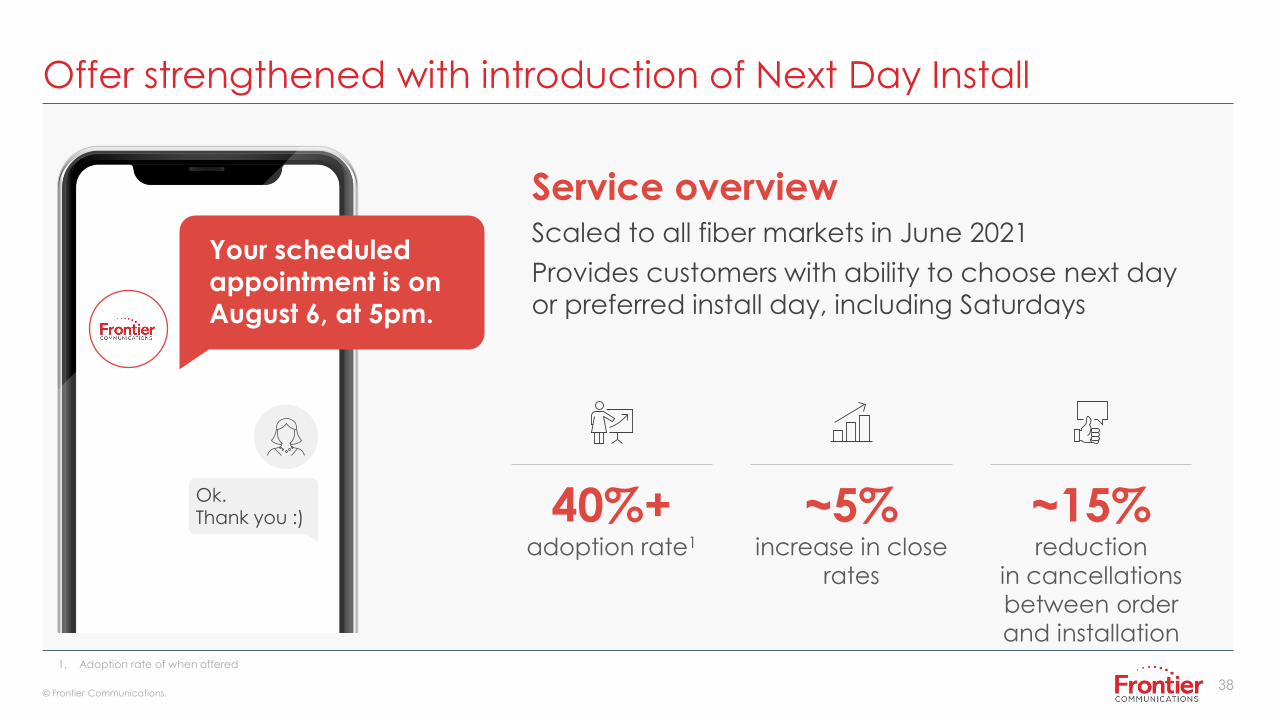
Offer strengthened with introduction of Next Day Install
Your scheduled
appointment is on August 6, at 5pm.
Ok.Thank you :)
Service overviewScaled to all fiber markets in June 2021
Provides customers with ability to choose next day
or preferred install day, including Saturdays
~5%increase in close
rates
~15%reduction
in cancellations
between order
and installation
40%+adoption rate1
1. Adoption rate of when offered
39© Frontier Communications.
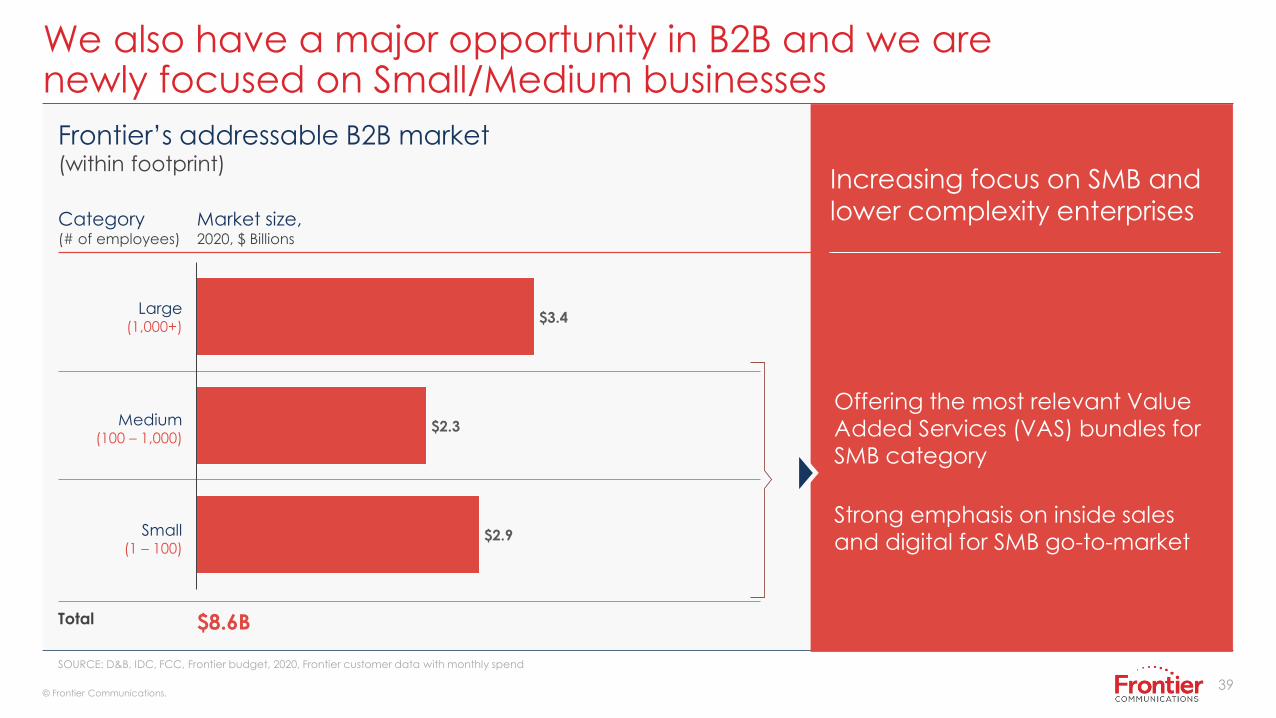
We also have a major opportunity in B2B and we arenewly focused on Small/Medium businesses
SOURCE: D&B, IDC, FCC, Frontier budget, 2020, Frontier customer data with monthly spend
Frontier’s addressable B2B market (within footprint)
$8.6B
Small(1 – 100)
Medium(100 – 1,000)
Large(1,000+)
Total
Market size, 2020, $ Billions
Category(# of employees)
$3.4
$2.3
$2.9
Increasing focus on SMB and
lower complexity enterprises
Offering the most relevant ValueAdded Services (VAS) bundles forSMB category
Strong emphasis on inside salesand digital for SMB go-to-market
40© Frontier Communications.
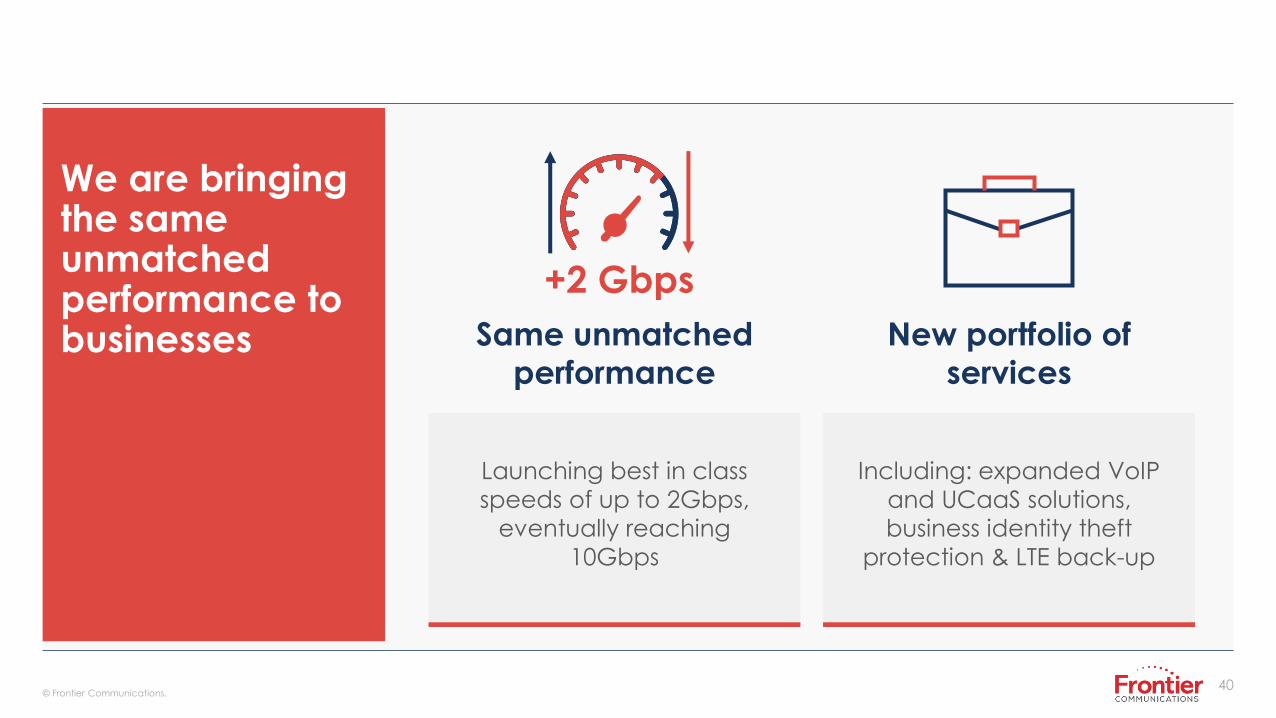
We are bringing the same unmatched performance to businesses
Launching best in class
speeds of up to 2Gbps,
eventually reaching
10Gbps
Including: expanded VoIP
and UCaaS solutions,
business identity theft
protection & LTE back-up
Same unmatched
performance
New portfolio of
services
+2 Gbps
41© Frontier Communications.
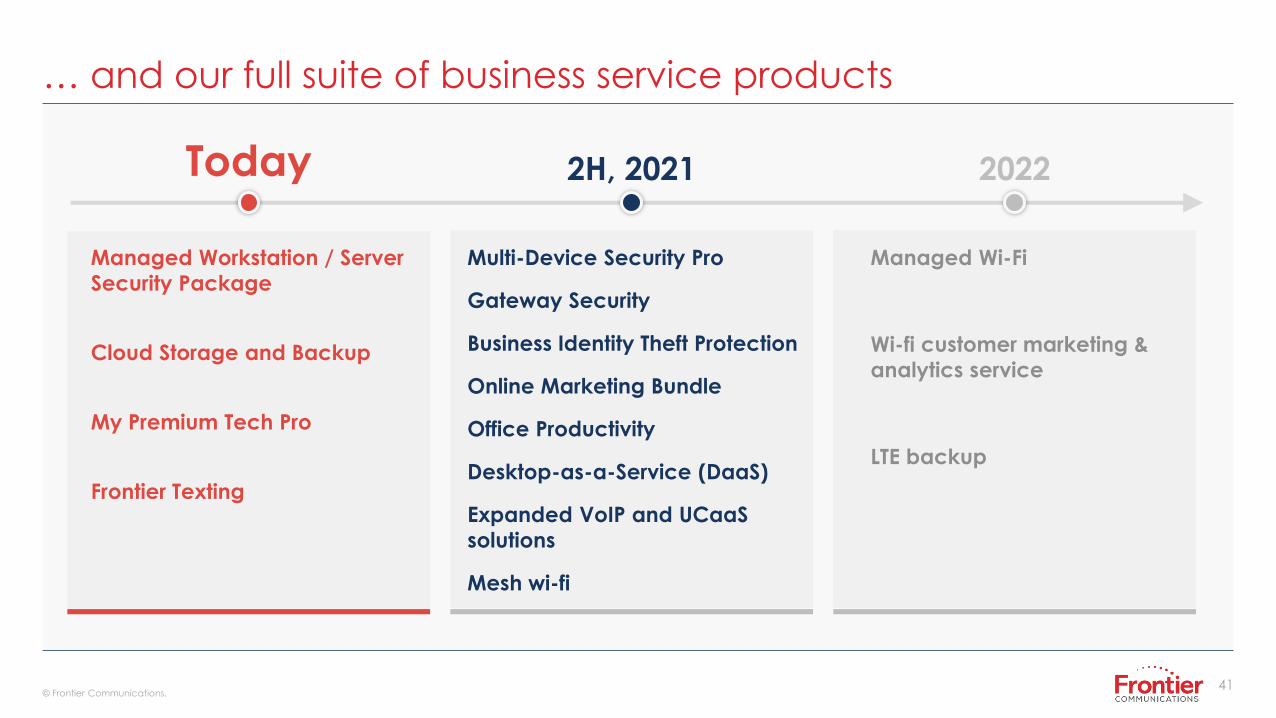
… and our full suite of business service products
20222H, 2021Today
Managed Workstation / Server
Security Package
Cloud Storage and Backup
My Premium Tech Pro
Frontier Texting
Multi-Device Security Pro
Gateway Security
Business Identity Theft Protection
Online Marketing Bundle
Office Productivity
Desktop-as-a-Service (DaaS)
Expanded VoIP and UCaaS
solutions
Mesh wi-fi
Managed Wi-Fi
Wi-fi customer marketing &
analytics service
LTE backup
42© Frontier Communications.
Strategy focused on 4 levers of value creation
Customer Experience
Deliver an exceptional endto end customer journey
Fiber Deployment
Accelerate our fiber build
Operational efficiency
Simplify and digitize operations
Penetration
Win customers in our fiber footprint
BuildingGigabit
America

43© Frontier Communications.
Renewed focus to create deeper customer relationships
Channel of choiceMeet the customer where they want,
whether that’s on the call, over chat, or
via app
Proactive issue resolutionStopping problems and addressing
pain points before they start
Personalized engagementDifferentiated service and freedom to
choose how to engage (e.g., self-
service)
Clear value propositionEasy to understand products,
transparent pricing & billing, excellent
level of care
44© Frontier Communications.
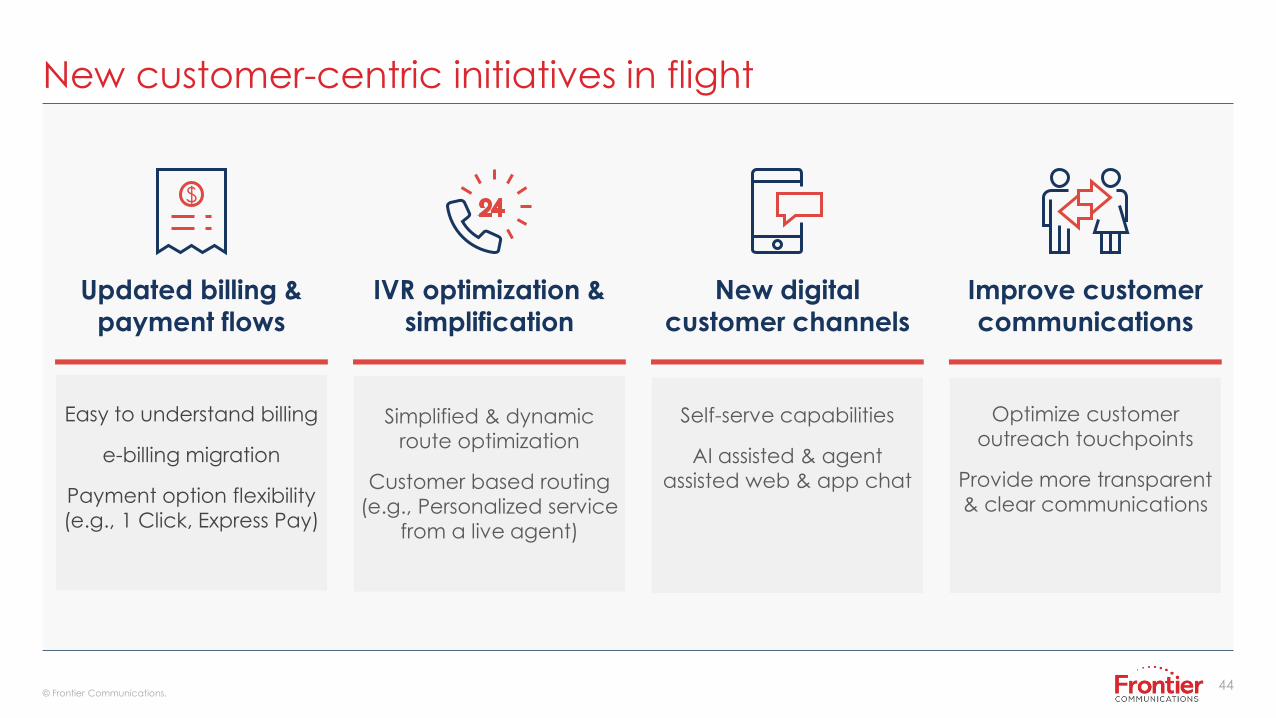
New customer-centric initiatives in flight
Simplified & dynamic
route optimization
Customer based routing
(e.g., Personalized service
from a live agent)
IVR optimization &
simplification
Self-serve capabilities
AI assisted & agent
assisted web & app chat
New digital
customer channels
Optimize customer
outreach touchpoints
Provide more transparent
& clear communications
Improve customer
communications
Easy to understand billing
e-billing migration
Payment option flexibility
(e.g., 1 Click, Express Pay)
Updated billing &
payment flows
$
45© Frontier Communications.
Strategy focused on 4 levers of value creation
Customer Experience
Deliver an exceptional endto end customer journey
Fiber Deployment
Accelerate our fiber build
Operational efficiency
Simplify and digitize operations
Penetration
Win customers in our fiber footprint
BuildingGigabit
America
46© Frontier Communications.
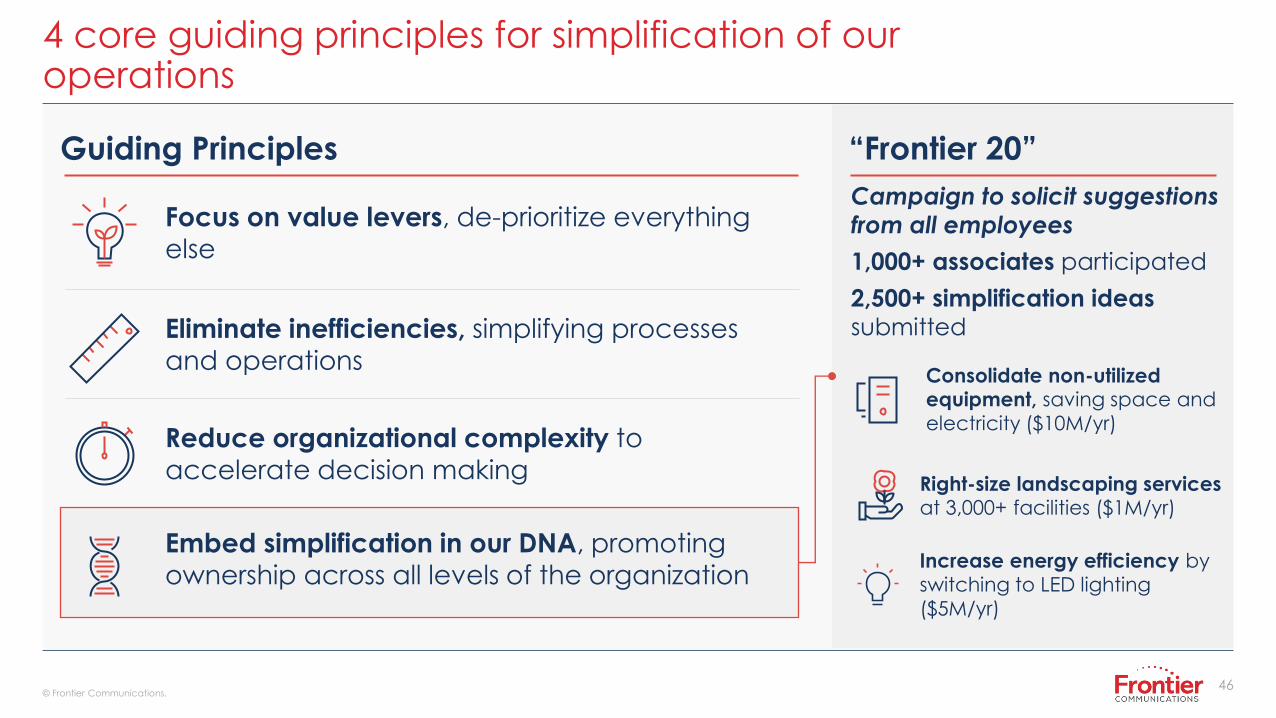
4 core guiding principles for simplification of our operations
Focus on value levers, de-prioritize everything
else
Eliminate inefficiencies, simplifying processes
and operations
Guiding Principles
Reduce organizational complexity to
accelerate decision making
Embed simplification in our DNA, promoting
ownership across all levels of the organization
“Frontier 20”
Increase energy efficiency by
switching to LED lighting
($5M/yr)
Campaign to solicit suggestions
from all employees
1,000+ associates participated
2,500+ simplification ideas
submitted
Consolidate non-utilized equipment, saving space and
electricity ($10M/yr)
Right-size landscaping services at 3,000+ facilities ($1M/yr)
47© Frontier Communications.
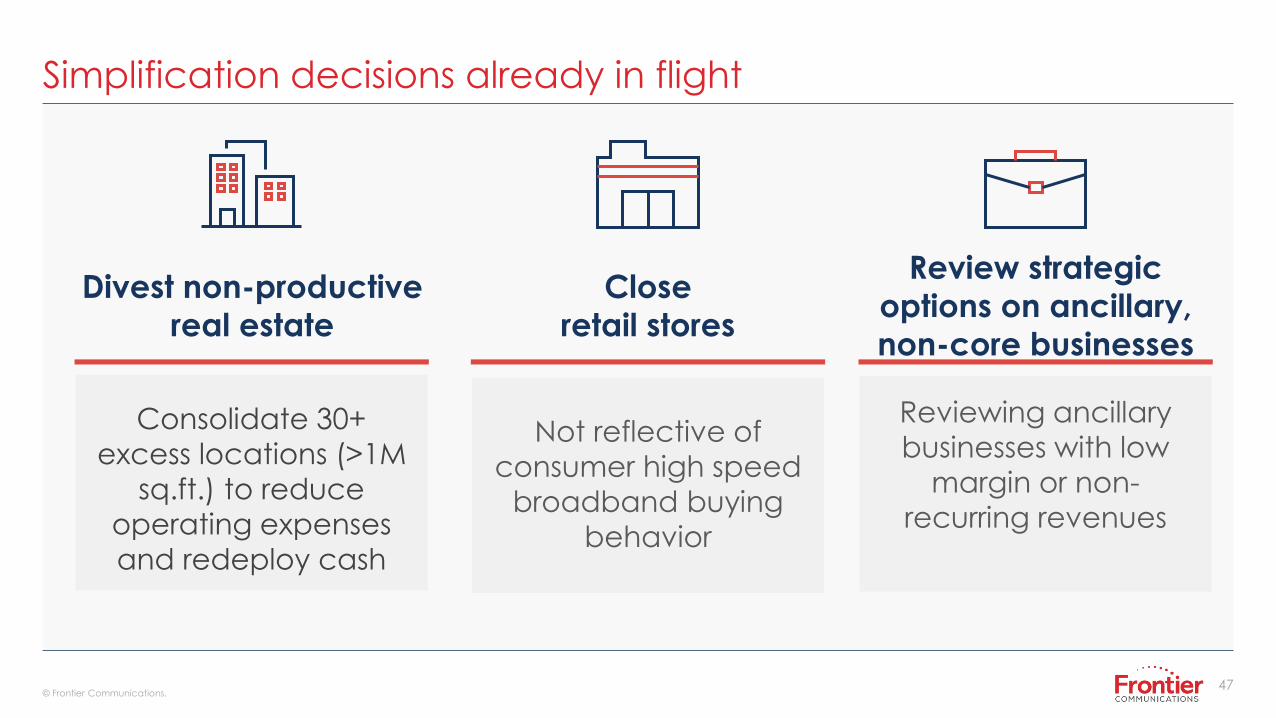
Simplification decisions already in flight
Not reflective of
consumer high speed
broadband buying
behavior
Close
retail stores
Consolidate 30+
excess locations (>1M
sq.ft.) to reduce
operating expenses
and redeploy cash
Divest non-productive
real estate
Reviewing ancillary
businesses with low
margin or non-
recurring revenues
Review strategic
options on ancillary,
non-core businesses
48© Frontier Communications.
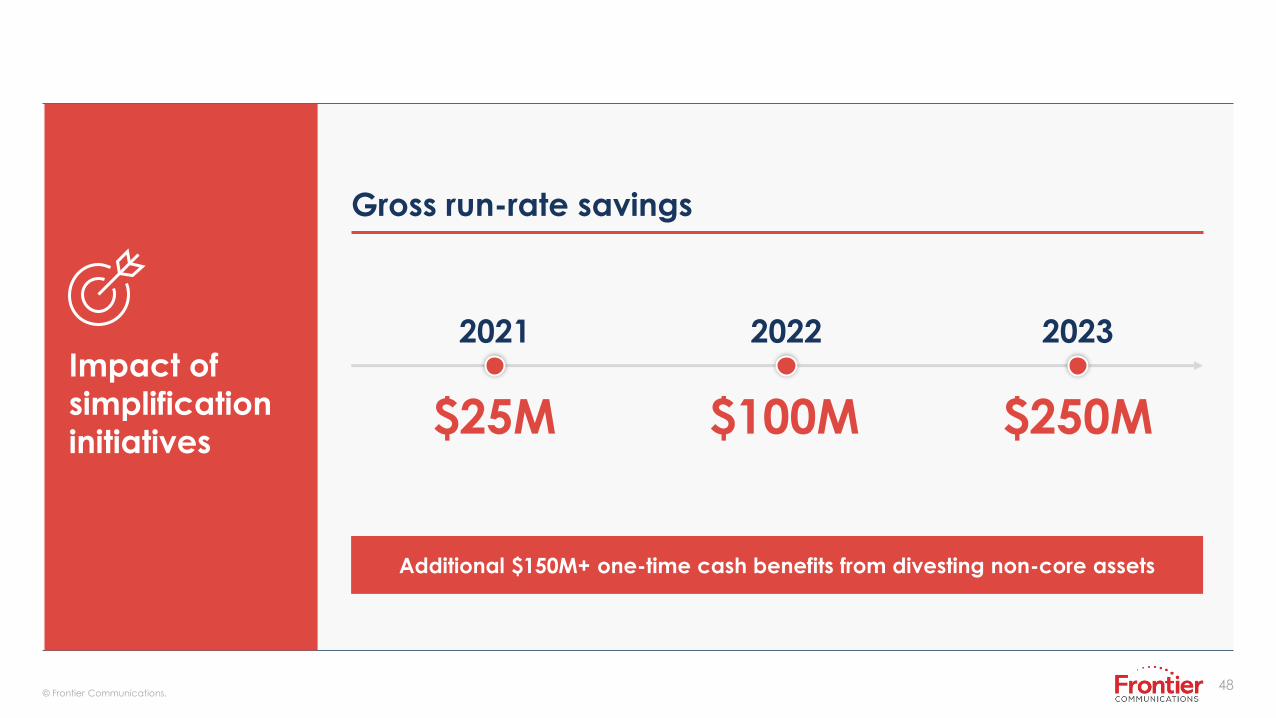
Impact of
simplification
initiatives
2021
$25M
2022
$100M
2023
$250M
Gross run-rate savings
Additional $150M+ one-time cash benefits from divesting non-core assets
49© Frontier Communications.
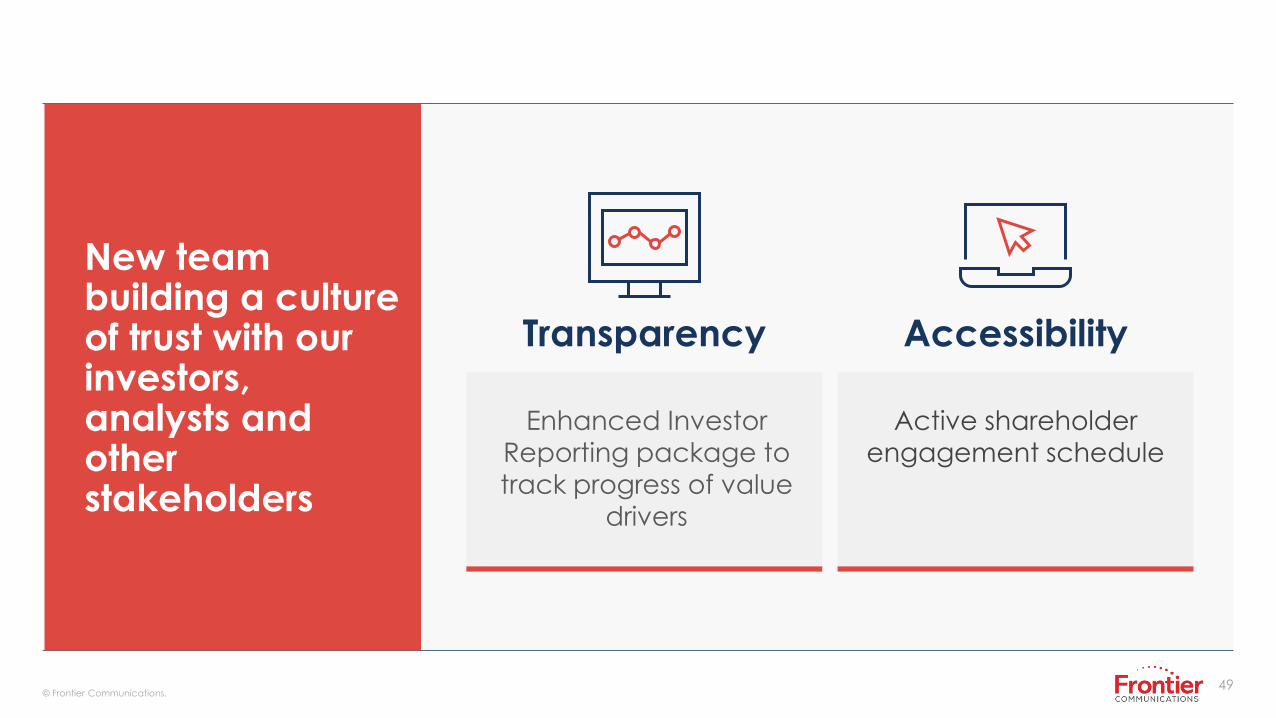
New team building a culture of trust with our investors, analysts and other stakeholders
Enhanced Investor
Reporting package to
track progress of value
drivers
Active shareholder
engagement schedule
Transparency Accessibility
50© Frontier Communications.
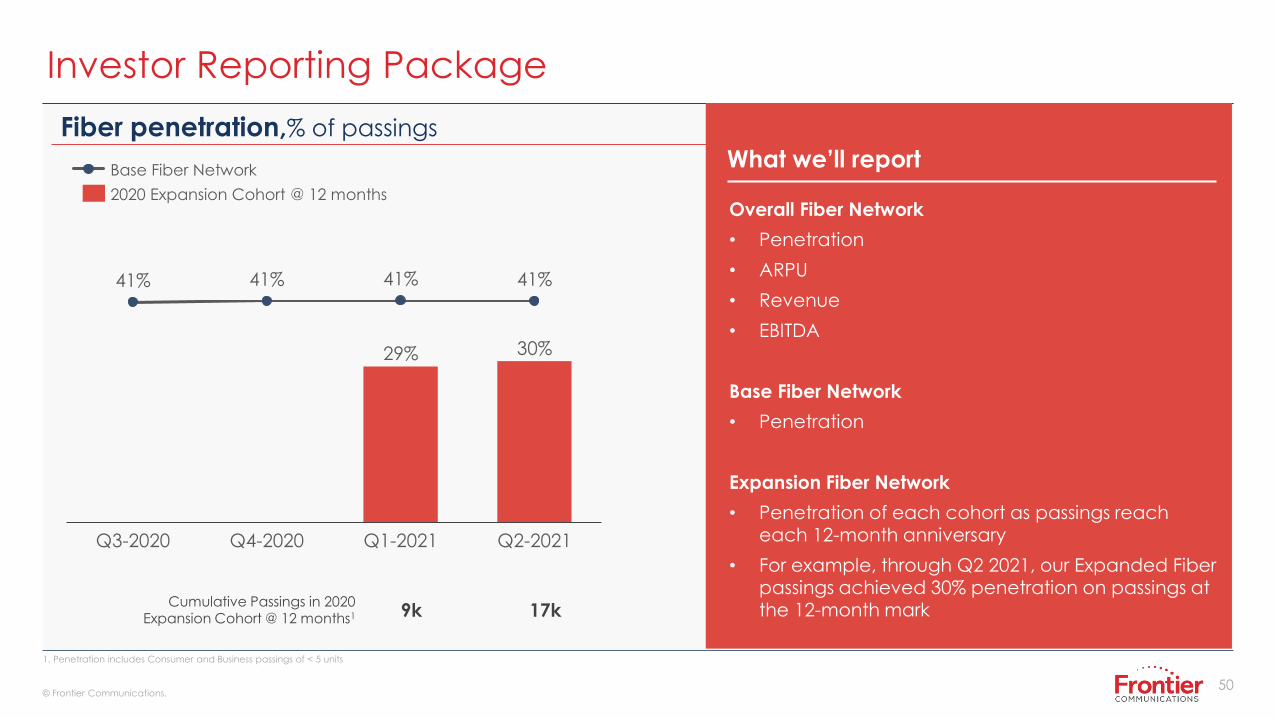
Fiber penetration,% of passings
Investor Reporting Package
1. Penetration includes Consumer and Business passings of < 5 units
Cumulative Passings in 2020 Expansion Cohort @ 12 months1 9k 17k
What we’ll report
Overall Fiber Network
• Penetration
• ARPU
• Revenue
• EBITDA
Base Fiber Network
• Penetration
Expansion Fiber Network
• Penetration of each cohort as passings reach each 12-month anniversary
• For example, through Q2 2021, our Expanded Fiber passings achieved 30% penetration on passings at the 12-month mark
29% 30%
41% 41% 41% 41%
Q3-2020 Q4-2020 Q2-2021Q1-2021
2020 Expansion Cohort @ 12 months
Base Fiber Network
51© Frontier Communications.
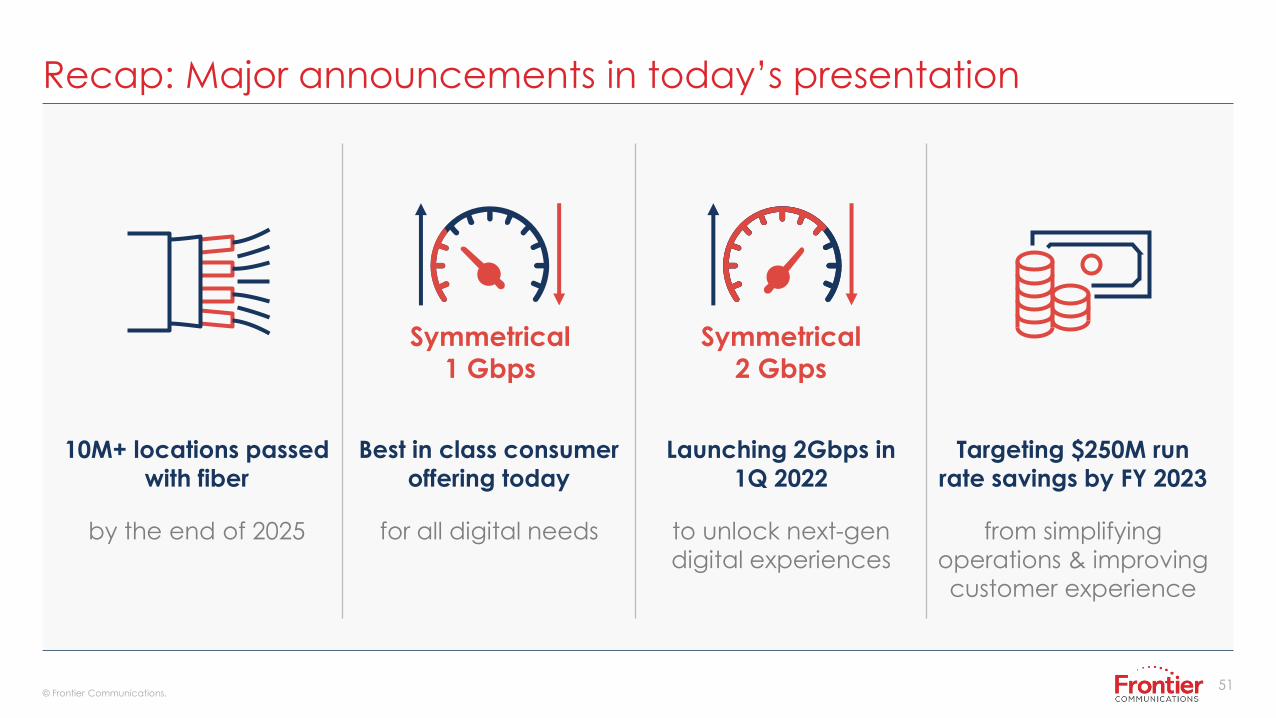
Recap: Major announcements in today’s presentation
10M+ locations passed
with fiber
Best in class consumer
offering today
by the end of 2025 for all digital needs
Launching 2Gbps in
1Q 2022
to unlock next-gen
digital experiences
Targeting $250M run
rate savings by FY 2023
from simplifying
operations & improving
customer experience
Symmetrical
1 Gbps
Symmetrical
2 Gbps
52© Frontier Communications.
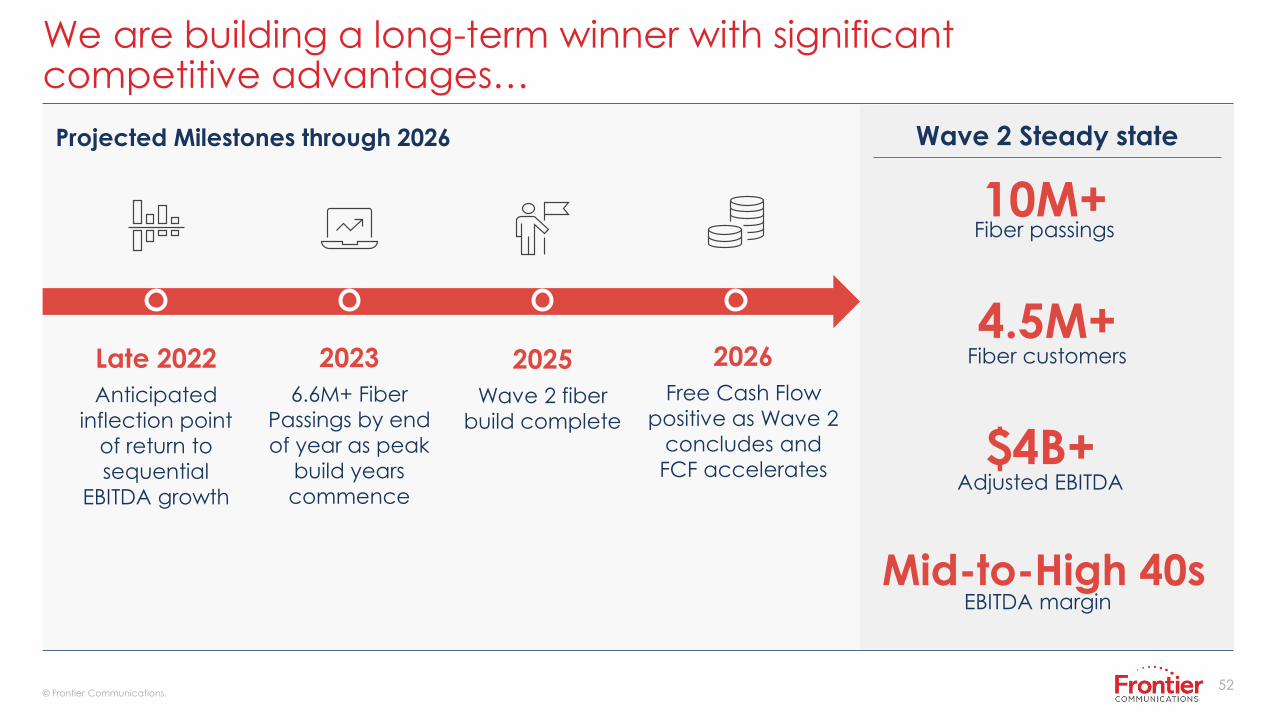
We are building a long-term winner with significant competitive advantages…
10M+Fiber passings
4.5M+Fiber customers
Mid-to-High 40sEBITDA margin
Wave 2 Steady state
$4B+Adjusted EBITDA
Late 2022
Anticipated
inflection point
of return to
sequential
EBITDA growth
2023
6.6M+ Fiber
Passings by end
of year as peak
build years
commence
2025
Wave 2 fiber
build complete
2026
Free Cash Flow
positive as Wave 2
concludes and
FCF accelerates
Projected Milestones through 2026
53© Frontier Communications.
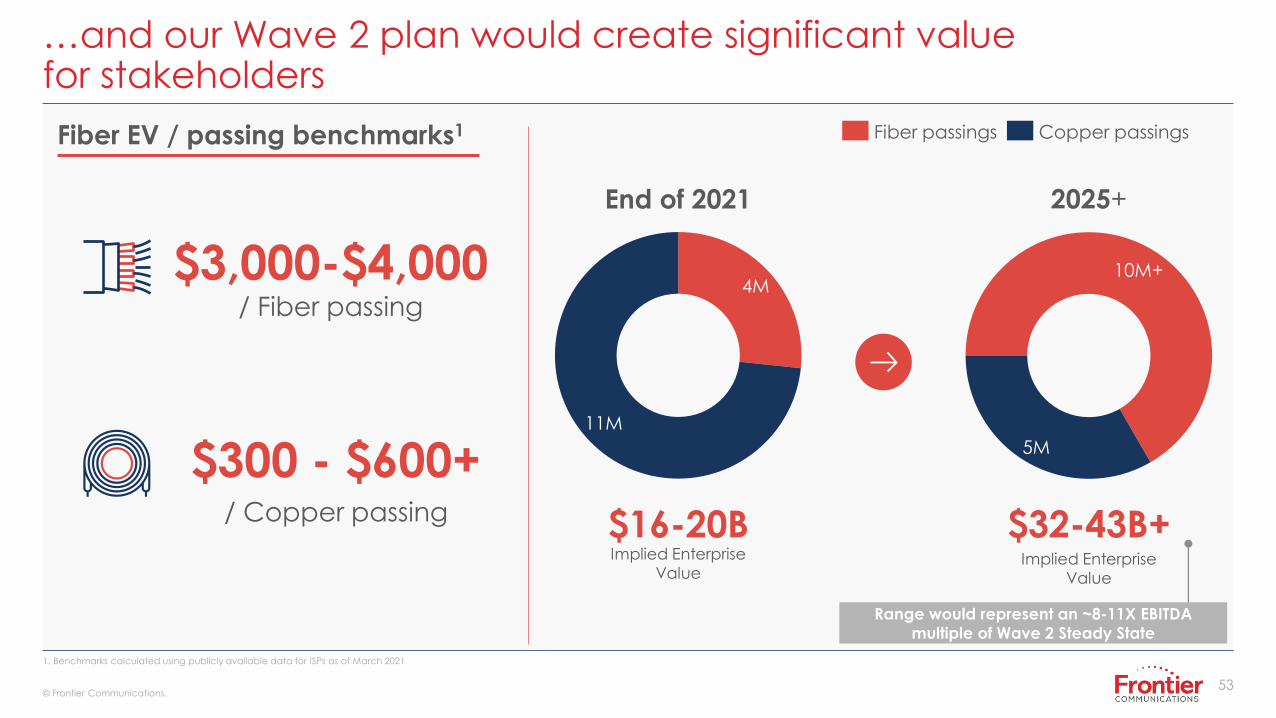
…and our Wave 2 plan would create significant value for stakeholders
1. Benchmarks calculated using publicly available data for ISPs as of March 2021
$3,000-$4,000 / Fiber passing
$300 - $600+ / Copper passing
Fiber EV / passing benchmarks1
4M
11M
10M+
5M
End of 2021 2025+
$16-20B $32-43B+Implied Enterprise
ValueImplied Enterprise
Value
Fiber passings Copper passings
Range would represent an ~8-11X EBITDA
multiple of Wave 2 Steady State
54© Frontier Communications.
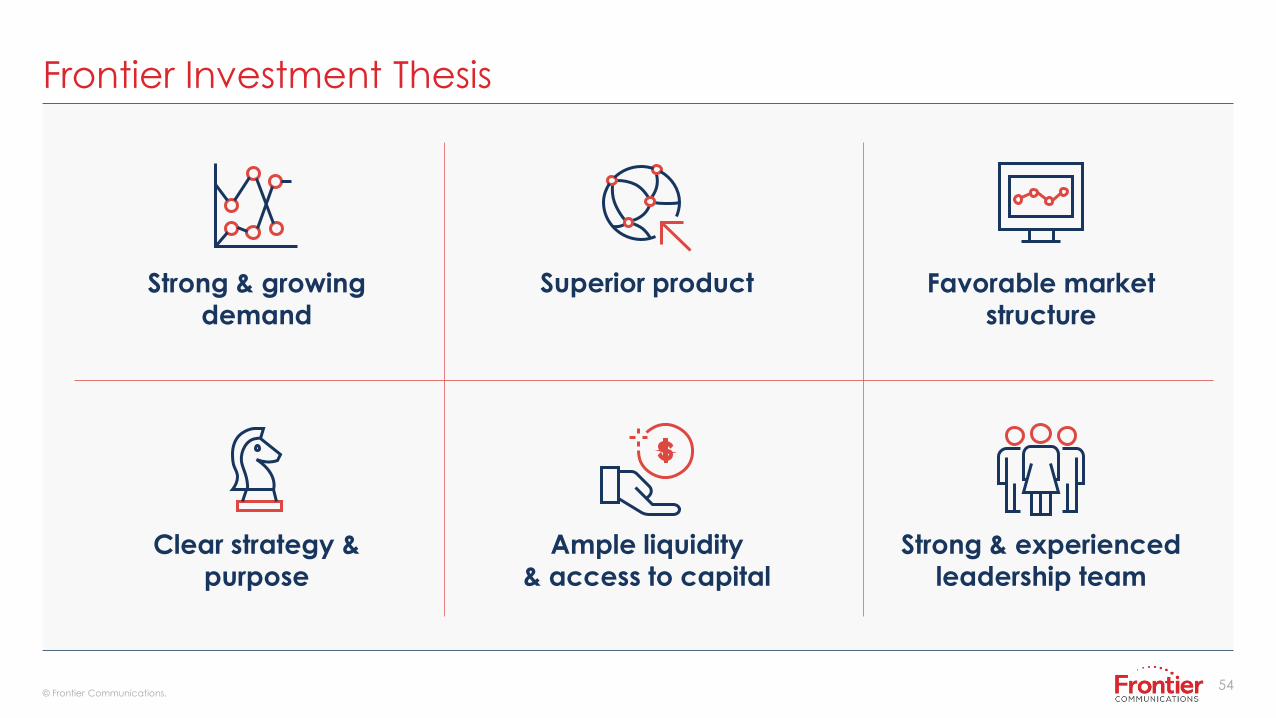
Frontier Investment Thesis
Favorable market
structureStrong & growing
demand
Clear strategy &
purpose
Ample liquidity
& access to capital
Strong & experienced
leadership team
Superior product

55© Frontier Communications.
55© Frontier Communications.
Q&A
• • • • • • •
56© Frontier Communications.
56© Frontier Communications.
Appendix
• • • • • • •
57
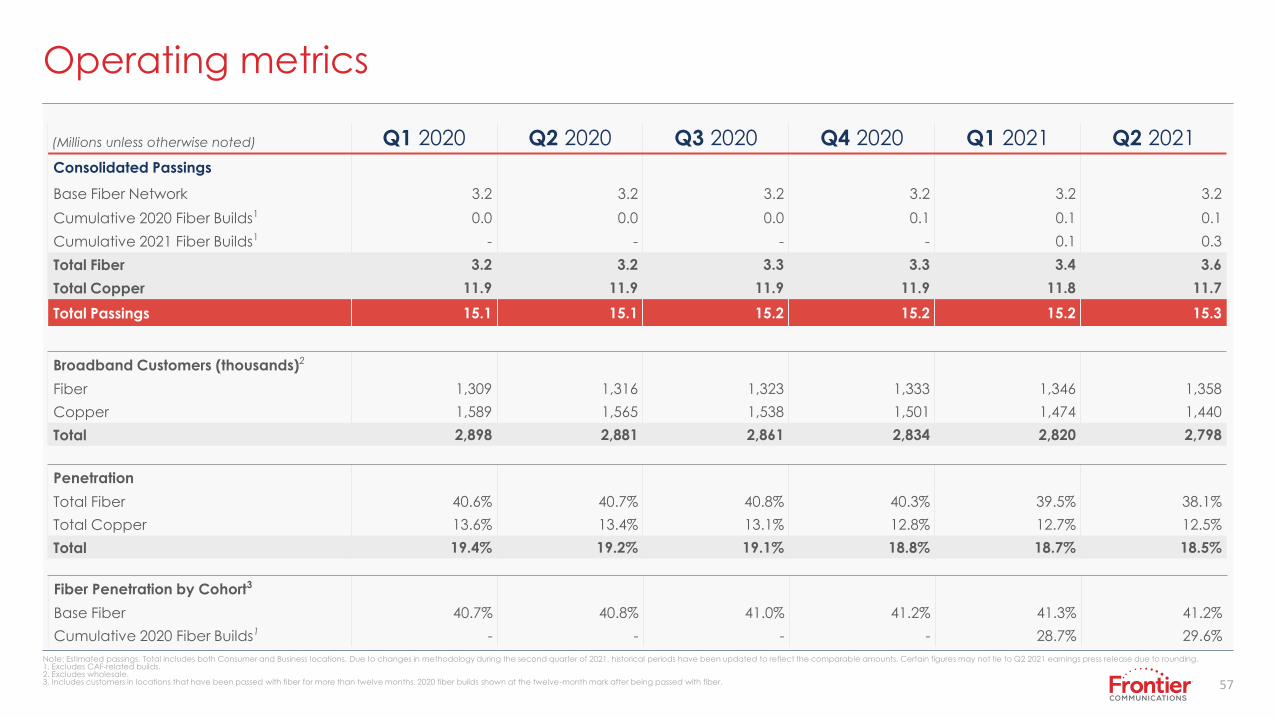
Operating metrics
(Millions unless otherwise noted) Q1 2020 Q2 2020 Q3 2020 Q4 2020 Q1 2021 Q2 2021
Consolidated Passings
Base Fiber Network 3.2 3.2 3.2 3.2 3.2 3.2
Cumulative 2020 Fiber Builds1 0.0 0.0 0.0 0.1 0.1 0.1
Cumulative 2021 Fiber Builds1 - - - - 0.1 0.3
Total Fiber 3.2 3.2 3.3 3.3 3.4 3.6
Total Copper 11.9 11.9 11.9 11.9 11.8 11.7
Total Passings 15.1 15.1 15.2 15.2 15.2 15.3
Note: Estimated passings. Total includes both Consumer and Business locations. Due to changes in methodology during the second quarter of 2021, historical periods have been updated to reflect the comparable amounts. Certain figures may not tie to Q2 2021 earnings press release due to rounding. 1. Excludes CAF-related builds.2. Excludes wholesale.3. Includes customers in locations that have been passed with fiber for more than twelve months. 2020 fiber builds shown at the twelve-month mark after being passed with fiber.
Broadband Customers (thousands)2
Fiber 1,309 1,316 1,323 1,333 1,346 1,358
Copper 1,589 1,565 1,538 1,501 1,474 1,440
Total 2,898 2,881 2,861 2,834 2,820 2,798
Penetration
Total Fiber 40.6% 40.7% 40.8% 40.3% 39.5% 38.1%
Total Copper 13.6% 13.4% 13.1% 12.8% 12.7% 12.5%
Total 19.4% 19.2% 19.1% 18.8% 18.7% 18.5%
Fiber Penetration by Cohort3
Base Fiber 40.7% 40.8% 41.0% 41.2% 41.3% 41.2%
Cumulative 2020 Fiber Builds1 - - - - 28.7% 29.6%
58
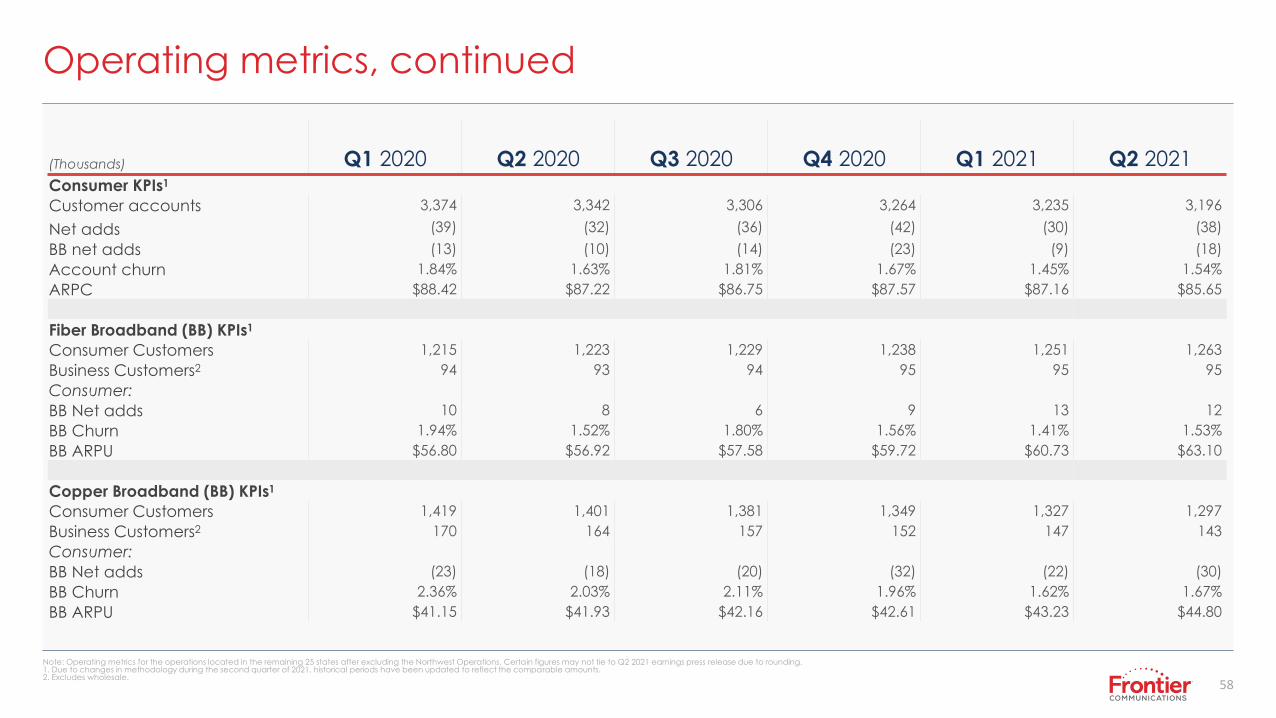
Operating metrics, continued
(Thousands) Q1 2020 Q2 2020 Q3 2020 Q4 2020 Q1 2021 Q2 2021Consumer KPIs1
Customer accounts 3,374 3,342 3,306 3,264 3,235 3,196
Net adds (39) (32) (36) (42) (30) (38)
BB net adds (13) (10) (14) (23) (9) (18)
Account churn 1.84% 1.63% 1.81% 1.67% 1.45% 1.54%
ARPC $88.42 $87.22 $86.75 $87.57 $87.16 $85.65
Fiber Broadband (BB) KPIs1
Consumer Customers 1,215 1,223 1,229 1,238 1,251 1,263
Business Customers2 94 93 94 95 95 95
Consumer:
BB Net adds 10 8 6 9 13 12
BB Churn 1.94% 1.52% 1.80% 1.56% 1.41% 1.53%
BB ARPU $56.80 $56.92 $57.58 $59.72 $60.73 $63.10
Copper Broadband (BB) KPIs1
Consumer Customers 1,419 1,401 1,381 1,349 1,327 1,297
Business Customers2 170 164 157 152 147 143
Consumer:
BB Net adds (23) (18) (20) (32) (22) (30)
BB Churn 2.36% 2.03% 2.11% 1.96% 1.62% 1.67%
BB ARPU $41.15 $41.93 $42.16 $42.61 $43.23 $44.80
Note: Operating metrics for the operations located in the remaining 25 states after excluding the Northwest Operations. Certain figures may not tie to Q2 2021 earnings press release due to rounding.1. Due to changes in methodology during the second quarter of 2021, historical periods have been updated to reflect the comparable amounts.2. Excludes wholesale.
59
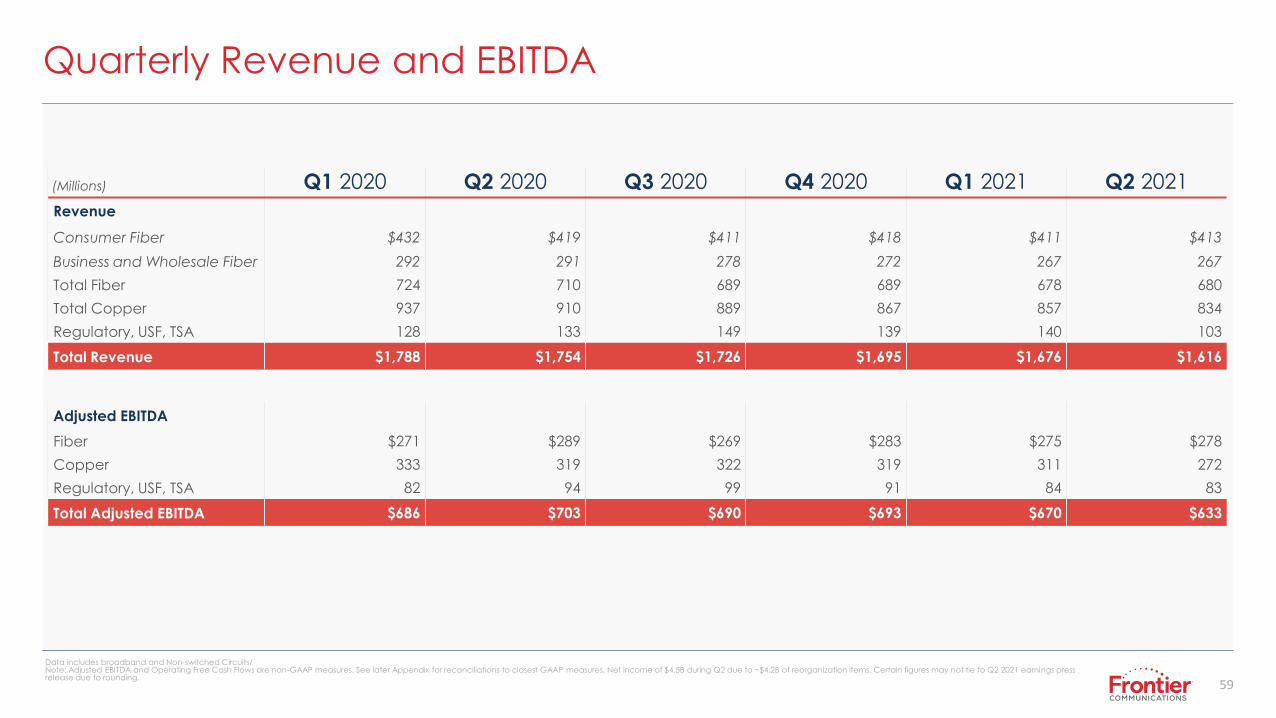
Quarterly Revenue and EBITDA
(Millions) Q1 2020 Q2 2020 Q3 2020 Q4 2020 Q1 2021 Q2 2021
Revenue
Consumer Fiber $432 $419 $411 $418 $411 $413
Business and Wholesale Fiber 292 291 278 272 267 267
Total Fiber 724 710 689 689 678 680
Total Copper 937 910 889 867 857 834
Regulatory, USF, TSA 128 133 149 139 140 103
Total Revenue $1,788 $1,754 $1,726 $1,695 $1,676 $1,616
Adjusted EBITDA
Fiber $271 $289 $269 $283 $275 $278
Copper 333 319 322 319 311 272
Regulatory, USF, TSA 82 94 99 91 84 83
Total Adjusted EBITDA $686 $703 $690 $693 $670 $633
Data includes broadband and Non-switched Circuits/Note: Adjusted EBITDA and Operating Free Cash Flows are non-GAAP measures. See later Appendix for reconciliations to closest GAAP measures. Net income of $4.5B during Q2 due to ~$4.2B of reorganization items. Certain figures may not tie to Q2 2021 earnings press release due to rounding.
60
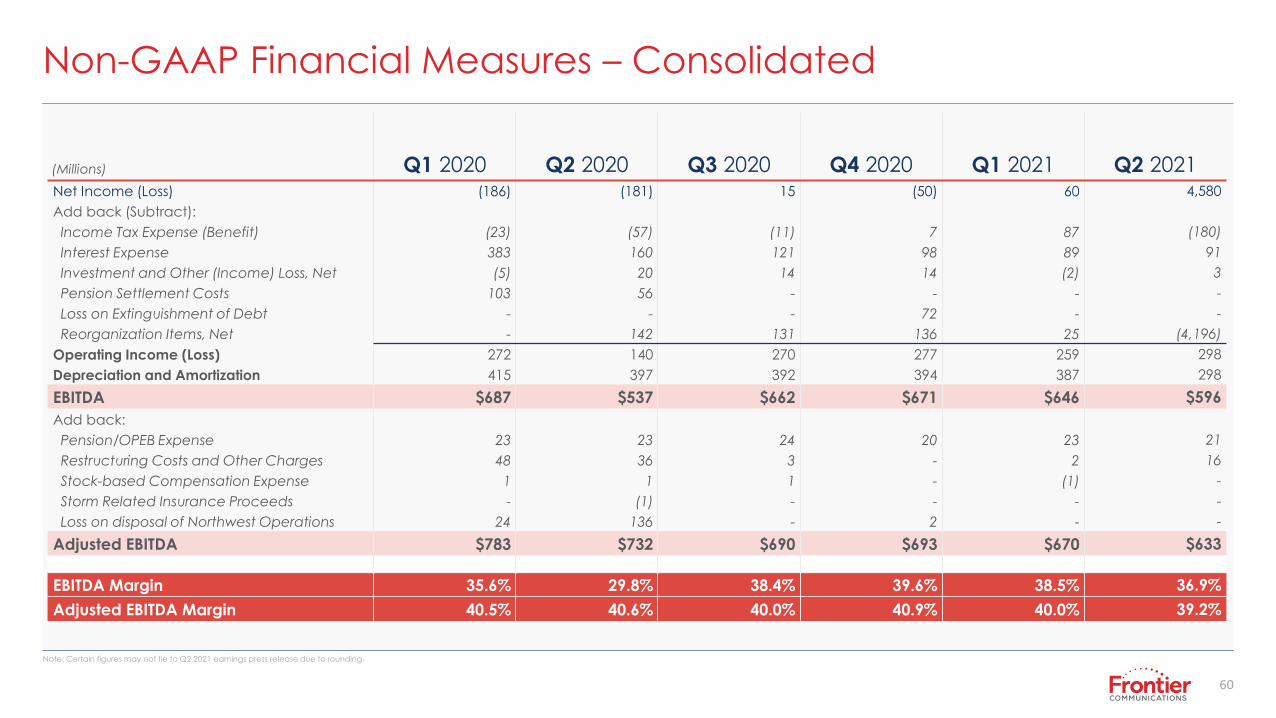
Non-GAAP Financial Measures – Consolidated
(Millions) Q1 2020 Q2 2020 Q3 2020 Q4 2020 Q1 2021 Q2 2021Net Income (Loss) (186) (181) 15 (50) 60 4,580
Add back (Subtract):
Income Tax Expense (Benefit) (23) (57) (11) 7 87 (180)
Interest Expense 383 160 121 98 89 91
Investment and Other (Income) Loss, Net (5) 20 14 14 (2) 3
Pension Settlement Costs 103 56 - - - -
Loss on Extinguishment of Debt - - - 72 - -
Reorganization Items, Net - 142 131 136 25 (4,196)
Operating Income (Loss) 272 140 270 277 259 298
Depreciation and Amortization 415 397 392 394 387 298
EBITDA $687 $537 $662 $671 $646 $596
Add back:
Pension/OPEB Expense 23 23 24 20 23 21
Restructuring Costs and Other Charges 48 36 3 - 2 16
Stock-based Compensation Expense 1 1 1 - (1) -
Storm Related Insurance Proceeds - (1) - - - -
Loss on disposal of Northwest Operations 24 136 - 2 - -
Adjusted EBITDA $783 $732 $690 $693 $670 $633
EBITDA Margin 35.6% 29.8% 38.4% 39.6% 38.5% 36.9%
Adjusted EBITDA Margin 40.5% 40.6% 40.0% 40.9% 40.0% 39.2%
Note: Certain figures may not tie to Q2 2021 earnings press release due to rounding.
61
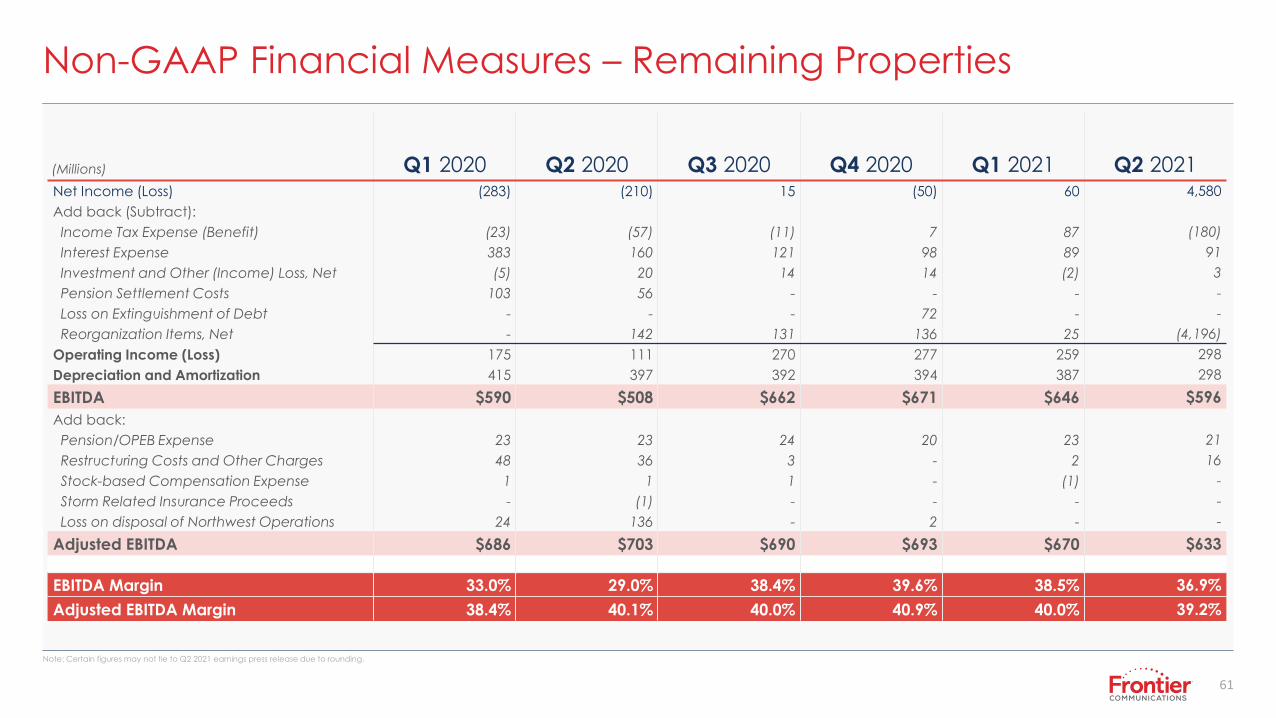
Non-GAAP Financial Measures – Remaining Properties
(Millions) Q1 2020 Q2 2020 Q3 2020 Q4 2020 Q1 2021 Q2 2021Net Income (Loss) (283) (210) 15 (50) 60 4,580
Add back (Subtract):
Income Tax Expense (Benefit) (23) (57) (11) 7 87 (180)
Interest Expense 383 160 121 98 89 91
Investment and Other (Income) Loss, Net (5) 20 14 14 (2) 3
Pension Settlement Costs 103 56 - - - -
Loss on Extinguishment of Debt - - - 72 - -
Reorganization Items, Net - 142 131 136 25 (4,196)
Operating Income (Loss) 175 111 270 277 259 298
Depreciation and Amortization 415 397 392 394 387 298
EBITDA $590 $508 $662 $671 $646 $596
Add back:
Pension/OPEB Expense 23 23 24 20 23 21
Restructuring Costs and Other Charges 48 36 3 - 2 16
Stock-based Compensation Expense 1 1 1 - (1) -
Storm Related Insurance Proceeds - (1) - - - -
Loss on disposal of Northwest Operations 24 136 - 2 - -
Adjusted EBITDA $686 $703 $690 $693 $670 $633
EBITDA Margin 33.0% 29.0% 38.4% 39.6% 38.5% 36.9%
Adjusted EBITDA Margin 38.4% 40.1% 40.0% 40.9% 40.0% 39.2%
Note: Certain figures may not tie to Q2 2021 earnings press release due to rounding.
62
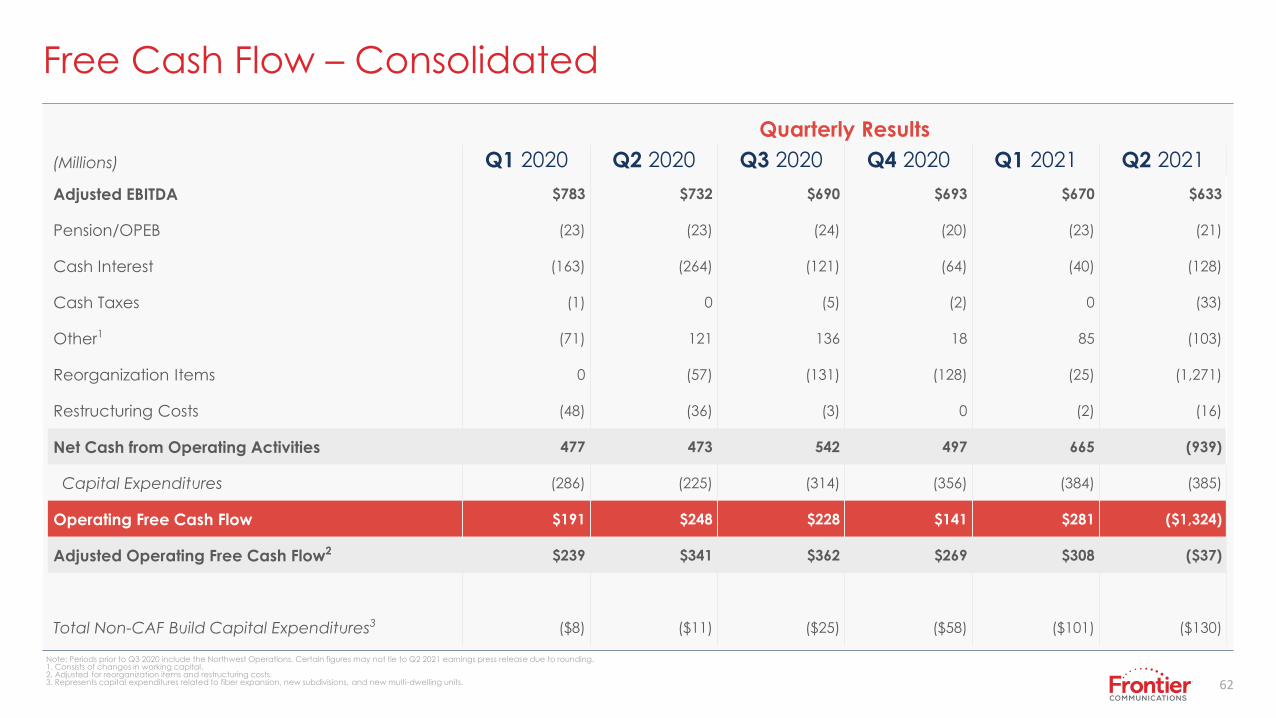
Free Cash Flow – Consolidated
Quarterly Results
(Millions) Q1 2020 Q2 2020 Q3 2020 Q4 2020 Q1 2021 Q2 2021
Adjusted EBITDA $783 $732 $690 $693 $670 $633
Pension/OPEB (23) (23) (24) (20) (23) (21)
Cash Interest (163) (264) (121) (64) (40) (128)
Cash Taxes (1) 0 (5) (2) 0 (33)
Other1 (71) 121 136 18 85 (103)
Reorganization Items 0 (57) (131) (128) (25) (1,271)
Restructuring Costs (48) (36) (3) 0 (2) (16)
Net Cash from Operating Activities 477 473 542 497 665 (939)
Capital Expenditures (286) (225) (314) (356) (384) (385)
Operating Free Cash Flow $191 $248 $228 $141 $281 ($1,324)
Adjusted Operating Free Cash Flow2 $239 $341 $362 $269 $308 ($37)
Total Non-CAF Build Capital Expenditures3 ($8) ($11) ($25) ($58) ($101) ($130)
Note: Periods prior to Q3 2020 include the Northwest Operations. Certain figures may not tie to Q2 2021 earnings press release due to rounding.1. Consists of changes in working capital.2. Adjusted for reorganization items and restructuring costs.3. Represents capital expenditures related to fiber expansion, new subdivisions, and new multi-dwelling units.

• • • • • • •