frontcover - british columbia · 32 birth-related statistics vital statistics information box top...
TRANSCRIPT

B I R T H - R E L A T E D S T A T I S T I C S 3 1
������������������� ���
1 2 3 4 5 6 7 8 9 0 1 2 3 4
5 6 7 8 9 0 1 2 3 4 5 6 7 8 9 0 1 2 3 4 5 6 7 8 9 0 1 2 3 4 5
6 7 8 9 0 1 2 3 4 5 6 7 8 9 0 1 2 3 4 5 6 7 8 9
0 1 2 3 4 5 6 7 8
9 0 1 2 3 4 5 6 7 8 9 0 1 2 3 4 5
6 7 8 9 0 1 2 3
4 5 6 7 8 9 0 1 2 3 4 5 6 7 8 9 0 1 2 3 4 5 6 7
8 9 0 1 2 3 4 5 6 7 8 9 0 1 2 3 4
5 6 7 8 9 0 1 2 3 4 5 6 7 8 9 0 1 2 3 4 5 6 7 8 9
0 1 2 3 4 5 6 7 8 9 0 1 2 3 4 5 6 7 8 9 0 1 2 3 4 5 6 7

3 2 B I R T H - R E L A T E D S T A T I S T I C S
Vital Statistics Information BoxVital Statistics Information Box
TOP 25 BABY NAMES IN 2004
Each year the British Columbia Vital Statistics Agency produces lists of the most chosen baby
names. The table below provides the top 25 names. Alternate spellings of names that sound
alike (such as Catherine, Katherine, and Kathryn) are not combined. The complete list for 2004,
as well as a list for several previous years can be found at http://www.vs.gov.bc.ca/babynames/
index.html. In 2004, 576 boysí names and 643 girlsí names were chosen for five or more
newborns.
Baby Boys Baby Girls
Rank Name Number Name Number
1 Ethan 332 Emma 281
2 Jacob 268 Emily 249
3 Matthew 259 Hannah 194
4 Ryan 234 Olivia 184
5 Joshua 227 Madison 162
6 Nathan 217 Sarah 162
7 Benjamin 192 Jessica 160
8 Alexander 191 Ella 153
9 Nicholas 186 Grace 142
10 Owen 181 Sophia 128
11 Daniel 166 Hailey 124
12 Liam 165 Isabella 122
13 Dylan 164 Abigail 117
14 Logan 158 Megan 115
15 Tyler 149 Samantha 114
16 Andrew 147 Lauren 109
17 Evan 147 Paige 107
18 Noah 147 Ava 103
19 William 147 Rachel 102
20 Samuel 145 Ashley 101
21 James 142 Chloe 100
22 Connor 140 Anna 99
23 Lucas 139 Taylor 94
24 Adam 126 Julia 93
25 Michael 126 Alyssa 91
3 2

B I R T H - R E L A T E D S T A T I S T I C S 3 33 3
�������
Statistics arising from birth events in British Columbia are presented in this section. These events are assigned toa Local Health Area (LHA) based on the usual residence of the mother. Information is included on birth weight,gestational age, mode of delivery, maternal and paternal age, birth order, birth kind, complications of pregnancyand delivery, and perinatal complications. Maps depicting the variations in rates or ratios by LHA accompanyseveral tables.
Statistics on birth events for 2004 are summarized below:
• There were 40,318 live births and 280 stillbirths inthe province to B.C. residents. The live birth rate was9.61 per 1,000 population (see Table 1); the stillbirthrate was 6.90 per 1,000 total births.
• The average age of B.C. women giving birth in 2004was 29.9 years.
• Out of the 40,318 live births in 2004, only 1,165(2.9%) were multiple births. There were 1,128 liveborn twins, and 37 triplets or more.
• Three fifths (60.0%) of live births in 2004 weredelivered spontaneously. Almost one third of all livebirths (29.7%) were delivered by cesarean section(11,973) and almost two thirds of these (63.5%) werefirst cesareans (7,608). The 2004 cesarean sectionrate was 296.96 per 1,000 live births.
• There were 20,711 males (51.4%) and 19,606 females(48.6%) born in 2004.
• Almost nine out of ten live births (35,493) weredelivered at term (from 37 to 41 weeks gestation)with normal birth weight (2,500 to 4,499 grams).These babies with "healthy" gestational ages andbirth weights accounted for 88.0% of live births in2004.
• There were 2,260 live births with low birth weight(less than 2,500 grams) and 3,080 pre-term (lessthan 37 weeks gestation) live births in 2004. A totalof 1,644 babies (4.1%) were both pre-term and lowbirth weight; in of this group, approximately one innine (175 births) had very low birth weight (lessthan 1,500 grams) and was extremely premature(less than 28 weeks gestation).
• Of live births to teenage mothers (less than 20 yearsof age), 91.6% had healthy birth weights, 6.0% hadlow and 2.5% had high birth weights. For mothersin the 40 or older age group, 90.4% of live births hadhealthy birth weights, 7.7% had low and 1.8% hadhigh birth weights.
• In 2004, there were 2,260 live births with low birthweight (less than 2,500 grams). The provincial lowbirth weight (LBW) live birth rate was 56.05 per1,000 live births.
3 3

3 4 B I R T H - R E L A T E D S T A T I S T I C S
TABLE 7BIRTHS BY AGE OF MOTHER AND LIVE BIRTHS BY BIRTH ORDER
BRITISH COLUMBIA, 2004
Age of Birth Order Total Live TotalMother 1 2 3 4 5 6 7 8 9+ N.S. Births Stillbirths Births
HIGHLIGHTS TO TABLE 7
Note: Birth order denotes the number of live births. Total includes unknown gender. Non-residents are excluded. N.S. – Notstated.
<13 1 - - - - - - - - - 1 - 113 - - - - - - - - - - - 1 114 3 - - - - - - - - - 3 - 315 50 - - - - - - - - - 50 1 5116 130 5 - - - - - - - - 135 1 13617 227 20 - - - - - - - - 247 3 25018 335 57 5 1 - - - - - 1 399 4 40319 464 115 10 1 - - - - - - 590 4 59420 653 194 33 3 - - - - - - 883 8 89121 633 265 55 10 1 1 - - - - 965 10 97522 750 358 92 16 4 - - - - - 1,220 11 1,23123 826 467 120 30 2 - - - - - 1,445 10 1,45524 836 555 155 31 8 1 - - - 2 1,588 12 1,60025 946 610 210 49 16 1 - - - - 1,832 16 1,84826 1,035 717 209 57 17 3 1 - - - 2,039 14 2,05327 1,105 735 253 64 17 6 3 1 - - 2,184 6 2,19028 1,116 865 280 77 19 10 5 - - - 2,372 15 2,38729 1,229 947 301 99 18 7 4 - - - 2,605 12 2,61730 1,192 995 347 105 21 11 3 1 1 1 2,677 9 2,68631 1,176 1,067 359 104 37 16 1 1 - 1 2,762 18 2,78032 1,099 1,058 367 117 20 10 6 2 1 - 2,680 10 2,69033 935 1,086 411 101 37 9 7 3 2 - 2,591 22 2,61334 860 989 395 113 41 9 8 - 4 - 2,419 15 2,43435 754 843 333 104 29 13 3 1 7 - 2,087 19 2,10636 523 728 311 91 33 13 4 3 3 - 1,709 12 1,72137 450 532 243 75 23 10 2 2 3 - 1,340 16 1,35638 320 465 192 56 22 15 2 5 6 1 1,084 7 1,09139 236 351 149 66 20 8 5 4 3 - 842 4 84640 191 237 96 46 17 12 11 3 6 - 619 7 62641 120 161 76 26 11 2 6 2 2 - 406 5 41142 59 94 42 24 8 2 4 3 4 - 240 2 24243 48 43 25 10 8 1 1 - 2 - 138 4 14244 23 23 15 6 1 3 2 2 5 - 80 1 8145+ 23 26 21 3 3 4 2 2 1 - 85 1 86N.S 1 - - - - - - - - - 1 - 1TOTAL 18,349 14,608 5,105 1,485 433 167 80 35 50 6 40,318 280 40,598
• Of the 40,318 live births in 2004, almost half (45.5%) were first born (18,349), more than a third (36.2%) weresecond born (14,608), and about one in five (18.2%) was third born or greater (7,355).
• The average age of B.C. women giving birth in 2004 was 29.9 years. The average maternal age of first live birthswas 28.4 years, compared to 30.6 years for mothers of second live births and 32.0 years for mothers havingtheir third or more live birth.
• In 2004, there were 1,425 live births to mothers younger than 20 years old, resulting in a teenage mother rate of35.34 per 1,000 live births.
• There were 8,630 live births to mothers aged 35 or older in 2004. The elderly gravida rate has increased inrecent years (see Figure 6); the 2004 rate was 214.05 per 1,000 live births.
• There were 280 stillbirths in 2004. Including stillbirths, there were 40,598 total births in 2004 to B.C. residents.The 2004 stillbirth rate was 6.90 per 1,000 total births.

B I R T H - R E L A T E D S T A T I S T I C S 3 5
HIGHLIGHTS TO TABLE 8
• Out of 100 live births in 2004, approximately:- 4 were to teenage mothers, less than 20 years old (1,425)- 42 were to mothers 20 to 29 years old (17,133)- 50 were to mothers 30 to 39 years old (20,191)- 4 were to mothers 40 years of age or older (1,568)
• Out of 100 live births in 2004, approximately:- 1 was to a teenage father, less than 20 years old (387)- 27 were to fathers 20 to 29 years old (10,822)- 53 were to fathers 30 to 39 years old (21,191)- 13 were to fathers 40 years of age or older (5,372)- 6 did not include father's age (2,546)
• There were 308 live births (0.8%) where both parents were teenagers (less than 20 years of age) and 835 whereonly one of the parents was a teenager (2.1%).
• There were 993 live births (2.5%) where both parents were 40 years of age or older and 4,864 births where onlyone of the parents was 40 years or older (12.1%).
• One quarter (25.4%) of the live births in 2004 were reported as out-of-wedlock (10,232). The number of out-of-wedlock births may actually be higher since births where it was not known if the parents were married to eachother have not been included.
TABLE 8TOTAL LIVE BIRTHS BY AGE OF FATHER,AGE OF MOTHER AND OUT-OF-WEDLOCK
BRITISH COLUMBIA, 2004
Age of Mother (in Years)Age of Father <15 15–19 20–24 25–29 30–34 35–39 40–44 45+ N.S. Total Percent
Note: Total percentage may not add up to 100 due to rounding. Total includes unknown gender.Out-of-Wedlock - Indicates mother and father of child were not legally married to each other and excludes1,823 cases where marital status was not stated.Non-residents are excluded. N.S. – Not stated.
< 15 - 3 - 1 - - - - - 4 -15-19 1 304 74 3 - 1 - - - 383 0.920-24 - 494 1,816 445 84 21 1 - - 2,861 7.125-29 - 186 2,192 4,300 1,112 156 15 - - 7,961 19.730-34 - 53 807 3,979 6,202 1,128 105 2 - 12,276 30.435-39 - 17 270 1,218 3,894 3,154 354 8 - 8,915 22.140-44 - 6 72 341 1,067 1,728 572 14 - 3,800 9.4
45+ - - 39 133 367 626 355 52 - 1,572 3.9 N.S. 3 358 831 612 403 248 81 9 1 2,546 6.3
TOTAL 4 1,421 6,101 11,032 13,129 7,062 1,483 85 1 40,318Percent 0.0 3.5 15.1 27.4 32.6 17.5 3.7 0.2 0.0 100.0
Out-of-Wedlock 4 1,172 3,181 2,580 1,885 1,095 296 19 - 10,232

3 6 B I R T H - R E L A T E D S T A T I S T I C S
HIGHLIGHTS TO TABLE 9
• Out of the 40,318 live births in 2004, only 1,165 (2.9%) were multiple births.
• Of all live births in 2004:- almost all (97.1%) were singletons (39,153)- one baby in 36 live births was a twin (1,128 twins)- one baby in 1,090 live births was from a set of three or more (37 triplets or greater)
• Older mothers, 35 years of age or older, had the highest proportion of multiple births; 361 births or 4.2% of livebirths to these mothers were multiple births. The 776 multiple births to mothers aged 20 to 34 years accountedfor 2.6% of births to mothers in this age group. The lowest proportion of multiple births was to teenagemothers; the 28 twins born to teens accounted for 2.0% of births to mothers in this age group.
TABLE 9LIVE BIRTHS BY AGE OF MOTHER AND KIND OF BIRTH
BRITISH COLUMBIA, 2004
Age of Kind of BirthMother Single Twin Triplets+ Total
< 15 4 - - 4
15-19 1,393 28 - 1,421
20-24 5,957 138 6 6,101
25-29 10,779 253 - 11,032
30-34 12,750 360 19 13,129
35-39 6,772 284 6 7,062
40-44 1,422 58 3 1,483
45 + 75 7 3 85
N.S. 1 - - 1
TOTAL 39,153 1,128 37 40,318
Note: For the multiple births which include stillbirths, only live births areshown in this table.Triplets+ : included in this column are the livebirths from multiple births of three or more. Total includes unknowngender. Non-residents are excluded. N.S.- Not stated.

B I R T H - R E L A T E D S T A T I S T I C S 3 7
Vital Statistics Information Box
MOST POPULAR BABY NAMES IN BRITISH COLUMBIA IN THE 20TH CENTURY
Robert, David, and Michael were the most popular names for boys born in British Columbia in the
20th century (1901-2001); Jennifer, Mary, and Margaret were the most popular names for girls. Girls had
a wider selection of names; nearly 170 different names for girls were registered over the last century
(based on names chosen for 10 or more babies), compared to just over 100 names for boys. Over the
last 25 years, the number of new names has increased substantially and the turnover among popular
names has accelerated. Historically, there has been less continuity among names for girls than among
names for boys, that is, fashionable names for girls changed more frequently over time. In 2004, eight
names, Andrew, Daniel, James, Joshua, Matthew, Michael, Ryan, and William, appeared that were also
on the most chosen list of 20th century names for boys, and the girls' list included four popular names
from the last century, Ashley, Emily, Jessica, and Sarah.
Baby Boys Baby GirlsRank Name Number Name Number
1 Robert 38,296 Jennifer 14,185
2 David 34,725 Mary 13,578
3 Michael 32,852 Margaret 11,010
4 John 32,751 Patricia 10,812
5 James 29,961 Linda 9,804
6 William 27,167 Sarah 9,724
7 Christopher 17,225 Susan 9,348
8 Richard 16,647 Barbara 9,286
9 Daniel 14,840 Jessica 9,006
10 Matthew 12,534 Karen 8,986
11 Ryan 12,325 Sandra 8,364
12 Kenneth 12,166 Nicole 8,198
13 Donald 11,855 Michelle 8,031
14 Kevin 10,744 Lisa 7,922
15 Andrew 9,733 Amanda 7,362
16 Brian 9,667 Elizabeth 6,967
17 Ronald 9,494 Ashley 6,142
18 Jason 9,358 Donna 6,135
19 Thomas 9,294 Sharon 6,053
20 Steven 8,743 Heather 6,018
21 George 8,594 Kathleen 5,807
22 Douglas 8,451 Dorothy 5,149
23 Gordon 8,405 Deborah 4,992
24 Mark 7,715 Emily 4,955
25 Joshua 6,821 Carol 4,925
Table prepared by P. A. Dunae, T. Blogg, and A. Speed, Malaspina University-College.

3 8 B I R T H - R E L A T E D S T A T I S T I C SL
IVE
BIR
TH
FE
RT
ILIT
Y R
AT
ES
BY
LO
CA
L H
EA
LT
H A
RE
A, B
RIT
ISH
CO
LU
MB
IA, 1
999–
2003
AN
D 2
004
Tab
le
10
1999–2003 Teenage Fertility Rate (15–19 yrs) 2004 ASFR1 TFR2
Local Health Area Observed ASFR1 (p) 15–19 20–24 25–29 30–34 35–39 40–44 Rate (p)001 Fernie 40 13.84 15.65 42.55 104.71 68.35 31.48 3.79 1,332.71002 Cranbrook 115 22.74 * 18.04 53.87 70.49 72.08 23.34 0.95 1,193.84 *003 Kimberley 19 13.65 12.10 32.85 58.82 80.19 43.33 5.14 1,162.15004 Windermere 23 13.11 12.12 33.59 100.75 55.56 25.86 6.55 1,172.14005 Creston 97 44.45 * 21.74 84.47 123.40 69.09 26.16 4.41 1,646.36006 Kootenay Lake 7 10.84 30.93 60.61 156.25 123.60 50.42 7.94 2,148.68 *007 Nelson 31 6.44 * 2.24 40.33 113.40 118.04 42.05 8.33 1,621.99 *009 Castlegar 19 7.45 * - 30.02 67.23 77.56 30.08 - 1,024.42 *010 Arrow Lakes 8 9.78 13.25 63.95 65.69 77.52 15.87 5.03 1,206.55011 Trail 30 7.30 * 4.13 36.68 81.53 59.79 33.07 7.23 1,112.20 *012 Grand Forks 24 14.55 26.23 53.51 139.39 52.94 61.95 10.84 1,724.32013 Kettle Valley 13 20.93 - 68.97 176.47 154.76 11.63 7.58 2,097.01014 Southern Okanagan 34 13.47 11.24 52.04 123.81 70.00 25.70 3.36 1,430.74015 Penticton 117 18.27 * 7.70 40.46 81.36 74.42 25.10 3.06 1,160.55 *016 Keremeos 13 20.00 9.52 41.67 114.58 30.61 51.47 6.02 1,269.40017 Princeton 7 9.59 19.87 46.88 71.43 44.44 29.63 - 1,061.23018 Golden 28 20.74 * 4.33 52.81 64.36 45.98 26.87 5.41 998.69 *019 Revelstoke 27 17.43 - 61.86 148.15 84.68 34.68 10.42 1,698.90020 Salmon Arm 50 8.79 * 10.68 41.60 63.69 83.44 28.39 6.66 1,172.32 *021 Armstrong - Spallumcheen 15 7.15 * 5.38 35.71 124.00 78.05 19.61 4.41 1,335.76022 Vernon 125 11.49 13.88 43.46 104.25 86.66 41.29 3.61 1,465.74023 Central Okanagan 313 12.15 9.28 40.35 84.13 90.12 32.85 5.57 1,311.58 *024 Kamloops 259 14.06 11.59 48.92 88.03 77.43 33.33 5.84 1,325.69025 100 Mile House 41 14.27 10.85 43.56 182.86 70.92 26.87 4.88 1,699.71026 North Thompson 21 20.19 25.13 65.22 118.64 70.97 8.62 4.90 1,467.39027 Cariboo - Chilcotin 159 27.25 * 18.00 56.60 87.70 90.29 20.11 7.88 1,402.89028 Quesnel 94 18.02 * 18.00 66.27 95.17 60.48 27.37 1.88 1,345.87029 Lillooet 39 38.77 * 13.45 75.27 145.04 67.16 34.48 4.33 1,698.68030 South Cariboo 27 18.23 32.73 63.12 61.11 43.72 20.49 3.40 1,122.85031 Merritt 47 20.12 * 16.53 62.34 104.17 71.62 26.00 3.94 1,423.04032 Hope 50 31.08 * 32.47 46.36 100.59 109.38 30.61 2.79 1,610.99033 Chilliwack 299 22.72 * 23.85 73.74 127.13 112.25 34.74 5.65 1,886.84 *034 Abbotsford 369 17.02 * 9.98 72.84 135.28 98.60 31.84 7.16 1,778.51 *035 Langley 211 10.03 * 6.59 41.61 107.19 119.81 47.50 7.54 1,651.11 *037 Delta 109 5.86 * 2.61 34.77 97.32 113.73 50.13 10.28 1,544.28 *038 Richmond 100 3.57 * 3.29 13.77 55.21 96.53 55.60 11.53 1,179.60 *040 New Westminster 125 18.76 * 7.89 45.64 82.33 74.25 47.37 10.30 1,338.88041 Burnaby 234 7.59 * 5.57 21.75 66.26 92.45 55.21 9.48 1,253.54 *042 Maple Ridge 150 10.35 * 6.20 35.22 111.64 130.21 42.25 6.95 1,662.40 *043 Coquitlam 245 7.15 * 6.09 25.29 76.30 102.11 53.52 7.62 1,354.67044 North Vancouver 91 4.34 * 1.91 18.94 53.49 122.37 75.84 12.49 1,425.20045 West Vancouver - Bowen Is. 15 1.86 * 1.77 5.86 13.37 117.99 74.16 18.10 1,156.28 *046 Sunshine Coast 35 7.33 * 5.81 24.64 61.71 83.60 42.42 1.81 1,099.94 *047 Powell River 47 13.39 17.11 43.96 80.49 78.24 25.00 3.56 1,241.79048 Howe Sound 82 18.66 * 11.33 51.09 73.40 86.99 64.21 13.60 1,503.07049 Bella Coola Valley 30 41.49 * 65.79 142.86 131.58 88.00 16.13 7.14 2,257.49 *050 Queen Charlotte 22 27.53 * 32.68 73.53 111.94 119.27 37.82 - 1,876.15 *051 Snow Country 2 16.26 66.67 34.48 62.50 24.39 - - 940.20052 Prince Rupert 128 39.14 * 46.06 43.33 90.74 67.37 31.34 4.13 1,414.84053 Upper Skeena 54 46.43 * 58.14 108.43 70.18 59.41 30.19 4.22 1,652.81054 Smithers 75 20.37 * 21.62 94.86 141.45 68.39 28.45 11.49 1,831.32 *055 Burns Lake 44 27.83 * 28.75 83.89 111.65 95.44 30.41 6.62 1,783.80 *056 Nechako 98 27.83 * 29.08 100.95 125.26 86.12 24.45 4.18 1,850.19 *057 Prince George 377 18.56 * 17.78 58.74 93.49 74.00 28.53 3.70 1,381.18059 Peace River South 132 26.68 * 14.99 99.55 114.32 53.05 18.60 0.85 1,506.86060 Peace River North 203 33.40 * 22.45 112.43 171.88 93.84 31.90 7.66 2,200.75 *061 Greater Victoria 317 10.86 * 6.99 31.56 58.36 79.87 45.43 9.76 1,159.86 *062 Sooke 114 11.75 10.13 41.39 107.40 133.80 40.23 8.36 1,706.56 *063 Saanich 70 7.31 * 10.85 24.55 63.40 108.34 50.16 5.60 1,314.49064 Gulf Islands 15 6.82 * 2.30 23.06 49.18 98.98 41.06 10.46 1,125.16 *065 Cowichan 215 22.14 * 18.07 61.53 95.63 109.09 28.16 7.96 1,602.23 *066 Lake Cowichan 22 17.83 21.83 54.62 101.45 80.54 17.94 3.61 1,399.95067 Ladysmith 64 22.60 * 22.18 47.62 131.66 91.33 26.22 3.11 1,610.65068 Nanaimo 271 16.30 * 11.09 50.27 81.28 84.34 31.66 5.90 1,322.69069 Qualicum 65 11.67 5.98 39.52 63.93 80.90 28.52 6.31 1,125.79 *070 Alberni 163 29.78 * 29.38 75.32 103.18 68.02 29.20 3.80 1,544.59071 Courtenay 170 15.70 * 18.37 35.91 96.19 84.38 35.84 6.38 1,385.40072 Campbell River 140 18.57 * 17.25 51.66 115.18 69.91 20.63 2.28 1,384.54075 Mission 133 17.96 * 15.66 69.66 121.95 119.68 33.17 5.92 1,830.13 *076 Agassiz - Harrison 36 26.14 * 29.80 79.55 136.36 140.70 51.72 9.90 2,240.20 *077 Summerland 11 5.17 * 7.61 18.26 60.15 84.44 57.63 5.84 1,169.69078 Enderby 32 21.86 * 30.65 52.12 108.84 70.18 20.83 6.08 1,443.50080 Kitimat 42 15.92 9.62 56.91 121.34 64.52 22.22 5.79 1,401.97081 Fort Nelson 42 31.16 * 29.85 107.91 116.73 83.59 43.64 4.05 1,928.86 *083 Central Coast 15 42.61 * 50.63 76.92 214.29 61.54 14.49 - 2,089.36084 Vancouver Island West 20 38.46 * 60.87 104.65 125.00 108.11 33.56 6.99 2,195.89 *085 Vancouver Island North 119 40.30 * 33.22 98.21 143.77 47.62 20.83 8.13 1,758.95 *087 Stikine 8 38.46 34.48 45.45 - 20.41 - - 501.73 *088 Terrace 123 28.30 * 25.44 76.07 118.12 68.75 29.41 5.25 1,615.26 *092 Nisgaía 28 69.14 * 81.08 86.96 117.65 98.36 37.04 - 2,105.41094 Telegraph Creek 7 58.82 * - 50.00 117.65 64.52 57.14 27.03 1,581.67161 Vancouver - City Centre 25 4.36 * 2.25 11.13 22.36 40.57 33.93 13.55 618.90 *162 Vancouver - Downtown E.side 95 21.70 * 21.79 50.77 59.24 56.61 36.02 9.61 1,170.17 *163 Vancouver - North East 106 7.86 * 3.95 30.79 70.07 93.06 57.76 12.29 1,339.54164 Vancouver - Westside 27 1.46 * 0.53 4.99 22.77 77.02 70.65 13.91 949.30 *165 Vancouver - Midtown 128 12.65 8.91 34.67 69.38 83.50 50.31 11.43 1,290.98 *166 Vancouver - South 117 5.65 * 3.42 23.78 67.59 87.27 61.41 13.55 1,285.03 *201 Surrey 726 14.45 * 12.01 75.92 149.62 99.25 44.12 7.77 1,943.48 *202 South Surrey/White Rock 33 3.11 * 0.46 17.89 75.43 142.39 72.19 10.05 1,592.03 *
PROVINCIAL TOTAL 8,670 12.90 10.47 42.13 82.49 88.95 44.46 8.26 1,383.84Notes for this table follow highlight notes.

B I R T H - R E L A T E D S T A T I S T I C S 3 9
N
Statistically Significant
QUINTILE (Rate)
5 (27.830 - 69.136)
2 (7.857 - 13.836)
1 (1.462 - 7.589)
4 (18.662 - 27.534)
3 (14.059 - 18.565)
Inset 150 kms0
300 kms0 100 200
see inset 2
10 kms0Inset 2
see inset 1
Note: ASFR - Age-Specific Rate - Live births per 1,000 women age 15 to 19 years. Refer to Figure 1 to clarify geographicallocation of Local Health Area
FIGURE 29LIVE BIRTH TEENAGE FERTILITY RATES BY LOCAL HEALTH AREA
BRITISH COLUMBIA, 1999-2003

4 0 B I R T H - R E L A T E D S T A T I S T I C S
HIGHLIGHTS TO TABLE 10/FIGURE 29
• The Province's 2004 Total Fertility Rate (TFR) was 1,383.84 births per 1,000 women of childbearing age (15 to44 years of age). See the Glossary for a definition of total fertility rates.
• There were 23 Local Health Areas (LHAs) with statistically significant TFRs that were higher than theProvincial TFR in 2004. The five highest were:049 Bella Coola Valley 2,257.49076 Agassiz - Harrison 2,240.20060 Peace River North 2,200.75084 Vancouver Island West 2,195.89006 Kootenay Lake 2,148.68
• There were 20 LHAs with statistically significant TFRs that were lower than the Provincial TFR in 2004. Thefive lowest were:087 Stikine 501.73161 Vancouver - City Centre 618.90164 Vancouver - Westside 949.30018 Golden 998.69009 Castlegar 1,024.42
• There were 10.47 live births per 1,000 young women in the 15-19 year age group in 2004. This age-specificfertility rate for 2004 was lower than the 1999-2003 teenage fertility rate of 12.90.
• For the 1999-2003 period, there were 41 LHAs with statistically significant teenage fertility rates that werehigher than the provincial teenage fertility rate. The five LHAs with the highest statistically significant rates(number of births in parentheses) were:092 Nisga'a (28) 69.14094 Telegraph Creek (7) 58.82053 Upper Skeena (54) 46.43005 Creston (97) 44.45083 Central Coast (15) 42.61
• There were 23 LHAs in the 1999-2003 period with statistically significant teenage fertility rates that were lowerthan the provincial teenage fertility rate. The five LHAs with the lowest statistically significant rates (numberof births in parentheses) were:164 Vancouver - Westside (27) 1.46045 West Vancouver-Bowen Island (15) 1.86202 South Surrey/White Rock (33) 3.11038 Richmond (100) 3.57044 North Vancouver (91) 4.34
Notes for Table 10
Note: 1Age-Specific Fertility Rate (ASFR): Live births per 1,000 women in each specific age group of childbearing age.2Total Fertility Rate (TFR): Sum of age-specific (15 to 44 years) fertility rates multiplied by the number of years in each age group (seeGlossary for definition).*Statistical testing indicates that fertility rate is significantly different from the average rate (p<0.05, twotailed). Non-residents are excluded.

B I R T H - R E L A T E D S T A T I S T I C S 4 1
HIGHLIGHTS TO TABLE 11
• Three fifths (60.0%) of live births in 2004 were delivered spontaneously: 59.7% (24,087) were vertex and 0.3%(118) were breech. One in 27 births required the use of forceps (1,510 births) and one in 15 used vacuum (2,630births).
• Almost one third of all live births (29.7%) were delivered by cesarean section (11,973) and almost two thirds ofthese (63.5%) were first cesareans (7,608). The 2004 cesarean section rate was 296.96 per 1,000 live births.
• Among teenage mothers (less than 20 years of age), one in five live births (19.4%) were delivered by cesareansection (277 births). Of these, 9.0% (25) were repeat cesarean sections.
• About one in four live births to mothers aged 20 to 34 (27.8%) were delivered by cesarean section (8,411). Ofthese deliveries, 34.4% (2,892) were repeat C-sections.
• For mothers aged 35 or older, more than one in three live births (38.1%) were delivered by cesarean section(3,285). Of these, 44.1% (1,448) were repeat C-sections.
TABLE 11LIVE BIRTHS BY MODE OF DELIVERY AND AGE OF MOTHER
BRITISH COLUMBIA, 2004
Age of Mother (in Years)Mode of Delivery <15 15–19 20–24 25–29 30–34 35–39 40–44 45+ N.S. Total Percent
Spontaneous vertex 3 985 4,010 6,870 7,630 3,841 715 32 1 24,087 59.7Spontaneous breech - 4 11 33 36 30 4 - - 118 0.3Forceps - 52 214 440 543 221 39 1 - 1,510 3.7Vacuum - 104 464 778 822 380 78 4 - 2,630 6.5First cesarean 1 251 1,110 1,989 2,420 1,429 376 32 - 7,608 18.9Repeat cesarean - 25 292 922 1,678 1,161 271 16 - 4,365 10.8N.S. - - - - - - - - - - -TOTAL 4 1,421 6,101 11,032 13,129 7,062 1,483 85 1 40,318 100.0Percent 0.0 3.5 15.1 27.4 32.6 17.5 3.7 0.2 0.0 100.0
Note: Breech presentations may be coded to forceps, vacuum, first cesarean or repeat cesarean mode of delivery, as well as sponta-neous breech. Total percentage may not add up to 100 due to rounding. Total includes unknown gender. Non-residents areexcluded. N.S. - Not stated.

4 2 B I R T H - R E L A T E D S T A T I S T I C S
Vital Statistics Information BoxVital Statistics Information Box
PLACE OF BIRTH FOR MIDWIFE ASSISTED BIRTHS
BRITISH COLUMBIA, 1999-2004
The College of Midwives of British Columbia was established in 1995 and the first midwives were
registered to practice in 1998. The Vital Statistics Agency implemented procedures to identify births
delivered by registered midwives in 1998, and, by 1999, could identify all midwife assisted births. The
table below shows the place of birth for midwife assisted births in the province from 1999 to 2004.
Note: *Other and unknown includes birthing clinics.
1999 2000 2001 2002 2003 2004
Place of Birth Number % Number % Number % Number % Number % Number %
Hospital 611 63.4 615 62.5 769 65.6 641 64.3 698 68.6 699 69.0
Home 348 36.1 357 36.3 367 31.3 303 30.4 287 28.2 284 28.0
Other and unknown* 4 0.4 12 1.2 37 3.2 53 5.3 32 3.1 30 3.0
Midwife Assisted Births 963 100.0 984 100.0 1,173 100.0 997 100.0 1,017 100.0 1,013 100.0
Percent of Total Births 2.3 2.4 2.9 2.5 2.5 2.5
Delivered by
Registered Midwives

B I R T H - R E L A T E D S T A T I S T I C S 4 3
Vital Statistics Information BoxVital Statistics Information Box
Vital Statistics Information Box
Area Province/Country Births DeathsCanada Total 26,596 19,986
British Columbia 18,633 7,526Alberta 2,252 2,907Saskatchewan 851 3,890Ontario 2,530 2,015Manitoba 829 2,156Quebec 696 657Nova Scotia 269 380New Brunswick 152 231Newfoundland 223 123Yukon 76 21Prince Edward Island 35 56Northwest Territories 46 14Nunavut 1 -Unknown Province 3 10
North and Central America Total 1,152 803United States 713 721Other North and 439 82Central American Countries
South America Total 248 60
Europe Total 1,981 6,137England 486 1,940Germany 184 596Scotland 89 639Other United Kingdom 171 377Poland 118 277Scandinavian Countries 51 340Former USSR 119 186Italy 28 287Former Yugoslavia 65 66Other European Countries 670 1,429
Asia and the Middle East Total 8,946 2,195India 2,792 522China 1,728 923Philippines 1,129 153Vietnam 624 61Hong Kong 499 138Korea 441 71Japan 328 58Taiwan 331 25Other Asian and 1,074 244Middle Eastern Countries
Africa Total 551 162
Oceania Total 477 158Fiji 282 97Australia 183 61Other Oceanic Countries 12 -
Unknown 367 151
Total 40,318 29,652
Note: Non-residents are excluded.
BIRTHS BY MOTHER’S COUNTRY OF BIRTH AND DEATHS BY DECEDENT’S COUNTRY OF BIRTHBRITISH COLUMBIA, 2004

4 4 B I R T H - R E L A T E D S T A T I S T I C SSpontaneous Cesarean Total Live BirthsLocal Health Area Vertex First Repeat Total Ratio (p) Percent Other N.S. Number Rate
001 Fernie 70 28 14 42 1.16 34.4 10 - 122 7.69002 Cranbrook 124 45 26 71 1.16 34.3 12 - 207 7.90003 Kimberley 33 13 6 19 1.12 33.3 5 - 57 6.37004 Windermere 44 13 7 20 0.92 27.4 9 - 73 7.46005 Creston 77 11 10 21 0.70 20.8 3 - 101 7.88006 Kootenay Lake 30 5 3 8 0.69 20.5 1 - 39 10.92007 Nelson 177 28 14 42 0.62 * 18.3 10 - 229 9.25009 Castlegar 51 14 10 24 1.01 30.0 5 - 80 5.94010 Arrow Lakes 26 7 2 9 0.87 25.7 - - 35 6.77011 Trail 71 18 18 36 1.01 30.0 13 - 120 5.97012 Grand Forks 50 13 8 21 0.96 28.4 3 - 74 8.16013 Kettle Valley 27 1 3 4 0.42 12.5 1 - 32 8.97014 Southern Okanagan 78 25 10 35 0.92 27.3 15 - 128 6.77015 Penticton 180 39 22 61 0.76 * 22.5 30 - 271 6.60016 Keremeos 21 6 2 8 0.93 27.6 - - 29 5.82017 Princeton 19 3 - 3 0.44 13.0 1 - 23 4.78018 Golden 30 10 7 17 1.08 32.1 6 - 53 6.80019 Revelstoke 45 13 10 23 0.98 29.1 11 - 79 9.27020 Salmon Arm 122 44 32 76 1.21 36.0 13 - 211 6.37021 Armstrong - Spallumcheen 46 14 10 24 1.11 32.9 3 - 73 7.21022 Vernon 317 86 62 148 0.95 28.2 59 - 524 8.56023 Central Okanagan 798 276 151 427 1.07 31.7 124 - 1,349 8.30024 Kamloops 556 192 117 309 1.14 * 33.9 47 - 912 8.74025 100 Mile House 68 15 11 26 0.81 24.1 14 - 108 7.31026 North Thompson 30 3 6 9 0.67 20.0 6 - 45 8.58027 Cariboo - Chilcotin 139 62 47 109 1.32 * 39.2 30 - 278 9.55028 Quesnel 136 45 22 67 1.00 29.8 22 - 225 8.73029 Lillooet 32 7 5 12 0.79 23.5 7 - 51 10.56030 South Cariboo 41 6 3 9 0.56 16.7 4 - 54 6.85031 Merritt 71 15 13 28 0.90 26.7 6 - 105 9.05032 Hope 52 6 11 17 0.78 23.3 4 - 73 8.34033 Chilliwack 570 153 109 262 0.96 28.5 87 - 919 12.00034 Abbotsford 945 265 181 446 0.95 28.2 191 - 1,582 12.42035 Langley 777 199 123 322 0.88 * 26.2 130 - 1,229 10.24037 Delta 517 189 123 312 1.10 32.6 129 - 958 9.36038 Richmond 896 291 184 475 1.03 30.6 182 - 1,553 8.99040 New Westminster 348 132 51 183 0.99 29.4 92 - 623 10.69041 Burnaby 1,232 374 211 585 0.97 28.7 218 - 2,035 10.03042 Maple Ridge 523 194 111 305 1.08 32.0 125 - 953 11.00043 Coquitlam 1,220 385 222 607 0.99 29.5 229 - 2,056 9.96044 North Vancouver 832 252 135 387 0.97 28.7 130 - 1,349 9.98045 West Vancouver - Bowen Is. 170 49 34 83 1.00 29.7 26 - 279 5.46046 Sunshine Coast 111 23 8 31 0.67 * 19.9 14 - 156 5.64047 Powell River 73 25 23 48 1.21 35.8 13 - 134 6.56048 Howe Sound 235 93 48 141 1.16 34.5 33 - 409 12.92049 Bella Coola Valley 33 5 6 11 0.79 23.4 3 - 47 14.03050 Queen Charlotte 39 12 10 22 1.14 33.8 4 - 65 12.45051 Snow Country 2 1 1 2 1.35 40.0 1 - 5 6.23052 Prince Rupert 117 23 18 41 0.80 23.7 15 - 173 10.38053 Upper Skeena 39 14 5 19 0.91 27.1 12 - 70 12.21054 Smithers 140 33 26 59 0.90 26.7 22 - 221 12.28055 Burns Lake 57 15 10 25 0.93 27.5 9 - 91 11.64056 Nechako 149 34 26 60 0.92 27.3 11 - 220 12.43057 Prince George 655 196 114 310 1.01 30.0 69 - 1,034 10.09059 Peace River South 197 30 25 55 0.68 * 20.2 20 - 272 9.82060 Peace River North 332 73 58 131 0.89 26.4 34 - 497 15.55061 Greater Victoria 1,049 439 173 612 1.16 * 34.4 116 - 1,777 8.38062 Sooke 340 121 85 206 1.18 * 34.9 44 - 590 10.27063 Saanich 246 76 47 123 1.05 31.3 24 - 393 6.30064 Gulf Islands 54 12 6 18 0.81 24.0 3 - 75 5.13065 Cowichan 362 83 35 118 0.79 * 23.6 21 - 501 9.26066 Lake Cowichan 30 15 5 20 1.35 40.0 - - 50 7.89067 Ladysmith 97 24 14 38 0.93 27.7 2 - 137 8.09068 Nanaimo 517 153 91 244 1.00 29.6 62 - 823 8.72069 Qualicum 143 36 22 58 0.88 26.0 22 - 223 5.34070 Alberni 178 47 32 79 0.91 27.1 35 - 292 9.08071 Courtenay 297 78 45 123 0.89 26.5 45 - 465 7.74072 Campbell River 180 86 42 128 1.32 * 39.3 18 - 326 8.12075 Mission 273 83 36 119 0.95 28.3 29 - 421 10.82076 Agassiz - Harrison 72 12 10 22 0.74 22.0 6 - 100 11.61077 Summerland 46 9 9 18 0.92 27.3 2 - 66 5.39078 Enderby 39 11 5 16 0.91 27.1 4 - 59 7.82080 Kitimat 49 27 14 41 1.48 * 44.1 3 - 93 8.04081 Fort Nelson 52 29 15 44 1.36 * 40.4 13 - 109 16.60083 Central Coast 15 5 2 7 1.07 31.8 - - 22 13.00084 Vancouver Island West 22 7 5 12 1.12 33.3 2 - 36 14.43085 Vancouver Island North 106 25 14 39 0.87 25.8 6 - 151 10.84087 Stikine 4 - - - - - - - 4 3.28088 Terrace 177 28 26 54 0.74 * 22.0 14 - 245 10.97092 Nisgaía 15 5 3 8 1.04 30.8 3 - 26 13.99094 Telegraph Creek 8 - - - - - - - 8 12.58161 Vancouver - City Centre 427 202 55 257 1.05 31.3 137 - 821 8.02162 Vancouver - Downtown E.side 287 94 23 117 0.86 25.6 53 - 457 8.70163 Vancouver - North East 648 201 95 296 0.93 27.5 133 - 1,077 10.85164 Vancouver - Westside 609 196 99 295 0.96 28.6 127 - 1,031 8.32165 Vancouver - Midtown 554 194 90 284 0.98 29.2 133 - 971 11.05166 Vancouver - South 728 250 134 384 1.01 29.9 172 - 1,284 10.10201 Surrey 2,387 815 537 1,352 1.03 30.5 696 - 4,435 13.61202 South Surrey/White Rock 305 122 71 193 1.16 * 34.6 60 - 558 7.15
PROVINCIAL TOTAL 24,087 7,608 4,365 11,973 1.00 29.7 4,258 - 40,318 9.61
Tab
leL
IVE
BIR
TH
S B
Y L
OC
AL
HE
AL
TH
AR
EA
AN
D M
OD
E O
F D
EL
IVE
RY
, BR
ITIS
H C
OL
UM
BIA
, 200
4
12
Notes for this table follow highlight notes.

B I R T H - R E L A T E D S T A T I S T I C S 4 5
N
Statistically Significant
QUINTILE (Ratio)
5 (1.122 - 1.485)
2 (0.798 - 0.921)
1 (0.000 - 0.793)
4 (0.998 - 1.107)
3 (0.923 - 0.994)
Inset 150 kms0
300 kms0 100 200
see inset 2
10 kms0Inset 2
see inset 1
Note: Ratio - Observed over the expected. Refer to Figure 1 to clarify geographical location of Local Health Area
FIGURE 30CESAREAN DELIVERIES OF LIVE BORN INFANTS
BY LOCAL HEALTH AREABRITISH COLUMBIA, 2004

4 6 B I R T H - R E L A T E D S T A T I S T I C S
HIGHLIGHTS TO TABLE 12/FIGURE 30
• There were 11,973 cesarean deliveries of live born babies in 2004, and 24,087 spontaneous vertex deliveries.The 2004 cesarean section rate was 296.96 per 1,000 live births.
• The cesarean ratio is the number of C-section births in the area, compared to the number that would beexpected based on the provincial rate and the number of live births in the area. The eight Local Health Areas(LHAs) with cesarean ratios that were statistically significant and high in 2004 (number of cesarean deliveriesin parentheses) were:080 Kitimat (41) 1.48081 Fort Nelson (44) 1.36027 Cariboo - Chilcotin (109) 1.32072 Campbell River (128) 1.32062 Sooke (206) 1.18202 South Surrey/White Rock (193) 1.16061 Greater Victoria (612) 1.16024 Kamloops (309) 1.14
• The seven LHAs with cesarean ratios that were statistically significant and low in 2004 (number of cesareandeliveries in parentheses) were:007 Nelson (42) 0.62046 Sunshine Coast (31) 0.67059 Peace River South (55) 0.68088 Terrace (54) 0.74015 Penticton (61) 0.76065 Cowichan (118) 0.79035 Langley (322) 0.88
• Two LHAs, 087 Stikine and 094 Telegraph Creek, had no live births delivered by cesarean in 2004.
• The 2004 provincial live birth rate was 9.61 live births per 1,000 population. The five LHAs with the highestlive birth rates in 2004 (number of births in parentheses) were:081 Fort Nelson (109) 16.60060 Peace River North (497) 15.55084 Vancouver Island West (36) 14.43049 Bella Coola Valley (47) 14.03092 Nisga'a (26) 13.99
• The LHA with the lowest birth rate in 2004 was 087 Stikine with 3.28 live births per 1,000 population, but thisrate is not considered reliable since it is based on only four births. The five LHAs with the lowest live birthrates in 2004 based on at least five births (number of births in parentheses) were:017 Princeton (23) 4.78064 Gulf Islands (75) 5.13069 Qualicum (223) 5.34077 Summerland (66) 5.39045 West Vancouver-Bowen Island (279) 5.46
Notes for Table 12
Note: Ratio – observed over the expected cesareans in the specified area. Percent based upon live births in the specified area. Rate per 1,000population in the specified area. *Statistical testing indicates that observed cesarean births are significantly different from the expected (p<0.05, twotailed). +Denotes significance based on less than five births. Other is comprised of spontaneous breech, forceps, and vacuum. Non-residents areexcluded. N.S. - Not Stated.

B I R T H - R E L A T E D S T A T I S T I C S 4 7
TABLE 13LIVE BIRTHS BY BIRTH WEIGHT, GENDER, AND GESTATIONAL AGE
BRITISH COLUMBIA, 2004
Birth Weight Gender Gestational Age (in Weeks)(in Grams) Male Female <20 20–27 28–36 37–41 42+ N.S. Total
HIGHLIGHTS TO TABLE 13
Note: Total includes unknown gender.Non-residents are excluded. N.S. – Not stated.
<500 26 24 3 46 - 2 - - 51500-749 26 31 - 54 3 - - - 57750-999 33 30 - 44 19 - - - 63
1,000-1,249 42 29 - 25 46 - - - 711,250-1,499 67 55 - 3 119 - - - 1221,500-1,749 89 76 - - 162 3 - - 1651,750-1,999 125 140 - - 235 30 - - 2652,000-2,249 239 239 - - 356 122 - - 4782,250-2,499 456 532 - - 529 459 - - 9882,500-2,749 829 1,009 - 1 506 1,330 1 - 1,8382,750-2,999 1,734 2,191 - - 442 3,477 6 - 3,9253,000-3,249 2,918 3,443 - - 260 6,079 22 - 6,3613,250-3,499 3,919 3,978 - - 124 7,730 43 - 7,8973,500-3,749 3,914 3,566 - - 54 7,373 53 - 7,4803,750-3,999 3,053 2,303 - - 28 5,254 74 - 5,3564,000-4,249 1,763 1,163 - - 13 2,873 40 - 2,9264,250-4,499 900 515 - - 3 1,377 35 - 1,4154,500-4,749 360 171 - - 1 517 13 - 5314,750-4,999 123 61 - - 1 177 6 - 1845,000-5,249 43 24 - - 1 65 1 - 675,250-5,499 22 6 - - 1 27 - - 28
5,500+ 5 1 - - - 6 - - 6N.S. 25 19 1 - - - - 43 44
TOTAL 20,711 19,606 4 173 2,903 36,901 294 43 40,318
• There were 20,711 males (51.4%) and 19,606 females (48.6%) born in 2004. The average weight for a live bornbaby was 3,405 grams, 3,458 grams for males and 3,349 grams for females.
• Almost nine out of ten live births (35,493) were delivered at term (from 37 to 41 weeks gestation) with normalbirth weight (2,500 to 4,499 grams). These babies with "healthy" gestational ages and birth weights accountedfor 88.0% of live births in 2004.
• There were 2,260 live births with low birth weight (less than 2,500 grams) and 3,080 pre-term (less than 37weeks gestation) live births in 2004. A total of 1,644 babies (4.1%) were both pre-term and low birth weight; inof this group, approximately one in nine (175 births) had very low birth weight (less than 1,500 grams) andwas extremely premature (less than 28 weeks gestation).
• Post-term (42 or more weeks of gestation) deliveries occurred in 294 live births in 2004. There were 816 birthswith high birth weight (4,500 grams or more), 20 of which were also post-term.
• Out of 1,000 live births in 2004:by birth weight
– 56 were low birth weight (2,260 births), of which:~ 1 had birth weight less than 500 grams (51)~ 8 had birth weight from 500 to 1,499 grams (313)
– 923 were normal birth weight (37,198)– 20 were high birth weight (816)– 1 did not include birth weight (44)
by gestational age
– 76 were pre-term (3,080 births), of which:~ 4 were extremely premature (less than 28 weeks)
(177)– 915 were term (36,901)– 7 were post-term (294)– 1 did not include gestational age (43)

4 8 B I R T H - R E L A T E D S T A T I S T I C S
HIGHLIGHTS TO TABLE 14
TABLE 14LIVE BIRTHS BY BIRTH WEIGHT AND AGE OF MOTHER
BRITISH COLUMBIA, 2004
Birth Weight Age of Mother (in Years)(in Grams) <15 15–19 20–24 25–29 30–34 35–39 40–44 45+ N.S. Total
Note: Total includes unknown gender.Non-residents are excluded. N.S. – Not stated.
• There were 37,198 live births with healthy birth weights (2,500 to 4,499 grams) in 2004. Out of approximately100 of these births:- 4 were births to teenage mothers (1,305)- 43 were births to mothers aged 20 to 29 years (15,852)- 50 were births to mothers aged 30 to 39 years (18,624)- 4 were births to mothers 40 years of age or older (1,417)
• There were 2,260 live births with low birth weight (less than 2,500 grams) in 2004. Out of every 100 of thesebirths:- 4 were births to teenage mothers (85)- 41 were births to mothers aged 20 to 29 years (926)- 50 were births to mothers aged 30 to 39 years (1,128)- 5 were births to mothers 40 years of age or older (121)
• There were 816 live births with high birth weight (4,500 grams or over) in 2004. Out of every 100 of these births:- 4 were births to teenage mothers (35)- 41 were births to mothers aged 20 to 29 years (337)- 51 were births to mothers aged 30 to 39 years (415)- 4 were births to mothers 40 years of age or older (29)
• Nine out of ten (92.4%) live births to mothers in the four maternal age groups from 20-24 to 35-39 had "healthy"birth weights. One in 18 births in these age groups (5.5%) had low birth weight and one in 50 (2.0%) had highbirth weight.
• Of live births to teenage mothers (less than 20 years of age), 91.6% had healthy birth weights, 6.0% had lowand 2.5% had high birth weights. For mothers in the 40 or older age group, 90.4% of live births had healthybirth weights, 7.7% had low and 1.8% had high birth weights.
<500 - 1 6 12 15 14 3 - - 51500-749 - 2 10 12 14 17 2 - - 57750-999 - 3 10 15 22 12 1 - - 63
1,000-1,249 - 5 15 19 17 10 5 - - 711,250-1,499 - 9 22 25 35 25 6 - - 1221,500-1,749 - 7 25 41 50 32 10 - - 1651,750-1,999 - 13 42 64 78 51 14 3 - 2652,000-2,249 - 24 76 135 134 86 21 2 - 4782,250-2,499 - 21 139 258 324 192 48 6 - 9882,500-2,749 - 79 279 475 576 343 81 5 - 1,8382,750-2,999 - 151 622 1,084 1,216 699 141 12 - 3,9253,000-3,249 - 221 927 1,795 2,031 1,160 211 16 - 6,3613,250-3,499 - 277 1,177 2,170 2,640 1,321 296 16 - 7,8973,500-3,749 2 245 1,136 2,046 2,531 1,233 277 10 - 7,4803,750-3,999 1 199 834 1,458 1,732 944 184 4 - 5,3564,000-4,249 1 89 443 801 976 507 106 3 - 2,9264,250-4,499 - 40 216 389 457 258 50 5 - 1,4154,500-4,749 - 22 76 147 180 87 17 2 - 5314,750-4,999 - 10 32 45 56 35 6 - - 1845,000-5,249 - 2 8 17 23 15 2 - - 675,250-5,499 - - 2 8 10 7 1 - - 28
5,500+ - 1 - 2 1 1 - 1 - 6 N.S. - - 4 14 11 13 1 - 1 44
TOTAL 4 1,421 6,101 11,032 13,129 7,062 1,483 85 1 40,318

B I R T H - R E L A T E D S T A T I S T I C S 4 9
TABLE 15LOW BIRTH WEIGHT LIVE BIRTHS BY AGE OF MOTHER AND GENDER
BRITISH COLUMBIA, 2004
Age of Male Female TotalMother Number Percent Number Percent Number Percent Rate
FIGURE 31LOW BIRTH WEIGHT LIVE BIRTHS BY AGE OF MOTHER
BRITISH COLUMBIA, 2004
< 15 - - - - - - -15-19 41 3.7 44 3.8 85 3.8 59.8220-24 167 15.1 178 15.4 345 15.3 56.5525-29 287 26.0 293 25.3 581 25.7 52.6630-34 328 29.7 361 31.2 689 30.5 52.4835-39 221 20.0 218 18.9 439 19.4 62.1640-44 54 4.9 56 4.8 110 4.9 74.17
45 + 5 0.5 6 0.5 11 0.5 129.41N.S. - - - - - - -
TOTAL 1,103 100.0 1,156 100.0 2,260 100.0 56.05
Note: Rate per 1,000 live births for the specified age group.Low birth weight: birth weight less than 2,500 grams.Total percentage may not add up to 100 due to rounding. Total includes unknown gender.Non-residents are excluded. N.S. – Not stated.
HIGHLIGHTS TO TABLE 15/FIGURE 31
• In 2004, there were 2,260 live births with low birth weight (less than 2,500 grams). The provincial low birthweight (LBW) live birth rate was 56.05 per 1,000 live births.
• Among live births in 2004, 5.3% of the 20,711 male births had low birth weight (1,103) and 5.9% of the 19,606female births had low birth weight (1,156). (see Table 13 for the number of male and female live births.)
• Of the low birth weight live births, 51.2% were females.
• Mothers aged 30-34 and those aged 25-29 had the lowest LBW rates (52.48 and 52.66 per 1,000 live birthsrespectively). The next lowest LBW rate was for mothers aged 20-24 (56.55 per 1,000 live births). Teenagemothers (aged 15-19) had a low birth weight rate of 59.82. The oldest maternal age groups had the highestLBW rates (74.17 for mothers aged 40-44 and 129.41 for mothers aged 45+).
59.8256.55
52.66 52.48
62.16
74.17
129.41
0
20
40
60
80
100
120
140
15-19 20-24 25-29 30-34 35-39 40-44 45 +
Age of Mother (in Years)
Rate per 1,000 Live Births

5 0 B I R T H - R E L A T E D S T A T I S T I C S
1999–2003 2004Low Birth Weight Live Births Gestational Age (in Weeks)
Local Health Area Observed Ratio (p) Rate <37 37–41 42+ N.S. Total Rate001 Fernie 19 0.61 * 31.20 3 2 - - 5 40.98002 Cranbrook 34 0.58 * 29.57 3 2 - - 5 24.15003 Kimberley 13 0.91 46.10 1 - - - 1 17.54004 Windermere 8 0.48 * 24.39 1 2 - - 3 41.10005 Creston 29 0.85 43.09 4 1 - - 5 49.50006 Kootenay Lake 14 1.58 80.46 - 1 - - 1 25.64007 Nelson 39 0.71 * 36.14 8 4 - - 12 52.40009 Castlegar 23 0.90 45.73 3 3 - - 6 75.00010 Arrow Lakes 19 1.83 * 93.14 - - - - - -011 Trail 49 1.30 66.04 6 4 - - 10 83.33012 Grand Forks 14 0.88 44.59 2 3 - - 5 67.57013 Kettle Valley 9 1.37 69.77 - 1 - - 1 31.25014 Southern Okanagan 32 0.96 49.08 4 4 - - 8 62.50015 Penticton 87 1.13 57.69 14 4 - - 18 66.42016 Keremeos 12 1.13 57.69 - - - - - -017 Princeton 10 1.48 75.19 2 - - - 2 86.96018 Golden 9 0.51 * 25.94 1 - - - 1 18.87019 Revelstoke 23 1.19 60.53 4 1 - - 5 63.29020 Salmon Arm 53 0.93 47.41 6 4 - - 10 47.39021 Armstrong - Spallumcheen 12 0.59 30.23 4 1 - - 5 68.49022 Vernon 148 1.13 57.25 26 9 - - 35 66.79023 Central Okanagan 321 0.94 47.79 55 13 - - 68 50.41024 Kamloops 239 1.06 53.83 37 27 - - 64 70.18025 100 Mile House 40 1.41 * 71.81 4 2 - - 6 55.56026 North Thompson 8 0.67 33.90 1 3 - - 4 88.89027 Cariboo - Chilcotin 104 1.29 * 65.70 7 1 - - 8 28.78028 Quesnel 67 1.08 54.78 6 7 - - 13 57.78029 Lillooet 10 0.66 33.33 1 2 - - 3 58.82030 South Cariboo 12 0.83 42.11 2 1 - - 3 55.56031 Merritt 30 1.12 56.82 2 1 - - 3 28.57032 Hope 13 0.67 34.30 3 1 - - 4 54.79033 Chilliwack 172 0.83 * 42.24 31 11 - - 42 45.70034 Abbotsford 376 0.93 47.23 64 38 - - 102 64.48035 Langley 270 0.86 * 43.91 39 15 - - 54 43.94037 Delta 227 0.89 45.09 39 14 - - 53 55.32038 Richmond 403 1.02 51.87 55 24 - - 79 50.87040 New Westminster 188 1.15 * 58.64 29 22 - - 51 81.86041 Burnaby 588 1.12 * 57.14 94 32 - - 126 61.92042 Maple Ridge 216 0.98 49.86 43 10 - - 53 55.61043 Coquitlam 541 1.00 51.04 89 31 - - 120 58.37044 North Vancouver 274 0.83 * 42.21 61 13 - - 74 54.86045 West Vancouver - Bowen Is. 72 0.92 47.03 6 2 - - 8 28.67046 Sunshine Coast 28 0.57 * 29.08 6 1 - - 7 44.87047 Powell River 23 0.59 * 29.83 6 - - - 6 44.78048 Howe Sound 103 1.03 52.52 22 6 - - 28 68.46049 Bella Coola Valley 11 0.86 43.82 3 - - - 3 63.83050 Queen Charlotte 12 0.72 36.47 8 - - - 8 123.08051 Snow Country 3 1.25 63.83 - - - - - -052 Prince Rupert 42 0.77 38.92 5 2 - - 7 40.46053 Upper Skeena 19 1.00 50.80 - - - - - -054 Smithers 48 0.78 39.83 5 2 - - 7 31.67055 Burns Lake 7 0.30 * 15.49 1 2 - - 3 32.97056 Nechako 58 0.99 50.35 12 2 - - 14 63.64057 Prince George 279 1.02 51.72 45 14 - - 59 57.06059 Peace River South 52 0.71 * 35.86 8 5 - - 13 47.79060 Peace River North 102 0.83 42.46 18 5 - - 23 46.28061 Greater Victoria 455 1.05 53.16 73 18 - - 91 51.21062 Sooke 141 0.99 50.14 30 6 - - 36 61.02063 Saanich 110 1.08 55.03 21 2 - - 23 58.52064 Gulf Islands 21 0.90 45.75 - - - - - -065 Cowichan 129 1.04 52.65 31 5 - - 36 71.86066 Lake Cowichan 7 0.60 30.43 5 1 - - 6 120.00067 Ladysmith 42 1.18 60.26 9 1 - - 10 72.99068 Nanaimo 198 0.97 49.33 30 12 - - 42 51.03069 Qualicum 45 0.75 * 38.23 4 1 - - 5 22.42070 Alberni 54 0.71 * 36.24 7 2 - - 9 30.82071 Courtenay 137 1.13 57.68 23 7 - - 30 64.52072 Campbell River 97 1.01 51.19 9 2 - - 11 33.74075 Mission 102 0.94 47.82 22 4 - - 26 61.76076 Agassiz - Harrison 16 0.77 39.41 - 1 - - 1 10.00077 Summerland 17 0.89 45.09 1 1 - - 2 30.30078 Enderby 24 1.59 * 81.08 - - - - - -080 Kitimat 20 0.68 34.54 3 - - - 3 32.26081 Fort Nelson 12 0.52 * 26.37 2 2 - - 4 36.70083 Central Coast 6 0.97 49.59 3 - - - 3 136.36084 Vancouver Island West 8 0.94 47.62 - - - - - -085 Vancouver Island North 42 0.98 49.94 8 1 - - 9 59.60087 Stikine 2 0.94 47.62 2 - - - 2 500.00088 Terrace 59 0.84 42.57 7 4 - - 11 44.90092 Nisgaía 8 1.06 54.05 1 - - - 1 38.46094 Telegraph Creek 5 2.09 106.38 - - - - - -161 Vancouver - City Centre 174 0.91 46.54 32 12 - - 44 53.59162 Vancouver - Downtown E.side 135 1.16 59.24 35 14 - - 49 107.22163 Vancouver - North East 319 1.11 56.27 54 15 - - 69 64.07164 Vancouver - Westside 258 0.96 48.81 31 7 - - 38 36.86165 Vancouver - Midtown 296 1.12 * 56.94 37 20 - - 57 58.70166 Vancouver - South 386 1.20 * 61.13 49 27 - - 76 59.19201 Surrey 1,270 1.15 * 58.44 195 88 - - 283 63.81202 South Surrey/White Rock 106 0.88 44.58 21 8 - - 29 51.97
PROVINCIAL TOTAL 10,316 1.00 50.87 1,644 616 - - 2,260 56.05
16
LO
W B
IRT
H W
EIG
HT
LIV
E B
IRT
HS
BY
LO
CA
L H
EA
LT
H A
RE
A A
ND
GE
ST
AT
ION
AL
AG
E,
BR
ITIS
H C
OL
UM
BIA
, 19
99–2
003
AN
D 2
004
Tab
le 1
6
Note: Low Birth Weight – birth weight less than 2,500 grams. Ratio – observed over the expected low birth weight live births. * Statisticaltesting indicates that observed low birth weight live births are significantly different from the expected (p<0.05, two tailed). Rate per 1,000live births in the specified area. Total includes unknown gender. Non-residents are excluded. N.S. - Not Stated.

B I R T H - R E L A T E D S T A T I S T I C S 5 1
N
Statistically Significant
QUINTILE (Ratio)
5 (1.149 - 2.091)
2 (0.752 - 0.899)
1 (0.304 - 0.717)
4 (0.999 - 1.134)
3 (0.906 - 0.990)
Inset 150 kms0
300 kms0 100 200
see inset 2
10 kms0Inset 2
see inset 1
FIGURE 32LOW BIRTH WEIGHT LIVE BIRTHS BY LOCAL HEALTH AREA
BRITISH COLUMBIA, 1999–2003
Note: Ratio - Observed over the expected. Refer to Figure 1 to clarify geographical location of Local Health Area

5 2 B I R T H - R E L A T E D S T A T I S T I C S
HIGHLIGHTS TO TABLE 17
HIGHLIGHTS TO TABLE 16/FIGURE 32
• The provincial low birth weight (LBW) (less than 2,500 grams) live birth rate for 2004 was 56.05 per 1,000 livebirths, higher than the 1999-2003 LBW rate (50.87).
• The five Local Health Areas (LHAs) with the highest LBW rates based on at least five births were:050 Queen Charlotte (8) 123.08066 Lake Cowichan (6) 120.00162 Vancouver - Downtown Eastside (49) 107.22011 Trail (10) 83.33040 New Westminster (51) 81.86
• The five LHAs with lowest LBW rates based on at least five births in 2004 (number of births in parentheses)were:069 Qualicum (5) 22.42002 Cranbrook (5) 24.15045 West Vancouver-Bowen Island (8) 28.67027 Cariboo - Chilcotin (8) 28.78070 Alberni (9) 30.82
• In 2004, eight LHAs, 010 Arrow Lakes, 016 Keremeos, 051 Snow Country, 053 Upper Skeena, 064 Gulf Islands,078 Enderby, 084 Vancouver Island West, and 094 Telegraph Creek, did not have any low birth weight births,and there were 20 other LHAs with less than five LBW live births.
• There were nine LHAs with low birth weight ratios for the period 1999-2003 that were statistically significantand high (number of births and LBW rate per 1,000 live births in parentheses). The five highest (number ofbirths and LBW rate per 1,000 live births in parentheses) were:010 Arrow Lakes (19) 1.83 (93.14)078 Enderby (24) 1.59 (81.08)025 100 Mile House (40) 1.41 (71.81)027 Cariboo - Chilcotin (104) 1.29 (65.70)166 Vancouver - South (386) 1.20 (61.13)
• There were 15 LHAs with low birth weight ratios for the period 1999-2003 that were statistically significantand low, based on at least five births. The five lowest (number of births and LBW rate per 1,000 live births inparentheses) were:055 Burns Lake (7) 0.30 (15.49)004 Windermere (8) 0.48 (24.39)018 Golden (9) 0.51 (25.94)081 Fort Nelson (12) 0.52 (26.37)046 Sunshine Coast (28) 0.57 (29.08)
• There were 27,934 maternal complications of pregnancy and delivery noted in 21,040 live births in 2004.Included in these complications are preterm births, multiple births, assisted or surgical deliveries where nocause was given, and elderly primigravida (first births to women aged 35 or older). Just over half of all livebirths involved maternal complications (52.2% in 2004 and 50.3% in 1999-2003).
• The percentage of live births with maternal complications of pregnancy and delivery increased with the age ofmother. Teenage mothers had maternal complications in 44.7% of their births. In the age groups 20-29 and 30-39, maternal complications occurred in 47.8% and 55.4% of live births, respectively. For mothers aged 40 orolder, the proportion rose to almost two thirds (65.1%).
• The largest categories of maternal complications of pregnancy and delivery in 2004 were assisted or surgicaldeliveries where no cause was given (22.0%) and maternal abnormality of pelvic organs (16.4%). Thesecomplications combined accounted for more than a third of all maternal complications (38.4% in 2004 and35.2% in 1999-2003).

B I R T H - R E L A T E D S T A T I S T I C S 5 3
TABLE 17MATERNAL COMPLICATIONS OF PREGNANCY AND
DELIVERY IN LIVE BIRTHS BY AGE OF MOTHERBRITISH COLUMBIA, 1999–2003 AND 2004
20041999–2003 Age of Mother (in Years)
Maternal Complications ICD-10 Code Total Percent <20 20–29 30–39 40+ N.S. Total Percent
Note: Percent based upon total maternal complications. Percent (*) based upon live births for the specified maternal age group.1Where no other complication code is found. Total percentage may not add up to 100 due to rounding.N.S. - Not Stated. Non-residents are excluded.
Hypertension/hypertensive O10-O11, 2,591 1.9 15 205 228 38 - 486 1.7
disorders in pregnancy O13, O16
Edema and proteinuria O12 33 0.0 3 5 1 - - 9 0.0
without hypertension
Pre-eclampsia/eclampsia O14-O15 800 0.6 8 96 100 11 - 215 0.8
Hemorrhage in early pregnancy O20 10 0.0 - - 1 - - 1 0.0
Hyperemesis gravidarum O21 62 0.0 - 7 6 - - 13 0.0
Other maternal disorders O22-O23, 1,602 1.2 14 178 177 13 - 382 1.4
predominantly related to O25-O29,
pregnancy F179
Diabetes in pregnancy O24 2,452 1.8 4 125 250 29 - 408 1.5
Multiple gestation and O30-O31 5,314 3.8 28 385 655 68 - 1,136 4.1
related complications
Fetal malpresentation O32 7,221 5.2 45 542 717 49 - 1,353 4.8
Disproportion O33 1,643 1.2 2 31 50 5 - 88 0.3
Maternal abnormality of O34 19,461 14.0 27 1,297 2,947 303 - 4,574 16.4
pelvic organs
Disorders of amniotic O40-O42 3,677 2.6 32 343 443 39 - 857 3.1
fluid and membranes
Placental disorders O43-O45, 2,379 1.7 15 160 208 35 - 418 1.5
O73
Antepartum hemorrhage O46 372 0.3 1 25 36 4 - 66 0.2
Prolonged pregnancy O48 2,219 1.6 13 136 113 14 - 276 1.0
Preterm labour and delivery O60 8,598 6.2 92 709 801 53 - 1,655 5.9
Abnormalities of forces of labour O62-O63 6,366 4.6 35 493 530 33 - 1,091 3.9
Obstructed labour O64-O66 10,386 7.5 112 1003 1056 79 - 2,250 8.1
Intrapartum hemorrhage O67 - - - - - - - - -
Evidence of fetal distress O68 8,747 6.3 86 738 795 71 - 1,690 6.0
Cord complications O69 2,688 1.9 19 205 203 20 - 447 1.6
Obstetrical trauma O70-O71 1,467 1.1 11 121 118 5 - 255 0.9
Postpartum hemorrhage O72 2,091 1.5 9 169 183 16 - 377 1.3
Assisted or surgical delivery - O81-O82 29,548 21.2 181 2,607 3,079 277 - 6,144 22.0
no cause given1
Maternal and puerperal O85-O86, 192 0.1 2 13 6 - - 21 0.1
infections O98, A34
Other puerperal complications O87-O92 60 0.0 - 2 6 1 - 9 0.0Maternal noninfectious diseases O99 1,639 1.2 12 146 214 27 - 399 1.4complicating the pregnant state
Elderly primigravida Z355 6,463 4.6 - 2 1,343 238 - 1,583 5.7Maternal drug use O355 301 0.2 5 49 17 2 - 73 0.3
Other maternal complications O00-O08, 10,916 7.8 58 739 799 62 - 1,658 5.9O35-O36,
O47, O61, O74-O75, O95-O97
Total maternal complications 139,298 100.0 829 10,531 15,082 1,492 - 27,934 100.0
Live births with the above - Number 101,999 637 8,195 11,187 1,021 - 21,040
maternal complications - Percent(*) 50.3 44.7 47.8 55.4 65.1 52.2

5 4 B I R T H - R E L A T E D S T A T I S T I C SM
AT
ER
NA
L C
OM
PL
ICA
TIO
NS
OF
PR
EG
NA
NC
Y A
ND
DE
LIV
ER
Y I
N L
IVE
BIR
TH
S B
Y L
OC
AL
HE
AL
TH
AR
EA
,B
RIT
ISH
CO
LU
MB
IA,
1999
–200
3 A
ND
200
4T
able
18
1999–2003 2004 Observed Total Observed Expected Total
Local Health Area Births Ratio (p) Percent Live Births Births Births Ratio (p) Percent Live Births001 Fernie 330 1.08 54.2 609 74 63.7 1.16 60.7 122002 Cranbrook 417 0.72 * 36.3 1,150 91 108.0 0.84 44.0 207003 Kimberley 115 0.81 * 40.8 282 28 29.7 0.94 49.1 57004 Windermere 154 0.93 47.0 328 37 38.1 0.97 50.7 73005 Creston 265 0.78 * 39.4 673 42 52.7 0.80 41.6 101006 Kootenay Lake 83 0.95 47.7 174 12 20.4 0.59 30.8 39007 Nelson 402 0.74 * 37.3 1,079 80 119.5 0.67 * 34.9 229009 Castlegar 219 0.87 * 43.5 503 35 41.7 0.84 43.8 80010 Arrow Lakes 102 0.99 50.0 204 12 18.3 0.66 34.3 35011 Trail 353 0.95 47.6 742 64 62.6 1.02 53.3 120012 Grand Forks 149 0.94 47.5 314 28 38.6 0.73 37.8 74013 Kettle Valley 53 0.82 41.1 129 8 16.7 0.48 * 25.0 32014 Southern Okanagan 288 0.88 * 44.2 652 63 66.8 0.94 49.2 128015 Penticton 734 0.97 48.7 1,508 146 141.4 1.03 53.9 271016 Keremeos 95 0.91 45.7 208 18 15.1 1.19 62.1 29017 Princeton 63 0.94 47.4 133 10 12.0 0.83 43.5 23018 Golden 173 0.99 49.9 347 30 27.7 1.08 56.6 53019 Revelstoke 172 0.90 45.3 380 42 41.2 1.02 53.2 79020 Salmon Arm 550 0.98 49.2 1,118 125 110.1 1.14 59.2 211021 Armstrong - Spallumcheen 189 0.95 47.6 397 36 38.1 0.95 49.3 73022 Vernon 1,306 1.00 50.5 2,585 296 273.5 1.08 56.5 524023 Central Okanagan 3,069 0.91 * 45.7 6,718 677 704.0 0.96 50.2 1,349024 Kamloops 2,094 0.94 * 47.2 4,440 441 475.9 0.93 48.4 912025 100 Mile House 276 0.99 49.6 557 49 56.4 0.87 45.4 108026 North Thompson 118 0.99 50.0 236 21 23.5 0.89 46.7 45027 Cariboo - Chilcotin 862 1.08 * 54.5 1,583 160 145.1 1.10 57.6 278028 Quesnel 616 1.00 50.4 1,223 107 117.4 0.91 47.6 225029 Lillooet 151 1.00 50.3 300 27 26.6 1.01 52.9 51030 South Cariboo 119 0.83 * 41.8 285 22 28.2 0.78 40.7 54031 Merritt 230 0.87 * 43.6 528 45 54.8 0.82 42.9 105032 Hope 193 1.01 50.9 379 35 38.1 0.92 47.9 73033 Chilliwack 1,974 0.96 48.5 4,072 462 479.6 0.96 50.3 919034 Abbotsford 3,713 0.93 * 46.6 7,961 770 825.6 0.93 48.7 1,582035 Langley 2,980 0.96 * 48.5 6,149 609 641.4 0.95 49.6 1,229037 Delta 2,672 1.06 * 53.1 5,034 528 499.9 1.06 55.1 958038 Richmond 4,131 1.06 * 53.2 7,770 817 810.4 1.01 52.6 1,553040 New Westminster 1,705 1.06 * 53.2 3,207 347 325.1 1.07 55.7 623041 Burnaby 5,164 1.00 50.2 10,290 1,025 1,062.0 0.97 50.4 2,035042 Maple Ridge 2,263 1.04 52.2 4,332 530 497.3 1.07 55.6 953043 Coquitlam 5,650 1.06 * 53.3 10,600 1,147 1,072.9 1.07 * 55.8 2,056044 North Vancouver 3,179 0.97 49.0 6,492 684 704.0 0.97 50.7 1,349045 West Vancouver-Bowen Is. 749 0.97 48.9 1,531 133 145.6 0.91 47.7 279046 Sunshine Coast 452 0.93 46.9 963 59 81.4 0.72 * 37.8 156047 Powell River 416 1.07 54.0 771 74 69.9 1.06 55.2 134048 Howe Sound 1,032 1.05 52.6 1,961 222 213.4 1.04 54.3 409049 Bella Coola Valley 132 1.05 52.6 251 21 24.5 0.86 44.7 47050 Queen Charlotte 175 1.06 53.2 329 38 33.9 1.12 58.5 65051 Snow Country 21 0.89 44.7 47 4 2.6 1.53 80.0 5052 Prince Rupert 500 0.92 46.3 1,079 71 90.3 0.79 * 41.0 173053 Upper Skeena 203 1.08 54.3 374 45 36.5 1.23 64.3 70054 Smithers 543 0.90 * 45.1 1,205 106 115.3 0.92 48.0 221055 Burns Lake 215 0.95 47.6 452 49 47.5 1.03 53.8 91056 Nechako 543 0.94 47.1 1,152 111 114.8 0.97 50.5 220057 Prince George 2,430 0.90 * 45.1 5,394 497 539.6 0.92 48.1 1,034059 Peace River South 637 0.87 * 43.9 1,450 103 141.9 0.73 * 37.9 272060 Peace River North 981 0.81 * 40.8 2,402 201 259.4 0.77 * 40.4 497061 Greater Victoria 4,118 0.96 * 48.1 8,559 921 927.3 0.99 51.8 1,777062 Sooke 1,377 0.97 49.0 2,812 324 307.9 1.05 54.9 590063 Saanich 952 0.95 47.6 1,999 190 205.1 0.93 48.3 393064 Gulf Islands 184 0.80 * 40.1 459 32 39.1 0.82 42.7 75065 Cowichan 1,132 0.92 * 46.2 2,450 218 261.4 0.83 * 43.5 501066 Lake Cowichan 115 0.99 50.0 230 25 26.1 0.96 50.0 50067 Ladysmith 384 1.10 55.1 697 83 71.5 1.16 60.6 137068 Nanaimo 2,582 1.28 * 64.3 4,015 534 429.5 1.24 * 64.9 823069 Qualicum 745 1.26 * 63.3 1,177 131 116.4 1.13 58.7 223070 Alberni 801 1.07 53.8 1,490 175 152.4 1.15 59.9 292071 Courtenay 1,188 0.99 50.0 2,375 237 242.7 0.98 51.0 465072 Campbell River 1,103 1.16 * 58.2 1,895 191 170.1 1.12 58.6 326075 Mission 962 0.90 * 45.1 2,133 192 219.7 0.87 45.6 421076 Agassiz - Harrison 208 1.02 51.2 406 44 52.2 0.84 44.0 100077 Summerland 181 0.95 48.0 377 29 34.4 0.84 43.9 66078 Enderby 162 1.09 54.7 296 30 30.8 0.97 50.8 59080 Kitimat 315 1.08 54.4 579 50 48.5 1.03 53.8 93081 Fort Nelson 215 0.94 47.3 455 63 56.9 1.11 57.8 109083 Central Coast 70 1.15 57.9 121 12 11.5 1.05 54.5 22084 Vancouver Island West 95 1.12 56.5 168 17 18.8 0.90 47.2 36085 Vancouver Island North 419 0.99 49.8 841 72 78.8 0.91 47.7 151087 Stikine 20 0.95 47.6 42 2 2.1 0.96 50.0 4088 Terrace 754 1.08 * 54.4 1,386 126 127.9 0.99 51.4 245092 Nisgaía 80 1.07 54.1 148 17 13.6 1.25 65.4 26094 Telegraph Creek 23 0.97 48.9 47 6 4.2 1.44 75.0 8161 Vancouver - City Centre 2,163 1.15 * 57.8 3,739 512 428.4 1.20 * 62.4 821162 Vancouver - Downtown E.side 1,189 1.04 52.2 2,279 247 238.5 1.04 54.0 457163 Vancouver - North East 2,810 0.99 49.6 5,669 555 562.0 0.99 51.5 1,077164 Vancouver - Westside 2,914 1.10 * 55.1 5,286 544 538.0 1.01 52.8 1,031165 Vancouver - Midtown 2,694 1.03 51.8 5,198 526 506.7 1.04 54.2 971166 Vancouver - South 3,233 1.02 51.2 6,314 677 670.1 1.01 52.7 1,284201 Surrey 11,194 1.02 * 51.5 21,733 2,429 2,314.4 1.05 * 54.8 4,435202 South Surrey/White Rock 1,210 1.01 50.9 2,378 314 291.2 1.08 56.3 558
PROVINCIAL TOTAL 101,999 1.00 50.3 202,804 21,040 21,040.0 1.00 52.2 40,318Note: *Statistical testing indicates that the observed number of births with maternal complications is signficantly different from theexpected (p<0.05, two tailed). Ratio - observed over the expected. Percent of observed births is based on total live births. Non-residentsare excluded.

B I R T H - R E L A T E D S T A T I S T I C S 5 5
N
Statistically Significant
QUINTILE (Ratio)
5 (1.060 - 1.279)
2 (0.908 - 0.955)
1 (0.721 - 0.908)
4 (0.998 - 1.058)
3 (0.957 - 0.995)
Inset 150 kms0
300 kms0 100 200
see inset 2
10 kms0Inset 2
see inset 1
FIGURE 33MATERNAL COMPLICATIONS OF PREGNANCY AND
DELIVERY IN LIVE BIRTHS BY LOCAL HEALTH AREABRITISH COLUMBIA, 1999–2003
Note: Ratio - Observed over the expected. Refer to Figure 1 to clarify geographical location of Local Health Area

5 6 B I R T H - R E L A T E D S T A T I S T I C S
HIGHLIGHTS TO TABLE 18/FIGURE 33
• There were four Local Health Areas (LHAs) with maternal complication ratios that were statisticallysignificant and high in 2004 (number of births with maternal complications in parentheses):068 Nanaimo (534) 1.24161 Vancouver - City Centre (512) 1.20043 Coquitlam (1,147) 1.07201 Surrey (2,429) 1.05
• All of the above LHAs also had statistically significant high ratios for the 1999-2003 period.
• There were seven LHAs with maternal complication ratios that were statistically significant and low in 2004.The seven LHAs with the lowest ratios that were statistically significant (number of births with maternalcomplications in parentheses) were:013 Kettle Valley (8) 0.48007 Nelson (80) 0.67046 Sunshine Coast (59) 0.72059 Peace River South (103) 0.73060 Peace River North (201) 0.77052 Prince Rupert (71) 0.79065 Cowichan (218) 0.83
• Nelson, Peace River South, Peace River North, and Cowichan also had statistically significant and low ratiosfor 1999-2003.
• There were 12 LHAs with statistically significant and high maternal complication ratios in 1999-2003. The fiveLHAs with the highest ratios that were statistically significant (number of births with maternal complicationsin parentheses) were:068 Nanaimo (2,582) 1.28069 Qualicum (745) 1.26072 Campbell River (1,103) 1.16161 Vancouver - City Centre (2,163) 1.15164 Vancouver - Westside (2,914) 1.10
• There were 20 LHAs with statistically significant and low maternal complication ratios in 1999-2003. The sixLHAs with the lowest ratios that were statistically significant (number of births with maternal complicationsin parentheses) were:002 Cranbrook (417) 0.72007 Nelson (402) 0.74005 Creston (265) 0.78064 Gulf Islands (184) 0.80060 Peace River North (981) 0.81003 Kimberley (115) 0.81

B I R T H - R E L A T E D S T A T I S T I C S 5 7
TABLE 19PERINATAL COMPLICATIONS IN LIVE BIRTHS BY AGE OF MOTHER
BRITISH COLUMBIA, 1999–2003 AND 2004
20041999–2003 Age of Mother (in Years)
Perinatal Complications ICD-10 Code Total Percent <20 20–29 30–39 40+ N.S. Total Percent
HIGHLIGHTS TO TABLE 19
Fetus/newborn affected by P00 49 0.1 2 8 3 - - 13 0.1maternal conditions that maybe unrelated to presentpregnancyComplications of pregnancy, P01, P03 14,412 15.9 68 938 1,219 121 - 2,346 13.0labour and deliveryFetus/newborn affected by P02 3,788 4.2 30 320 355 45 - 750 4.2complications of placenta,cord and membranesFetus affected by noxious P04 46 0.1 - - - - - - -influences transmitted viaplacenta or breast milkSlow fetal growth and P05 4,341 4.8 17 294 324 37 - 672 3.7malnutritionPerinatal disorders related P072, P073 13,392 14.8 128 1,210 1,515 138 - 2,991 16.6to short gestationDisorders related to long P08 9,020 10.0 87 1,182 1,418 108 - 2,795 15.5gestation or high birth weightPerinatal birth trauma P10-P15 319 0.4 5 35 18 3 - 61 0.3Intrauterine hypoxia and P20-P21 43,805 48.4 395 3,630 3,800 326 - 8,151 45.3birth asphyxiaRespiratory conditions of P22-P28 775 0.9 8 58 55 4 - 125 0.7fetus and newbornInfections specific to the P35-P39 54 0.1 - 5 6 - - 11 0.1perinatal periodFetal and neonatal hemorrhageP50-P52, P54 111 0.1 1 12 6 1 - 20 0.1Perinatal jaundice/other P53, P55-P61 63 0.1 - 2 3 - - 5 0.0hematological disordersPerinatal endocrine and P70-P74 37 0.0 - 1 1 2 - 4 0.0metabolic disordersDigestive system disorders P76-P78 5 0.0 - 1 - - - 1 0.0of fetus and newbornPerinatal conditions of the P80-P83 111 0.1 1 12 17 - - 30 0.2integument and oftemperature regulationOther disorders originating P29, P90-P96 215 0.2 1 13 15 1 - 30 0.2in the perinatal periodAll Perinatal Complications 90,543 100.0 743 7,721 8,755 786 - 18,005 100.0Live births with the above - Number 70,274 583 5,939 6,762 573 - 13,857 perinatal complications - Percent(*) 34.7 40.9 34.7 33.5 36.5 34.4
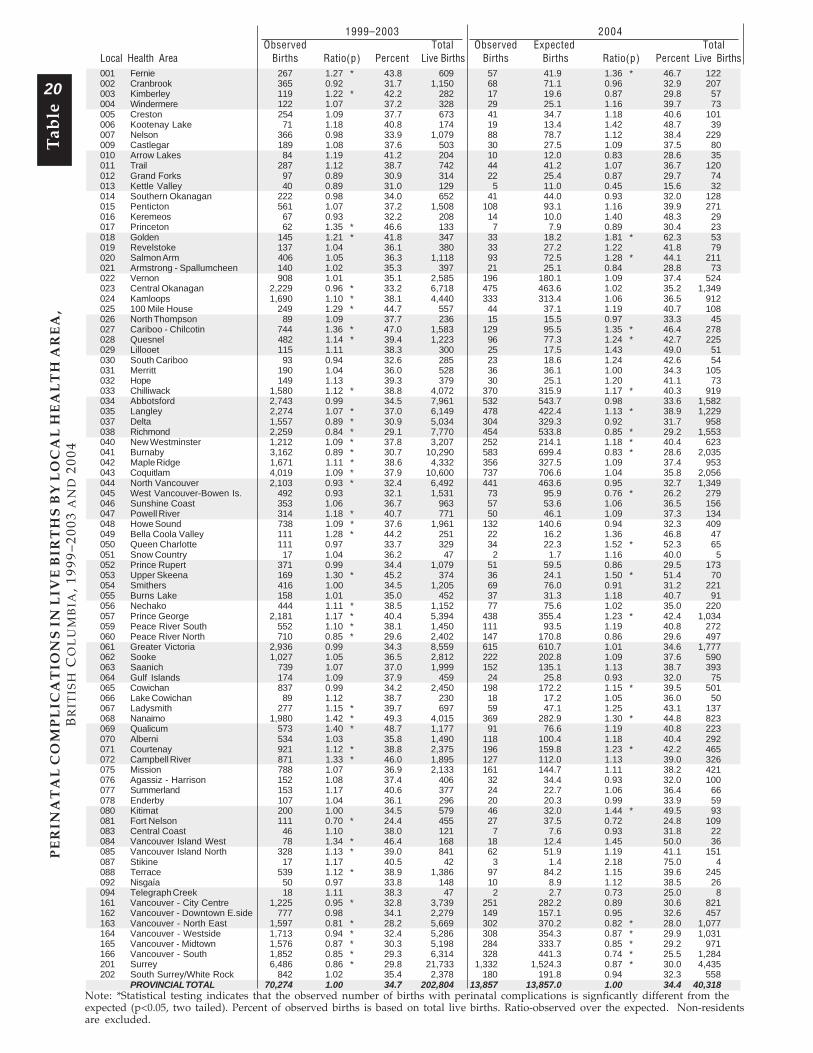
• There were 18,005 perinatal complications noted in 13,857 live births or one in three live births (34.4%) in2004. These complications were noted in 34.7% of live births in 1999-2003.
• The proportion of births that had perinatal complications was highest (40.9%) in births to teenage mothers.Perinatal complications occurred in 34.7% of live births to mothers aged 20-29, 33.5% of live births to mothersaged 30-39, and 36.5% of live births to mothers 40 years of age and older.
• Intrauterine hypoxia and birth asphyxia accounted for almost half the perinatal complications (45.3% in 2004and 48.4% in 1999-2003). The next largest categories of perinatal complications in 2004 were short gestation(16.6%), long gestation and high birth weight (15.5%), and complications of pregnancy, labour and delivery(13.0%).
Note: Percent based upon perinatal complications. Percent (*) based upon live births for the maternal age group. Total percentagemay not add up to 100 due to rounding. N.S. - Not stated. Non-residents are excluded.
5 8 B I R T H - R E L A T E D S T A T I S T I C S1999–2003 2004
Observed Total Observed Expected TotalLocal Health Area Births Ratio(p) Percent Live Births Births Births Ratio(p) Percent Live Births001 Fernie 267 1.27 * 43.8 609 57 41.9 1.36 * 46.7 122002 Cranbrook 365 0.92 31.7 1,150 68 71.1 0.96 32.9 207003 Kimberley 119 1.22 * 42.2 282 17 19.6 0.87 29.8 57004 Windermere 122 1.07 37.2 328 29 25.1 1.16 39.7 73005 Creston 254 1.09 37.7 673 41 34.7 1.18 40.6 101006 Kootenay Lake 71 1.18 40.8 174 19 13.4 1.42 48.7 39007 Nelson 366 0.98 33.9 1,079 88 78.7 1.12 38.4 229009 Castlegar 189 1.08 37.6 503 30 27.5 1.09 37.5 80010 Arrow Lakes 84 1.19 41.2 204 10 12.0 0.83 28.6 35011 Trail 287 1.12 38.7 742 44 41.2 1.07 36.7 120012 Grand Forks 97 0.89 30.9 314 22 25.4 0.87 29.7 74013 Kettle Valley 40 0.89 31.0 129 5 11.0 0.45 15.6 32014 Southern Okanagan 222 0.98 34.0 652 41 44.0 0.93 32.0 128015 Penticton 561 1.07 37.2 1,508 108 93.1 1.16 39.9 271016 Keremeos 67 0.93 32.2 208 14 10.0 1.40 48.3 29017 Princeton 62 1.35 * 46.6 133 7 7.9 0.89 30.4 23018 Golden 145 1.21 * 41.8 347 33 18.2 1.81 * 62.3 53019 Revelstoke 137 1.04 36.1 380 33 27.2 1.22 41.8 79020 Salmon Arm 406 1.05 36.3 1,118 93 72.5 1.28 * 44.1 211021 Armstrong - Spallumcheen 140 1.02 35.3 397 21 25.1 0.84 28.8 73022 Vernon 908 1.01 35.1 2,585 196 180.1 1.09 37.4 524023 Central Okanagan 2,229 0.96 * 33.2 6,718 475 463.6 1.02 35.2 1,349024 Kamloops 1,690 1.10 * 38.1 4,440 333 313.4 1.06 36.5 912025 100 Mile House 249 1.29 * 44.7 557 44 37.1 1.19 40.7 108026 North Thompson 89 1.09 37.7 236 15 15.5 0.97 33.3 45027 Cariboo - Chilcotin 744 1.36 * 47.0 1,583 129 95.5 1.35 * 46.4 278028 Quesnel 482 1.14 * 39.4 1,223 96 77.3 1.24 * 42.7 225029 Lillooet 115 1.11 38.3 300 25 17.5 1.43 49.0 51030 South Cariboo 93 0.94 32.6 285 23 18.6 1.24 42.6 54031 Merritt 190 1.04 36.0 528 36 36.1 1.00 34.3 105032 Hope 149 1.13 39.3 379 30 25.1 1.20 41.1 73033 Chilliwack 1,580 1.12 * 38.8 4,072 370 315.9 1.17 * 40.3 919034 Abbotsford 2,743 0.99 34.5 7,961 532 543.7 0.98 33.6 1,582035 Langley 2,274 1.07 * 37.0 6,149 478 422.4 1.13 * 38.9 1,229037 Delta 1,557 0.89 * 30.9 5,034 304 329.3 0.92 31.7 958038 Richmond 2,259 0.84 * 29.1 7,770 454 533.8 0.85 * 29.2 1,553040 New Westminster 1,212 1.09 * 37.8 3,207 252 214.1 1.18 * 40.4 623041 Burnaby 3,162 0.89 * 30.7 10,290 583 699.4 0.83 * 28.6 2,035042 Maple Ridge 1,671 1.11 * 38.6 4,332 356 327.5 1.09 37.4 953043 Coquitlam 4,019 1.09 * 37.9 10,600 737 706.6 1.04 35.8 2,056044 North Vancouver 2,103 0.93 * 32.4 6,492 441 463.6 0.95 32.7 1,349045 West Vancouver-Bowen Is. 492 0.93 32.1 1,531 73 95.9 0.76 * 26.2 279046 Sunshine Coast 353 1.06 36.7 963 57 53.6 1.06 36.5 156047 Powell River 314 1.18 * 40.7 771 50 46.1 1.09 37.3 134048 Howe Sound 738 1.09 * 37.6 1,961 132 140.6 0.94 32.3 409049 Bella Coola Valley 111 1.28 * 44.2 251 22 16.2 1.36 46.8 47050 Queen Charlotte 111 0.97 33.7 329 34 22.3 1.52 * 52.3 65051 Snow Country 17 1.04 36.2 47 2 1.7 1.16 40.0 5052 Prince Rupert 371 0.99 34.4 1,079 51 59.5 0.86 29.5 173053 Upper Skeena 169 1.30 * 45.2 374 36 24.1 1.50 * 51.4 70054 Smithers 416 1.00 34.5 1,205 69 76.0 0.91 31.2 221055 Burns Lake 158 1.01 35.0 452 37 31.3 1.18 40.7 91056 Nechako 444 1.11 * 38.5 1,152 77 75.6 1.02 35.0 220057 Prince George 2,181 1.17 * 40.4 5,394 438 355.4 1.23 * 42.4 1,034059 Peace River South 552 1.10 * 38.1 1,450 111 93.5 1.19 40.8 272060 Peace River North 710 0.85 * 29.6 2,402 147 170.8 0.86 29.6 497061 Greater Victoria 2,936 0.99 34.3 8,559 615 610.7 1.01 34.6 1,777062 Sooke 1,027 1.05 36.5 2,812 222 202.8 1.09 37.6 590063 Saanich 739 1.07 37.0 1,999 152 135.1 1.13 38.7 393064 Gulf Islands 174 1.09 37.9 459 24 25.8 0.93 32.0 75065 Cowichan 837 0.99 34.2 2,450 198 172.2 1.15 * 39.5 501066 Lake Cowichan 89 1.12 38.7 230 18 17.2 1.05 36.0 50067 Ladysmith 277 1.15 * 39.7 697 59 47.1 1.25 43.1 137068 Nanaimo 1,980 1.42 * 49.3 4,015 369 282.9 1.30 * 44.8 823069 Qualicum 573 1.40 * 48.7 1,177 91 76.6 1.19 40.8 223070 Alberni 534 1.03 35.8 1,490 118 100.4 1.18 40.4 292071 Courtenay 921 1.12 * 38.8 2,375 196 159.8 1.23 * 42.2 465072 Campbell River 871 1.33 * 46.0 1,895 127 112.0 1.13 39.0 326075 Mission 788 1.07 36.9 2,133 161 144.7 1.11 38.2 421076 Agassiz - Harrison 152 1.08 37.4 406 32 34.4 0.93 32.0 100077 Summerland 153 1.17 40.6 377 24 22.7 1.06 36.4 66078 Enderby 107 1.04 36.1 296 20 20.3 0.99 33.9 59080 Kitimat 200 1.00 34.5 579 46 32.0 1.44 * 49.5 93081 Fort Nelson 111 0.70 * 24.4 455 27 37.5 0.72 24.8 109083 Central Coast 46 1.10 38.0 121 7 7.6 0.93 31.8 22084 Vancouver Island West 78 1.34 * 46.4 168 18 12.4 1.45 50.0 36085 Vancouver Island North 328 1.13 * 39.0 841 62 51.9 1.19 41.1 151087 Stikine 17 1.17 40.5 42 3 1.4 2.18 75.0 4088 Terrace 539 1.12 * 38.9 1,386 97 84.2 1.15 39.6 245092 Nisgaía 50 0.97 33.8 148 10 8.9 1.12 38.5 26094 Telegraph Creek 18 1.11 38.3 47 2 2.7 0.73 25.0 8161 Vancouver - City Centre 1,225 0.95 * 32.8 3,739 251 282.2 0.89 30.6 821162 Vancouver - Downtown E.side 777 0.98 34.1 2,279 149 157.1 0.95 32.6 457163 Vancouver - North East 1,597 0.81 * 28.2 5,669 302 370.2 0.82 * 28.0 1,077164 Vancouver - Westside 1,713 0.94 * 32.4 5,286 308 354.3 0.87 * 29.9 1,031165 Vancouver - Midtown 1,576 0.87 * 30.3 5,198 284 333.7 0.85 * 29.2 971166 Vancouver - South 1,852 0.85 * 29.3 6,314 328 441.3 0.74 * 25.5 1,284201 Surrey 6,486 0.86 * 29.8 21,733 1,332 1,524.3 0.87 * 30.0 4,435202 South Surrey/White Rock 842 1.02 35.4 2,378 180 191.8 0.94 32.3 558
PROVINCIAL TOTAL 70,274 1.00 34.7 202,804 13,857 13,857.0 1.00 34.4 40,318
PE
RIN
AT
AL
CO
MP
LIC
AT
ION
S I
N L
IVE
BIR
TH
S B
Y L
OC
AL
HE
AL
TH
AR
EA
,B
RIT
ISH
CO
LU
MB
IA,
1999
–200
3 A
ND
200
4T
able
20
Note: *Statistical testing indicates that the observed number of births with perinatal complications is signficantly different from theexpected (p<0.05, two tailed). Percent of observed births is based on total live births. Ratio-observed over the expected. Non-residentsare excluded.

B I R T H - R E L A T E D S T A T I S T I C S 5 9
N
Statistically Significant
QUINTILE (Ratio)
5 (1.167 - 1.424)
2 (0.958 - 1.038)
1 (0.704 - 0.946)
4 (1.094 - 1.147)
3 (1.040 - 1.091)
Inset 150 kms0
300 kms0 100 200
see inset 2
10 kms0Inset 2
see inset 1
FIGURE 34PERINATAL COMPLICATIONS IN LIVE BIRTHS
BY LOCAL HEALTH AREABRITISH COLUMBIA, 1999–2003
Note: Ratio - Observed over the expected. Refer to Figure 1 to clarify geographical location of Local Health Area

6 0 B I R T H - R E L A T E D S T A T I S T I C S
HIGHLIGHTS TO TABLE 20/FIGURE 34
• There were 15 Local Health Areas (LHAs) with statistically significant and high perinatal complication ratiosin 2004. The five LHAs with the highest ratios that were statistically significant (number of births withperinatal complications in parentheses) were:018 Golden (33) 1.81050 Queen Charlotte (34) 1.52053 Upper Skeena (36) 1.50080 Kitimat (46) 1.44001 Fernie (57) 1.36
• Golden, Upper Skeena, and Fernie also had statistically significant and high ratios for the 1999-2003 period.
• The eight LHAs that had statistically significant and low perinatal complication ratios in 2004 (number ofbirths with perinatal complications in parentheses) were:166 Vancouver - South (328) 0.74045 West Vancouver-Bowen Island (73) 0.76163 Vancouver - North East (302) 0.82041 Burnaby (583) 0.83038 Richmond (454) 0.85165 Vancouver - Midtown (284) 0.85201 Surrey (1,332) 0.87164 Vancouver - Westside (308) 0.87
• All of the above LHAs except West Vancouver-Bowen Island also had statistically significant and low ratiosfor 1999-2003.
• There were 28 LHAs with statistically significant and high perinatal complication ratios in 1999-2003. Thefive LHAs with the highest ratios that were statistically significant (number of births with perinatalcomplications in parentheses) were:068 Nanaimo (1,980) 1.42069 Qualicum (573) 1.40027 Cariboo-Chilcotin (744) 1.36017 Princeton (62) 1.35084 Vancouver Island West (78) 1.34
• There were 13 LHAs with statistically significant and low perinatal complication ratios in 1999-2003. The fiveLHAs with the lowest ratios that were statistically significant (number of births with perinatal complicationsin parentheses) were:081 Fort Nelson (111) 0.70163 Vancouver - North East (1,597) 0.81038 Richmond (2,259) 0.84166 Vancouver - South (1,852) 0.85060 Peace River North (710) 0.85
Vital Statistics Information Box

B I R T H - R E L A T E D S T A T I S T I C S 6 1
Vital Statistics Information BoxVital Statistics Information Box
NEURAL TUBE DEFECTS
Neural tube defects (NTDs) are the result of the neural tube failing to close properly during the
fourth week of pregnancy, a time when many women may be unaware that they are pregnant.
NTDs include anencephaly, the absence of a major portion of the brain, spina bifida, a condition
where the spinal column fails to close around the spinal cord, and encephalocele, where the
brain protrudes through an opening in the skull. If not stillborn, infants with anencephaly are
usually blind, deaf, unconscious, and unable to feel pain; typically these infants die within a few
hours or days after birth. The degree of disability from other neural tube defects can range from
almost none to paralysis.
One way to reduce the incidence of
neural tube defects is to ensure that
women who may become pregnant
meet the daily-recommended intake
of 0.4 mg of folic acid (Vitamin B12)
either through diet or vitamin
supplements. Since the
introduction of folic acid
recommendations in 1994 and the
introduction of food fortification in
1999, the incidence of other neural
tube defects (spina bifida and
encephalocele) in British Columbia appears to have fallen, although the decrease from 1993-2002
was not statistically significant. The graph presents data from the Health Status Registry Report
2005, which provides information about neural tube defects, other congenital anomalies, genetic
defects, and selected disabilities. The report is available at http://www.vs.gov.bc.ca/stats/hsr/
index.html.
The Health Status Registry is a partner in the long term national study of the impact of folic acid
fortification on the epidemiology of neural tube defects in Canada. Results of this study will be
available in a few years.
0.0
0.5
1.0
1.5
93-95 94-96 95-97 96-98 97-99 98-00 99-01 00-02
Rat
e pe
r 1,
000
Tot
al B
irths
Other Neural Tube Defects Trend
Source: Health Status Registry Report 2005
OTHER NEURAL TUBE DEFECTS TRENDS IN BRITISH COLUMBIA BIRTHS
THREE YEAR MOVING AVERAGE, 1993-2002

6 2 B I R T H - R E L A T E D S T A T I S T I C S