front cover—cover 1 natural attenuation of … · michael a. heitkamp, david j. gannon, charles...
TRANSCRIPT

United States Office of Research and EPA/540/R-97/504Environmental Protection Development May 1997Agency Washington, DC 20460
Proceedings of theSymposium on Natural Attenuation ofChlorinated Organics inGround Water
Front Cover—Cover 1
2 Printed on paper that contains atleast 20 percent postconsumer fiber.
EPA/540/R-97/504May 1997
Proceedings of the Symposium on Natural Attenuation of Chlorinated Organics
in Ground Water
Office of Research and DevelopmentU.S. Environmental Protection Agency
Washington, DC

Disclaimer
The projects described in this document have been reviewed in accordance with the peer andadministrative review policies of the U.S. Environmental Protection Agency and the U.S. Air Force,and have been approved for presentation and publication. Mention of trade names or commercialproducts does not constitute endorsement or recommendation for use.
ii
Contents
Page
Acknowledgments . . . . . . . . . . . . . . . . . . . . . . . . . . . . . . . . . . . . . . . . . . . . . . . . . . . . . . . . . . . . . . . viii
Executive Summary . . . . . . . . . . . . . . . . . . . . . . . . . . . . . . . . . . . . . . . . . . . . . . . . . . . . . . . . . . . . . . ix
Introduction . . . . . . . . . . . . . . . . . . . . . . . . . . . . . . . . . . . . . . . . . . . . . . . . . . . . . . . . . . . . . . . . . . . . . x
Where Are We Now? Moving to a Risk-Based Approach
C.H. Ward. . . . . . . . . . . . . . . . . . . . . . . . . . . . . . . . . . . . . . . . . . . . . . . . . . . . . . . . . . . . . . . . . . . . . . . . 1
Where Are We Now With Public and Regulatory Acceptance? (Resource Conservation and RecoveryAct [RCRA] and Comprehensive Environmental Response, Compensation, and Liability Act [CERCLA])
Kenneth Lovelace. . . . . . . . . . . . . . . . . . . . . . . . . . . . . . . . . . . . . . . . . . . . . . . . . . . . . . . . . . . . . . . . . . 4
Biotic and Abiotic Transformations of Chlorinated Solvents in Ground Water
Perry L. McCarty . . . . . . . . . . . . . . . . . . . . . . . . . . . . . . . . . . . . . . . . . . . . . . . . . . . . . . . . . . . . . . . . . . 7
Microbiological Aspects Relevant to Natural Attenuation of Chlorinated Ethenes
James M. Gossett and Stephen H. Zinder . . . . . . . . . . . . . . . . . . . . . . . . . . . . . . . . . . . . . . . . . . . . . . 12
Microbial Ecology of Adaptation and Response in the Subsurface
Guy W. Sewell and Susan A. Gibson . . . . . . . . . . . . . . . . . . . . . . . . . . . . . . . . . . . . . . . . . . . . . . . . . . 16
Identifying Redox Conditions That Favor the Natural Attenuation of Chlorinated Ethenes inContaminated Ground-Water Systems
Francis H. Chapelle . . . . . . . . . . . . . . . . . . . . . . . . . . . . . . . . . . . . . . . . . . . . . . . . . . . . . . . . . . . . . . . . 19
Design and Interpretation of Microcosm Studies for Chlorinated Compounds
Barbara H. Wilson, John T. Wilson, and Darryl Luce . . . . . . . . . . . . . . . . . . . . . . . . . . . . . . . . . . . . . . 23
Conceptual Models for Chlorinated Solvent Plumes and Their Relevance to Intrinsic Remediation
John A. Cherry . . . . . . . . . . . . . . . . . . . . . . . . . . . . . . . . . . . . . . . . . . . . . . . . . . . . . . . . . . . . . . . . . . . . 31
Site Characterization Tools: Using a Borehole Flowmeter To Locate and Characterize the Transmissive Zones of an Aquifer
Fred Molz and Gerald Boman . . . . . . . . . . . . . . . . . . . . . . . . . . . . . . . . . . . . . . . . . . . . . . . . . . . . . . . . 33
Overview of the Technical Protocol for Natural Attenuation of Chlorinated Aliphatic Hydrocarbons inGround Water Under Development for the U.S. Air Force Center for Environmental Excellence
Todd H. Wiedemeier, Matthew A. Swanson, David E. Moutoux, John T. Wilson, Donald H. Kampbell, Jerry E. Hansen, and Patrick Haas . . . . . . . . . . . . . . . . . . . . . . . . . . . . . . . . . . 37
The BIOSCREEN Computer Tool
Charles J. Newell, R. Kevin McLeod, and James R. Gonzales . . . . . . . . . . . . . . . . . . . . . . . . . . . . . . 62
iii
Case Study: Naval Air Station Cecil Field, Florida
Francis H. Chapelle and Paul M. Bradley . . . . . . . . . . . . . . . . . . . . . . . . . . . . . . . . . . . . . . . . . . . . . . . 66
Case Study of Natural Attenuation of Trichloroethene at St. Joseph, Michigan
James W. Weaver, John T. Wilson, and Donald H. Kampbell . . . . . . . . . . . . . . . . . . . . . . . . . . . . . . . 67
Extraction of Degradation Rate Constants From the St. Joseph, Michigan, Trichloroethene Site
James W. Weaver, John T. Wilson, and Donald H. Kampbell . . . . . . . . . . . . . . . . . . . . . . . . . . . . . . . 71
Natural Attenuation of Chlorinated Aliphatic Hydrocarbons at Plattsburgh Air Force Base, New York
Todd H. Wiedemeier, John T. Wilson, and Donald H. Kampbell . . . . . . . . . . . . . . . . . . . . . . . . . . . . . 76
Case Study: Natural Attenuation of a Trichloroethene Plume at Picatinny Arsenal, New Jersey
Thomas E. Imbrigiotta, Theodore A. Ehlke, Barbara H. Wilson, and John T. Wilson . . . . . . . . . . . . . 85
Case Study: Plant 44, Tucson, Arizona
Hanadi S. Rifai, Philip B. Bedient, and Kristine S. Burgess . . . . . . . . . . . . . . . . . . . . . . . . . . . . . . . . . 92
Remediation Technology Development Forum Intrinsic Remediation Project at Dover Air Force Base, Delaware
David E. Ellis, Edward J. Lutz, Gary M. Klecka, Daniel L. Pardieck, Joseph J. Salvo, Michael A. Heitkamp, David J. Gannon, Charles C. Mikula, Catherine M. Vogel, Gregory D. Sayles, Donald H. Kampbell, John T. Wilson, Donald T. Maiers. . . . . . . . . . . . . . . . . . . . 95
Case Study: Wurtsmith Air Force Base, Michigan
Michael J. Barcelona . . . . . . . . . . . . . . . . . . . . . . . . . . . . . . . . . . . . . . . . . . . . . . . . . . . . . . . . . . . . . . . 100
Case Study: Eielson Air Force Base, Alaska
R. Ryan Dupont, K. Gorder, D.L. Sorensen, M.W. Kemblowski, and Patrick Haas. . . . . . . . . . . . . . . 106
Considerations and Options for Regulatory Acceptance of Natural Attenuation in Ground Water
Mary Jane Nearman. . . . . . . . . . . . . . . . . . . . . . . . . . . . . . . . . . . . . . . . . . . . . . . . . . . . . . . . . . . . . . . . 112
Lessons Learned: Risk-Based Corrective Action
Matthew C. Small . . . . . . . . . . . . . . . . . . . . . . . . . . . . . . . . . . . . . . . . . . . . . . . . . . . . . . . . . . . . . . . . . . 116
Informal Dialog on Issues of Ground-Water and Core Sampling
Donald H. Kampbell . . . . . . . . . . . . . . . . . . . . . . . . . . . . . . . . . . . . . . . . . . . . . . . . . . . . . . . . . . . . . . . . 118
Appropriate Opportunities for Application—Civilian Sector (RCRA and CERCLA)
Fran Kremer . . . . . . . . . . . . . . . . . . . . . . . . . . . . . . . . . . . . . . . . . . . . . . . . . . . . . . . . . . . . . . . . . . . . . . 120
Appropriate Opportunities for Application—U.S. Air Force and Department of Defense
Patrick Haas . . . . . . . . . . . . . . . . . . . . . . . . . . . . . . . . . . . . . . . . . . . . . . . . . . . . . . . . . . . . . . . . . . . . . . 124
Intrinsic Remediation in the Industrial Marketplace
David E. Ellis . . . . . . . . . . . . . . . . . . . . . . . . . . . . . . . . . . . . . . . . . . . . . . . . . . . . . . . . . . . . . . . . . . . . . 129
Contents (continued)
Page
iv

Environmental Chemistry and the Kinetics of Biotransformation of Chlorinated Organic Compounds in Ground Water
John T. Wilson, Donald H. Kampbell, and James W. Weaver . . . . . . . . . . . . . . . . . . . . . . . . . . . . . . . 133
Future Vision: Compounds With Potential for Natural Attenuation
Jim Spain . . . . . . . . . . . . . . . . . . . . . . . . . . . . . . . . . . . . . . . . . . . . . . . . . . . . . . . . . . . . . . . . . . . . . . . . 137
Natural Attenuation of Chlorinated Compounds in Matrices Other Than Ground Water: The Future of Natural Attenuation
Robert E. Hinchee . . . . . . . . . . . . . . . . . . . . . . . . . . . . . . . . . . . . . . . . . . . . . . . . . . . . . . . . . . . . . . . . . 142
Poster Session
Anaerobic Mineralization of Vinyl Chloride in Iron(III)-Reducing Aquifer Sediments
Paul M. Bradley and Francis H. Chapelle . . . . . . . . . . . . . . . . . . . . . . . . . . . . . . . . . . . . . . . . . . . . . . . 146
Intrinsic Biodegradation of Chlorinated Aliphatics Under Sequential Anaerobic/Co-metabolic Conditions
Evan E. Cox, David W. Major, Leo L. Lehmicke, Elizabeth A. Edwards, Richard A. Mechaber,and Benjamin Y. Su . . . . . . . . . . . . . . . . . . . . . . . . . . . . . . . . . . . . . . . . . . . . . . . . . . . . . . . . . . . . . . . . 147
Analysis of Methane and Ethylene Dissolved in Ground Water
Steve Vandegrift, Bryan Newell, Jeff Hickerson, and Donald H. Kampbell . . . . . . . . . . . . . . . . . . . . . 148
Estimation of Laboratory and In Situ Degradation Rates for Trichloroethene and cis-1,2-Dichloroethenein a Contaminated Aquifer at Picatinny Arsenal, New Jersey
Theodore A. Ehlke and Thomas E. Imbrigiotta . . . . . . . . . . . . . . . . . . . . . . . . . . . . . . . . . . . . . . . . . . . 149
Measurement of Dissolved Hydrogen in Ground Water
Mark Blankenship, Francis H. Chapelle, and Donald H. Kampbell . . . . . . . . . . . . . . . . . . . . . . . . . . . 151
Evidence of Natural Attenuation of Chlorinated Organics at Ft. McCoy, Wisconsin
Jason Martin . . . . . . . . . . . . . . . . . . . . . . . . . . . . . . . . . . . . . . . . . . . . . . . . . . . . . . . . . . . . . . . . . . . . . . 152
Challenges in Using Conventional Site Characterization Data To Observe Co-metabolism ofChlorinated Organic Compounds in the Presence of an Intermingling Primary Substrate
Ian D. MacFarlane, Timothy J. Peck, and Joy E. Ligé . . . . . . . . . . . . . . . . . . . . . . . . . . . . . . . . . . . . . 153
Development of an Intrinsic Bioremediation Program for Chlorinated Solvents at an Electronics Facility
Michael J. K. Nelson, Anne G. Udaloy, and Frank Deaver. . . . . . . . . . . . . . . . . . . . . . . . . . . . . . . . . . 154
Overview of the U.S. Air Force Protocol for Remediation of Chlorinated Solvents by Natural Attenuation
Todd H. Wiedemeier, John T. Wilson, Donald H. Kampbell, Jerry E. Hansen, and Patrick Haas . . . . . . . . . . . . . . . . . . . . . . . . . . . . . . . . . . . . . . . . . . . . . . . . . . . . . . . . . . . . . . . . . . 155
Incorporation of Biodegradability Concerns Into a Site Evaluation Protocol for Intrinsic Remediation
Robert M. Cowan, Keun-Chan Oh, Byungtae Kim, and Gauri Ranganathan . . . . . . . . . . . . . . . . . . . 156
Contents (continued)
Page
v
A Field Evaluation of Natural Attenuation of Chlorinated Ethenes in a Fractured Bedrock Environment
Peter Kunkel, Chris Vaughan, and Chris Wallen. . . . . . . . . . . . . . . . . . . . . . . . . . . . . . . . . . . . . . . . . . 157
Intrinsic Bioattenuation of Chlorinated Solvents in a Fractured Bedrock System
William R. Mahaffey and K. Lyle Dokken . . . . . . . . . . . . . . . . . . . . . . . . . . . . . . . . . . . . . . . . . . . . . . . 158
Modeling Natural Attenuation of Selected Explosive Chemicals at a Department of Defense Site
Mansour Zakikhani and Chris J. McGrath . . . . . . . . . . . . . . . . . . . . . . . . . . . . . . . . . . . . . . . . . . . . . . . 159
Long-Term Application of Natural Attenuation at Sierra Army Depot
Jerry T. Wickham and Harry R. Kleiser . . . . . . . . . . . . . . . . . . . . . . . . . . . . . . . . . . . . . . . . . . . . . . . . . 160
When Is Intrinsic Bioremediation Cost-Effective? Financial-Risk Cost-Benefit Analysis at TwoChlorinated Solvent Sites
Bruce R. James, Evan E. Cox, David W. Major, Katherine Fisher, and Leo G. Lehmicke . . . . . . . . . 161
Natural Attenuation of Chlorinated Organics in Ground Water: The Dutch Situation
Lex W.A. Oosterbaan and Hans Rovers . . . . . . . . . . . . . . . . . . . . . . . . . . . . . . . . . . . . . . . . . . . . . . . . 162
Natural Attenuation as a Cleanup Alternative for Tetrachloroethylene-Affected Ground Water
Steve Nelson . . . . . . . . . . . . . . . . . . . . . . . . . . . . . . . . . . . . . . . . . . . . . . . . . . . . . . . . . . . . . . . . . . . . . 163
Natural Attenuation of Trichloroethene in a Sandy Unconfined Aquifer
Neale Misquitta, Dale Foster, Jeff Hale, Primo Marchesi, and Jeff Blankenship . . . . . . . . . . . . . . . . . 164
Analysis of Intrinsic Bioremediation of Trichloroethene-Contaminated Ground Water at Eielson Air Force Base, Alaska
Kyle A. Gorder, R. Ryan Dupont, Darwin L. Sorensen, Maria W. Kemblowski, and Jane E. McLean . . . . . . . . . . . . . . . . . . . . . . . . . . . . . . . . . . . . . . . . . . . . . . . . . . . . . . . . . . . . . . . . . . . 165
Involvement of Dichloromethane in the Intrinsic Biodegradation of Chlorinated Ethenes and Ethanes
Leo L. Lehmicke, Evan E. Cox, and David W. Major . . . . . . . . . . . . . . . . . . . . . . . . . . . . . . . . . . . . . . 166
Intrinsic Bioremediation of 1,2-Dichloroethane
Michael D. Lee, Lily S. Sehayek, and Terry D. Vandell . . . . . . . . . . . . . . . . . . . . . . . . . . . . . . . . . . . . 167
A Practical Evaluation of Intrinsic Biodegradation of Chlorinated Volatile Organic Compounds
Frederick W. Blickle, Patrick N. McGuire, Gerald Leone, and Douglas D. Macauley . . . . . . . . . . . . . 168
New Jersey’s Natural Remediation Compliance Program: Practical Experience at a Site ContainingChlorinated Solvents and Aromatic Hydrocarbons
James Peterson and Martha Mackie . . . . . . . . . . . . . . . . . . . . . . . . . . . . . . . . . . . . . . . . . . . . . . . . . . . 169
Field and Laboratory Evaluations of Natural Attenuation of Chlorinated Organics at a Complex Industrial Site
M. Alexandra De, Julia Klens, Gary Gaillot, and Duane Graves . . . . . . . . . . . . . . . . . . . . . . . . . . . . . 170
Contents (continued)
Page
vi
Assessment of Intrinsic Bioremediation of Chlorinated Aliphatic Hydrocarbons at Industrial Facilities
Marleen A. Troy and C. Michael Swindoll . . . . . . . . . . . . . . . . . . . . . . . . . . . . . . . . . . . . . . . . . . . . . . . 171
Natural Attenuation as Remedial Action: A Case Study
Andrea Putscher and Betty Martinovich . . . . . . . . . . . . . . . . . . . . . . . . . . . . . . . . . . . . . . . . . . . . . . . . 172
Patterns of Natural Attenuation of Chlorinated Aliphatic Hydrocarbons at Cape Canaveral Air Station, Florida
Matt Swanson, Todd H. Wiedemeier, David E. Moutoux, Donald H. Kampbell, and Jerry E. Hansen . . . . . . . . . . . . . . . . . . . . . . . . . . . . . . . . . . . . . . . . . . . . . . . . . . . . . . . . . . . . . . . . . . . 173
Applying Natural Attenuation of Chlorinated Organics in Conjunction With Ground-Water Extraction for Aquifer Restoration
W. Lance Turley and Andrew Rawnsley . . . . . . . . . . . . . . . . . . . . . . . . . . . . . . . . . . . . . . . . . . . . . . . . 174
A Modular Computer Model for Simulating Natural Attenuation of Chlorinated Organics in SaturatedGround-Water Aquifers
Yunwei Sun, James N. Petersen, T. Prabhakar Clement, and Brian S. Hooker . . . . . . . . . . . . . . . . . 175
State and Federal Regulatory Issues
Federal and State Meeting on Issues Impacting the Use of Natural Attenuation for Chlorinated Solventsin Ground-Water—An Overview . . . . . . . . . . . . . . . . . . . . . . . . . . . . . . . . . . . . . . . . . . . . . . . . . . . . . . . . . . . . . 179
Summary of Roundtable Discussion on Regulatory Issues . . . . . . . . . . . . . . . . . . . . . . . . . . . . . . . . . . . . . . . . 183
Appendix A
Symposium Agenda. . . . . . . . . . . . . . . . . . . . . . . . . . . . . . . . . . . . . . . . . . . . . . . . . . . . . . . . . . . . . . . . . . . . . . . 187
Contents (continued)
Page
vii
Acknowledgments
The papers abstracted in this book were presented at the Symposium on Natural Attenuation ofChlorinated Organics in Ground Water, held September 11-13, 1996, in Dallas, Texas. The sympo-sium was a joint effort of the U.S. Environmental Protection Agency’s (EPA’s) Biosystems Technol-ogy Development Program, the U.S. Air Force Armstrong Laboratory’s Environics Directorate (USAFAL/EQ) at Tyndall Air Force Base, Florida, and the U.S. Air Force Center for EnvironmentalExcellence (AFCEE) at Brooks Air Force Base, Texas. Fran Kremer and John Wilson of EPA’s Officeof Research and Development, Cathy Vogel of USAF AL/EQ, and Marty Faile and Patrick Haas ofUSAF AFCEE served as co-organizers of the symposium.
viii

Executive Summary
The U.S. Environmental Protection Agency (EPA), theU.S. Air Force Armstrong Laboratory’s Environics Direc-torate, and the U.S. Air Force Center for EnvironmentalExcellence hosted a conference entitled “Symposiumon Natural Attenuation of Chlorinated Organics inGround Water” in Dallas, Texas, September 11-13,1996. Approximately 650 people attended, includingresearchers; field personnel from federal, state, andlocal agencies; and representatives from industry andacademia. Four speakers opened the symposiumwith welcoming remarks and introductory talks on therole of natural attenuation in remediating contaminatedsites.
Fran Kremer from EPA’s Office of Research and Devel-opment (ORD) opened the symposium by welcomingthe symposium participants to Dallas. She noted that theuse of natural attenuation as a remediation strategy hasincreased exponentially over the last few years. Sheattributed much of the progress made in adopting natu-ral attenuation at appropriate sites to the collaborationof researchers and agencies like ORD and the U.S. AirForce.
Patricia Rivers from the Office of the Deputy Undersec-retary of Defense (Environmental Cleanup) spoke aboutpast and ongoing Department of Defense (DOD) effortsto clean up contaminated sites and the challenges thatDOD faces at sites that involve chlorinated solvents.She introduced several DOD efforts to foster innovativeapproaches to remediate these sites and emphasizedthat natural attenuation is an important tool at the dis-posal of remediators.
Herb Ward of Rice University followed with a talk entitled“Where Are We Now? Moving to a Risk-Based Ap-proach.” He discussed the history of regulation andremediation at Superfund sites, stating that “pump andtreat” cannot always achieve stringent cleanup levelsand is not always the most cost-efficient approach toremediating sites. Mr. Ward called for contaminatedsites to be managed based on risk assessment, ratherthan remediated to meet absolute standards. Naturalattenuation is a viable risk management tool, the useful-ness of which depends on site-specific characteristics.
Kenneth Lovelace of the Superfund Division of EPA’sOffice of Emergency and Remedial Response con-cluded the introductory talks with a presentation entitled“Where Are We Now With Public and Regulatory Accep-tance?” He emphasized EPA’s support for natural at-tenuation as a proactive remedial strategy well suited toparticular sites. Mr. Lovelace identified thorough sitecharacterization, careful monitoring of remedy progress,and contingency measures to ensure long-term reliabil-ity and protection as important factors in convincingregulators and the public to choose natural attenuationat a given site.
The 29 papers and 32 posters presented at the sympo-sium highlighted recent achievements in the use of natu-ral attenuation at particular sites, new research on theefficacy of natural attenuation, developments in sitecharacterization and modeling techniques, and theplace of natural attenuation in the current regulatoryframework. These presentations represent the state ofthe art in the use of natural attenuation as a tool inremediating hazardous waste sites.
ix

Introduction
On September 11-13, 1996, the U.S. EnvironmentalProtection Agency (EPA), the U.S. Air Force ArmstrongLaboratory’s Environics Directorate, and the U.S. AirForce Center for Environmental Excellence hosted aconference entitled, “Symposium on Natural Attenuationof Chlorinated Organics in Groundwater.” Natural at-tenuation is the biodegradation and/or chemical destruc-tion or stabilization of contaminants and can be animportant tool for stabilizing or remediating a contami-nated site.
The symposium’s principal goals were to:
• Increase understanding of the natural attenuationprocess.
• Review methods for screening sites.
• Help decision-makers determine the feasibility of us-ing natural attenuation at sites contaminated withchlorinated solvents.
• Solicit feedback from the regulatory and industrialcommunities on the appropriate application of andprotocol for natural attenuation.
The intended audience for this symposium includedregulators, the regulated community, and research sci-entists. Representatives from these groups made pres-entations at the symposium that covered the followingtopics:
• Laboratory studies and field demonstrations con-ducted in support of natural attenuation at govern-ment and industry sites.
• Methods for assessing the potential for natural at-tenuation at contaminated sites.
• Methods for measuring the effectiveness of naturalattenuation.
There are a large number of sites contaminated withchlorinated organic solvents remaining in the UnitedStates. The U.S. Department of Defense (DOD), forexample, estimates that more than 1,000 sites on 200military installations contain chlorinated organic sol-vents. Remediation will begin at 400 of these sites in thenext two years. EPA, DOD, and other involved partieshave initiated a number of efforts to foster innovativeapproaches to sites contaminated with chlorinated sol-vents. These efforts have facilitated the exchange ofinformation about the efficacy of natural attenuation asan important tool for protecting human health and theenvironment.
This document contains abstracts of paper and posterpresentations from the symposium, as well as summa-ries of a meeting and roundtable discussion on state andfederal regulatory issues affecting natural attenuation ofchlorinated solvents. The symposium agenda is in-cluded in the appendix.
x

Where Are We Now? Moving to a Risk-Based Approach
C.H. WardRice University, Houston, Texas
Setting Cleanup Goals for Ground Water
When the Comprehensive Environmental Response,Compensation, and Liability and Resource Conserva-tion and Recovery Acts were implemented in the mid-1980s, the cleanup goals for contaminants in groundwater often defaulted to concentration-based standardsfor drinking water (maximum contaminants levels orMCLs). These standards were designed for public watersupplies. Because water supply was seen as the impor-tant contribution of ground water, the application ofthese standards seemed to be relevant and appropriate.There was little awareness of the contribution of groundwater to the function of the landscape. The impact ofcontaminants that discharged from ground water to sen-sitive receptor ecosystems received less attention.
Stringent drinking water standards were selected withthe expectation that they could be met with existingpump-and-treat technology. Pump-and-treat was na-ively thought to be a quick, viable fix to ground-watercontamination. To budget for the first authorization ofSuperfund, Congress estimated a unit cost for remedia-tion that included application of pump-and-treat, thenmultiplied this estimate by the number of sites (1).
The Failure To Meet Cleanup Goals forGround Water
In the mid-1990s, a National Research Council commit-tee reviewed the performance of conventional pump-and-treat methods at 77 sites. At 69 of the sites, thecleanup goal had not been reached. Based on a bodyof science and empirical experience developed from themid-1980s to the mid-1990s, the committee identifiedfive reasons that pump-and-treat had failed to performas expected (2):
• The physical heterogeneity of the subsurface makescontaminant migration pathways extremely difficult todetect.
• Contaminants are often present as nonaqueous-phase liquids (NAPLs) that are not efficiently re-moved by pumping ground water.
• Contaminants migrate to inaccessible regions so thattheir recovery is controlled by the rate of diffusionback out of the inaccessible regions, not by the rateof ground-water extraction.
• Sorption of contaminants to subsurface materials re-sults in an underestimate of the total contaminantmass in the aquifer.
• Difficulties in characterizing the subsurface make itdifficult to extrapolate between sampling points andproduce uncertainty in engineering remedial designs.
The Ground-Water Remediation Treadmill
The default remedy selected to clean up ground watercontamination was not working at most sites. Concen-trations of contaminants in pumped wells often reachedan asymptote that was above the cleanup goal. In theinstances in which major reductions in contaminant con-centrations were achieved, the concentrations of con-taminants would often rebound after the pumps wereturned off. As a result, major funds were being expendedto operate and maintain systems that were not meetingcleanup objectives.
The NRC committee (2) evaluated alternative technolo-gies and found that a substantial amount of performancedata existed for three alternative technologies: soil va-por extraction, R.L. Raymond’s process using hydrogenperoxide for in situ bioremediation of hydrocarbons, andbioventing. The Raymond process does not work formost chlorinated solvents; in particular, it does not workfor tetrachloroethylene and trichloroethylene. Bioventingand soil vapor extraction work only in the vadose zone,not in aquifers.
The committee also evaluated developing technolo-gies that still required more controlled field studies
1

and implementation at large-scale sites to generate re-liable performance data. They considered pulsed orvariable pumping, in situ bioremediation designed forchlorinated solvents, air sparging, steam-enhanced ex-traction, in situ thermal desorption, soil flushing, and insitu chemical treatment.
It is difficult for technologies presently available or underdevelopment to consistently clean aquifers contami-nated with chlorinated solvents to drinking water MCLs.Presently, we can be more effective preventing thespread of contamination and reducing exposure.
Containment Instead of Cleanup
In the period from the early 1980s to mid-1990s, whilepump-and-treat was being implemented as a remedialtechnology, microbiologists, hydrologists, engineers,and chemists were working to develop a quantitativeunderstanding of the fate of chemical contaminants inthe subsurface. The pump-and-treat systems were be-ing monitored, and many of the ground-water contami-nants were recognized to be transformation products ofthe chlorinated solvents that were originally spilled. Forexample, cis-dichloroethylene and vinyl chloride wereoften produced from reductive dechlorination oftetrachloroethylene and trichloroethylene.
By the mid-1990s, 10 years of monitoring data existedon many chlorinated solvent plumes. At many sites,there was clear evidence that the plumes were notexpanding; some natural activity was preventing thespread of contamination. At other plumes, containmentwas not achieved, and contamination spread with theflow of ground water. The effectiveness of pump-and-treat containment should thus be compared to the con-tainment provided by the processes that naturallyattenuate contaminants in ground water. These proc-esses include biodegradation, abiotic transformation,sorption, and dilution.
Contribution of Natural Attenuation toContainment
If natural attenuation can contain the spread of contami-nation, it is the philosophical equivalent of pump-and-treat, a cap on the source, a slurry wall, or an in situreactive barrier.
Some regulators have dismissed natural attenuation asa “do nothing” approach. If site managers do nothing butcompile monitoring data on the contaminants of con-cern, the characterization is accurate. All they know isthe distribution of contaminants at their site. If site man-agers carry out careful and well-planned studies of thehydrology, geochemistry, and microbiology at their siteand use this information to understand in detail thebehavior of contaminants, they in turn can use this
understanding to make rigorous and defensible predic-tions about the prospects for the spread of contaminants.
A good characterization study to predict containment bynatural attenuation is the equivalent of reliable perform-ance data on a proactive technology for containment.Because site characterizations often require sophisti-cated sampling techniques, new analytical approaches,and state-of-the-art ground-water modeling, natural at-tenuation becomes very much a “high-tech” approach (3).
The emerging approach to risk management usesground-water science to predict the behavior of plumes,then takes advantage of natural attenuation in a com-prehensive risk management strategy. These compre-hensive strategies usually have some element of sourceremoval or source control at the hot spots, with naturalattenuation reserved for the diffuse contamination somedistance from the source.
Impacts of Ground Water on Surface-WaterEcosystems
Many plumes of chlorinated solvents discharge to sur-face water. Discharge from chlorinated solvent plumeshas been evaluated at the U.S. Army’s Picatinny Arse-nal, at the St. Joseph, Michigan, national priority list site,and at the fire training site at Plattsburgh Air Force Basein New York. Case studies on these plumes appearelsewhere in this volume.
When a plume discharges to surface water, the riskmanagement emphasis shifts. The concentration of con-taminants is much less important than the mass flux ofcontaminants to the receptor ecosystem. To managerisk associated with ground-water discharge, the loadingof contaminants to the receptor ecosystem must becompared with the loading that can be accepted withoutdamage to the receptor ecosystem. Chlorinated sol-vents do not bioaccumulate, and they rapidly volatilizeto the atmosphere. As a consequence, there is littleanecdotal evidence that discharge of chlorinated sol-vents from ground water has damaged surface-waterecosystems; nonetheless, these issues deserve sys-tematic evaluation.
The discipline of toxicological assessment of ecosys-tems has made extensive progress in the last decade.No established and widely accepted protocol for mak-ing these assessments exists, however. As a result,much of the science is not readily available to regula-tors. This makes it difficult for the regulators to partici-pate as intellectual partners in the risk assessmentand risk management process. A protocol should bedeveloped to evaluate the transfer of contaminantsfrom ground-water to surface-water ecosystems. Bydocumenting appropriate sampling methods, analyticalprocedures, procedures for interpreting the data, andmathematical models to collate and integrate data, such
2

a protocol would greatly facilitate the task of determiningthe loadings that surface-water ecosystems can receivewithout being damaged.
References
1. National Research Council. 1994. Ranking hazardous waste sitesfor remedial action. Washington, DC.
2. National Research Council. 1994. Alternatives for ground watercleanup. Washington, DC.
3. National Research Council. 1993. In situ bioremediation: Whendoes it work? Washington, DC.
3
Where Are We Now With Public and Regulatory Acceptance? (ResourceConservation and Recovery Act [RCRA] and Comprehensive Environmental
Response, Compensation, and Liability Act [CERCLA])
Kenneth Lovelace and Peter FeldmanU.S. Environmental Protection Agency,
Office of Emergency and Remedial Response (Superfund),Washington, DC
Introduction
The U.S. Environmental Protection Agency (EPA) re-mains committed to the goal of restoring contaminatedground waters to their beneficial uses. The Agency alsocontinues to support the use of natural attenuation as arestoration method. EPA recognizes that, in certain cir-cumstances, remedies using natural attenuation can bemore cost effective than “active” remediation ap-proaches in achieving cleanup objectives equally pro-tective of human health and the environment. TheAgency also recognizes that many technical questionsremain to be answered regarding the efficacy of thisapproach, which underscores the importance of contin-ued scientific research as well as the need to employremedies that use natural attenuation in a consistentand responsible manner.
What Is Natural Attenuation?
Natural attenuation is discussed in the preamble of theNational Oil and Hazardous Substances Pollution Con-tingency Plan (NCP), which is the regulatory frameworkfor the Superfund program (1). In the NCP, natural at-tenuation is described as a process that “will effectivelyreduce contaminants in the ground water” to concentra-tions “protective of human health and sensitive ecologi-cal environments in a reasonable timeframe.” The NCPgoes on to recognize that natural attenuation may in-clude any or all of the following processes:
• Biodegradation
• Dilution
• Dispersion
• Adsorption
Thus, the NCP definition includes biodegradation, whichalters or destroys the contamination, as well as physicalprocesses that lower the concentrations and availabilityof contaminants without necessarily altering the chem-istry. Other processes not mentioned in the NCP are notnecessarily excluded from the definition (e.g., volatiliza-tion). Other EPA remediation programs also recognizethis definition, including the Corrective Action programunder the Resource Conservation and Recovery Act(RCRA) and Underground Storage Tank (UST) pro-grams.
Some terms, such as “intrinsic remediation” or “passiveremediation,” are essentially equivalent to the NCP’sdefinition of natural attenuation. Other terms used inrecent literature, including “intrinsic bioremediation” or“in situ bioremediation,” appear to be more restrictive inscope than “natural attenuation.” In addition, naturalattenuation is the term used in existing EPA guidance(e.g., U.S. EPA [2]).
Regulatory Framework
Natural attenuation is recognized as a legitimate reme-dial approach for ground-water cleanup under the Su-perfund, RCRA Corrective Action, and UST remediationprograms. A directive clarifying EPA’s policy regardingthe use of natural attenuation for remediation of sitesregulated under these programs is currently in develop-ment (3). Remedies selected for contaminated groundwater (and for other media) under these programs mustprotect human health and the environment, regardlessof the particular remediation technology or approachselected. Remedies may achieve protection through amix of treatments that reduce or destroy contaminants;containment and other engineering controls, which limitexposure; and other means identified as part of the
4

remedy selection process. Each EPA program offersguidance suggesting when specific methods of protec-tion may be more appropriate than others.
EPA recognizes that natural attenuation may be an ap-propriate remediation method for contaminated groundwater under the right circumstances. Natural attenuationshould continue to be carefully evaluated along withother viable remedial approaches or technologies withinthe existing remedy selection framework. Natural at-tenuation is not to be considered a default or presump-tive remedy for a given site under any of these EPAprograms.
Cleanup policies for Superfund have addressed theuse of natural attenuation in some detail; most ofthe relevant discussion can be found in the NCP pream-ble. The following NCP language specifies the definitionand cleanup expectation for remedies using naturalattenuation:
[S]election of natural attenuation by EPA does notmean that the ground water has been written off andnot cleaned up but rather that biodegradation, dis-persion, dilution, and adsorption will effectively re-duce contaminants in the ground water toconcentrations protective of human health in a time-frame comparable to that which could be achievedthrough active restoration. . . .(1).
Thus, the NCP expects that a remedy employing naturalattenuation will be fully protective and attain the requiredcleanup levels for the aquifer in a timeframe that is notunreasonably long. Since the other EPA remediationprograms present similar expectations, use of naturalattenuation as a remedy does not reduce EPA’s respon-sibility to protect human health and the environment andto satisfy the cleanup levels and other remediation ob-jectives selected for a given site. In short, use of naturalattenuation does not imply that EPA has agreed to a “noaction” remedy or that EPA or responsible parties may“walk away” from their remedial obligations at a site.
When Is Natural Attenuation Appropriate?
Because of the longer timeframes needed for remedia-tion strategies using natural attenuation, such an ap-proach is best suited for sites where there is no demandfor the ground water in the near future. For example,where adequate alternate water sources are available,future demand for the contaminated ground water islikely to be low. Also, the timeframe required for naturalattenuation should be reasonable compared with moreactive alternatives. Other site conditions that favor theuse of natural attenuation as a remediation approachare discussed below.
Large, Dilute Contaminant Plumes
The types of contaminants, their concentrations, andhydrogeologic conditions should indicate that naturalattenuation is a viable remediation approach for a givensite. Natural attenuation is more likely to be an appropri-ate remediation approach at sites with large plumes andrelatively low contaminant concentrations. For thesetypes of sites, required cleanup le vels might beattainable in a reasonable timeframe using natural at-tenuation and at a much lower cost than other alterna-tives.
Sources Controlled or Controllable
Natural attenuation will not be effectively used to reachdesired cleanup levels if the rate of contamination en-tering ground water exceeds the rate of the naturalattenuation processes. Therefore, the natural attenu-ation approach shall not be used unless contaminantsources have been controlled or site characterizationdata indicate that the sources are no longer present.Measures for controlling contaminant sources, includeremoval, treatment, or containment of source materials.Sources of contaminants to ground water could includesurface facilities, landfill wastes, contaminated soils, ornonaqueous-phase liquids (NAPLs) in the subsurface.
Protected Drinking Water orEnvironmental Resources
Cross contamination of other aquifers or discharge ofcontamination to surface waters or sensitive ecologicalenvironments is more likely if contamination is left in thesubsurface for long periods. Site conditions should indi-cate a low potential for migration of contaminants intouncontaminated media, or measures for controllingplume migration should be included in remedies usingnatural attenuation. In addition, the issue of whether“daughter” products of natural attenuation will pose asignificant risk must be addressed.
Combining Natural Attenuation WithOther Methods
For sites where natural attenuation alone is not capableof achieving desired cleanup levels in a reasonabletimeframe, natural attenuation combined with more ac-tive remediation methods may prove to be effective.Some areas of the plume may require a much longertime to attenuate naturally than others, such as areaswith relatively high contaminant levels (“hot spots”). Inthis situation, natural attenuation of dilute plume areascombined with extraction and treatment to controlsource areas and remediate plume hot spots may be aneffective remediation approach, especially for siteswhere dilute portions of the plume cover a relativelylarge area.
5
In some cases, it may be appropriate for natural attenu-ation to be used as a followup to active remediation. Inthis approach, active measures are used to reduce con-taminant concentrations, followed by natural attenuationas the final stage of remediation.
Promoting Regulatory and PublicAcceptance
In general, promoting acceptance of natural attenuationwill require detailed site characterization and analysis todemonstrate that this approach will achieve remediationgoals, careful monitoring of remediation progress, andidentification of contingency measures. These provi-sions are necessary to convince regulatory agenciesand the public that natural attenuation is a valid reme-diation approach rather than a “walkaway” and that it willbe sufficiently protective.
Building confidence in the approach can also be pro-moted by involving the responsible regulatory agenciesas early in the process as possible. For example, up-front agreement on the type of characterization dataneeded to demonstrate the efficacy of natural attenu-ation can save considerable effort later in the remedyselection process.
Detailed Site Characterization
Convincing regulatory officials and local citizens thatnatural attenuation will be effective starts with a detailedsite characterization and a clear conceptual model ofsite conditions. A conceptual model of how natural at-tenuation will perform at a given site is essential to showthat natural attenuation will be effective and that poten-tial adverse impacts to human health and the environ-ment can be prevented over the long period required forcleanup. The burden of proving the viability of naturalattenuation is on the proponent, not the regulator.
Site-specific data should be used to demonstrate thatthe required cleanup levels can be attained in a reason-able timeframe compared with other remedial alterna-tives. Such a demonstration can be supported by thefollowing types of site data:
• Contaminant concentrations have decreased overtime.
• Geochemical or microbiological parameters are char-acterized to the extent needed to support predictivemodels.
• Predictive models show required cleanup levels willbe attained in a timeframe that is reasonable for thesite.
Exposure Prevention Measures
Prevention of exposure to contaminated ground waterover the long period required for cleanup is critical to
ensure protectiveness. Remedies using natural attenu-ation should include effective measures for ensuring thatcontaminated ground water does not reach public orprivate wells, or for providing effective treatment prior touse.
Performance Monitoring
A thorough monitoring network and plan are necessaryto evaluate the progress of natural attenuation. Reme-dies using natural attenuation should include a monitor-ing plan to ensure that the remedy’s performancematches predictions, there are no adverse impacts, andunanticipated events can be detected in time to developan appropriate response.
Contingency Measures
Contingencies for initiating active remediation measuresshould be incorporated into strategies using natural at-tenuation. Such contingencies provide assurance thatthe remedy’s protectiveness will be maintained shouldnatural attenuation not progress as expected. The trig-ger(s) for implementing such contingencies should beclearly spelled out in site decision documents.
Summary
EPA believes that natural attenuation should continue toplay an important role in the cleanup of sites with con-taminated ground water. Furthering the technical under-standing of the underlying treatment processes andpromoting the responsible use of this remediationmethod should serve to enhance the role that naturalattenuation plays in restoring the nation’s ground water.Greater regulatory and public acceptance of natural at-tenuation will require demonstrating that such remedieswill be effective in meeting remediation goals and inprotecting human health and the environment over thelong period required for cleanup. Demonstrating theeffectiveness of remedies using natural attenuation willinvolve thorough site characterization, careful monitor-ing of remedy progress, and contingency measures toensure long-term reliability and protectiveness.
References
1. U.S. EPA. 1990. National Oil and Hazardous Substances PollutionContingency Plan: Final rule (NCP). Fed. Reg. 55(46):8733-8734.March 8.
2. U.S. EPA. 1988. Guidance on remedial actions for contaminatedground water at Superfund sites. Office of Solid Waste and Emer-gency Response Directive 9283.1-2 EPA/540/G-88/003 (Decem-ber).
3. U.S. EPA. 1996. Use of natural attenuation at Superfund, RCRACorrective Action, and UST remediation sites. Draft directiveavailable in Fall 1996 or Winter 1997. Office of Solid Waste andEmergency Response.
6

Biotic and Abiotic Transformations of Chlorinated Solvents in Ground Water
Perry L. McCartyStanford University, Department of Civil Engineering, Stanford, California
Introduction
Chlorinated solvents and their natural transformationproducts represent the most prevalent organic ground-water contaminants in the country. These solvents, con-sisting primarily of chlorinated aliphatic hydrocarbons(CAHs), have been used widely for degreasing of air-craft engines, automobile parts, electronic components,and clothing. Only during the past 15 years has it be-come recognized that CAHs can be transformed biologi-cally (1). Such transformations sometimes occur underthe environmental conditions present in an aquifer in theabsence of planned human intervention, a processcalled natural attenuation or intrinsic biotransformation (2).
The major chlorinated solvents are carbon tetrachloride(CT), tetrachloroethene (PCE), trichloroethene (TCE),and 1,1,1-trichloroethane (TCA). These compounds canbe transformed by chemical and biological processes insoils to form a variety of other CAHs, including chloro-form (CF), methylene chloride (MC), cis- and trans-1,2-dichloroethene (cis-DCE, t-DCE), 1,1-dichloroethene(1,1-DCE), vinyl chloride (VC), 1,1-dichloroethane(DCA), and chloroethane (CA). Abiotic or chemicaltransformations of some CAHs can occur within the timeframe of interest in ground water. CAHs can also betransformed through the action of aerobic or anaerobicmicroorganisms. In some cases, such transformationsmay be co-metabolic, that is, fortuitous transformationbrought about by enzymes that microorganisms are us-ing for other purposes. In such cases, the transformingmicroorganisms must be actively growing, which re-quires the presence of primary substrates. In othercases, the microorganisms may be using the CAHs inenergy metabolism, a condition now being commonlyfound under anaerobic conditions. These are uniquereactions, because the microorganisms use CAHs aselectron acceptors just as aerobic organisms use oxy-gen. This in turn requires a suitable electron donor suchas hydrogen or organic compounds. Transformationsthat are likely to occur in ground water and the environ-mental conditions required are discussed below.
Chemical Transformation
TCA is the only major chlorinated solvent that can betransformed chemically in ground water under all likelyconditions within the one- to two-decade time span ofgeneral interest, although chemical transformation of CTthrough reductive processes is a possibility. TCA chemi-cal transformation occurs by two different pathways, lead-ing to the formation of 1,1-DCE and acetic acid (HAc):
The rate of each chemical transformation is given by thefirst-order reaction:
C = Coe-kt (Eq. 3)
where C is the concentration of TCA at any time t, Co
represents the initial concentration at t = 0, and k is atransformation rate constant. The overall rate constantfor TCA transformation (kTCA) is equal to the sum of theindividual rate constants (kDCE + kHAc). The transforma-tion rate constants are functions of temperature:
k = Ae-E/0.008314K (Eq. 4)
where A and E are constants and K is the temperaturein degrees Kelvin. Table 1 lists A and E values for TCAabiotic transformation reported by various investigators,as well as calculated values for the TCA transformationrate constant for 10°C, 15°C, and 20°C using Equation4. Also given is the average calculated TCA half-lifebased upon t1/2 = 0.69/k. The temperature effect onTCA half-life is quite significant.
7

Cline and Delfino (4) found that kDCE equaled about 21percent of KTCA, and Haag and Mill (3) found it to be 22percent. This means that almost 80 percent of the TCAis transformed into acetic acid. The 20-plus percent thatis converted to 1,1-DCE is of great significance, how-ever, because 1,1-DCE is considered more toxic thanTCA, with an MCL of 7 micrograms per liter (µg/L)compared with TCA’s MCL of 200 µg/L. Whenever TCAis present as a contaminant, 1,1-DCE can also be ex-pected. In general, TCA is probably the main source of1,1-DCE contamination found in aquifers.
CA, formed through biological transformation of TCA,can also be chemically transformed with a half-life onthe order of months by hydrolysis to ethanol, which canthen be biologically converted to acetic acid and harm-less products (6).
Biological Transformation
CAHs can be oxidized or reduced, generally throughco-metabolism, as noted in Table 2. In ground water,reductive transformations are most often noted, perhapsbecause the presence of intermediate products that areformed provide strong evidence that reductive transfor-mations are taking place. Co-metabolic aerobic transfor-mation of TCE is also possible, although if it did occurthe intermediate products formed are unstable and moredifficult, analytically, to measure. Thus, convincing evi-dence for the latter is more difficult to obtain. Also,
aerobic co-metabolism of TCE would only occur if suffi-cient dissolved oxygen and a suitable electron donor,such as methane, ammonia, or phenol, were present.Since circumstances under which the proper environ-mental conditions for significant aerobic co-metabolismare not likely to occur often, natural attenuation by aerobicco-metabolism of TCE is probably of little significance.
Ample evidence suggests that anaerobic reductivetransformation of CAHs occurs frequently, however, andthis process is of importance to the transformation of allchlorinated solvents and their transformation products.The major environmental requirement is the presence ofsufficient concentrations of other organics that can serveas electron donors for energy metabolism, which is oftenthe case in aquifers. Indeed, the extent to which reduc-tive dehalogenation occurs may be limited by theamount of these co-contaminants present. Theoretically,it would require only a 0.4-gram chemical oxygen de-mand (COD) equivalent of primary substrate to convert1 gram of PCE to ethene (7), but many times more thanthis is actually required because of competition by othermicroorganisms for the electron donors present.
Figure 1 illustrates the potential chemical and biologicaltransformation pathways for the four major chlorinatedsolvents under anaerobic environmental conditions (6).Freedman and Gossett (8) provided the first evidencefor conversion of PCE and TCE to ethene, and de Bruinet al. (9) reported complete reduction to ethane. Table 3
Table 1. Reported First-Order TCA Abiotic Transformation Rates (k TCA)
kTCA(yr -1)
A yr-1 E kJ 10°C 15°C 20°C References
3.47 (10)20 118.0 0.058 0.137 0.32 3
6.31 (10)20 119.3 0.060 0.145 0.34 4
1.56 (10)20 116.1 0.058 0.137 0.31 5
Average half-life (yr) 12 4.9 0.95
Table 2. Conditions for Biotic and Abiotic Transformations of Chlorinated Solvents
Carbon Tetrachloride(CTC)
Trichloroethene(PCE)
Tetrachloroethene(TCE)
1,1,1-Trichloroethane(TCA)
Biotic—Aerobic
Primary substrate No No No No
Co-metabolism No No Yes Perhaps
Biotic—Anaerobic
Primary substratea Perhaps Yes Yes Perhaps
Co-metabolism Yes Yes Yes Yes
Hazardous intermediates Yes Yes Yes Yes
Abiotic Perhaps No No Yes a Can be used as electron acceptor in energy metabolism.
8
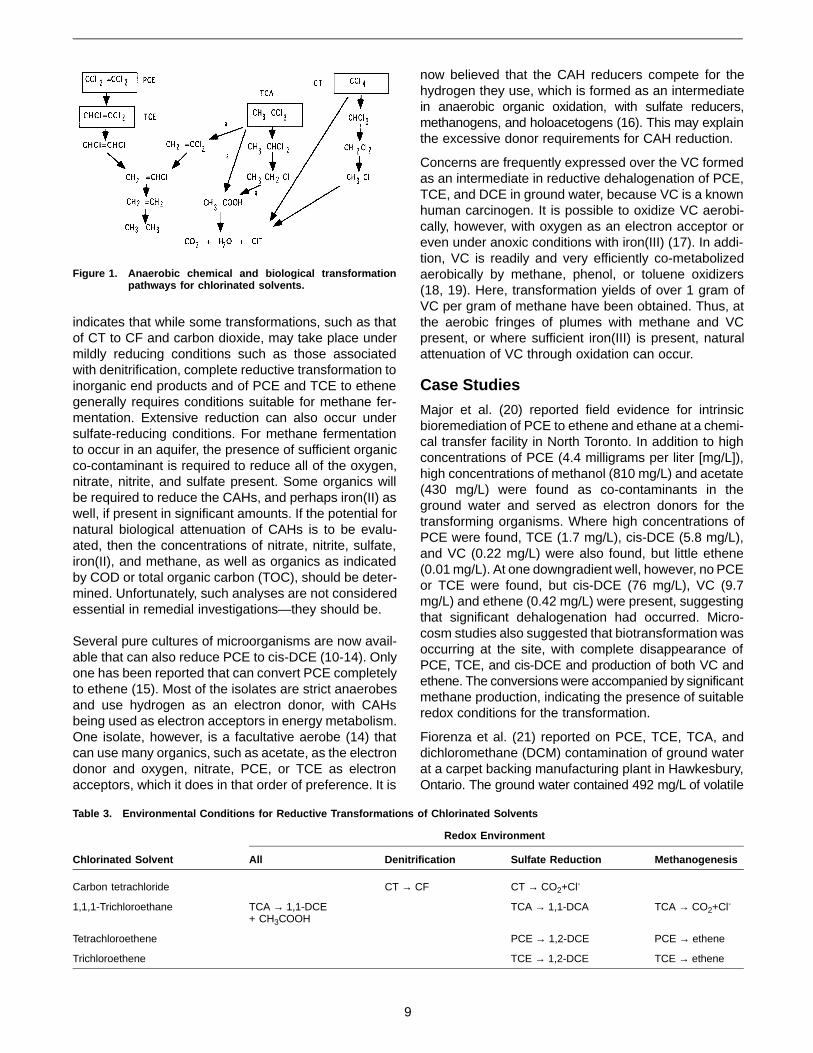
indicates that while some transformations, such as thatof CT to CF and carbon dioxide, may take place undermildly reducing conditions such as those associatedwith denitrification, complete reductive transformation toinorganic end products and of PCE and TCE to ethenegenerally requires conditions suitable for methane fer-mentation. Extensive reduction can also occur undersulfate-reducing conditions. For methane fermentationto occur in an aquifer, the presence of sufficient organicco-contaminant is required to reduce all of the oxygen,nitrate, nitrite, and sulfate present. Some organics willbe required to reduce the CAHs, and perhaps iron(II) aswell, if present in significant amounts. If the potential fornatural biological attenuation of CAHs is to be evalu-ated, then the concentrations of nitrate, nitrite, sulfate,iron(II), and methane, as well as organics as indicatedby COD or total organic carbon (TOC), should be deter-mined. Unfortunately, such analyses are not consideredessential in remedial investigations—they should be.
Several pure cultures of microorganisms are now avail-able that can also reduce PCE to cis-DCE (10-14). Onlyone has been reported that can convert PCE completelyto ethene (15). Most of the isolates are strict anaerobesand use hydrogen as an electron donor, with CAHsbeing used as electron acceptors in energy metabolism.One isolate, however, is a facultative aerobe (14) thatcan use many organics, such as acetate, as the electrondonor and oxygen, nitrate, PCE, or TCE as electronacceptors, which it does in that order of preference. It is
now believed that the CAH reducers compete for thehydrogen they use, which is formed as an intermediatein anaerobic organic oxidation, with sulfate reducers,methanogens, and holoacetogens (16). This may explainthe excessive donor requirements for CAH reduction.
Concerns are frequently expressed over the VC formedas an intermediate in reductive dehalogenation of PCE,TCE, and DCE in ground water, because VC is a knownhuman carcinogen. It is possible to oxidize VC aerobi-cally, however, with oxygen as an electron acceptor oreven under anoxic conditions with iron(III) (17). In addi-tion, VC is readily and very efficiently co-metabolizedaerobically by methane, phenol, or toluene oxidizers(18, 19). Here, transformation yields of over 1 gram ofVC per gram of methane have been obtained. Thus, atthe aerobic fringes of plumes with methane and VCpresent, or where sufficient iron(III) is present, naturalattenuation of VC through oxidation can occur.
Case Studies
Major et al. (20) reported field evidence for intrinsicbioremediation of PCE to ethene and ethane at a chemi-cal transfer facility in North Toronto. In addition to highconcentrations of PCE (4.4 milligrams per liter [mg/L]),high concentrations of methanol (810 mg/L) and acetate(430 mg/L) were found as co-contaminants in theground water and served as electron donors for thetransforming organisms. Where high concentrations ofPCE were found, TCE (1.7 mg/L), cis-DCE (5.8 mg/L),and VC (0.22 mg/L) were also found, but little ethene(0.01 mg/L). At one downgradient well, however, no PCEor TCE were found, but cis-DCE (76 mg/L), VC (9.7mg/L) and ethene (0.42 mg/L) were present, suggestingthat significant dehalogenation had occurred. Micro-cosm studies also suggested that biotransformation wasoccurring at the site, with complete disappearance ofPCE, TCE, and cis-DCE and production of both VC andethene. The conversions were accompanied by significantmethane production, indicating the presence of suitableredox conditions for the transformation.
Fiorenza et al. (21) reported on PCE, TCE, TCA, anddichloromethane (DCM) contamination of ground waterat a carpet backing manufacturing plant in Hawkesbury,Ontario. The ground water contained 492 mg/L of volatile
Figure 1. Anaerobic chemical and biological transformationpathways for chlorinated solvents.
Table 3. Environmental Conditions for Reductive Transformations of Chlorinated Solvents
Redox Environment
Chlorinated Solvent All Denitrification Sulfate Reduction Methanogenesis
Carbon tetrachloride CT → CF CT → CO2+Cl-
1,1,1-Trichloroethane TCA → 1,1-DCE+ CH3COOH
TCA → 1,1-DCA TCA → CO2+Cl-
Tetrachloroethene PCE → 1,2-DCE PCE → ethene
Trichloroethene TCE → 1,2-DCE TCE → ethene
9
fatty acids and 4.2 mg/L of methanol, organics thatappeared to serve as electron donors for dehalogena-tion. Sulfate was nondetected, but the concentration innative ground water was about 15 to 18 mg/L. Totaldissolved iron was quite high (19.5 mg/L) and above theupgradient concentration of 2.1 mg/L. Methane was pre-sent. This supports conditions suitable for natural biode-gradation of the chlorinated solvents. While somechemical transformation of TCA to 1,1-DCE was indi-cated (0.4 mg/L) biotransformation was extensive, asindicated by a 1,1-DCA concentration of 7.2 mg/L, com-pared with the TCA concentration of 5.5 mg/L. Some CAwas also present (0.19 mg/L). Transformation was alsoindicated for PCE and TCE because the cis-DCE, VC,and ethene concentrations were 56, 4.2, and 0.076mg/L, respectively. Only traces of ethane were found.Downgradient from the lagoon, the dominant productswere cis-DCE (4.5 mg/L), VC (5.2 mg/L), and 1,1-DCA(2.1 mg/L). While good evidence for natural attenuationexists for this site, the ethene and ethane concentrationswere low compared with the VC concentration, suggest-ing that biotransformation was not eliminating the chlo-rinated solvent hazard at the site, although it wasproducing compounds that may be more susceptible toaerobic co-metabolism.
Evidence for intrinsic biotransformation of chlorinatedsolvents has also been provided from analyses of gasfrom municipal refuse landfills where active methanefermentation exists. A summary by McCarty and Rein-hard (22) of data from Charnley et al. (23) reportedaverage gaseous concentrations in parts per million byvolume from eight refuse landfills as PCE, 7.15; TCE,5.09; cis-DCE, not measured; trans-DCE, 0.02; and VC,5.6. While these averages indicate that, in general,transformation was not complete, the high VC concen-tration indicates the transformation was significant. ForTCA, gaseous concentrations were TCA, 0.17; 1,1-DCE, 0.10; 1,1-DCA, 2.5; and CA, 0.37. These dataindicate that TCA biotransformation was quite extensive,with the transformation intermediate, 1,1-DCA, presentat quite significant levels, as is frequently found inground water.
Perhaps the most extensively studied and reported in-trinsic chlorinated solvent biodegradation is that at theSt. Joseph, Michigan, Superfund site (7, 24-27).Ground-water concentrations of TCE as high as 100mg/L were found, with extensive transformation to cis-DCE, VC, and ethene. A high but undefined COD (400mg/L) in ground water, resulting from waste leachingfrom a disposal lagoon, provided the energy source forthe co-metabolic reduction of TCE. Nearly completeconversion of the COD to methane provided evidenceof the ideal conditions for intrinsic bioremediation (7).Extensive analysis near the source of contaminationindicated that 8 to 25 percent of the TCE had beenconverted to ethene and that up to 15 percent of the
reduction in COD in this zone was associated with re-ductive dehalogenation (25). Through more extensiveanalysis of ground water further downgradient from thecontaminating source, Wilson et al. (26) found a 24-foldreduction in CAHs across the site. The great extent ofaerobic co-metabolic VC transformation in the methanepresent suggests that aerobic oxidation at the plumefringes is likely to be occurring (18). A review of the dataat individual sampling points indicated that conversionof TCE to ethene was most complete where methaneproduction was highest and removal of nitrate and sul-fate by reduction was most complete.
Since the above early reports, many others have re-ported on the natural biological attenuation of CAHs inground water, all showing conversion of PCE, TCE, orTCA to nonchlorinated end points (28-31). Whethercomplete dehalogenation is likely to occur over time atthese sites is still not clear. Review of this literature by thereader interested in these processes is recommended.
References 1. McCarty, P.L., and L. Semprini. 1994. Ground-water treatment for
chlorinated solvents. In: Norris, R.D., ed. Handbook of bioreme-diation. Boca Raton, FL: Lewis Publishers. pp. 87-116.
2. National Research Council. 1993. In situ bioremediation. Whendoes it work? Washington, DC: National Academy Press. p. 207.
3. Haag, W.R., and T. Mill. 1988. Transformation kinetics of 1,1,1-trichloroethane to the stable product 1,1-dichloroethene. Environ.Sci. Technol. 22:658-663.
4. Cline, P.V., and J.J. Delfino. 1989. Effect of subsurface sedimenton hydrolysis of haloalkanes and epoxides. In: Larson, R.A., ed.Biohazards of drinking water treatment. Chelsea, MI: Lewis Pub-lishers, Inc. pp. 47-56.
5. Jeffers, P., L. Ward, L. Woytowitch, and L. Wolfe. 1989. Homo-geneous hydrolysis rate constants for selected chlorinated meth-anes, ethanes, ethenes, and propanes. Environ. Sci. Technol.23(8):965-969.
6. Vogel, T.M., C.S. Criddle, and P.L. McCarty. 1987. Transforma-tions of halogenated aliphatic compounds. Environ. Sci. Technol.21:722-736.
7. McCarty, P.L., and J.T. Wilson. 1992. Natural anerobic treatmentof a TCE plume, St. Joseph, Michigan, NPL site. In: U.S. EPA.Bioremediation of hazardous wastes. EPA/600/R-92/126. Cincin-nati, OH. pp. 47-50.
8. Freedman, D.L., and J.M. Gossett. 1989. Biological reductivedechlorination of tetrachloroethylene and trichloroethylene to eth-ylene under methanogenic conditions. Appl. Environ. Microbiol.55:2144-2151.
9. de Bruin, W.P., M.J.J. Kotterman, M.A. Posthumus, G. Schraa,and A.J.B. Zehnder. 1992. Complete biological reductive trans-formation of tetrachloroethene to ethane. Appl. Environ. Micro-biol. 58:1996-2000.
10. Holliger, C., G. Schraa, A.J.M. Stams, and A.J.B. Zehnder. 1993.A highly purified enrichment culture couples the reductivedechlorination of tetrachloroethene to growth. Appl. Environ. Mi-crobiol. 59:2991-2997.
11. Neumann, A., H. Scholz-Muramatsu, and G. Dickert. 1994.Tetrachloroethene metabolism of Dehalospirillum multivorans.Arch. Microbiol. 162:295-301.
10

12. Scholz-Muramatsu, H., A. Neumann, M. MeBmer, E. Moore, andG. Diekert. 1995. Isolation and characterization of Dehalospiril-lum multivorans gen. sp. nov., a tetrachloroethene-utilizing,strictly anaerobic bacterium. Arch. Microbiol. 163:48-56.
13. Holliger, C., and W. Schumacher. 1994. Reductive dehalogena-tion as respiratory process. Antonie Van Leeuwenhoek 66:239-246.
14. Sharma, P., and P.L. McCarty. 1996. Isolation and charac-terization of facultative aerobic bacterium that reductively deha-logenates tetrachlorethene to cis-1,2-dichloroethene. Appl.Environ. Microbiol. 62:761-765.
15. Maymo-Gatell, X., Y.T. Chien, T. Anguish, J. Gossett, and S.Zinder. 1996. Isolation and characterization of an anaerobiceubacterium which reductively dechlorinates tetrachloroethene(PCE) to ethene. In: Abstracts of the 96th General Meeting of theAmerican Society of Microbiology, New Orleans. pp. Q-126.
16. Fennel, D.E., M.A. Stover, S.H. Zinder, and J.M. Gossett. 1995.Comparison of alternative electron donors to sustain PCE an-aerobic reductive dechlorination. In: Hinchee, R.E., A. Leeson,and L. Semprini, eds. Bioremediation of chlorinated solvents.Columbus, OH: Battelle Press. pp. 9-16.
17. Bradley, P.M., and F.H. Chapelle. 1996. Anaerobic mineralizationof vinyl chloride in Fe(III)-reducing aquifer sediments. Environ.Sci. Technol. 30:2084-2086.
18. Dolan, M.E., and P.L. McCarty. 1995. Small-column microcosmfor assessing methane-stimulated vinyl chloride transformation inaquifer samples. Environ. Sci. Technol. 29:1892-1897.
19. Hopkins, G.D., and P.L. McCarty. 1995. Field evaluation of in situaerobic cometabolism of trichloroethylene and three dichlo-roethylene isomers using phenol and toluene as the primary sub-strates. Environ. Sci. Technol. 29:1628-1637.
20. Major, D.W., W.W. Hodgins, and B.J. Butler. 1991. Field andlaboratory evidence of in situ biotransformation of tetrachlo-roethene to ethene and ethane at a chemical transfer facility inNorth Toronto. In: Hinchee, R.E., and R.F. Olfenbuttel, eds. On-site bioreclamation. Stoneham, MA: Butterworth- Heinemann. pp.147-171.
21. Fiorenza, S., E.L. Hockman, Jr., S. Szojka, R.M. Woeller, andJ.W. Wigger. 1994. Natural anaerobic degradation of chlorinatedsolvents at a Canadian manufacturing plant. In: Hinchee, R.E.,A. Leeson, L. Semprini, and S. Kom, eds. Bioremediation ofchlorinated and polycyclic aromatic hydrocarbon compounds.Boca Raton, FL: Lewis Publishers. pp. 277-286.
22. McCarty, P.L., and M. Reinhard. 1993. Biological and chemicaltransformations of halogenated aliphatic compounds in aquaticand terrestrial environments in the biochemistry of global change.In: Oremland, R.S., ed. The biogeochemistry of global change:Radiative trace gases. New York, NY: Chapman & Hall. pp. 839-852.
23. Charnley, G., E.A.C. Crouch, L.C. Green, and T.L. Lash. 1988.Municipal solid waste landfilling: A review of environmental ef-fects. Prepared by Meta Systems, Inc., Cambridge, MA.
24. McCarty, P.L., L. Semprini, M.E. Dolan, T.C. Harmon, C. Tiede-man, and S.M. Gorelick. 1991. In situ methanotrophic bioreme-diation for contaminated groundwater at St. Joseph, Michigan. In:Hinchee, R.E., and R.G. Olfenbuttel, eds. In: On-site bioreclama-tion processes for xenobiotic and hydrocarbon treatment. Boston,MA: Butterworth-Heinemann. pp. 16-40.
25. Semprini, L., P.K. Kitanidis, D.H. Kampbell, and J.T. Wilson. 1995.Anaerobic transformation of chlorinated aliphatic hydrocarbons ina sand aquifer based on spatial chemical distributions. WaterResour. Res. 31(4):1051-1062.
26. Wilson, J.T., J.W. Weaver, and D.H. Kampbell. 1994. Intrinsicbioremediation of TCE in ground water at an NPL site in St.Joseph, Michigan. In: U.S. EPA Symposium on Intrinsic Bioreme-diation of Ground Water. EPA/540/R-94/515. Washington, DC.
27. Haston, Z.C., P.K. Sharma, J.N. Black, and P.L. McCarty. 1994.Enhanced reductive dechlorination of chlorinated ethenes. In:U.S. EPA Symposium on Bioremediation of Hazardous Wastes:Research, Development, and Field Evaluation. EPA/600/R-94/075. Washington, DC. pp. 11-14.
28. Major, D., E. Cox, E. Edwards, and P. Hare. 1995. Intrinsicdechlorination of trichloroethene to ethene in a bedrock aquifer.In: Hinchee, R.E., J.T. Wilson, and D.C. Downey, eds. Intrinsicbioremediation. Columbus, OH: Battelle Press. pp. 197-203.
29. Lee, M.D., P.F. Mazierski, R.J. Buchanan, D.E. Ellis, and L.S.Sehayek. 1995. Intrinsic in situ anaerobic biodegradation of chlo-rinated solvents at an industrial landfill. In: Hinchee, R.E., J.T.Wilson, and D.C. Downey, eds. Intrinsic bioremediation. Colum-bus, OH: Battelle Press. pp. 205-222.
30. Cox, E., E. Edwards, L. Lehmicke, and D. Major. 1995. Intrinsicbiodegradation of trichloroethene and trichloroethane in a se-quential anaerobic-aerobic aquifer. In: Hinchee, R.E., J.T. Wilson,and D.C. Downey, eds. Intrinsic bioremediation. Columbus, OH:Battelle Press. pp. 223-231.
31. Buchanan, J.R.J., D.E. Ellis, J.M. Odom, P.F. Mazierski, and M.D.Lee. 1995. Intrinsic and accelerated anaerobic biodegradation ofperchloroethylene in groundwater. In: Hinchee, R.E., J.T. Wilson,and D.C. Downey, eds. Intrinsic bioremediation. Columbus, OH:Battelle Press. pp. 245-252.
11

Microbiological Aspects Relevant to Natural Attenuation of Chlorinated Ethenes
James M. GossettCornell University, School of Civil and Environmental Engineering, Ithaca, New York
Stephen H. ZinderCornell University, Section of Microbiology, Ithaca, New York
Introduction
Chlorinated ethenes are widely employed as solvents incivilian and military applications. They are excellent de-greasing agents, nearly inflammable, and noncorrosive,and in most applications they do not pose an acutetoxicological hazard. Not surprisingly, tetrachloroethene(PCE) and the less-chlorinated ethenes produced fromit via reductive dehalogenation—trichloroethene (TCE),dichloroethene (DCE) isomers, and vinyl chloride(VC)—have become common ground-water pollutants,often present as co-contaminants with fuel-derived pol-lutants such as benzene, toluene, ethylbenzene, andxylenes (BTEX).
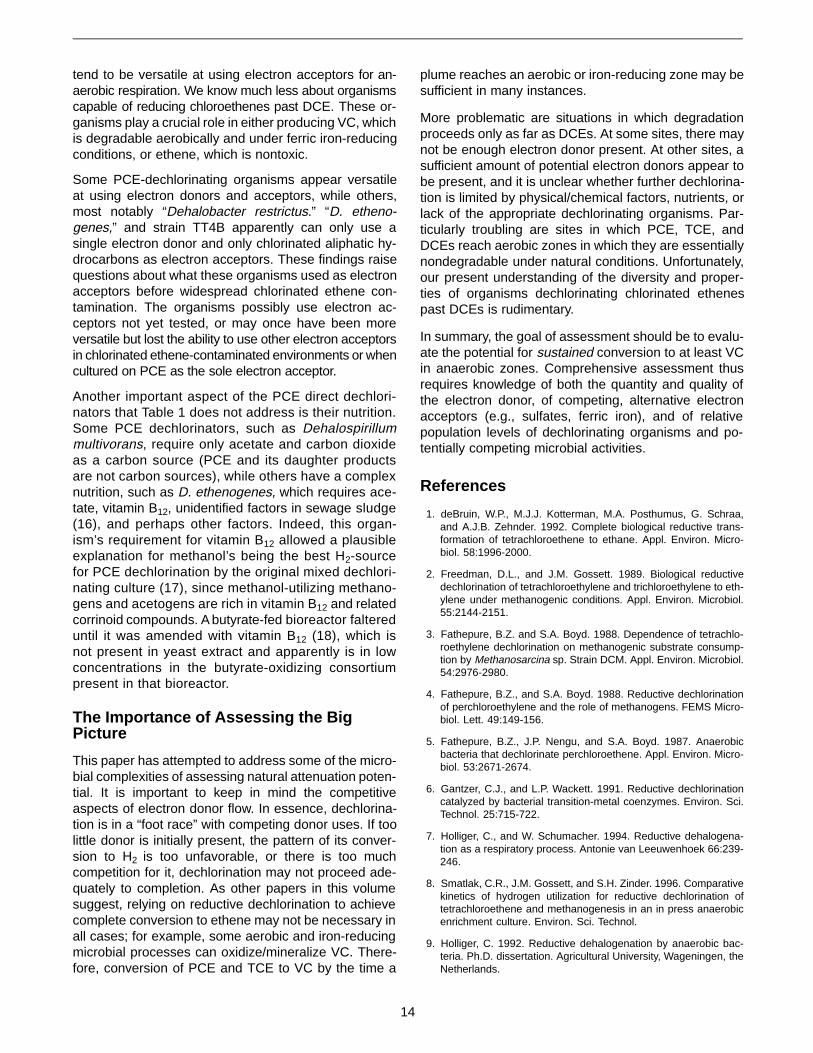
Results from many field and laboratory studies haveshown that chlorinated ethenes can be sequentially,reductively dechlorinated under anaerobic conditions,ultimately yielding ethene, which is environmentally ac-ceptable (1, 2). The process requires some form ofelectron donor (shown in Figure 1 as 2[H] per step), withthe chlorinated ethene serving as electron acceptor.Since most significantly contaminated subsurface envi-ronments are indeed anaerobic, reductive dechlorina-tion to ethene offers promise that natural attenuationmay be exploited in many instances of contamination bychlorinated ethenes. The completeness of the conver-sion to ethene is highly variable from site to site, how-ever, with the responsible factors for this variation notwell understood.
This paper presents some of the microbiological factorsthat the authors believe influence the natural attenuationof chlorinated ethenes.
Co-metabolic Versus Direct Dechlorination
Many of the early observations of reductive dechlorina-tion of PCE and TCE were studies in which the mediat-ing microorganisms were either obviously methanogens(e.g., the pure-culture studies of Fathepure et al. [3-5])or likely so. Many classes of anaerobic organisms (e.g.,methanogens, acetogens, and sulfate reducers) havebeen found to possess metal-porphyrin-containing co-factors that can mediate the slow, incomplete reductivedechlorination of PCE and TCE to (usually) DCE iso-mers (6). This process is co-metabolic in that it happensmore or less accidentally or incidentally as the organ-isms carry out their normal metabolic functions; theorganisms apparently derive no growth-linked or en-ergy-conserving benefit from the reductive dechlorina-tion. Such co-metabolic dechlorinations undoubtedly areresponsible for the incomplete, relatively slow transfor-mations of chloroethenes observed at many field sites.The organisms that can mediate such processes areubiquitous, but the process is sufficiently slow and in-complete that a successful natural attenuation strategycannot completely rely upon it.
On the other hand, more recent studies have demon-strated the existence of direct dechlorinators—microorgan-isms derived from contaminated subsurface environmentsand treatment systems—that utilize chlorinated ethenesas electron acceptors in an energy-conserving, growth-coupled metabolism termed dehalorespiration (7). Severalspecies that carry out direct dechlorination of chlorinatedethenes are described below.
Figure 1. Reductive dechlorination of chlorinated ethenes (under anaerobic conditions).
12

To a large extent, then, success or failure of naturalattenuation can be linked to the specific type of dechlori-nator present (i.e., co-metabolic or direct), as well as tothe relative supply of H2 precursors compared with thesupply of chlorinated ethene that must be reduced.
Competitive Aspects of Dechlorination
Unfortunately, many users compete for H2 in anaerobicmicrobial environments. For example, direct dechlorina-tors must compete for available H2 with hydrogenotro-phic methanogens and sulfate reducers. Thus, in anycomprehensive, meaningful assessment of prospectsfor natural attenuation, assessing only the nature of thedechlorinators and the quantities of available donorsand chlorinated ethenes is insufficient; one must alsotake into account competing demands for H2.
Because of the relatively high energy available fromreductive dechlorination, it is reasonable to suspect thatdechlorinators may out-compete methanogens for H2 atvery low H2 levels. Experimental evidence for thiscomes from studies in which lactate was the adminis-tered electron donor, supplying H2 as it was rapidlyfermented to acetate. During the period of high H2 lev-els, methane production co-existed with dechlorination.As lactate was depleted, H2 production waned, and H2
levels dropped to low levels; beyond this point, methaneproduction was negligible while dechlorination contin-ued slowly. In fact, kinetic analysis of mixed culturesof Dehalococcus ethenogenes and hydrogenotrophicmethanogens showed that this dechlorinator has anaffinity for H2 10 times greater than that of the methano-gens in the culture (8). We do not know whether this highaffinity for H2 is typical of dechlorinators, but thermody-namic arguments would suggest it. We also do not yet
know the differences in relative affinity for H2 betweendechlorinators and sulfate-reducers, important competi-tors in many subsurface environments.
Competition for H2 is thus important, and the partitioningof H2 flows among the various competitors is a functionof the H2 concentration, which itself depends on the ratesof H2 production and utilization. Compounds such aslactate or ethanol that can be rapidly fermented to ace-tate, producing high, short-lived peaks of H2, do notfavor dechlorination as well as would more persistent,slowly fermented substrates such as benzoate or propion-ate (and by extension, probably BTEX components).The quality of the donor needs to be considered asmuch as does its quantity. Comprehensive assessmentare best performed with microcosm studies, along withmicrobiological analyses of in situ relative populations ofcompeting organisms and data on subsurface chemistry(particularly of potentially competing electron acceptors).
Microbiology of Direct Dechlorinators
As summarized in Table 1, several organisms haverecently been isolated that can carry out direct respira-tory reductive dechlorination of chloroethenes. All of theseorganisms have been isolated since 1993, and severalmore will likely be added to the list in the next few years.A few tentative conclusions may be drawn from thistable. First, organisms that reduce PCE as far as cis-DCE are relatively abundant and easier to culture. Thisability seems to have evolved in several different phylo-genetic groups in the eubacteria, as determined by 16SrRNA sequence analysis. Many direct dechlorinatorsseem to be related to either the gram-negative sulfate-reducing bacteria (epsilon proteobacteria) or the gram-positive group, including Desulfotomaculum. Sulfate reducers
Table 1. Properties of Some Direct PCE Dechlorinators
OrganismDechlorinationReactions
ElectronDonors
Other ElectronAcceptors Morphology
PhylogeneticPosition References
Dehalobacterrestrictus
PCE, TCE → cis-DCE H2 None Rod Gram +Desulfotomaculumgroup
9-11
Dehalospirillummultivorans
PCE, TCE → cis-DCE H2, formate,pyruvate, etc.
Thiosulfate, nitrate,fumarate, etc.
Spirillum Epsilonproteobacteria
12
Strain TT4B PCE, TCE → cis-DCE Acetate None Rod ? 13
Enterobacteragglomerans
PCE, TCE → cis-DCE Nonfermentablesubstrates
O2, nitrate, etc. Rod Gammaproteobacteria
14
Desulfitobacteriumsp. strain PCE1
PCE, TCE → (cis-DCE)o-chlorophenols
Lactate,pyruvate,butyrate,ethanol, etc.
Sulfite, thiosulfate,fumarate
Curved rod Gram +Desulfotomaculumgroup
15
Dehalococcusethenogenesstrain 195
PCE, others → ethene H2 None Irregularcoccus
Novel eubacterium 16a
a Maymó-Gatell, X., Y.-T. Chien, J.M. Gossett, and S.H. Zinder. 1996. Isolation of a novel bacterium capable of reductively dechlorinatingtetrachloroethene to ethene. Unpublished data.
13
tend to be versatile at using electron acceptors for an-aerobic respiration. We know much less about organismscapable of reducing chloroethenes past DCE. These or-ganisms play a crucial role in either producing VC, whichis degradable aerobically and under ferric iron-reducingconditions, or ethene, which is nontoxic.
Some PCE-dechlorinating organisms appear versatileat using electron donors and acceptors, while others,most notably “Dehalobacter restrictus.” “D. etheno-genes,” and strain TT4B apparently can only use asingle electron donor and only chlorinated aliphatic hy-drocarbons as electron acceptors. These findings raisequestions about what these organisms used as electronacceptors before widespread chlorinated ethene con-tamination. The organisms possibly use electron ac-ceptors not yet tested, or may once have been moreversatile but lost the ability to use other electron acceptorsin chlorinated ethene-contaminated environments or whencultured on PCE as the sole electron acceptor.
Another important aspect of the PCE direct dechlori-nators that Table 1 does not address is their nutrition.Some PCE dechlorinators, such as Dehalospirillummultivorans, require only acetate and carbon dioxideas a carbon source (PCE and its daughter productsare not carbon sources), while others have a complexnutrition, such as D. ethenogenes, which requires ace-tate, vitamin B12, unidentified factors in sewage sludge(16), and perhaps other factors. Indeed, this organ-ism’s requirement for vitamin B12 allowed a plausibleexplanation for methanol’s being the best H2-sourcefor PCE dechlorination by the original mixed dechlori-nating culture (17), since methanol-utilizing methano-gens and acetogens are rich in vitamin B12 and relatedcorrinoid compounds. A butyrate-fed bioreactor faltereduntil it was amended with vitamin B12 (18), which isnot present in yeast extract and apparently is in lowconcentrations in the butyrate-oxidizing consortiumpresent in that bioreactor.
The Importance of Assessing the BigPicture
This paper has attempted to address some of the micro-bial complexities of assessing natural attenuation poten-tial. It is important to keep in mind the competitiveaspects of electron donor flow. In essence, dechlorina-tion is in a “foot race” with competing donor uses. If toolittle donor is initially present, the pattern of its conver-sion to H2 is too unfavorable, or there is too muchcompetition for it, dechlorination may not proceed ade-quately to completion. As other papers in this volumesuggest, relying on reductive dechlorination to achievecomplete conversion to ethene may not be necessary inall cases; for example, some aerobic and iron-reducingmicrobial processes can oxidize/mineralize VC. There-fore, conversion of PCE and TCE to VC by the time a
plume reaches an aerobic or iron-reducing zone may besufficient in many instances.
More problematic are situations in which degradationproceeds only as far as DCEs. At some sites, there maynot be enough electron donor present. At other sites, asufficient amount of potential electron donors appear tobe present, and it is unclear whether further dechlorina-tion is limited by physical/chemical factors, nutrients, orlack of the appropriate dechlorinating organisms. Par-ticularly troubling are sites in which PCE, TCE, andDCEs reach aerobic zones in which they are essentiallynondegradable under natural conditions. Unfortunately,our present understanding of the diversity and proper-ties of organisms dechlorinating chlorinated ethenespast DCEs is rudimentary.
In summary, the goal of assessment should be to evalu-ate the potential for sustained conversion to at least VCin anaerobic zones. Comprehensive assessment thusrequires knowledge of both the quantity and quality ofthe electron donor, of competing, alternative electronacceptors (e.g., sulfates, ferric iron), and of relativepopulation levels of dechlorinating organisms and po-tentially competing microbial activities.
References
1. deBruin, W.P., M.J.J. Kotterman, M.A. Posthumus, G. Schraa,and A.J.B. Zehnder. 1992. Complete biological reductive trans-formation of tetrachloroethene to ethane. Appl. Environ. Micro-biol. 58:1996-2000.
2. Freedman, D.L., and J.M. Gossett. 1989. Biological reductivedechlorination of tetrachloroethylene and trichloroethylene to eth-ylene under methanogenic conditions. Appl. Environ. Microbiol.55:2144-2151.
3. Fathepure, B.Z. and S.A. Boyd. 1988. Dependence of tetrachlo-roethylene dechlorination on methanogenic substrate consump-tion by Methanosarcina sp. Strain DCM. Appl. Environ. Microbiol.54:2976-2980.
4. Fathepure, B.Z., and S.A. Boyd. 1988. Reductive dechlorinationof perchloroethylene and the role of methanogens. FEMS Micro-biol. Lett. 49:149-156.
5. Fathepure, B.Z., J.P. Nengu, and S.A. Boyd. 1987. Anaerobicbacteria that dechlorinate perchloroethene. Appl. Environ. Micro-biol. 53:2671-2674.
6. Gantzer, C.J., and L.P. Wackett. 1991. Reductive dechlorinationcatalyzed by bacterial transition-metal coenzymes. Environ. Sci.Technol. 25:715-722.
7. Holliger, C., and W. Schumacher. 1994. Reductive dehalogena-tion as a respiratory process. Antonie van Leeuwenhoek 66:239-246.
8. Smatlak, C.R., J.M. Gossett, and S.H. Zinder. 1996. Comparativekinetics of hydrogen utilization for reductive dechlorination oftetrachloroethene and methanogenesis in an in press anaerobicenrichment culture. Environ. Sci. Technol.
9. Holliger, C. 1992. Reductive dehalogenation by anaerobic bac-teria. Ph.D. dissertation. Agricultural University, Wageningen, theNetherlands.
14

10. Holliger, C., G. Schraa, A.J.M. Stams, and A.J.B. Zehnder. 1992.Enrichment and properties of an anaerobic mixed culture reduc-tively dechlorinating 1,2,3-trichlorobenzene to 1,3-dichloroben-zene. Appl. Environ. Microbiol. 58:1636-1644.
11. Holliger, C., G. Schraa, A.J.M. Stams, and A.J.B. Zehnder. 1993.A highly purified enrichment culture couples the reductivedechlorination of tetrachloroethene to growth. Appl. Environ. Mi-crobiol. 59:2991-2997.
12. Neumann, A., H. Scholz-Muramatsu, and G. Diekert. 1994.Tetrachloroethene metabolism of Dehalospirillum multivorans.Arch. Microbiol. 162:295-301.
13. Krumholz, L.R. 1995. A new anaerobe that grows with tetrachlo-roethylene as an electron acceptor. Abstract presented at the95th General Meeting of the American Society for Microbiology.
14. Sharma, P.K., and P.L. McCarty. 1996. Isolation and charac-terization of a facultatively aerobic bacterium that reductively de-halogenates tetrachloroethene to cis-1,2-dichloroethene. Appl.Environ. Microbiol. 62:761-765.
15. Gerritse, J., V. Renard, T.M. Pedro-Gomes, P.A. Lawson, M.D.Collins, and J.C. Gottschal. 1996. Desulfitobacterium sp. strainPCE1, an anaerobic bacterium that can grow by reductivedechlorination of tetrachloroethene or ortho-chlorinated phenols.Arch. Microbiol. 165:132-140.
16. Maymó-Gatell, X., V. Tandoi, J.M. Gossett, and S.H. Zinder. 1995.Characterization of an H2-utilizing enrichment culture that reduc-tively dechlorinates tetrachloroethene to vinyl chloride and ethenein the absence of methanogenesis and acetogenesis. Appl. En-viron. Microbiol. 61:3928-3933.
17. DiStefano, T.D., J.M. Gossett, and S.H. Zinder. 1991. Reductivedechlorination of high concentrations of tetrachloroethene toethene by an anaerobic enrichment culture in the absence ofmethanogenesis. Appl. Environ. Microbiol. 57:2287-2292.
18. Fennell, D.E., M.A. Stover, S.H. Zinder, and J.M. Gossett. 1995.Comparison of alternative electron donors to sustain PCE an-aerobic reductive dechlorination. In Hinchee, R.E., A. Leeson,and L. Semprini, eds. Bioremediation of chlorinated solvents.Columbus, OH: Battelle Press. pp. 9-16.
15

Microbial Ecology of Adaptation and Response in the Subsurface
Guy W. SewellU.S. Environmental Protection Agency, National Risk Management Research Laboratory,
Robert S. Kerr Environmental Research Center, Ada, Oklahoma
Susan A. GibsonSouth Dakota State University, Department of Biology, Brookings, South Dakota
Introduction
The release of bio-oxidizable organic contaminants intothe subsurface and ground water quickly drives the localenvironment anoxic and initiates a series of complexand poorly understood responses by subsurface micro-organisms. Field and laboratory research suggests thatmultiple, physiologically defined communities developthat are spatially and chronologically separate. Thesecommunities are most likely ecologically defined by theflux of biologically available electron donors and acceptors.Under anaerobic conditions most organics continue todegrade although the apparent rate may be slower.Some contaminants may not be oxidatively catabolized,however, due to thermodynamic limitations, lack ofgenomic potential, or physical/chemical properties.
The parent chloroethenes—tetrachloroethene (PCE)and trichloroethene (TCE)—are all too common exam-ples of this type of ground-water contaminant. WhilePCE and TCE do not seem to serve as carbon/energysources for subsurface bacteria, they can be reductivelybiotransformed. These microbially mediated, naturallyoccurring transformations (both oxidative and reductive)of subsurface and ground-water contaminants havebeen observed at many sites and hold significant poten-tial for use as in situ remediation methods as the basisfor active or passive biotreatment technologies. Whilethese processes are observable and in some caseshave been demonstrated as remedial technologies,however, our ability to predict the onset, extent, andrates of transformation is limited. This lack of predictiveability is more pronounced under anaerobic or intrinsicconditions, and is extremely limited when reductive trans-formations are the target processes. Little is known aboutthe environmental parameters, microbial interactions,
and metabolic responses that control these degradationprocesses in the subsurface.
A more complete understanding of the ecological andphysiological factors is needed for accurate and appro-priate predictions and evaluations, particularly for in situtransformation processes under intrinsic (native) condi-tions, where engineered approaches are not availableto influence or dominate in situ hydrogeochemical con-ditions. Under “native” conditions, the heterogeneity ofthe site may also have a profound effect on the fate ofthe contaminants. An understanding of the three-dimen-sional distribution of geochemical and hydraulic condi-tions is important for evaluating the contaminantinteractions with the subsurface microbial ecology. Toevaluate the likelihood of contaminant transformation, itis necessary to have some understanding of the physi-ology of microorganisms in the subsurface and of theecological constraints that effect biological processes inthat environment.
Metabolic Principles
Heterotrophic organisms (like humans and most bacte-ria) oxidize organic compounds to obtain energy. In thisprocess electrons, or reducing equivalents, from theoxidizable organic compound (substrate) are transferredto and ultimately reduce an electron acceptor. The elec-tron acceptor may be an organic or inorganic compound.During this electron transfer process, usable energy is re-covered through a complex series of oxidation-reduction(redox) reactions by the formation of energy storage com-pounds or electrochemical gradients. The oxidation of or-ganic compounds coupled with the reduction of molecularoxygen is termed aerobic heterotrophic respiration and hasbeen the basis of most applications of bioremediation.
16

When oxygen is unavailable, biotransformations can stilloccur. In anaerobic respiration, the oxidation of organicmatter can be coupled with a number of other organicor inorganic electron acceptors. Some microorganismscarry out a process known as fermentation. Fermentingmicroorganisms utilize substrates as both an electrondonor and an electron acceptor. In this process, anorganic compound is metabolized, with a portion ofmolecule becoming a reduced end product(s) and an-other becoming an oxidized end product(s). A commonexample of this process is the alcoholic fermentation ofstarch to carbon dioxide (CO2) (oxidized product) andethanol (reduced product). Fermentative organisms playa critical role in anaerobic consortia by transformingorganic substrates into simple products which can thenbe used by other members of the community, such asdehalgenators, for further oxidation.
The potential energy available from the oxidation of aparticular substrate when coupled with the reduction ofdifferent electron acceptors varies considerably. A higherenergy-yielding process will tend to predominate if therequired electron acceptor is available at biologicallysignificant concentrations (i.e., oxygen utilized beforenitrate). Under anaerobic conditions, microorganismsmay enter into very tightly linked metabolic consortia.That is, the catalytic entity responsible for the destruc-tion of a contaminant is often not a single type of micro-organism. Such consortia can develop regardless of thenature of the terminal electron acceptor.
As a class, the chloroethenes offer a diverse array ofmetabolic fates. The parent compounds PCE and TCEhave been shown to undergo reductive transformations insubsurface systems under the appropriate environmentalconditions. This reductive transformation process, re-ferred to as reductive dechlorination or biodehalogena-tion, is a sequential removal of chlorine moieties fromthe ethene core during a biologically mediated two-electron transfer. Microorganisms in the subsurface andother environments use the chloroethenes as terminalelectron acceptors and gain useable metabolic energyby linking the oxidation of electron donors such as mo-lecular hydrogen or organic compounds to the reductionof chloroethenes. The exact mechanism of this type ofanaerobic respiration and the enzymes and co-factorsinvolved have yet to be identified. It is important to notethat the reductive dechlorination process only suppliesuseable metabolic energy if coupled to the oxidation ofan appropriate electron donor.
TCE, dichloroethenes (DCEs), and vinyl chloride havebeen shown to undergo co-metabolic oxidative transfor-mations. By definition, co-metabolic process do not di-rectly benefit the organisms buy supplying energy ormaterial for cellular synthesis. The mono-oxygenasesystems that transform chloroethenes may be inacti-vated during the process (competitive inhibitor). For the
co-metabolic process to occur, the true parent substratefor the mono-oxygenase system and chloroethenesmust be present, as well as molecular oxygen. Thisactivity has been demonstrated as an active biotreat-ment process, but it is of limited significant under nativeor intrinsic conditions because of the anticompetitiveeffects on the microorganisms involved and the environ-mental conditions needed for significant transformationto occur.
The lesser-chlorinated DCEs can be reductively trans-formed, and a growing body of evidence suggests thatthey may be oxidatively catabolized with oxygen or otherelectron acceptors. Vinyl chloride (monochloroethene)is regarded as the most hazardous of the chloroetheneseries. A known carcinogen, vinyl chloride is more mo-bile than the parent compounds and is extremely vola-tile. Due to its toxicity, when vinyl chloride is detected inthe subsurface environment with the other chlo-roethenes, it is usually the focus of risk-based evalu-ations and drives the cleanup process. Vinyl chloridecan be reductively modified to the nonchlorinated andenvironmentally acceptable end product ethene. It canalso be oxidatively catabolized to CO2 and Cl- underaerobic and iron-reducing conditions.
Ecological Principles
The subsurface environment is a unique and underap-preciated ecosystem. The appropriate application of in-trinsic remediation at a site requires an understandingof the ecological processes under site-specific condi-tions. Subsurface microorganisms will respond to takeadvantage of all available resources (i.e., energy, nutri-ents, space) that allow them to survive and reproduce.This response is bounded by evolutionary, physical, andthermodynamic constraints, but in general we see thatmicroorganisms (and life in general) rapidly take advan-tage of resources and conditions. This concept is re-ferred to as filling all available ecological niches. Theconverse statement is also true, however: subsurfacemicroorganism do not respond in ways that are counter-productive to this competition for resources and survival.This beguilingly simple concept is often overlooked inthe design and implementation of bioremediation.
The nature of the subsurface environment (i.e., its lackof primary production) makes it useful to view subsur-face (microbial) ecology in terms of energy transforma-tion and transfer. Under intrinsic conditions, bioavailableenergy is the ecological resource that induces the ob-served biodegradation process. As noted earlier, thetransfer or harvesting of this resource by subsurfacemicroorganisms involves oxidation/reduction couplesavailable to subsurface microorganisms. Under pristine con-ditions, energy transduction in ground-water environments islimited by the availability of carbon/energy sources(electron donors). Energy transduction in contaminated
17
subsurface systems is usually limited by the availabilityof the electron acceptor. When readily degradable or-ganic matter enters the subsurface in sufficient quanti-ties, it produces a series of zones defined by theterminal electron accepting process (TEAP). Thesezones are not necessarily mutually exclusive and de-pend on the availability of electron acceptors (O2, NO3=,SO4=, Fe3+, CO2). There is no reason to assume asimilarity between the biodegradation potential in differ-ent metabolic zones. This potential will be based on theenergetics associated with the dominant redox proc-esses, the metabolic diversity of the microbial commu-nities, the immediate geochemical conditions, and thechemical nature of the contaminant of concern.
The reductive dehalogenation process may be thoughtof as another TEAP, and the microorganisms involvedcompete for the available flow of energy (reducingequivalents). As noted above, however, PCE or TCE, inthe absence of sufficient electron donors such as anoxidizable co-contaminant or native organic matter,does not represent a resource to the indigenous micro-organisms. This is why PCE and TCE plumes with de-tectable levels of dissolved oxygen do not showevidence of active biodegradation. The presence of dis-solved oxygen indicates no significant quantities of oxi-dizable electron donor are present. Vinyl chloride (andperhaps DCEs) under the same conditions may undergofurther transformation, however, if appropriate electronacceptors such as O2 or Fe3+ are present. Under theseconditions, the oxidation of vinyl chloride represents aresource (energy) to the subsurface microbial populations.
Mechanisms of Adaptation
While an understanding of the ecological processes isuseful in predicting whether a transformation is likely tooccur, an understanding of the adaptation processes’mechanisms is needed to predict the onset of the deg-radation activity. Possible mechanisms of adaptationinclude expression of catabolic potential (induction), se-lection of novel capabilities (mutation), growth of degra-dative populations, formation of degradative consortia,and formation of metabolic intermediate pools. Labora-
tory research results indicate that the formation of cat-abolically competent consortia could be a limiting stepin the observed lag before the onset of degradation.Historical exposure and total microbial mass did notsignificantly affect the observed lag but did affect trans-formation rates. Environmental parameters that supportanaerobic microbial transformation processes (both oxi-dative and reductive) positively affected the observedadaptation response. While more work is needed, thesepreliminary observations offer some explanations forvarying field observations and suggest that clearer un-derstanding of the mechanisms involved may lead togreater predictive capabilities.
Conclusion
Biotransformations that serve as major mass removalmechanisms for the intrinsic remediation of chlo-roethenes and other ground-water contaminants havebeen demonstrated in the laboratory and the field. Theuse of these processes as remedial technologies, how-ever, is difficult to evaluate at field scale, which limits ourability to predict the rate and extent of the degradationof contaminants in complex, heterogeneous subsurfaceenvironments. An understanding of the physiology andecology of subsurface microorganisms is one of the fewtools regulators and scientists have to evaluate the ap-propriate implementation of intrinsic remediation forchloroethene sites. A greater understanding of themechanisms of adaptation in subsurface microbial com-munities could also prove to be useful in the appropriateapplication of in situ bioremediation under active orintrinsic conditions.
Additional Reading
Chapelle, F.H. 1993. Ground water microbiology and geochemistry.New York, NY: John Wiley and Sons.
U.S. EPA. 1991. Environmental Research Brief: Anaerobic biotrans-formation of contaminants in the subsurface. EPA/600/M-90/024. February.
Vogel, T.M., C.S. Criddle, and P.L. McCarty. 1987. Transformations ofhalogenated aliphatic compounds. Environ. Sci. Technol. 22:722-736.
18
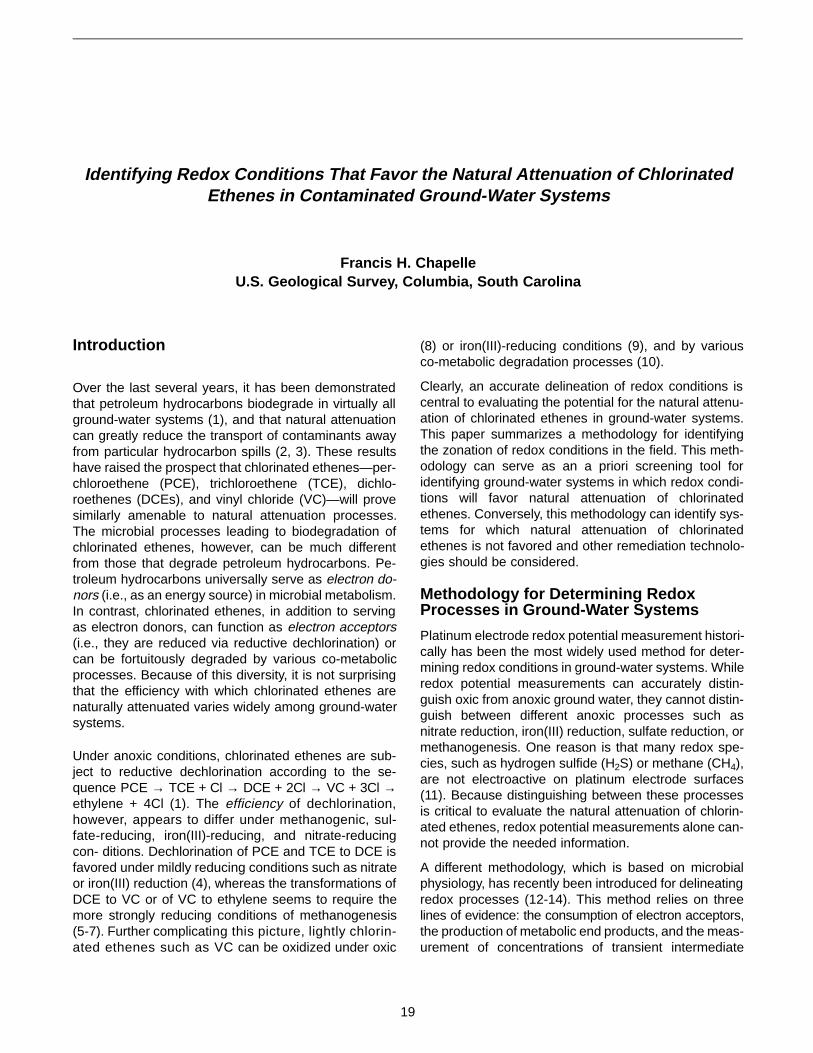
Identifying Redox Conditions That Favor the Natural Attenuation of ChlorinatedEthenes in Contaminated Ground-Water Systems
Francis H. ChapelleU.S. Geological Survey, Columbia, South Carolina
Introduction
Over the last several years, it has been demonstratedthat petroleum hydrocarbons biodegrade in virtually allground-water systems (1), and that natural attenuationcan greatly reduce the transport of contaminants awayfrom particular hydrocarbon spills (2, 3). These resultshave raised the prospect that chlorinated ethenes—per-chloroethene (PCE), trichloroethene (TCE), dichlo-roethenes (DCEs), and vinyl chloride (VC)—will provesimilarly amenable to natural attenuation processes.The microbial processes leading to biodegradation ofchlorinated ethenes, however, can be much differentfrom those that degrade petroleum hydrocarbons. Pe-troleum hydrocarbons universally serve as electron do-nors (i.e., as an energy source) in microbial metabolism.In contrast, chlorinated ethenes, in addition to servingas electron donors, can function as electron acceptors(i.e., they are reduced via reductive dechlorination) orcan be fortuitously degraded by various co-metabolicprocesses. Because of this diversity, it is not surprisingthat the efficiency with which chlorinated ethenes arenaturally attenuated varies widely among ground-watersystems.
Under anoxic conditions, chlorinated ethenes are sub-ject to reductive dechlorination according to the se-quence PCE → TCE + Cl → DCE + 2Cl → VC + 3Cl →ethylene + 4Cl (1). The efficiency of dechlorination,however, appears to differ under methanogenic, sul-fate-reducing, iron(III)-reducing, and nitrate-reducingcon- ditions. Dechlorination of PCE and TCE to DCE isfavored under mildly reducing conditions such as nitrateor iron(III) reduction (4), whereas the transformations ofDCE to VC or of VC to ethylene seems to require themore strongly reducing conditions of methanogenesis(5-7). Further complicating this picture, lightly chlorin-ated ethenes such as VC can be oxidized under oxic
(8) or iron(III)-reducing conditions (9), and by variousco-metabolic degradation processes (10).
Clearly, an accurate delineation of redox conditions iscentral to evaluating the potential for the natural attenu-ation of chlorinated ethenes in ground-water systems.This paper summarizes a methodology for identifyingthe zonation of redox conditions in the field. This meth-odology can serve as an a priori screening tool foridentifying ground-water systems in which redox condi-tions will favor natural attenuation of chlorinatedethenes. Conversely, this methodology can identify sys-tems for which natural attenuation of chlorinatedethenes is not favored and other remediation technolo-gies should be considered.
Methodology for Determining RedoxProcesses in Ground-Water Systems
Platinum electrode redox potential measurement histori-cally has been the most widely used method for deter-mining redox conditions in ground-water systems. Whileredox potential measurements can accurately distin-guish oxic from anoxic ground water, they cannot distin-guish between different anoxic processes such asnitrate reduction, iron(III) reduction, sulfate reduction, ormethanogenesis. One reason is that many redox spe-cies, such as hydrogen sulfide (H2S) or methane (CH4),are not electroactive on platinum electrode surfaces(11). Because distinguishing between these processesis critical to evaluate the natural attenuation of chlorin-ated ethenes, redox potential measurements alone can-not provide the needed information.
A different methodology, which is based on microbialphysiology, has recently been introduced for delineatingredox processes (12-14). This method relies on threelines of evidence: the consumption of electron acceptors,the production of metabolic end products, and the meas-urement of concentrations of transient intermediate
19

products. Molecular hydrogen (H2), the most ubiquitousintermediate product of anaerobic microbial metabolism,has proven to be especially useful in this context. Differ-ent electron-accepting processes have characteristicH2-utilizing efficiencies. Nitrate reduction, the most en-ergetically favorable anoxic process, maintains H2 con-centrations below 0.1 nanomoles (nM) per liter. Iron(III)reduction maintains H2 concentrations between 0.2 and0.8 nM, whereas for sulfate reduction the characteristicrange is between 1 and 4 nM. Methanogenesis, the leastenergetically favorable anoxic process, is characterizedby H2 in the 5 to 15 nM range.
Patterns of electron-acceptor consumption, final productaccumulation, and H2 concentrations can be combined tologically identify redox processes (13). For example, ifsulfate concentrations are observed to decrease along anaquifer flowpath, if sulfide concentrations are observed toincrease, and if H2 concentrations are in the 1 to 4 nMrange characteristic of sulfate reduction, it may be con-cluded with a high level of confidence that sulfate reductionis the predominant redox process. If all three possibleindicators (electron acceptor consumption, end-productproduction, and H2 concentrations) indicate the same re-dox process, a high degree of confidence in the delineationis warranted. Conversely, if only one indicator is available,or if lines of evidence conflict, proportionally less confi-dence in the redox delineation is warranted.
Measuring Hydrogen Concentrations inGround Water
With the exception of dissolved hydrogen (H2), all of theredox-sensitive parameters (dissolved oxygen, nitrate,nitrite, ferrous iron [Fe2+], H2S, sulfate, and methane)needed to assess redox processes are routinely exam-ined in ground-water chemistry investigations. Hydro-gen concentrations in ground water can be made usinga gas-stripping procedure (13). A standard gas-samplingbulb is attached to a stream of water produced from awell and purged for several minutes (at approximately500 milliliters/minute) to eliminate all gas bubbles. Next,20 milliliters of nitrogen, made H2-free by passagethrough a hopcalite column, is introduced to the bulbthrough a septum. As water continues to purge the bulb,H2 and other slightly soluble gases partition to the head-space and asymptotically approach equilibrium with thedissolved phase. After 20 to 25 minutes, equilibrium isachieved, and the gas bubble is sampled using a syr-inge. A duplicate sample is taken 5 minutes later. H2 isthen measured by gas chromatography with reductiongas detection. Concentrations of aqueous H2 are thencalculated from H2 solubility data. For fresh water inequilibrium with a gas phase at 1 atmosphere pressure,1.0 parts per million H2 in the gas phase corresponds to0.8 nM of dissolved H2.
An Example of Redox Zone DelineationRelated to the Natural Attenuation ofChlorinated Ethenes—Cecil Field, Florida
An example of how redox processes can be delineated,and how this delineation affects assessment of naturalattenuation of chlorinated ethenes, is a study performedby the U.S. Geological Survey in cooperation with theU.S. Navy at Site 8, Naval Air Station (NAS) Cecil Field.Site 8 was a fire-training area used to train Navy per-sonnel in firefighting procedures (Figure 1). Over theoperational life of Site 8, a variety of petroleum productsand chlorinated solvents seeped into the underlyingground-water system.
Changes in the concentrations of redox-sensitive con-stituents along the flowpath of the shallow aquifer sys-tem are shown in Figure 2. Ground water at the site isoxic upgradient of the fire pits but becomes anoxicdowngradient of the fire pits (Figure 2A). Once the waterbecomes anoxic, concentrations of methane begin torise, peaking at about 7 milligrams per liter 200 feetdowngradient (Figure 2A) and indicating methanogenicconditions. Between 170 and 400 feet downgradient,concentrations of sulfate decrease and concentrationsof H2S increase (Figure 2B), indicating active sulfatereduction. Concentrations of dissolved Fe2+ remain be-low 1 mg/L until about 400 feet along the flowpath, thenincrease to about 2.5 mg/L, indicating active iron(III)reduction. The H2 concentrations are consistent with theredox zonation indicated by the other redox-sensitiveparameters (Figure 2C). H2 concentrations in the rangecharacteristic of methanogenesis are observed inground water near the fire-training pits where high meth-ane concentrations are present.
Between 200 and 170 feet downgradient, where sulfateconcentrations decline and sulfide concentrations in-
Figure 1. Map showing location of fire-training pits and moni-toring wells, Site 8, NAS Cecil Field, Florida.
20
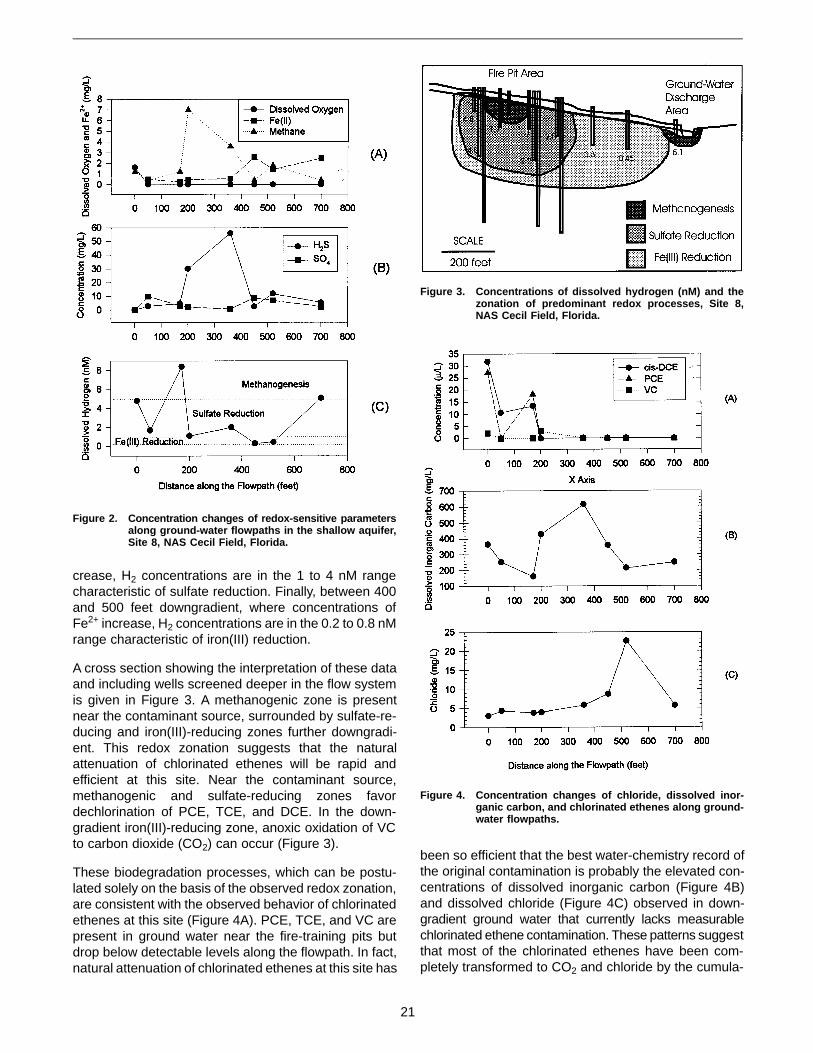
crease, H2 concentrations are in the 1 to 4 nM rangecharacteristic of sulfate reduction. Finally, between 400and 500 feet downgradient, where concentrations ofFe2+ increase, H2 concentrations are in the 0.2 to 0.8 nMrange characteristic of iron(III) reduction.
A cross section showing the interpretation of these dataand including wells screened deeper in the flow systemis given in Figure 3. A methanogenic zone is presentnear the contaminant source, surrounded by sulfate-re-ducing and iron(III)-reducing zones further downgradi-ent. This redox zonation suggests that the naturalattenuation of chlorinated ethenes will be rapid andefficient at this site. Near the contaminant source,methanogenic and sulfate-reducing zones favordechlorination of PCE, TCE, and DCE. In the down-gradient iron(III)-reducing zone, anoxic oxidation of VCto carbon dioxide (CO2) can occur (Figure 3).
These biodegradation processes, which can be postu-lated solely on the basis of the observed redox zonation,are consistent with the observed behavior of chlorinatedethenes at this site (Figure 4A). PCE, TCE, and VC arepresent in ground water near the fire-training pits butdrop below detectable levels along the flowpath. In fact,natural attenuation of chlorinated ethenes at this site has
been so efficient that the best water-chemistry record ofthe original contamination is probably the elevated con-centrations of dissolved inorganic carbon (Figure 4B)and dissolved chloride (Figure 4C) observed in down-gradient ground water that currently lacks measurablechlorinated ethene contamination. These patterns suggestthat most of the chlorinated ethenes have been com-pletely transformed to CO2 and chloride by the cumula-
Figure 2. Concentration changes of redox-sensitive parametersalong ground-water flowpaths in the shallow aquifer,Site 8, NAS Cecil Field, Florida.
Figure 3. Concentrations of dissolved hydrogen (nM) and thezonation of predominant redox processes, Site 8,NAS Cecil Field, Florida.
Figure 4. Concentration changes of chloride, dissolved inor-ganic carbon, and chlorinated ethenes along ground-water flowpaths.
21

tive effects of reductive dehalogenation in the methano-genic and sulfate-reducing zones and oxidative proc-esses in the downgradient iron(III)-reducing and oxiczones.
Conclusion
An understanding of ambient redox conditions is a power-ful tool for assessing the efficiency of natural attenuationof chlorinated ethenes. The methodology for assessingredox conditions involves tracking the disappearance ofelectron acceptors, the appearance of end products, andconcentrations of H2. Using this information, it is possibleto logically deduce redox zonation at particular sites, andassess the confidence that is appropriate for the deline-ation. This methodology was demonstrated at a site atNAS Cecil Field, Florida. The progression from methano-genic → sulfate reduction → Iron(III) reduction → oxygenreduction has efficiently decreased concentrations of chlo-rinated ethenes, indicating that natural attenuation is aviable remedial option at this site.
References 1. Hinchee, R.E., J.A. Kittel, and H.J. Reisinger, eds. 1995. Applied
bioremediation of petroleum hydrocarbons. Columbus, OH:Batelle Press.
2. Weidemeyer, T.H., D.C. Downey, J.T. Wilson, D.H. Kampbell,R.N. Miller, and J.E. Hansen. 1995. Technical protocol for imple-menting the intrinsic remediation with long-term monitoring optionfor natural attenuation of dissolved-phase fuel contamination inground water. U.S. Air Force Center for Environmental Excel-lence, Brooks Air Force Base, San Antonio, TX. p. 129.
3. Chapelle, F.H., J.M. Landmeyer, and P.M. Bradley. 1996. Assess-ment of intrinsic bioremediation of jet fuel contamination in ashallow aquifer, Beaufort, South Carolina. U.S. Geological SurveyWater Resources Investigations Report 95-4262.
4. Vogel, T.M., C.S. Criddle, and P.L. McCarty. 1987. Transforma-tions of halogenated aliphatic compounds. Environ. Sci. Technol.21:721-736.
5. Friedman, D.L., and J.M. Gossett. 1989. Biological reductivedechlorination of tetrachloroethylene and trichloroethylene to eth-ylene under methanogenic conditions. Appl. Environ. Microbiol.55:2144-2151.
6. DeBrunin, W.P., M.J.J. Kotterman, M.A. Posthumus, G. Schraa,and A.J.B. Zehnder. 1992. Complete biological reductive trans-formation of tetrachloroethene to ethene. Appl. Environ. Micro-biol. 58:1996-2000.
7. DiStefano, T.D., J.M. Gossett, and S.H. Zinder. 1991. Reductivedechlorination of high concentrations of tetrachloroethene toethene by an anaerobic enrichment culture in the absence ofmethanogenesis. Appl. Environ. Microbiol. 57:2287-2292.
8. Davis, J.W., and C.L. Carpenter. 1990. Aerobic biodegradationof vinyl chloride in groundwater samples. Appl. Environ. Microbiol.56:3878-3880.
9. Bradley, P.M., and F.H. Chapelle. 1996. Anaerobic mineralizationof vinyl chloride in Fe(III) reducing aquifer sediments. Environ.Sci. Technol. 40:2084-2086.
10. McCarty, P.L., and L. Semprini. 1994. Groundwater treatment forchlorinated solvents. In: Handbook of bioremediation. Boca Ra-ton, FL: Lewis Publishers. pp. 87-116.
11. Stumm, W. and J.J. Morgan. 1981. Aquatic chemistry. New York,NY: John Wiley & Sons. p. 780.
12. Lovley, D.R., and S. Goodwin. 1988. Hydrogen concentrationsas an indicator of the predominant terminal electron-acceptingreaction in aquatic sediments. Geochim. Cosmochim. Acta52:2993-3003.
13. Chapelle, F.H., P.B. McMahon, N.M. Dubrovsky, R.F. Fujii, E.T.Oaksford, and D.A. Vroblesky. 1995. Deducing the distribution ofterminal electron-accepting processes in hydrologically diversegroundwater systems. Water Resour. Res. 31:359-371.
14. Lovley, D.R., F.H. Chapelle, and J.C. Woodward. 1994. Use ofdissolved H2 concentrations to determine distribution of micro-bially catalyzed redox reactions in anoxic groundwater. Environ.Sci. Technol. 28:1255-1210.
22
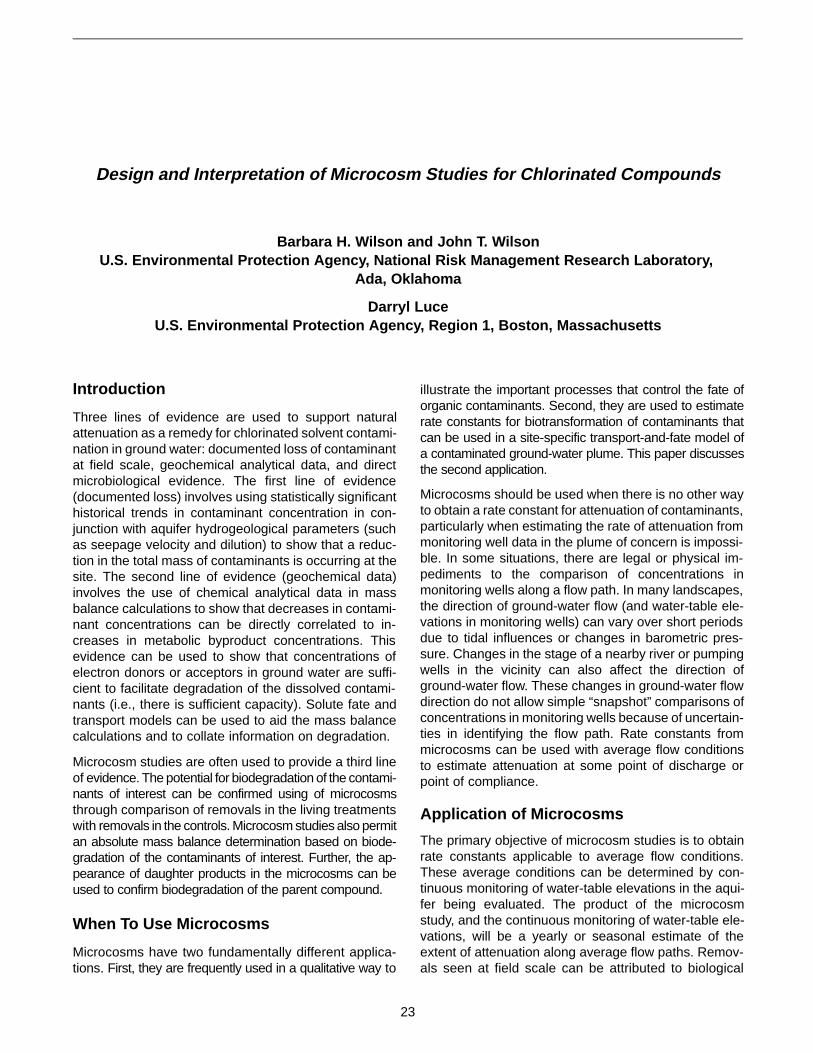
Design and Interpretation of Microcosm Studies for Chlorinated Compounds
Barbara H. Wilson and John T. WilsonU.S. Environmental Protection Agency, National Risk Management Research Laboratory,
Ada, Oklahoma
Darryl LuceU.S. Environmental Protection Agency, Region 1, Boston, Massachusetts
Introduction
Three lines of evidence are used to support naturalattenuation as a remedy for chlorinated solvent contami-nation in ground water: documented loss of contaminantat field scale, geochemical analytical data, and directmicrobiological evidence. The first line of evidence(documented loss) involves using statistically significanthistorical trends in contaminant concentration in con-junction with aquifer hydrogeological parameters (suchas seepage velocity and dilution) to show that a reduc-tion in the total mass of contaminants is occurring at thesite. The second line of evidence (geochemical data)involves the use of chemical analytical data in massbalance calculations to show that decreases in contami-nant concentrations can be directly correlated to in-creases in metabolic byproduct concentrations. Thisevidence can be used to show that concentrations ofelectron donors or acceptors in ground water are suffi-cient to facilitate degradation of the dissolved contami-nants (i.e., there is sufficient capacity). Solute fate andtransport models can be used to aid the mass balancecalculations and to collate information on degradation.
Microcosm studies are often used to provide a third lineof evidence. The potential for biodegradation of the contami-nants of interest can be confirmed using of microcosmsthrough comparison of removals in the living treatmentswith removals in the controls. Microcosm studies also permitan absolute mass balance determination based on biode-gradation of the contaminants of interest. Further, the ap-pearance of daughter products in the microcosms can beused to confirm biodegradation of the parent compound.
When To Use Microcosms
Microcosms have two fundamentally different applica-tions. First, they are frequently used in a qualitative way to
illustrate the important processes that control the fate oforganic contaminants. Second, they are used to estimaterate constants for biotransformation of contaminants thatcan be used in a site-specific transport-and-fate model ofa contaminated ground-water plume. This paper discussesthe second application.
Microcosms should be used when there is no other wayto obtain a rate constant for attenuation of contaminants,particularly when estimating the rate of attenuation frommonitoring well data in the plume of concern is impossi-ble. In some situations, there are legal or physical im-pediments to the comparison of concentrations inmonitoring wells along a flow path. In many landscapes,the direction of ground-water flow (and water-table ele-vations in monitoring wells) can vary over short periodsdue to tidal influences or changes in barometric pres-sure. Changes in the stage of a nearby river or pumpingwells in the vicinity can also affect the direction ofground-water flow. These changes in ground-water flowdirection do not allow simple “snapshot” comparisons ofconcentrations in monitoring wells because of uncertain-ties in identifying the flow path. Rate constants frommicrocosms can be used with average flow conditionsto estimate attenuation at some point of discharge orpoint of compliance.
Application of Microcosms
The primary objective of microcosm studies is to obtainrate constants applicable to average flow conditions.These average conditions can be determined by con-tinuous monitoring of water-table elevations in the aqui-fer being evaluated. The product of the microcosmstudy, and the continuous monitoring of water-table ele-vations, will be a yearly or seasonal estimate of theextent of attenuation along average flow paths. Remov-als seen at field scale can be attributed to biological
23

activity. If removals in the microcosms duplicate removalat field scale, the rate constant can be used for riskassessment purposes.
Selecting Material for Study
Prior to choosing material for microcosm studies, thelocation of major conduits of ground-water flow shouldbe identified, and the geochemical regions along theflow path should be determined. The important geo-chemical regions for natural attenuation of chlorinatedaliphatic hydrocarbons are regions that are activelymethanogenic, exhibit sulfate reduction and iron reduc-tion concomitantly, or exhibit iron reduction alone. Thepattern of chlorinated solvent biodegradation varies indifferent regions. Vinyl chloride tends to accumulateduring reductive dechlorination of trichloroethylene(TCE) or tetrachloroethylene (PCE) in methanogenicregions (1, 2); it does not accumulate to the same extentin regions exhibiting iron reduction and sulfate reduction(3). In regions showing iron reduction alone, vinyl chlo-ride is consumed but dechlorination of PCE, TCE, ordichloroethylene (DCE) may not occur (4). Core materialmust be acquired from each geochemical region in ma-jor flow paths represented by the plume, and the hydrau-lic conductivity of each depth at which core material isacquired must be measured. If possible, the micro-cosms should be constructed with the most transmissivematerial in the flow path.
Several characteristics of ground water from the sameinterval used to collect the core material should bedetermined, including temperature, redox potential, pH,and concentrations of oxygen, sulfate, sulfide, nitrate,ferrous iron, chloride, methane, ethane, ethene, totalorganic carbon, and alkalinity. The concentrations ofcompounds of regulatory concern and any breakdownproducts for each site must be determined. The groundwater should be analyzed for methane to determinewhether methanogenic conditions exist and for daughterproducts ethane and ethene. A comparison of theground-water chemistry from the interval in which thecores were acquired with that in neighboring monitoringwells will demonstrate whether the collected cores arerepresentative of that section of the contaminant plume.
Reductive dechlorination of chlorinated solvents re-quires an electron donor for the process to proceed. Theelectron donor could be soil organic matter, low molecu-lar weight organic compounds (e.g., lactate, acetate, metha-nol, glucose), H2, or a co-contaminant such as landfillleachate or petroleum compounds (5-7). In many instances,the actual electron donor(s) may not be identified.
Several characteristics of the core material should alsobe evaluated. The initial concentration of the contami-nated material (in micrograms per kilogram) should beidentified before constructing the microcosms. It is alsonecessary to determine whether the contamination is
present as a nonaqueous-phase liquid (NAPL) or insolution. A total petroleum hydrocarbon (TPH) analysiswill reveal the presence of any hydrocarbon-based oilymaterials. The water-filled porosity, a parameter gener-ally used to extrapolate rates to the field, can be calcu-lated by comparing wet and dry weights of the aquifermaterial.
To ensure sample integrity and stability during acquisi-tion, it is important to quickly transfer the aquifer materialinto a jar, exclude air by adding ground water, and sealthe jar without headspace. The material should becooled during transportation to the laboratory, then incu-bated at the ambient ground-water temperature in thedark before the construction of microcosms.
At least one microcosm study per geochemical regionshould be completed. If the plume is greater than 1kilometer in length, several microcosm studies per geo-chemical region may need to be constructed.
Geochemical Characterization of the Site
The geochemistry of the subsurface affects the behaviorof organic and inorganic contaminants, inorganic miner-als, and microbial populations. Major geochemical pa-rameters that characterize the subsurface includealkalinity, pH, redox potential, dissolved constituents (in-cluding electron acceptors), temperature, the physicaland chemical characterization of the solids, and micro-bial processes. The most important of these in relationto biological processes are alkalinity, redox potential, theconcentration of electron acceptors, and the chemicalnature of the solids.
Alkalinity
Biologically active portions of a plume may be identifiedin the field by their increased alkalinity (compared withbackground wells), caused by the carbon dioxide result-ing from biodegradation of the pollutants. Increases inboth alkalinity and pH have been measured in portionsof an aquifer contaminated by gasoline undergoing ac-tive utilization of the gasoline components (8). Alkalinitycan be one of the parameters used to identify where tocollect biologically active core material.
pH
Bacteria generally prefer a neutral or slightly alkaline pHlevel, with an optimum pH range for most microorgan-isms between 6.0 and 8.0; many microorganisms, how-ever, can tolerate a pH range of 5.0 to 9.0. Most groundwaters in uncontaminated aquifers are within theseranges. Natural pH values may be as low as 4.0 or 5.0in aquifers with active oxidation of sulfides, and pHvalues as high as 9.0 may be found in carbonate-buff-ered systems (9). pH values as low as 3.0 have beenmeasured for ground waters contaminated with municipal
24
waste leachates, however, which often contain elevatedconcentrations of organic acids (10). In ground waters con-taminated with sludges from cement manufacturing, pHvalues as high as 11.0 have been measured (9).
Redox Potential
The oxidation/reduction (redox) potential of groundwater is a measure of electron activity that indicates therelative ability of a solution to accept or transfer elec-trons. Most redox reactions in the subsurface are micro-bially catalyzed during metabolism of native organicmatter or contaminants. The only elements that arepredominant participants in aquatic redox processes arecarbon, nitrogen, oxygen, sulfur, iron, and manganese(11). The principal oxidizing agents in ground water areoxygen, nitrate, sulfate, manganese(IV), and iron(III).
Biological reactions in the subsurface both influence andare affected by the redox potential and the availableelectron acceptors. The redox potential changes withthe predominant electron acceptor, with reducing condi-tions increasing through the sequence oxygen, nitrate,iron, sulfate, and carbonate. The redox potential de-creases in each sequence, with methanogenic (carbon-ate as the electron acceptor) conditions being mostreducing. The interpretation of redox potentials inground water is difficult (12). The potential obtained inground water is a mixed potential that reflects the poten-tial of many reactions and cannot be used for quantita-tive interpretation (11). The approximate location of thecontaminant plume can be identified in the field bymeasuring the redox potential of the ground water.
To overcome the limitations imposed by traditional redoxmeasurements, recent work has focused on measuringmolecular hydrogen to accurately describe the predomi-nant in situ redox reactions (13-15). The evidence sug-gests that concentrations of H2 in ground water can becorrelated with specific microbial processes, and theseconcentrations can be used to identify zones ofmethanogenesis, sulfate reduction, and iron reduction inthe subsurface (3).
Electron Acceptors
Measuring the available electron acceptors is a criticalstep in identifying the predominant microbial and geo-chemical processes occurring in situ at the time of sam-ple collection. Nitrate and sulfate are found naturally inmost ground waters and will subsequently be used aselectron acceptors once oxygen is consumed. Oxidizedforms of iron and manganese can be used as electronacceptors before sulfate reduction commences. Ironand manganese minerals solubilize coincidently withsulfate reduction, and their reduced forms scavengeoxygen to the extent that strict anaerobes (some sulfatereducers and all methanogens) can develop. Sulfate isfound in many depositional environments, and sulfate
reduction may be very common in many contaminatedground waters. In environments where sulfate is de-pleted, carbonate becomes the electron acceptor, withmethane gas produced as an end product.
Temperature
The temperature at all monitoring wells should be meas-ured to determine when the pumped water has stabi-lized and is ready for collection. Below approximately 30feet, the temperature in the subsurface is fairly consis-tent on an annual basis. Microcosms should be storedat the average in situ temperature. Biological growth canoccur over a wide range of temperatures, although mostmicroorganisms are active primarily between 10°C and35°C (50°F to 95°F).
Chloride
Reductive dechlorination results in the accumulation ofinorganic chloride. In aquifers with a low background ofinorganic chloride, the concentration of inorganic chlo-ride should increase as the chlorinated solvents de-grade. The sum of the inorganic chloride plus thecontaminant being degraded should remain relativelyconsistent along the ground-water flow path.
Tables 1 and 2 list the geochemical parameters, con-taminants, and daughter products that should be meas-ured during site characterization for natural attenuation.The tables include the analyses that should be per-formed, the optimum range for natural attenuation ofchlorinated solvents, and the interpretation of the valuein relation to biological processes.
Table 1. Geochemical Parameters
Analysis Range Interpretation
Redox potential < 50 mVagainst Ag/AgCl
Reductive pathway possible
Sulfate < 20 mg/L Competes at higherconcentrations with reductivepathway
Nitrate < 1 mg/L Competes at higherconcentrations with reductivepathway
Oxygen < 0.5 mg/L Tolerated; toxic to reductivepathway at higherconcentrations
Oxygen > 1 mg/L Vinyl chloride oxidized
Iron(II) > 1 mg/L Reductive pathway possible
Sulfide > 1 mg/L Reductive pathway possible
Hydrogen > 1 nM Reductive pathway possible;vinyl chloride mayaccumulate
Hydrogen < 1 nM Vinyl chloride oxidized
pH 5 < pH < 9 Tolerated range
25
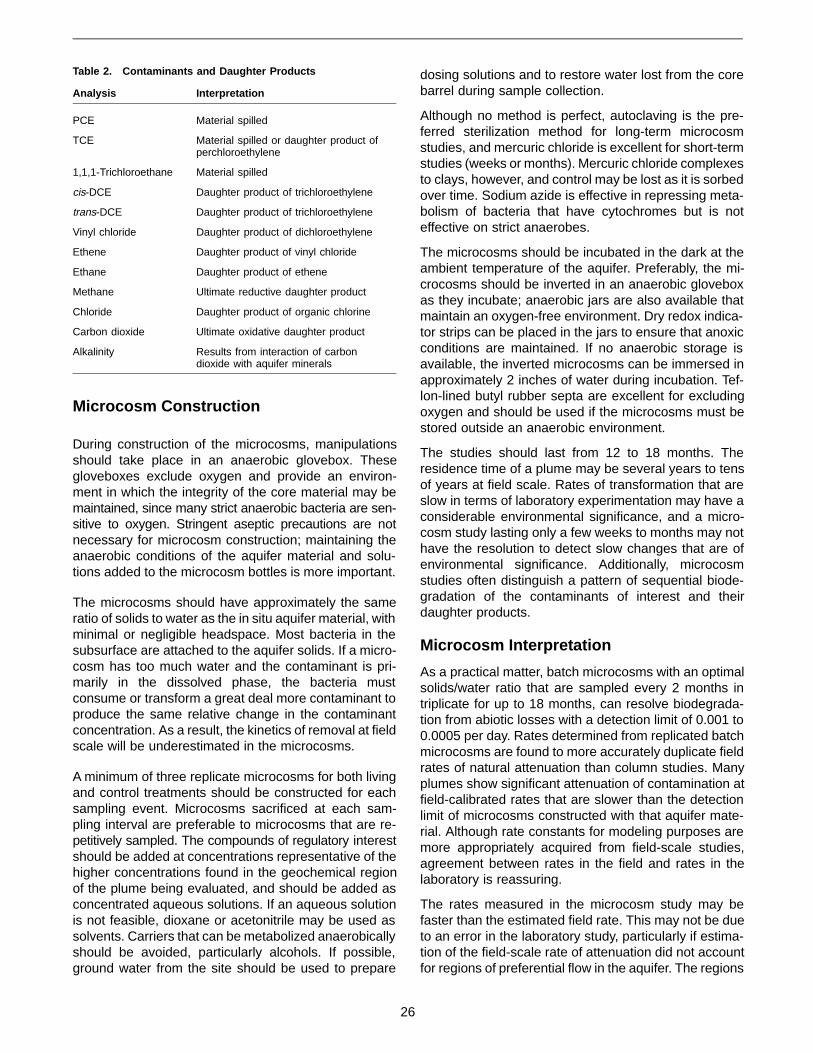
Microcosm Construction
During construction of the microcosms, manipulationsshould take place in an anaerobic glovebox. Thesegloveboxes exclude oxygen and provide an environ-ment in which the integrity of the core material may bemaintained, since many strict anaerobic bacteria are sen-sitive to oxygen. Stringent aseptic precautions are notnecessary for microcosm construction; maintaining theanaerobic conditions of the aquifer material and solu-tions added to the microcosm bottles is more important.
The microcosms should have approximately the sameratio of solids to water as the in situ aquifer material, withminimal or negligible headspace. Most bacteria in thesubsurface are attached to the aquifer solids. If a micro-cosm has too much water and the contaminant is pri-marily in the dissolved phase, the bacteria mustconsume or transform a great deal more contaminant toproduce the same relative change in the contaminantconcentration. As a result, the kinetics of removal at fieldscale will be underestimated in the microcosms.
A minimum of three replicate microcosms for both livingand control treatments should be constructed for eachsampling event. Microcosms sacrificed at each sam-pling interval are preferable to microcosms that are re-petitively sampled. The compounds of regulatory interestshould be added at concentrations representative of thehigher concentrations found in the geochemical regionof the plume being evaluated, and should be added asconcentrated aqueous solutions. If an aqueous solutionis not feasible, dioxane or acetonitrile may be used assolvents. Carriers that can be metabolized anaerobicallyshould be avoided, particularly alcohols. If possible,ground water from the site should be used to prepare
dosing solutions and to restore water lost from the corebarrel during sample collection.
Although no method is perfect, autoclaving is the pre-ferred sterilization method for long-term microcosmstudies, and mercuric chloride is excellent for short-termstudies (weeks or months). Mercuric chloride complexesto clays, however, and control may be lost as it is sorbedover time. Sodium azide is effective in repressing meta-bolism of bacteria that have cytochromes but is noteffective on strict anaerobes.
The microcosms should be incubated in the dark at theambient temperature of the aquifer. Preferably, the mi-crocosms should be inverted in an anaerobic gloveboxas they incubate; anaerobic jars are also available thatmaintain an oxygen-free environment. Dry redox indica-tor strips can be placed in the jars to ensure that anoxicconditions are maintained. If no anaerobic storage isavailable, the inverted microcosms can be immersed inapproximately 2 inches of water during incubation. Tef-lon-lined butyl rubber septa are excellent for excludingoxygen and should be used if the microcosms must bestored outside an anaerobic environment.
The studies should last from 12 to 18 months. Theresidence time of a plume may be several years to tensof years at field scale. Rates of transformation that areslow in terms of laboratory experimentation may have aconsiderable environmental significance, and a micro-cosm study lasting only a few weeks to months may nothave the resolution to detect slow changes that are ofenvironmental significance. Additionally, microcosmstudies often distinguish a pattern of sequential biode-gradation of the contaminants of interest and theirdaughter products.
Microcosm Interpretation
As a practical matter, batch microcosms with an optimalsolids/water ratio that are sampled every 2 months intriplicate for up to 18 months, can resolve biodegrada-tion from abiotic losses with a detection limit of 0.001 to0.0005 per day. Rates determined from replicated batchmicrocosms are found to more accurately duplicate fieldrates of natural attenuation than column studies. Manyplumes show significant attenuation of contamination atfield-calibrated rates that are slower than the detectionlimit of microcosms constructed with that aquifer mate-rial. Although rate constants for modeling purposes aremore appropriately acquired from field-scale studies,agreement between rates in the field and rates in thelaboratory is reassuring.
The rates measured in the microcosm study may befaster than the estimated field rate. This may not be dueto an error in the laboratory study, particularly if estima-tion of the field-scale rate of attenuation did not accountfor regions of preferential flow in the aquifer. The regions
Table 2. Contaminants and Daughter Products
Analysis Interpretation
PCE Material spilled
TCE Material spilled or daughter product ofperchloroethylene
1,1,1-Trichloroethane Material spilled
cis-DCE Daughter product of trichloroethylene
trans-DCE Daughter product of trichloroethylene
Vinyl chloride Daughter product of dichloroethylene
Ethene Daughter product of vinyl chloride
Ethane Daughter product of ethene
Methane Ultimate reductive daughter product
Chloride Daughter product of organic chlorine
Carbon dioxide Ultimate oxidative daughter product
Alkalinity Results from interaction of carbondioxide with aquifer minerals
26
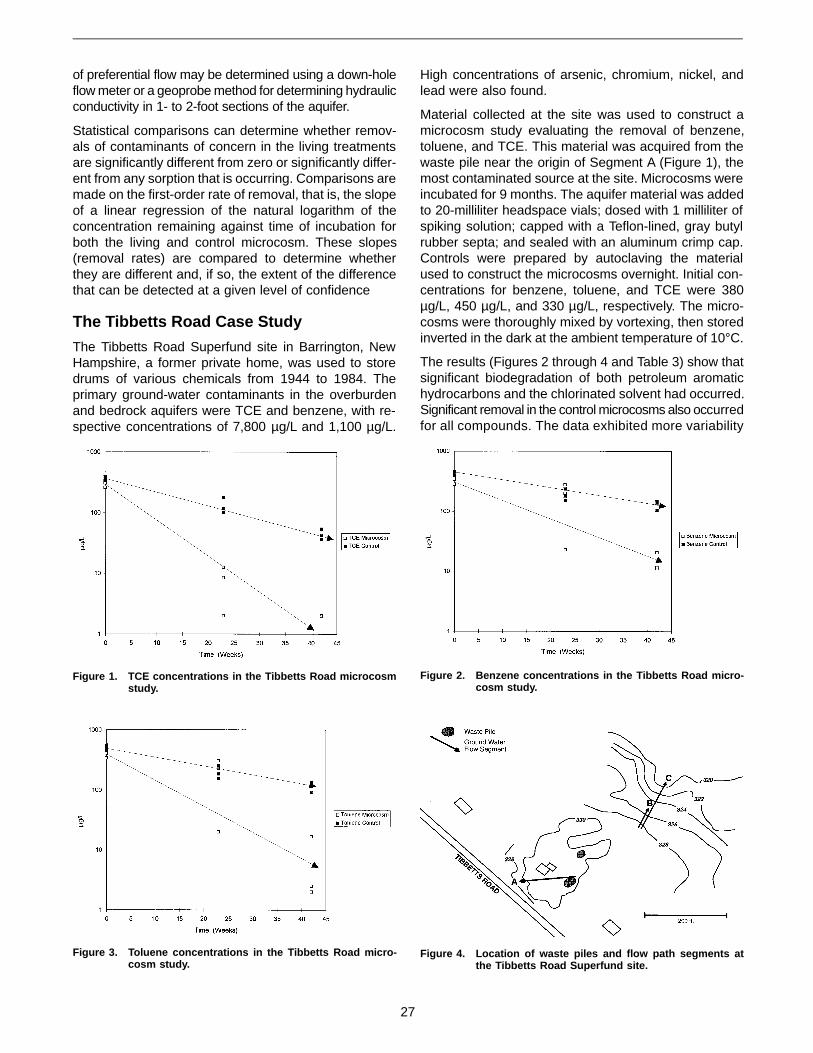
of preferential flow may be determined using a down-holeflow meter or a geoprobe method for determining hydraulicconductivity in 1- to 2-foot sections of the aquifer.
Statistical comparisons can determine whether remov-als of contaminants of concern in the living treatmentsare significantly different from zero or significantly differ-ent from any sorption that is occurring. Comparisons aremade on the first-order rate of removal, that is, the slopeof a linear regression of the natural logarithm of theconcentration remaining against time of incubation forboth the living and control microcosm. These slopes(removal rates) are compared to determine whetherthey are different and, if so, the extent of the differencethat can be detected at a given level of confidence
The Tibbetts Road Case Study
The Tibbetts Road Superfund site in Barrington, NewHampshire, a former private home, was used to storedrums of various chemicals from 1944 to 1984. Theprimary ground-water contaminants in the overburdenand bedrock aquifers were TCE and benzene, with re-spective concentrations of 7,800 µg/L and 1,100 µg/L.
High concentrations of arsenic, chromium, nickel, andlead were also found.
Material collected at the site was used to construct amicrocosm study evaluating the removal of benzene,toluene, and TCE. This material was acquired from thewaste pile near the origin of Segment A (Figure 1), themost contaminated source at the site. Microcosms wereincubated for 9 months. The aquifer material was addedto 20-milliliter headspace vials; dosed with 1 milliliter ofspiking solution; capped with a Teflon-lined, gray butylrubber septa; and sealed with an aluminum crimp cap.Controls were prepared by autoclaving the materialused to construct the microcosms overnight. Initial con-centrations for benzene, toluene, and TCE were 380µg/L, 450 µg/L, and 330 µg/L, respectively. The micro-cosms were thoroughly mixed by vortexing, then storedinverted in the dark at the ambient temperature of 10°C.
The results (Figures 2 through 4 and Table 3) show thatsignificant biodegradation of both petroleum aromatichydrocarbons and the chlorinated solvent had occurred.Significant removal in the control microcosms also occurredfor all compounds. The data exhibited more variability
Figure 1. TCE concentrations in the Tibbetts Road microcosmstudy.
Figure 2. Benzene concentrations in the Tibbetts Road micro-cosm study.
Figure 3. Toluene concentrations in the Tibbetts Road micro-cosm study.
Figure 4. Location of waste piles and flow path segments atthe Tibbetts Road Superfund site.
27

in the living microcosms than in the control treatment, apattern that has been observed in other microcosmstudies. The removals observed in the controls are prob-ably due to sorption; however, this study exhibited moresorption than typically seen.
The rate constants determined from the microcosmstudy for the three compounds are shown in Table 4. Theappropriate rate constant to be used in a model or a riskassessment would be the first-order removal in the livingtreatment minus the first-order removal in the control, inother words, the removal that is in excess of the removalin the controls.
The first-order removal in the living and control micro-cosms was estimated as the linear regression of thenatural logarithm of concentration remaining in eachmicrocosm in each treatment against time of incubation.Student’s t distribution with n - 2 degrees of freedom wasused to estimate the 95 percent confidence interval. Thestandard error of the difference of the rates of removalin living and control microcosms was estimated as the
square root of the sum of the squares of the standarderrors of the living and control microcosms, with n - 4degrees of freedom (16).
Table 5 presents the concentrations of organic com-pounds and their metabolic products in monitoring wellsused to define line segments in the aquifer for estimationof field-scale rate constants. Wells in this aquifershowed little accumulation of trans-DCE, 1,1-DCE, vinylchloride, or ethene, although removals of TCE and cis-DCE were extensive. This can be explained by theobservation that iron-reducing bacteria can rapidly oxi-dize vinyl chloride to carbon dioxide (4). Filterable ironaccumulated in ground water in this aquifer.
The extent of attenuation from well to well (Table 5) andthe travel time between wells in a segment (Figure 4)were used to calculate first-order rate constants for eachsegment (Table 6). Travel time between monitoring wellswas calculated from site-specific estimates of hydraulicconductivity and from the hydraulic gradient. In the areasampled for the microcosm study, the estimated Darcy
Table 3. Concentrations of TCE, Benzene, and Toluene in the Tibbetts Road Microcosms
CompoundTime Zero
MicrocosmsTime ZeroControls
Week 23Microcosms
Week 23Controls
Week 42Microcosms
Week 42Controls
TCE 328 337 1 180 2 36.3
261 394 12.5 116 2 54.5
309 367 8.46 99.9 2 42.3
Mean ± standard deviation 299 ± 34.5 366 ± 28.5 7.32 ± 5.83 132 ± 42.4 2.0 ± 0.0 44.4 ± 9.27
Benzene 366 396 201 236 11.1 146
280 462 276 180 20.5 105
340 433 22.8 152 11.6 139
Mean ± standard deviation 329 ± 44.1 430 ± 33.1 167 ± 130 189 ± 42.8 14.4 ± 5.29 130 ± 21.9
Toluene 443 460 228 254 2 136
342 557 304 185 2.5 92
411 502 19.9 157 16.6 115
Mean ± standard deviation 399 ± 51.6 506 ± 48.6 184 ± 147 199 ± 49.9 7.03 ± 8.29 114 ± 22.0
Table 4. First-Order Rate Constants for Removal of TCE, Benzene, and Toluene in the Tibbetts Road Microcosms
ParameterLiving
MicrocosmsAutoclaved
ControlsRemoval Above
Controls
First-Order Rate of Removal (per year)
TCE 6.31 2.62 3.69
95% confidence interval ± 2.50 ± 0.50 ± 2.31
Minimum rate significant at 95% confidence 1.38
Benzene 3.87 1.51 2.36
95% confidence interval ± 1.96 ± 0.44 ± 1.83
Minimum rate significant at 95% confidence 0.53
Toluene 5.49 1.86 3.63
95% confidence interval ± 2.87 ± 0.45 ± 2.64
Minimum rate significant at 95% confidence 0.99
28

flow was 2.0 feet per year. With an estimated porosity inthis particular glacial till of 0.1, this corresponds to aplume velocity of 20 feet per year.
Summary
Table 7 compares the first-order rate constants estimatedfrom the microcosm studies with the rate constants esti-mated at field scale. The agreement between the inde-pendent estimates of rate is good, indicating that the ratescan appropriately be used in a risk assessment. The ratesof biodegradation documented in the microcosm studycould easily account for the disappearance of TCE,trichloroethylene, benzene, and toluene observed at fieldscale. The rates estimated from the microcosm study areseveral-fold higher than the rates estimated at field scale,which may reflect an underestimation of the true rate inthe field. The estimates of plume velocity assumed thatthe aquifer was homogeneous. No attempt was made inthis study to correct the estimate of plume velocity for
Table 5. Concentration of Contaminants and Metabolic Byproducts in Monitoring Wells Along Segments in the Plume Used ToEstimate Field-Scale Rate Constants
Parameter Segment A Segment B Segment C
Monitoring well 80S 79S 70S 52S 70S 53S
Upgradient g/L Downgradient g/L Upgradient g/L Downgradient g/L Upgradient g/L Downgradient g/L
TCE 200 13.7 710 67 710 3.1
cis-DCE 740 10.9 220 270 220 2.9
trans-DCE 0.41 < 1 0.8 0.3 0.8 < 1
1, 1-DCE 0.99 < 1 < 1 1.6 < 1 < 1
Vinyl Chloride < 1 < 1 < 1 < 1 < 1 < 1
Ethene < 4 < 4 7 < 4 7 < 4
Benzene 510 2.5 493 420 493 < 1
Toluene 10,000 < 1 3,850 900 3,850 < 1
o-Xylene 1,400 8.4 240 71 240 < 1
m-Xylene 2,500 < 1 360 59 360 < 1
p-Xylene 1,400 22 1,100 320 1,100 < 1
Ethylbenzene 1,300 0.7 760 310 760 < 1
Methane 353 77 8 3 8 < 2
Iron 27,000
Table 7. Comparison of First-Order Rate Constants in a Microcosm Study and in the Field at the Tibbetts Road NPL Site
ParameterMicrocosms Corrected for Controls Field Scale
Average RateMinimum Rate Significant
at 95% ConfidenceSegment
ASegment
BSegment
C
First-Order Rate (per year)
Trichloroethylene 3.69 1.38 0.41 0.59 0.54
Benzene 2.36 0.53 0.82 0.04 > 0.62
Toluene 3.63 0.99 > 1.42 0.36 > 0.83
Table 6. First-Order Rate Constants in Segments of theTibbetts Road Plume
Flow Path Segments in Length and Time ofGround-Water Travel
Compound
Segment A130 feet =6.4 years
Segment B80 feet =2.4 years
Segment C200 feet =10 years
First-Order Rate Constants in Segments (per year)
TCE 0.41 0.59 0.54
cis-DCE 0.65 Produced 0.43
Benzene 0.82 0.04 > 0.62
Toluene > 1.42 0.36 > 0.83
o-Xylene 0.79 0.30 > 0.55
m-Xylene > 1.20 0.45 > 0.59
p-Xylene 0.64 0.31 > 0.70
Ethylbenzene 1.16 0.22 > 0.66
29

the influence of preferential flow paths. Preferential flowpaths with a higher hydraulic conductivity than averagewould result in a faster velocity of the plume, thus a lowerresidence time and faster rate of removal at field scale.
References
1. U.S. EPA. 1995. EPA project summary. EPA/600/SV-95/001. U.S.EPA. Washington, DC.
2. Wilson, J.T., D. Kampbell, J. Weaver, B. Wilson, T. Imbrigiotta,and T. Ehlke. 1995. A review of intrinsic bioremediation of trichlo-roethylene in ground water at Picatinny Arsenal, New Jersey, andSt. Joseph, Michigan. In: U.S. EPA. Symposium on Bioremedia-tion of Hazardous Wastes: Research, Development, and FieldEvaluations, Rye Brook, N.Y. EPA/600/R-95/076.
3. Chapelle, F.H. 1996. Identifying redox conditions that favor thenatural attenuation of chlorinated ethenes in contaminatedground-water systems. In: Proceedings of the Symposium onNatural Attenuation of Chlorinated Organics in Ground Water,September 11-13, Dallas, TX.
4. Bradley, P.M., and F.H. Chapelle. 1996. Anaerobic mineralizationof vinyl chloride in Fe(III)-reducing aquifer sediments. Environ.Sci. Technol. In press.
5. Bouwer, E.J. 1994. Bioremediation of chlorinated solvents usingalternate electron acceptors. In: Handbook of bioremediation.Boca Raton, FL: Lewis Publishers.
6. Sewell, G.W., and S.A. Gibson. 1991. Stimulation of the reductivedechlorination of tetrachloroethylene in anaerobic aquifer micro-cosms by the addition of toluene. Environ. Sci. Technol.25(5):982-984.
7. Klecka, G.M., J.T. Wilson, E. Lutz, N. Klier, R. West, J. Davis, J.Weaver, D. Kampbell, and B. Wilson. 1996. Intrinsic remediationof chlorinated solvents in ground water. In: Proceedings of theIBC/CELTIC Conference on Intrinsic Bioremediation, March 18-19, London, UK.
8. Cozzarelli, I.M., J.S. Herman, and M.J. Baedecker. 1995. Fate ofmicrobial metabolites of hydrocarbons in a coastal plain aquifer:The role of electron acceptors. Environ. Sci. Technol. 29(2):458-469.
9. Chapelle, F.H. Ground-water microbiology and geochemistry.New York, NY: John Wiley & Sons.
10. Baedecker, M.J., and W. Back 1979. Hydrogeological processesand chemical reactions at a landfill. Ground Water 17(5):429-437.
11. Stumm, W., and J.J. Morgan. 1970. Aquatic chemistry. New York,NY: Wiley Interscience.
12. Snoeyink, V.L., and D. Jenkins. 1980. Water chemistry. New York,NY: John Wiley & Sons.
13. Chapelle, F.H., P.B. McMahon, N.M. Dubrovsky, R.F. Fugii, E.T.Oaksford, and D.A. Vroblesky. 1995. Deducing the distribution ofterminal electron-accepting processes in hydrologically diversegroundwater systems. Water Resour. Res. 31:359-371.
14. Lovley, D.R., F.H. Chapelle, and J.C. Woodward. 1994. Use ofdissolved H2 concentrations to determine distribution of micro-bially catalyzed redox reactions in anoxic groundwater. Environ.Sci. Technol. 28:1255-1210.
15. Lovley, D.R., and S. Goodwin. 1988. Hydrogen concentrationsas an indicator of the predominant terminal electron-acceptingreactions in aquatic sediments. Geochim. Cosmochim. Acta52:2993-3003.
16. Glantz, S.A. 1992. Primer of biostatistics. New York, NY:McGraw-Hill.
30

Conceptual Models for Chlorinated Solvent Plumes and Their Relevance toIntrinsic Remediation
John A. CherryUniversity of Waterloo, Department of Earth Sciences, Waterloo, Ontario
Introduction
Plumes in which chlorinated solvents are the primarycontaminants of concern are common in aquifers inNorth America and Europe. Most of these plumes haveexisted for two decades or longer, but only a few weredelineated before the mid-1980s. In general, solventplumes are deeper and more extensive than other typesof plumes. Many unremediated solvent plumes haveshown little change in peak concentrations or shapesince monitoring began more than a decade ago.Plumes subjected to pump-and-treat often have shownan initial decline in solvent concentrations but thereafterhave nearly constant concentrations in the sourcezones. Permanent restoration of these ground-watersystems has not yet been accomplished at significantsolvent contamination sites.
Conceptual Models for DenseNonaqueous-Phase Liquid Sites
The conceptual models that best explain chlorinatedsolvent plumes have considerable immobile immiscible-phase solvent mass (dense nonaqueous-phase liquid[DNAPL]) situated below the water table that continuallycontributes dissolved solvents to the plume. Within thesubsurface zone causing plume development in frac-tured porous media, the original DNAPL mass may haveundergone phase transfer so that the mass now residestotally or partly as dissolved and sorbed mass in thelow-permeability matrix blocks between fractures. Thesubsurface zone of plume origin is referred to as the sub-surface source zone or simply the source zone, whether ithas DNAPL residual or free product or has phased-trans-ferred DNAPL in low-permeability zones. Significant sol-vent mass may also reside above the water table, butthis mass is typically not a major contributor to theground-water plume relative to the deeper solvent mass.
Although many indirect lines of evidence indicate thatthe solvent mass in the subsurface source zone is the
long-term cause of the plumes, reliable estimates of themass in this zone are very rare. The monitoring datanecessary for such estimates are usually not achievablebecause of the excessive time and cost involved. Atnearly all solvent contamination sites, disposals, leak-ages, or spills have ceased; therefore, the solvent massin the source zone is now slowly diminishing and even-tually the source zone will be depleted. This depletion,however, is expected to take many decades or evencenturies.
Many solvent plumes have traveled sufficiently far toencounter natural hydrologic boundaries such asstreams, lakes, or wetlands or induced boundaries suchas water wells. The fronts of some solvent plumes havenot yet encountered boundaries, and questions arise asto how much farther these fronts will travel while main-taining hazardous concentration levels. These ques-tions are linked to possibilities for the plume front toachieve an effective steady-state position. If the frontalzone of a plume achieves this steady-state or nearsteady-state position, then in the context of downgradi-ent receptors the plume can be viewed as havingachieved intrinsic remediation. It is unlikely that deple-tion of the source zones contributes to intrinsic remedia-tion of chlorinated solvent plumes; therefore, intrinsicremediation must depend on attenuation processes op-erating within the plume.
Intrinsic Remediation
Intrinsic remediation occurrences are well known at pe-troleum contamination sites, but little is known about theactual applicability of this concept to chlorinated solventplumes. Use of the term “intrinsic remediation” impliesnothing about the specific subsurface processes thatcause the remediation other than that the various proc-esses somehow combine to cause the plume front toachieve steady state or near steady state or perhapscause plume shrinkage.
31
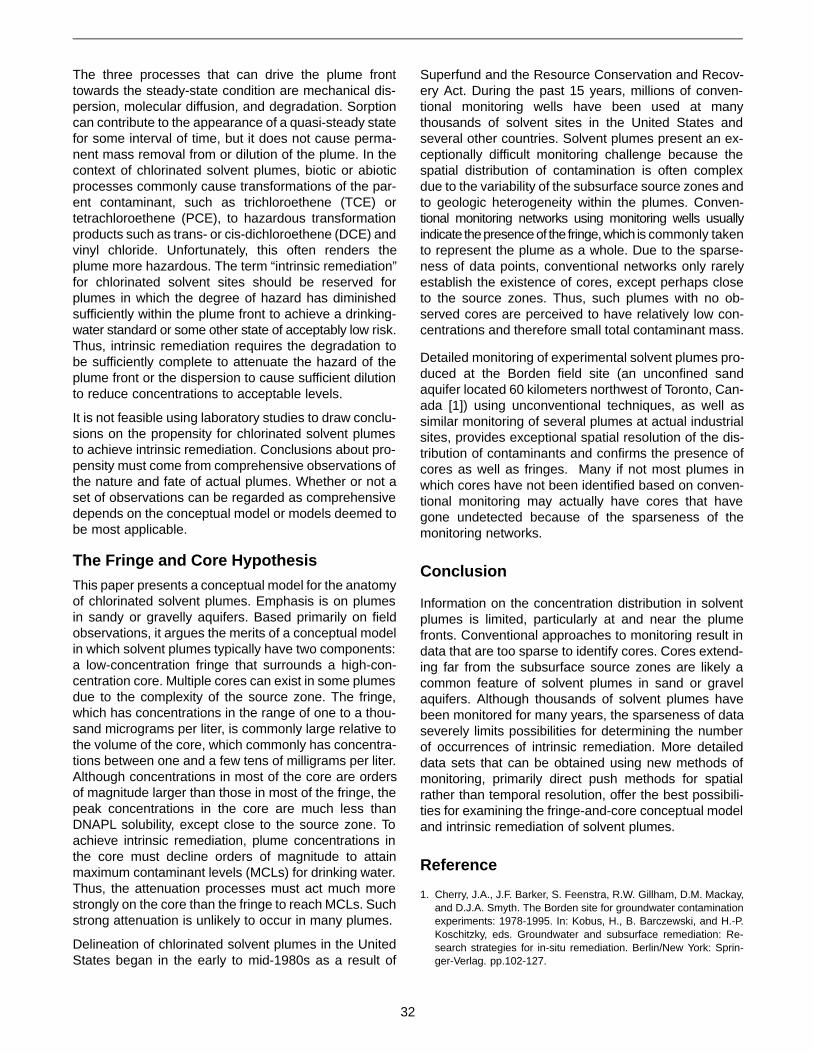
The three processes that can drive the plume fronttowards the steady-state condition are mechanical dis-persion, molecular diffusion, and degradation. Sorptioncan contribute to the appearance of a quasi-steady statefor some interval of time, but it does not cause perma-nent mass removal from or dilution of the plume. In thecontext of chlorinated solvent plumes, biotic or abioticprocesses commonly cause transformations of the par-ent contaminant, such as trichloroethene (TCE) ortetrachloroethene (PCE), to hazardous transformationproducts such as trans- or cis-dichloroethene (DCE) andvinyl chloride. Unfortunately, this often renders theplume more hazardous. The term “intrinsic remediation”for chlorinated solvent sites should be reserved forplumes in which the degree of hazard has diminishedsufficiently within the plume front to achieve a drinking-water standard or some other state of acceptably low risk.Thus, intrinsic remediation requires the degradation tobe sufficiently complete to attenuate the hazard of theplume front or the dispersion to cause sufficient dilutionto reduce concentrations to acceptable levels.
It is not feasible using laboratory studies to draw conclu-sions on the propensity for chlorinated solvent plumesto achieve intrinsic remediation. Conclusions about pro-pensity must come from comprehensive observations ofthe nature and fate of actual plumes. Whether or not aset of observations can be regarded as comprehensivedepends on the conceptual model or models deemed tobe most applicable.
The Fringe and Core Hypothesis
This paper presents a conceptual model for the anatomyof chlorinated solvent plumes. Emphasis is on plumesin sandy or gravelly aquifers. Based primarily on fieldobservations, it argues the merits of a conceptual modelin which solvent plumes typically have two components:a low-concentration fringe that surrounds a high-con-centration core. Multiple cores can exist in some plumesdue to the complexity of the source zone. The fringe,which has concentrations in the range of one to a thou-sand micrograms per liter, is commonly large relative tothe volume of the core, which commonly has concentra-tions between one and a few tens of milligrams per liter.Although concentrations in most of the core are ordersof magnitude larger than those in most of the fringe, thepeak concentrations in the core are much less thanDNAPL solubility, except close to the source zone. Toachieve intrinsic remediation, plume concentrations inthe core must decline orders of magnitude to attainmaximum contaminant levels (MCLs) for drinking water.Thus, the attenuation processes must act much morestrongly on the core than the fringe to reach MCLs. Suchstrong attenuation is unlikely to occur in many plumes.
Delineation of chlorinated solvent plumes in the UnitedStates began in the early to mid-1980s as a result of
Superfund and the Resource Conservation and Recov-ery Act. During the past 15 years, millions of conven-tional monitoring wells have been used at manythousands of solvent sites in the United States andseveral other countries. Solvent plumes present an ex-ceptionally difficult monitoring challenge because thespatial distribution of contamination is often complexdue to the variability of the subsurface source zones andto geologic heterogeneity within the plumes. Conven-tional monitoring networks using monitoring wells usuallyindicate the presence of the fringe, which is commonly takento represent the plume as a whole. Due to the sparse-ness of data points, conventional networks only rarelyestablish the existence of cores, except perhaps closeto the source zones. Thus, such plumes with no ob-served cores are perceived to have relatively low con-centrations and therefore small total contaminant mass.
Detailed monitoring of experimental solvent plumes pro-duced at the Borden field site (an unconfined sandaquifer located 60 kilometers northwest of Toronto, Can-ada [1]) using unconventional techniques, as well assimilar monitoring of several plumes at actual industrialsites, provides exceptional spatial resolution of the dis-tribution of contaminants and confirms the presence ofcores as well as fringes. Many if not most plumes inwhich cores have not been identified based on conven-tional monitoring may actually have cores that havegone undetected because of the sparseness of themonitoring networks.
Conclusion
Information on the concentration distribution in solventplumes is limited, particularly at and near the plumefronts. Conventional approaches to monitoring result indata that are too sparse to identify cores. Cores extend-ing far from the subsurface source zones are likely acommon feature of solvent plumes in sand or gravelaquifers. Although thousands of solvent plumes havebeen monitored for many years, the sparseness of dataseverely limits possibilities for determining the numberof occurrences of intrinsic remediation. More detaileddata sets that can be obtained using new methods ofmonitoring, primarily direct push methods for spatialrather than temporal resolution, offer the best possibili-ties for examining the fringe-and-core conceptual modeland intrinsic remediation of solvent plumes.
Reference
1. Cherry, J.A., J.F. Barker, S. Feenstra, R.W. Gillham, D.M. Mackay,and D.J.A. Smyth. The Borden site for groundwater contaminationexperiments: 1978-1995. In: Kobus, H., B. Barczewski, and H.-P.Koschitzky, eds. Groundwater and subsurface remediation: Re-search strategies for in-situ remediation. Berlin/New York: Sprin-ger-Verlag. pp.102-127.
32
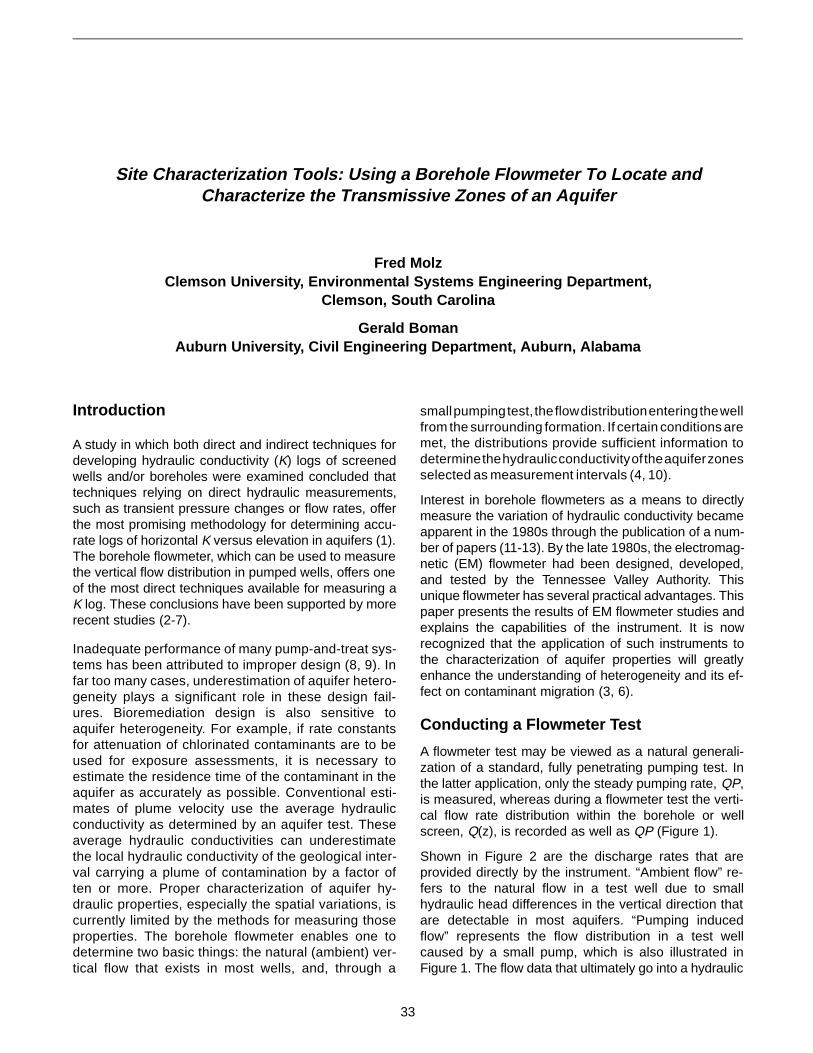
Site Characterization Tools: Using a Borehole Flowmeter To Locate andCharacterize the Transmissive Zones of an Aquifer
Fred MolzClemson University, Environmental Systems Engineering Department,
Clemson, South Carolina
Gerald BomanAuburn University, Civil Engineering Department, Auburn, Alabama
Introduction
A study in which both direct and indirect techniques fordeveloping hydraulic conductivity (K) logs of screenedwells and/or boreholes were examined concluded thattechniques relying on direct hydraulic measurements,such as transient pressure changes or flow rates, offerthe most promising methodology for determining accu-rate logs of horizontal K versus elevation in aquifers (1).The borehole flowmeter, which can be used to measurethe vertical flow distribution in pumped wells, offers oneof the most direct techniques available for measuring aK log. These conclusions have been supported by morerecent studies (2-7).
Inadequate performance of many pump-and-treat sys-tems has been attributed to improper design (8, 9). Infar too many cases, underestimation of aquifer hetero-geneity plays a significant role in these design fail-ures. Bioremediation design is also sensitive toaquifer heterogeneity. For example, if rate constantsfor attenuation of chlorinated contaminants are to beused for exposure assessments, it is necessary toestimate the residence time of the contaminant in theaquifer as accurately as possible. Conventional esti-mates of plume velocity use the average hydraulicconductivity as determined by an aquifer test. Theseaverage hydraulic conductivities can underestimatethe local hydraulic conductivity of the geological inter-val carrying a plume of contamination by a factor often or more. Proper characterization of aquifer hy-draulic properties, especially the spatial variations, iscurrently limited by the methods for measuring thoseproperties. The borehole flowmeter enables one todetermine two basic things: the natural (ambient) ver-tical flow that exists in most wells, and, through a
small pumping test, the flow distribution entering the wellfrom the surrounding formation. If certain conditions aremet, the distributions provide sufficient information todetermine the hydraulic conductivity of the aquifer zonesselected as measurement intervals (4, 10).
Interest in borehole flowmeters as a means to directlymeasure the variation of hydraulic conductivity becameapparent in the 1980s through the publication of a num-ber of papers (11-13). By the late 1980s, the electromag-netic (EM) flowmeter had been designed, developed,and tested by the Tennessee Valley Authority. Thisunique flowmeter has several practical advantages. Thispaper presents the results of EM flowmeter studies andexplains the capabilities of the instrument. It is nowrecognized that the application of such instruments tothe characterization of aquifer properties will greatlyenhance the understanding of heterogeneity and its ef-fect on contaminant migration (3, 6).
Conducting a Flowmeter Test
A flowmeter test may be viewed as a natural generali-zation of a standard, fully penetrating pumping test. Inthe latter application, only the steady pumping rate, QP,is measured, whereas during a flowmeter test the verti-cal flow rate distribution within the borehole or wellscreen, Q(z), is recorded as well as QP (Figure 1).
Shown in Figure 2 are the discharge rates that areprovided directly by the instrument. “Ambient flow” re-fers to the natural flow in a test well due to smallhydraulic head differences in the vertical direction thatare detectable in most aquifers. “Pumping inducedflow” represents the flow distribution in a test wellcaused by a small pump, which is also illustrated inFigure 1. The flow data that ultimately go into a hydraulic
33

conductivity computation are represented by the “netpumping flow,” which is the difference between pumpinginduced flow and ambient flow (4).
To convert flow distributions in a well into flow to or fromaquifer layers, the discharge data are differenced (i.e.,value at lower elevation subtracted from value at upperelevation) to produce the “differential ambient flow” andthe “differential net flow.” The result of doing this to thehypothetical data in Figure 2 is shown in Figure 3. Oncethe flow to the well has stabilized, the differential net flow(DNF) is proportional to the horizontal hydraulic conduc-tivity distribution, K(z). The process of converting a DNFcurve into K(z) involves only algebra and a small amountof additional data (4).
Flowmeter technology is very cost effective. It may beviewed as an extension of a standard pumping test,since flow distribution in the pumping well is measuredin addition to pumping rate and drawdown, but the costis less. Only a few hundred gallons of water are pro-duced per test versus thousands or tens of thousandsfor conventional pumping tests. Thus, potential treat-ment and disposal costs are minimal. A typical flowmetertest can be completed in an hour or two. Cost per datapoint is less than standard pumping tests by a factor of100 or more, and the quantity of hydraulic conductivityinformation produced is increased dramatically.
Measured K(z) Distributions
A commercial version of the EM borehole flowmeter is nowavailable, and it has been applied recently at several sites,including the Savannah River site, the Louisiana ArmyAmmunition Plant, and George Air Force Base (AFB),California. The Savannah River application was in a 14-meter thick confined aquifer in an alluvial basin composedof sand, silt, and clay strata of variable composition. TheK distribution obtained in well P26-M1 is shown in Figure4. Heterogeneity is evident, with K varying by an order ofmagnitude at various locations in the aquifer (3).
A particularly illuminating EM flowmeter application atGeorge AFB was reported by Wilson et al. (Figure 5) (6).The concentration data were obtained from core sam-ples, while the K data are based on EM flowmetermeasurements in Well MW-27, which was located nearby.The transmissive layer identified by the flowmeter islikely the main stratum where the benzene is migrating.This inference is supported by additional flowmeter testsin neighboring wells (6).
Figure 1. Apparatus and geometry associated with a boreholeflowmeter test. The flowmeter measures the verticaldischarge distribution in the well caused by thepump. A hypothetical data set (Q(z) versus z) isshown at the bottom of the figure.
Figure 2. The data actually recorded by a flowmeter are ambi-ent flow and pumping-induced flow. In both cases,positive values indicate upward flow. Net pumpingflow is pumping-induced flow minus ambient flow.
34

Conclusion
Flowmeter tests have now been conducted at sites inmany regions of the United States. Results documentthat the EM flowmeter is capable of supplying a newlevel of detail concerning K distributions in granularaquifers (2-4, 6, 7, 11, 13) and flowpath delineation infractured-rock aquifers (5, 12, 14). The resulting infor-mation concerning hydraulic heterogeneity is unprece-dented and promises to serve as valuable input tomonitoring well screen location and remediation design.Because basic data input has been the “weak link”in the chain of activities constituting subsurface reme-diation, the potential impact of flowmeters on site
Figure 3. Plots of the differences of neighboring values of am-bient flow (differential ambient flow) and net flow (dif-ferential net flow). These values represent the flowentering (positive) or leaving (negative) the wellfrom/to the various layers of the aquifer.
Figure 4. Hydraulic conductivity as a function of depth in WellP26-M1 at the Savannah River site. The measurementinterval (layer thickness) was 1 foot.
Figure 5. Benzene concentration and hydraulic conductivity asfunctions of elevation at George Air Force Base. Thebenzene appears to be migrating in the high trans-missivity layer defined by a flowmeter analysis (6).
35

characterization and modeling is dramatic. Simultane-ously, the effort required to perform flowmeter tests ispractical and economical.
While we view the technology represented by the EMflowmeter as a definite step forward, the instrument inits present prototype form is rather awkward to use ona routine basis (3). The flowmeter probe hangs from stiffelectrical (not logging) cable and requires a packer in-flation gas line to be attached. One must raise and lowerthe instrument by hand, usually using the cable, theinflation line, and a measuring tape bound together withties. The cable is difficult to clean, and stretching leadsto depth placement errors with increasing cable length.These shortcomings may be removed by a redesigneffort that we are attempting to initiate. None of theexisting shortcomings, however, prevent effective use ofthe EM borehole flowmeter, and the resulting data pro-vide hydraulic conductivity information far superior tothat derived from standard pumping tests.
References 1. Taylor, K., S.W. Wheatcraft, J. Hess, J.S. Hayworth, and F.J.
Molz. 1990. Evaluation of methods for determining the verticaldistribution of hydraulic conductivity. Ground Water 27: 88-98.
2. Boggs, J.M., S.C. Young, L.M. Beard, L.W. Gelhar, K.R. Rehfeldt,and E.E. Adams. 1992. Field study of dispersion in a heteroge-neous aquifer, 1. Overview and site description. Water Resour.Res. 28(I2):3281-3292.
3. Boman, G.K., F.J. Molz, and K.D. Boone. 1996. Borehole flow-meter application in fluvial sediments: methodology, results andassessment. Ground Water. Submitted.
4. Molz, F.J., and S.C. Young. 1993. Development and applicationof borehole flowmeters for environmental assessment. The LogAnalyst 3:13-23.
5. Paillet, F.L., K. Novakowski, and P. Lapcevic. 1992. Analysis oftransient flows in boreholes during pumping in fractured forma-tions. In: 33rd Annual Logging Symposium Transactions. Societyof Professional Well Log Analysts, S1-S22.
6. Wilson, J.T., G. Sewell, D. Caron, G. Doyle, and R. Miller. 1995.Intrinsic bioremediation of jet fuel contamination at George AirForce Base. In: Hinchee, R.E., J.T. Wilson, and D.C. Downey,eds. Intrinsic bioremediation. Richland, WA: Battelle Press. pp.91-100.
7. Young, S.C., and H.S. Pearson. 1995. The electromagnetic bore-hole flowmeter: Description and application. Ground Water Moni-toring and Remediation XV(4):138-146.
8. Haley, J.L., B. Hanson, C. Enfield, and J. Glass. 1991. Evaluatingthe effectiveness of groundwater extraction systems. GroundWater Monitoring and Remediation XI:119-124.
9. U.S. EPA. 1990. Basics of pump-and-treat remediation technol-ogy. EPA/600/8-90/003. Report prepared by Geo Trans Inc.,Herndon, VA.
10. U.S. EPA. 1990. A new approach and methodologies for charac-terizing the hydrogeologic properties of aquifers. EPA/600/2-90/002 (NTIS90-167063). Ada, OK.
11. Molz, F.J., R.H. Morin, A.E. Hess, J.G. Melville, and O. Güven.1989. The impeller meter for measuring aquifer permeability vari-ations: evaluations and comparison with other tests. Water Re-sour. Res. 25:1677-1683.
12. Morin, R.H., A.E. Hess, and F.L. Paillet. 1988. Determining thedistribution of hydraulic conductivity in a fractured limestone aqui-fer by simultaneous injection and geophysical logging. GroundWater 26:587-595.
13. Rehfeldt, K.R., P. Huschmeid, L.W. Gelhar, and M.E. Schaefer.1989. The borehole flowmeter technique for measuring hydraulicconductivity variability. Report EM-6511. Electric Power ResearchInstitute, Palo Alto, CA.
14. Hess, A.E., and F.L. Paillet. 1990. Applications of the thermal-pulse flowmeter in the hydraulic characterization of fracturedrock. ASTM STP 1101. American Society for Testing and Materi-als, Philadelphia, PA. pp. 99-112.
36

Overview of the Technical Protocol for Natural Attenuation of ChlorinatedAliphatic Hydrocarbons in Ground Water Under Development for the
U.S. Air Force Center for Environmental Excellence
Todd H. Wiedemeier, Matthew A. Swanson, and David E. MoutouxParsons Engineering Science, Inc., Denver, Colorado
John T. Wilson and Donald H. KampbellU.S. Environmental Protection Agency, National Risk Management Research Laboratory,
Ada, Oklahoma
Jerry E. Hansen and Patrick HaasU.S. Air Force Center for Environmental Excellence, Technology Transfer Division,
Brooks Air Force Base, Texas
Introduction
Over the past several years, natural attenuation hasbecome increasingly accepted as a remedial alternativefor organic compounds dissolved in ground water. TheU.S. Environmental Protection Agency’s (EPA) Office ofResearch and Development and Office of Solid Waste andEmergency Response define natural attenuation as:
The biodegradation, dispersion, dilution, sorption,volatilization, and/or chemical and biochemical sta-bilization of contaminants to effectively reduce con-taminant toxicity, mobility, or volume to levels thatare protective of human health and the ecosystem.
In practice, natural attenuation has several other names,such as intrinsic remediation, intrinsic bioremediation, orpassive bioremediation. The goal of any site charac-terization effort is to understand the fate and transportof the contaminants of concern over time in order toassess any current or potential threat to human healthor the environment. Natural attenuation processes, suchas biodegradation, can often be dominant factors in thefate and transport of contaminants. Thus, considerationand quantification of natural attenuation is essential tomore thoroughly understand contaminant fate andtransport.
This paper presents a technical protocol for data collec-tion and analysis in support of remediation by naturalattenuation to restore ground water contaminated withchlorinated aliphatic hydrocarbons and ground water
contaminated with mixtures of fuels and chlorinated ali-phatic hydrocarbons. In some cases, the informationcollected using this protocol will show that natural at-tenuation processes, with or without source removal, willreduce the concentrations of these contaminants to be-low risk-based corrective action criteria or regulatorystandards before potential receptor exposure pathwaysare completed. The evaluation should include consid-eration of existing exposure pathways as well as expo-sure pathways arising from potential future use of theground water.
This protocol is intended to be used within the estab-lished regulatory framework. It is not the intent of thisdocument to replace existing EPA or state-specific guid-ance on conducting remedial investigations.
Overview of the Technical Protocol
Natural attenuation in ground-water systems resultsfrom the integration of several subsurface attenuationmechanisms that are classified as either destructive ornondestructive. Biodegradation is the most importantdestructive attenuation mechanism. Nondestructive at-tenuation mechanisms include sorption, dispersion, di-lution from recharge, and volatilization. The naturalattenuation of fuel hydrocarbons is described in theTechnical Protocol for Implementing Intrinsic Remedia-tion With Long-Term Monitoring for Natural Attenuationof Fuel Contamination Dissolved in Groundwater, recentlypublished by the U.S. Air Force Center for Environmental
37
Excellence (AFCEE) (1). This document differs from thetechnical protocol for intrinsic remediation of fuel hydro-carbons because the individual processes of chlorinatedaliphatic hydrocarbon biodegradation are fundamentallydifferent from the processes involved in the biodegrada-tion of fuel hydrocarbons.
For example, biodegradation of fuel hydrocarbons, es-pecially benzene, toluene, ethylbenzene, and xylenes(BTEX), is mainly limited by electron acceptor availabil-ity, and biodegradation of these compounds generallywill proceed until all of the contaminants are destroyed.In the experience of the authors, there appears to be aninexhaustible supply of electron acceptors in most, if notall, hydrogeologic environments. On the other hand, themore highly chlorinated solvents (e.g., perchloroetheneand trichloroethene) typically are biodegraded undernatural conditions via reductive dechlorination, a proc-ess that requires both electron acceptors (the chlorin-ated aliphatic hydrocarbons) and an adequate supply ofelectron donors. Electron donors include fuel hydrocar-bons or other types of anthropogenic carbon (e.g., land-fill leachate, BTEX, or natural organic carbon). If thesubsurface environment is depleted of electron donorsbefore the chlorinated aliphatic hydrocarbons are re-moved, reductive dechlorination will cease, and naturalattenuation may no longer be protective of human healthand the environment. This is the most significant differ-ence between the processes of fuel hydrocarbon andchlorinated aliphatic hydrocarbon biodegradation.
For this reason, it is more difficult to predict the long-termbehavior of chlorinated aliphatic hydrocarbon plumesthan fuel hydrocarbon plumes. Thus, it is important tohave a thorough understanding of the operant naturalattenuation mechanisms. In addition to having a betterunderstanding of the processes of advection, disper-sion, dilution from recharge, and sorption, it is necessaryto better quantify biodegradation. This requires a thor-ough understanding of the interactions between chlorin-ated aliphatic hydrocarbons, anthropogenic/naturalcarbon, and inorganic electron acceptors at the site.Detailed site characterization is required to adequatelyunderstand these processes.
Chlorinated solvents are released into the subsurfaceunder two possible scenarios: 1) as relatively pure sol-vent mixtures that are more dense than water, or 2) asmixtures of fuel hydrocarbons and chlorinated aliphatichydrocarbons which, depending on the relative propor-tion of each, may be more or less dense than water.These products commonly are referred to as“nonaqueous-phase liquids,” or NAPLs. If the NAPL ismore dense than water, the material is referred to as a“dense nonaqueous-phase liquid,” or DNAPL. If theNAPL is less dense than water, the material is referredto as a “light nonaqueous-phase liquid,” or LNAPL. Ingeneral, the greatest mass of contaminant is associated
with these NAPL source areas, not with the aqueousphase.
As ground water moves through or past the NAPLsource areas, soluble constituents partition into themoving ground water to generate a plume of dissolvedcontamination. After further releases have beenstopped, these NAPL source areas tend to slowlyweather away as the soluble components, such asBTEX or trichloroethene, are depleted. In cases wheresource removal or reduction is feasible, it is desirable toremove product and decrease the time required for com-plete remediation of the site. At many sites, however,mobile NAPL removal is not feasible with available tech-nology. In fact, the quantity of NAPL recovered by com-monly used recovery techniques is a trivial fraction ofthe total NAPL available to contaminate ground water.Mobile NAPL recovery typically recovers less than 10percent of the total NAPL mass in a spill.
Compared with conventional engineered remediationtechnologies, natural attenuation has the followingadvantages:
• During natural attenuation, contaminants are ultimatelytransformed to innocuous byproducts (e.g., carbon di-oxide, ethene, and water), not just transferred to an-other phase or location in the environment.
• Natural attenuation is nonintrusive and allows con-tinuing use of infrastructure during remediation.
• Engineered remedial technologies can pose greaterrisk to potential receptors than natural attenuationbecause contaminants may be transferred into theatmosphere during remediation activities.
• Natural attenuation is less costly than currently avail-able remedial technologies, such as pump-and-treat.
• Natural attenuation is not subject to the limitations ofmechanized remediation equipment (e.g., no equip-ment downtime).
• Those compounds that are the most mobile and toxicare generally the most susceptible to biodegradation.
Natural attenuation has the following limitations:
• Natural attenuation is subject to natural and anthro-pogenic changes in local hydrogeologic conditions,including changes in ground-water gradients and ve-locity, pH, electron acceptor concentrations, electrondonor concentrations, and/or potential future con-taminant releases.
• Aquifer heterogeneity may complicate site charac-terization and quantification of natural attenuation.
• Time frames for complete remediation may be rela-tively long.
38
• Intermediate products of biodegradation (e.g., vinylchloride) can be more toxic than the original contaminant.
This document describes those processes that bringabout natural attenuation, the site characterization ac-tivities that may be performed to support a feasibilitystudy to include an evaluation of natural attenuation,natural attenuation modeling using analytical or numeri-cal solute fate-and-transport models, and the post-modeling activities that should be completed to ensuresuccessful support and verification of natural attenu-ation. The objective of the work described herein is toquantify and provide defensible data in support of natu-ral attenuation at sites where naturally occurring subsur-face attenuation processes are capable of reducingdissolved chlorinated aliphatic hydrocarbon and/or fuelhydrocarbon concentrations to acceptable levels. Acomment made by a member of the regulatory commu-nity (2) summarizes what is required to successfullyimplement natural attenuation:
A regulator looks for the data necessary to deter-mine that a proposed treatment technology, if prop-erly installed and operated, will reduce thecontaminant concentrations in the soil and water tolegally mandated limits. In this sense the use ofbiological treatment systems calls for the same levelof investigation, demonstration of effectiveness, andmonitoring as any conventional [remediation] system.
To support remediation by natural attenuation, the pro-ponent must scientifically demonstrate that degradationof site contaminants is occurring at rates sufficient to beprotective of human health and the environment. Threelines of evidence can be used to support natural attenu-ation of chlorinated aliphatic hydrocarbons, including:
• Observed reduction in contaminant concentrationsalong the flow path downgradient from the source ofcontamination.
• Documented loss of contaminant mass at the fieldscale using:
– Chemical and geochemical analytical data (e.g.,decreasing parent compound concentrations, in-creasing daughter compound concentrations, de-pletion of electron acceptors and donors, andincreasing metabolic byproduct concentrations).
– A conservative tracer and a rigorous estimate ofresidence time along the flow path to documentcontaminant mass reduction and to calculate bio-logical decay rates at the field scale.
• Microbiological laboratory data that support the oc-currence of biodegradation and give rates of biode-gradation.
At a minimum, the investigator must obtain the first twolines of evidence or the first and third lines of evidence.The second and third lines of evidence are crucial to the
natural attenuation demonstration because they providebiodegradation rate constants. These rate constants areused in conjunction with the other fate-and-transportparameters to predict contaminant concentrations andto assess risk at downgradient points of compliance.
The first line of evidence is simply an observed reductionin the concentration of released contaminants down-gradient from the NAPL source area along the ground-water flow path. This line of evidence does not provethat contaminants are being destroyed because the re-duction in contaminant concentration could be the resultof advection, dispersion, dilution from recharge, sorp-tion, and volatilization with no loss of contaminant mass(i.e., the majority of apparent contaminant loss could bedue to dilution). Conversely, an increase in the concen-trations of some contaminants, most notably degrada-tion products such as vinyl chloride, could be indicativeof natural attenuation.
To support remediation by natural attenuation at mostsites, the investigator will have to show that contaminantmass is being destroyed via biodegradation. This isdone using either or both of the second or third lines ofevidence. The second line of evidence relies on chemi-cal and physical data to show that contaminant mass isbeing destroyed via biodegradation, not just diluted. Thesecond line of evidence is divided into two components:
• Using chemical analytical data in mass balance cal-culations to show that decreases in contaminant andelectron acceptor and donor concentrations can bedirectly correlated to increases in metabolic endproducts and daughter compounds. This evidencecan be used to show that electron acceptor and do-nor concentrations in ground water are sufficient tofacilitate degradation of dissolved contaminants. Sol-ute fate-and-transport models can be used to aidmass balance calculations and to collate informationon degradation.
• Using measured concentrations of contaminantsand/or biologically recalcitrant tracers in conjunctionwith aquifer hydrogeologic parameters, such asseepage velocity and dilution, to show that a reduc-tion in contaminant mass is occurring at the site andto calculate biodegradation rate constants.
The third line of evidence, microbiological laboratorydata, can be used to provide additional evidence thatindigenous biota are capable of degrading site contami-nants at a particular rate. Because it is necessary toshow that biodegradation is occurring and to obtainbiodegradation rate constants, the most useful type ofmicrobiological laboratory data is the microcosm study.
This paper presents a technical course of action thatallows converging lines of evidence to be used to scien-tifically document the occurrence and quantify the ratesof natural attenuation. Ideally, the first two lines of evidence
39
should be used in the natural attenuation demonstration.To further document natural attenuation, or at sites withcomplex hydrogeology, obtaining a field-scale biodegra-dation rate may not be possible; in this case, microbi-ological laboratory data can be used. Such a“weight-of-evidence” approach will greatly increase thelikelihood of successfully implementing natural attenu-ation at sites where natural processes are restoring theenvironmental quality of ground water.
Collection of an adequate database during the iterativesite characterization process is an important step in thedocumentation of natural attenuation. Site charac-terization should provide data on the location, nature,and extent of contaminant sources. Contaminant sour-ces generally consist of hydrocarbons present as mobileNAPL (i.e., NAPL occurring at sufficiently high satura-tions to drain under the influence of gravity into a well)and residual NAPL (i.e., NAPL occurring at immobile,residual saturation that is unable to drain into a well bygravity). Site characterization also should provide infor-mation on the location, extent, and concentrations ofdissolved contamination; ground-water geochemicaldata; geologic information on the type and distributionof subsurface materials; and hydrogeologic parameterssuch as hydraulic conductivity, hydraulic gradients, andpotential contaminant migration pathways to human orecological receptor exposure points.
The data collected during site characterization can beused to simulate the fate and transport of contaminantsin the subsurface. Such simulation allows prediction ofthe future extent and concentrations of the dissolvedcontaminant plume. Several models can be used tosimulate dissolved contaminant transport and attenu-ation. The natural attenuation modeling effort has threeprimary objectives: 1) to predict the future extent andconcentration of a dissolved contaminant plume bysimulating the combined effects of advection, disper-sion, sorption, and biodegradation; 2) to assess the po-tential for downgradient receptors to be exposed tocontaminant concentrations that exceed regulatory orrisk-based levels intended to be protective of humanhealth and the environment; and 3) to provide technicalsupport for the natural attenuation remedial option atpostmodeling regulatory negotiations to help design amore accurate verification and monitoring strategy andto help identify early source removal strategies.
Upon completion of the fate-and-transport modeling ef-fort, model predictions can be used in an exposurepathways analysis. If natural attenuation is sufficient tomitigate risks to potential receptors, the proponent ofnatural attenuation has a reasonable basis for negotiat-ing this option with regulators. The exposure pathwaysanalysis allows the proponent to show that potentialexposure pathways to receptors will not be completed.
The material presented herein was prepared throughthe joint effort of the AFCEE Technology Transfer Divi-sion; the Bioremediation Research Team at EPA’s Na-tional Risk Management Research Laboratory in Ada,Oklahoma (NRMRL), Subsurface Protection and Reme-diation Division; and Parsons Engineering Science, Inc.(Parsons ES). This compilation is designed to facilitateimplementation of natural attenuation at chlorinated ali-phatic hydrocarbon-contaminated sites owned by theU.S. Air Force and other U.S. Department of Defenseagencies, the U.S. Department of Energy, and publicinterests.
Overview of Chlorinated AliphaticHydrocarbon Biodegradation
Because biodegradation is the most important processacting to remove contaminants from ground water, anaccurate estimate of the potential for natural biodegra-dation is important to obtain when determining whetherground-water contamination presents a substantialthreat to human health and the environment. This infor-mation also will be useful when selecting the remedialalternative that will be most cost-effective in eliminatingor abating these threats should natural attenuationalone not prove to be sufficient.
Over the past two decades, numerous laboratory andfield studies have demonstrated that subsurface micro-organisms can degrade a variety of hydrocarbons andchlorinated solvents (3-23). Whereas fuel hydrocarbonsare biodegraded through use as a primary substrate(electron donor), chlorinated aliphatic hydrocarbonsmay undergo biodegradation through three differentpathways: through use as an electron acceptor, throughuse as an electron donor, or through co-metabolism,where degradation of the chlorinated organic is fortui-tous and there is no benefit to the microorganism. At agiven site, one or all of these processes may be operat-ing, although at many sites the use of chlorinated ali-phatic hydrocarbons as electron acceptors appears tobe most important under natural conditions. In general,but in this case especially, biodegradation of chlorinatedaliphatic hydrocarbons will be an electron-donor-limitedprocess. Conversely, biodegradation of fuel hydrocar-bons is an electron-acceptor-limited process.
In a pristine aquifer, native organic carbon is used as anelectron donor, and dissolved oxygen (DO) is used firstas the prime electron acceptor. Where anthropogeniccarbon (e.g., fuel hydrocarbon) is present, it also will beused as an electron donor. After the DO is consumed,anaerobic microorganisms typically use additional elec-tron acceptors (as available) in the following order ofpreference: nitrate, ferric iron oxyhydroxide, sulfate, andfinally carbon dioxide. Evaluation of the distribution ofthese electron acceptors can provide evidence of whereand how chlorinated aliphatic hydrocarbon biodegradation
40

is occurring. In addition, because chlorinated aliphatichydrocarbons may be used as electron acceptors orelectron donors (in competition with other acceptors ordonors), isopleth maps showing the distribution of thesecompounds can provide evidence of the mechanisms ofbiodegradation working at a site. As with BTEX, the drivingforce behind oxidation-reduction reactions resulting inchlorinated aliphatic hydrocarbon degradation is elec-tron transfer. Although thermodynamically favorable,most of the reactions involved in chlorinated aliphatichydrocarbon reduction and oxidation do not proceedabiotically. Microorganisms are capable of carrying outthe reactions, but they will facilitate only those oxidation-reduction reactions that have a net yield of energy.
Mechanisms of Chlorinated AliphaticHydrocarbon Biodegradation
Electron Acceptor Reactions (ReductiveDechlorination)
The most important process for the natural biodegrada-tion of the more highly chlorinated solvents is reductivedechlorination. During this process, the chlorinated hy-drocarbon is used as an electron acceptor, not as asource of carbon, and a chlorine atom is removed andreplaced with a hydrogen atom. In general, reductivedechlorination occurs by sequential dechlorination fromperchloroethene to trichloroethene to dichloroethene tovinyl chloride to ethene. Depending on environmentalconditions, this sequence may be interrupted, with otherprocesses then acting on the products. During reductivedechlorination, all three isomers of dichloroethene cantheoretically be produced; however, Bouwer (24) reportsthat under the influence of biodegradation, cis-1,2-di-chloroethene is a more common intermediate thantrans-1,2-dichloroethene, and that 1,1-dichloroethene isthe least prevalent intermediate of the three dichlo-roethene isomers. Reductive dechlorination of chlorin-ated solvent compounds is associated with allaccumulation of daughter products and an increase inthe concentration of chloride ions.
Reductive dechlorination affects each of the chlorinatedethenes differently. Of these compounds, perchlo-roethene is the most susceptible to reductive dechlori-nation because it is the most oxidized. Conversely, vinylchloride is the least susceptible to reductive dechlorina-tion because it is the least oxidized of these compounds.The rate of reductive dechlorination also has been ob-served to decrease as the degree of chlorination de-creases (24, 25). Murray and Richardson (26) havepostulated that this rate decrease may explain the ac-cumulation of vinyl chloride in perchloroethene andtrichloroethene plumes that are undergoing reductivedechlorination.
Reductive dechlorination has been demonstrated undernitrate- and sulfate-reducing conditions, but the mostrapid biodegradation rates, affecting the widest range ofchlorinated aliphatic hydrocarbons, occur under methano-genic conditions (24). Because chlorinated aliphatic hy-drocarbon compounds are used as electron acceptorsduring reductive dechlorination, there must be an appro-priate source of carbon in order for microbial growth tooccur (24). Potential carbon sources include naturalorganic matter, fuel hydrocarbons, or other organic com-pounds such as those found in landfill leachate.
Electron Donor Reactions
Murray and Richardson (26) write that microorganismsare generally believed to be incapable of growth usingtrichloroethene and perchloroethene as a primary sub-strate (i.e., electron donor). Under aerobic and someanaerobic conditions, the less-oxidized chlorinated ali-phatic hydrocarbons (e.g., vinyl chloride) can be used asthe primary substrate in biologically mediated redox re-actions (22). In this type of reaction, the facilitating micro-organism obtains energy and organic carbon from thedegraded chlorinated aliphatic hydrocarbon. This is theprocess by which fuel hydrocarbons are biodegraded.
In contrast to reactions in which the chlorinated aliphatichydrocarbon is used as an electron acceptor, only theleast oxidized chlorinated aliphatic hydrocarbons can beused as electron donors in biologically mediated redoxreactions. McCarty and Semprini (22) describe investi-gations in which vinyl chloride and 1,2-dichloroethanewere shown to serve as primary substrates under aero-bic conditions. These authors also document that dichlo-romethane has the potential to function as a primarysubstrate under either aerobic or anaerobic environ-ments. In addition, Bradley and Chapelle (27) showevidence of mineralization of vinyl chloride under iron-reducing conditions so long as there is sufficientbioavailable iron(III). Aerobic metabolism of vinyl chlo-ride may be characterized by a loss of vinyl chloridemass and a decreasing molar ratio of vinyl chloride toother chlorinated aliphatic hydrocarbon compounds.
Co-metabolism
When a chlorinated aliphatic hydrocarbon is biode-graded via co-metabolism, the degradation is catalyzedby an enzyme or cofactor that is fortuitously producedby the organisms for other purposes. The organismreceives no known benefit from the degradation of thechlorinated aliphatic hydrocarbon; in fact, the co-metabolicdegradation of the chlorinated aliphatic hydrocarbonmay be harmful to the microorganism responsible for theproduction of the enzyme or cofactor (22).
Co-metabolism is best documented in aerobic environ-ments, although it could occur under anaerobic condi-tions. It has been reported that under aerobic conditions
41

chlorinated ethenes, with the exception of perchlo-roethene, are susceptible to co-metabolic degradation(22, 23, 26). Vogel (23) further elaborates that the co-metabolism rate increases as the degree of dechlorina-tion decreases. During co-metabolism, trichloroetheneis indirectly transformed by bacteria as they use BTEXor another substrate to meet their energy requirements.Therefore, trichloroethene does not enhance the degra-dation of BTEX or other carbon sources, nor will its co-me-tabolism interfere with the use of electron acceptorsinvolved in the oxidation of those carbon sources.
Behavior of Chlorinated Solvent Plumes
Chlorinated solvent plumes can exhibit three types ofbehavior depending on the amount of solvent, theamount of biologically available organic carbon in theaquifer, the distribution and concentration of naturalelectron acceptors, and the types of electron acceptorsbeing used. Individual plumes may exhibit all three typesof behavior in different portions of the plume. The differ-ent types of plume behavior are summarized below.
Type 1 Behavior
Type 1 behavior occurs where the primary substrate isanthropogenic carbon (e.g., BTEX or landfill leachate),and this anthropogenic carbon drives reductive dechlori-nation. When evaluating natural attenuation of a plumeexhibiting Type 1, behavior the following questions mustbe answered:
1. Is the electron donor supply adequate to allowmicrobial reduction of the chlorinated organiccompounds? In other words, will the microorganisms“strangle” before they “starve”—will they run out ofchlorinated aliphatic hydrocarbons (electronacceptors) before they run out of electron donors?
2. What is the role of competing electron acceptors(e.g., DO, nitrate, iron(III), and sulfate)?
3. Is vinyl chloride oxidized, or is it reduced?
Type 1 behavior results in the rapid and extensive deg-radation of the highly chlorinated solvents such as per-chloroethene, trichloroethene, and dichloroethene.
Type 2 Behavior
Type 2 behavior dominates in areas that are charac-terized by relatively high concentrations of biologicallyavailable native organic carbon. This natural carbonsource drives reductive dechlorination (i.e., is the pri-mary substrate for microorganism growth). When evalu-ating natural attenuation of a Type 2 chlorinated solventplume, the same questions as those posed for Type 1behavior must be answered. Type 2 behavior generallyresults in slower biodegradation of the highly chlorin-ated solvents than Type 1 behavior, but under the right
conditions (e.g., areas with high natural organic carboncontents) this type of behavior also can result in rapiddegradation of these compounds.
Type 3 Behavior
Type 3 behavior dominates in areas that are charac-terized by low concentrations of native and/or anthropo-genic carbon and by DO concentrations greater than1.0 milligrams per liter. Under these aerobic conditions,reductive dechlorination will not occur; thus, there is noremoval of perchloroethene, trichloroethene, and dichlo-roethene. The most significant natural attenuationmechanisms for these compounds is advection, disper-sion, and sorption. However, vinyl chloride can be rap-idly oxidized under these conditions.
Mixed Behavior
A single chlorinated solvent plume can exhibit all threetypes of behavior in different portions of the plume. Thiscan be beneficial for natural biodegradation of chlori-nated aliphatic hydrocarbon plumes. For example,Wiedemeier et al. (28) describe a plume at PlattsburghAir Force Base, New York, that exhibits Type 1 behaviorin the source area and Type 3 behavior downgradientfrom the source. The most fortuitous scenario involvesa plume in which perchloroethene, trichloroethene, anddichloroethene are reductively dechlorinated (Type 1 or2 behavior), then vinyl chloride is oxidized (Type 3 be-havior) either aerobically or via iron reduction. Vinylchloride is oxidized to carbon dioxide in this type ofplume and does not accumulate. The following se-quence of reactions occurs in a plume that exhibits thistype of mixed behavior:
Perchloroethene → Trichloroethene → Dichloroethene → Vinyl chloride → Carbon dioxide
The trichloroethene, dichloroethene, and vinyl chloridemay attenuate at approximately the same rate, and thusthese reactions may be confused with simple dilution.Note that no ethene is produced during this reaction.Vinyl chloride is removed from the system much fasterunder these conditions than it is under vinyl chloride-re-ducing conditions.
A less desirable scenario—but one in which all contami-nants may be entirely biodegraded— involves a plumein which all chlorinated aliphatic hydrocarbons are re-ductively dechlorinated via Type 1 or Type 2 behavior.Vinyl chloride is reduced to ethene, which may be furtherreduced to ethane or methane. The following sequenceof reactions occurs in this type of plume:
Perchloroethene → Trichloroethene → Dichloroethene → Vinyl chloride → Ethene → Ethane
42

This sequence has been investigated by Freedman andGossett (13). In this type of plume, vinyl chloride de-grades more slowly than trichloroethene and thus tendsto accumulate.
Protocol for Quantifying NaturalAttenuation During the RemedialInvestigation Process
The primary objective of the natural attenuation investi-gation is to show that natural processes of contaminantdegradation will reduce contaminant concentrations inground water to below risk-based corrective action or regu-latory levels before potential receptor exposure pathwaysare completed. This requires a projection of the potentialextent and concentration of the contaminant plume in timeand space. The projection should be based on historicvariations in, and the current extent and concentrationsof, the contaminant plume, as well as the measuredrates of contaminant attenuation. Because of the inher-ent uncertainty associated with such predictions, theinvestigator must provide sufficient evidence to demon-strate that the mechanisms of natural attenuation willreduce contaminant concentrations to acceptable levelsbefore potential receptors are reached. This requires theuse of conservative solute fate-and-transport model in-put parameters and numerous sensitivity analyses sothat consideration is given to all plausible contaminantmigration scenarios. When possible, both historical dataand modeling should be used to provide information thatcollectively and consistently supports the natural reduc-tion and removal of the dissolved contaminant plume.
Figure 1 outlines the steps involved in the natural at-tenuation demonstration. This figure also shows theimportant regulatory decision points in the process ofimplementing natural attenuation. Predicting the fate ofa contaminant plume requires the quantification of sol-ute transport and transformation processes. Quantifica-tion of contaminant migration and attenuation rates andsuccessful implementation of the natural attenuation re-medial option requires completion of the following steps:
1. Review available site data, and develop a preliminaryconceptual model.
2. Screen the site, and assess the potential for naturalattenuation.
3. Collect additional site characterization data to supportnatural attenuation, as required.
4. Refine the conceptual model, complete premodelingcalculations, and document indicators of naturalattenuation.
5. Simulate natural attenuation using analytical ornumerical solute fate-and-transport models that allowincorporation of a biodegradation term, as necessary.
6. Identify potential receptors, and conduct anexposure-pathway analysis.
7. Evaluate the practicability and potential efficiency ofsupplemental source removal options.
8. If natural attenuation with or without source removalis acceptable, prepare a long-term monitoring plan.
9. Present findings to regulatory agencies, and obtainapproval for remediation by natural attenuation.
Review Available Site Data, and Develop aPreliminary Conceptual Model
Existing site characterization data should be reviewedand used to develop a conceptual model for the site. Thepreliminary conceptual model will help identify anyshortcomings in the data and will allow placement ofadditional data collection points in the most scientificallyadvantageous and cost-effective manner. A conceptualmodel is a three-dimensional representation of theground-water flow and solute transport system based onavailable geological, biological, geochemical, hydrologi-cal, climatological, and analytical data for the site. Thistype of conceptual model differs from the conceptual sitemodels that risk assessors commonly use that qualita-tively consider the location of contaminant sources, re-lease mechanisms, transport pathways, exposurepoints, and receptors. The ground-water system con-ceptual model, however, facilitates identification of theserisk-assessment elements for the exposure pathwaysanalysis. After development, the conceptual model canbe used to help determine optimal placement of addi-tional data collection points (as necessary) to aid in thenatural attenuation investigation and to develop the sol-ute fate-and-transport model.
Contracting and management controls must be flexibleenough to allow for the potential for revisions to theconceptual model and thus the data collection effort. Incases where few or no site-specific data are available,all future site characterization activities should be de-signed to collect the data necessary to screen the siteto determine the potential for remediation by naturalattenuation. The additional costs incurred by such datacollection are greatly outweighed by the cost savingsthat will be realized if natural attenuation is selected.Moreover, most of the data collected in support of natu-ral attenuation can be used to design and support otherremedial measures.
Table 1 contains the soil and ground-water analyticalprotocol for natural attenuation of chlorinated aliphatichydrocarbons and/or fuel hydrocarbons. Table 1A lists astandard set of methods, while Table 1B lists methodsthat are under development and/or consideration. Anyplan to collect additional ground-water and soil qualitydata should include targeting the analytes listed in Table1A, and possibly Table 1B.
43

Figure 1. Natural attenuation of chlorinated solvents flow chart.
44
Review Available Site Data and Develop Preliminary Conceptual Model
Screen the Site using the Procedure Presented in Figure 3
NO >-Y_E_S _____ .. Engineered Remediation Required, Implement Other Protocols
Perform Site Characterization to Support Remedy Decision Making
Evaluate Use of ~.;..;N;.;;;O;""' ___ """;;:III Selected Additional ... ___ _
Perform Site Characterization to Support Natural Attenuation
Refine Conceptual Model and Complete Pre-Modeling
Calculations
Simulate Natural Attenuation Using Solute Fate and
Transport Models
Initiate Verification of Natural Attenuation
using Long-Term Monitoring
Use Results of Modeling and Site-Specific Information in an Exposure Pathways Analysis
YES
NO
Remedial Options Along with
Natural Attenuation
Present Findings and Proposed
Remediation Strategy o Regulatory Agencies
NO
Assess Potential For Natural Attenuation With Remediation System Installed
Refine Conceptual Model and Complete Pre-Modeling
Calculations
Simulate Natural Attenuation Combined with Remedial Option Selected Above
Using Solute Transport Model
Initiate Verification of Natural Attenuation
using Long-Term Monitoring
Use Results of Modeling and Site-Specific Information in an Ex osure Assessment
YES

Table 1A. Soil and Ground-Water Analytical Protocol a
Matrix Analysis Method/Reference b-e Comments f,g Data Use
Recommended Frequency ofAnalysis
Sample Volume,Sample Container,Sample Preservation
Field orFixed-BaseLaboratory
Soil Volatileorganiccompounds
SW8260A Handbookmethodmodified forfield extractionof soil usingmethanol
Useful for determiningthe extent of soilcontamination, thecontaminant masspresent, and the needfor source removal
Each soilsampling round
Collect 100 g of soilin a glass containerwith Teflon-lined cap;cool to 4°C
Fixed-base
Soil Totalorganiccarbon(TOC)
SW9060, modified for soil samples
Proceduremust beaccurate overthe range of0.5 to 15%TOC
The amount of TOCin the aquifer matrixinfluencescontaminant migrationand biodegradation
At initialsampling
Collect 100 g of soilin a glass containerwith Teflon-lined cap;cool to 4°C
Fixed-base
Soilgas
O2, CO2 Field soil gas analyzer
Useful for determiningbioactivity in thevadose zone
At initialsampling andrespirationtesting
Reuseable 3-L Tedlar bags
Field
Soilgas
Fuel andchlorinatedvolatileorganiccompounds
EPA Method TO-14
Useful for determiningthe distribution ofchlorinated and BTEXcompounds in soil
At initialsampling
1-L Summa canister Fixed-base
Water Volatileorganiccompounds
SW8260A Handbookmethod;analysis maybe extended tohighermolecular-weight alkylbenzenes
Method of analysis forBTEX and chlorinatedsolvents/byproducts
Each samplinground
Collect watersamples in a 40-mLvolatile organicanalysis vial; cool to4°C; add hydrochloricacid to pH 2
Fixed-base
Water Polycyclicaromatichydro-carbons(PAHs)(optional;intendedfor dieseland otherheavy oils)
Gas chromatography/mass spectroscopyMethod SW8270B;high-performanceliquid chromatographyMethod SW8310
Analysisneeded onlywhen requiredfor regulatorycompliance
PAHs are componentsof fuel and aretypically analyzed forregulatory compliance
As required byregulations
Collect 1 L of water in a glass container;cool to 4°C
Fixed-base
Water Oxygen DO meter Refer toMethod A4500for acomparablelaboratoryprocedure
Concentrations lessthan 1 mg/L generallyindicate an anaerobicpathway
Each samplinground
Measure DO on siteusing a flow-throughcell
Field
Water Nitrate Iron chromatographyMethod E300; anionmethod
Method E300is a handbookmethod; alsoprovideschloride data
Substrate for microbialrespiration if oxygenis depleted
Each samplinground
Collect up to 40 mLof water in a glass orplastic container; addH2SO4 to pH lessthan 2; cool to 4°C
Fixed-base
Water Iron(II)(Fe+2)
Colorimetric HACHMethod 8146
Filter if turbid May indicate ananaerobic degradationprocess due todepletion of oxygen,nitrate, andmanganese
Each samplinground
Collect 100 mL ofwater in a glasscontainer
Field
45
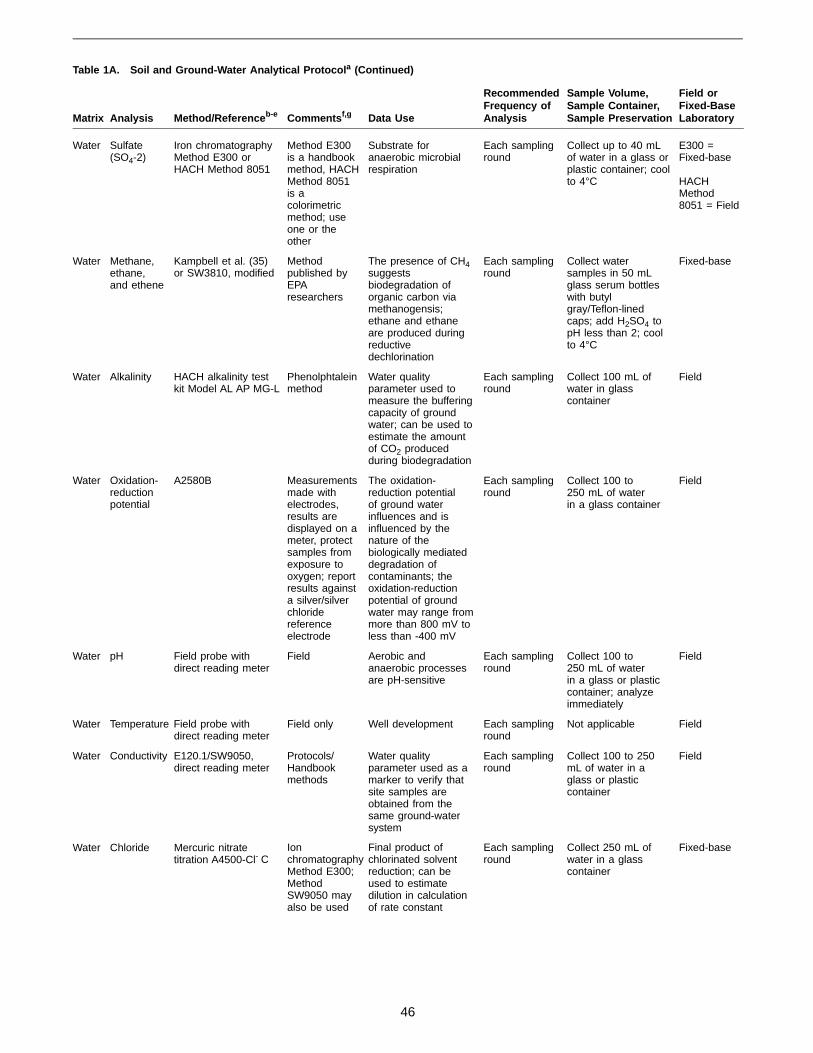
Matrix Analysis Method/Reference b-e Comments f,g Data Use
Recommended Frequency ofAnalysis
Sample Volume,Sample Container,Sample Preservation
Field orFixed-BaseLaboratory
Water Sulfate(SO4-2)
Iron chromatographyMethod E300 orHACH Method 8051
Method E300is a handbookmethod, HACHMethod 8051is acolorimetricmethod; useone or theother
Substrate foranaerobic microbialrespiration
Each samplinground
Collect up to 40 mLof water in a glass orplastic container; coolto 4°C
E300 =Fixed-base
HACHMethod8051 = Field
Water Methane,ethane,and ethene
Kampbell et al. (35)or SW3810, modified
Methodpublished byEPAresearchers
The presence of CH4suggestsbiodegradation oforganic carbon viamethanogensis;ethane and ethaneare produced duringreductivedechlorination
Each samplinground
Collect watersamples in 50 mLglass serum bottleswith butylgray/Teflon-linedcaps; add H2SO4 topH less than 2; coolto 4°C
Fixed-base
Water Alkalinity HACH alkalinity testkit Model AL AP MG-L
Phenolphtaleinmethod
Water qualityparameter used tomeasure the bufferingcapacity of groundwater; can be used toestimate the amountof CO2 producedduring biodegradation
Each samplinground
Collect 100 mL ofwater in glasscontainer
Field
Water Oxidation-reductionpotential
A2580B Measurementsmade withelectrodes,results aredisplayed on ameter, protectsamples fromexposure tooxygen; reportresults againsta silver/silverchloridereferenceelectrode
The oxidation-reduction potential of ground waterinfluences and isinfluenced by thenature of thebiologically mediateddegradation ofcontaminants; theoxidation-reductionpotential of groundwater may range frommore than 800 mV toless than -400 mV
Each samplinground
Collect 100 to 250 mL of water in a glass container
Field
Water pH Field probe withdirect reading meter
Field Aerobic andanaerobic processesare pH-sensitive
Each samplinground
Collect 100 to 250 mL of water in a glass or plasticcontainer; analyzeimmediately
Field
Water Temperature Field probe withdirect reading meter
Field only Well development Each samplinground
Not applicable Field
Water Conductivity E120.1/SW9050,direct reading meter
Protocols/Handbookmethods
Water qualityparameter used as amarker to verify thatsite samples areobtained from thesame ground-watersystem
Each samplinground
Collect 100 to 250mL of water in aglass or plasticcontainer
Field
Water Chloride Mercuric nitratetitration A4500-Cl- C
Ionchromatography Method E300;MethodSW9050 mayalso be used
Final product ofchlorinated solventreduction; can beused to estimatedilution in calculationof rate constant
Each samplinground
Collect 250 mL ofwater in a glasscontainer
Fixed-base
Table 1A. Soil and Ground-Water Analytical Protocol a (Continued)
46

Matrix Analysis Method/Reference b-e Comments f,g Data Use
Recommended Frequency ofAnalysis
Sample Volume,Sample Container,Sample Preservation
Field orFixed-BaseLaboratory
Water Chloride(optional;see datause)
HACH chloride testkit Model 8-P
Silver nitratetitration
As above, and toguide selection ofadditional data pointsin real time while inthe field
Each samplinground
Collect 100 mL ofwater in a glasscontainer
Field
Water Totalorganiccarbon
SW9060 Laboratory Used to classifyplumes and todetermine whetheranaerobic metabolismof chlorinated solventsis possible in theabsence ofanthropogenic carbon
Each samplinground
Collect 100 mL ofwater in a glasscontainer; cool
Laboratory
a Analyses other than those listed in this table may be required for regulatory compliance.b “SW” refers to the Test Methods for Evaluating Solid Waste, Physical, and Chemical Methods (29).c “E” refers to Methods for Chemical Analysis of Water and Wastes (30).d “HACH” refers to the Hach Company catalog (31).e “A” refers to Standard Methods for the Examination of Water and Wastewater (32).f “Handbook” refers to the AFCEE Handbook to Support the Installation Restoration Program (IRP) Remedial Investigations and Feasibility
Studies (RI/FS) (33).g “Protocols” refers to the AFCEE Environmental Chemistry Function Installation Restoration Program Analytical Protocols (34).
Table 1A. Soil and Ground-Water Analytical Protocol a (Continued)
Table 1B. Soil and Ground-Water Analytical Protocol: Special Analyses Under Development and/or Consideration a,b
Matrix Analysis Method/Reference Comments Data Use
RecommendedFrequencyof Analysis
Sample Volume,Container,Preservation
Field orFixed-BaseLaboratory
Soil Biologicallyavailable iron(III)
Under development HClextractionfollowed byquantificationof releasediron(III)
To predict thepossible extent ofiron reduction inan aquifer
One round ofsampling infive borings,five coresfrom eachboring
Collect minimum1-inch diametercore samples intoa plastic liner; capand preventaeration
Laboratory
Water Nutritionalquality of nativeorganic matter
Under development Spectro-photometricmethod
To determine theextent of reductivedechlorinationallowed by thesupply of electrondonor
One round ofsampling intwo to fivewells
Collect 1,000 mLin an amber glasscontainer
Laboratory
Water Hydrogen (H2) Equilibration withgas in the field;determined with areducing gasdetector
Specializedanalysis
To determine theterminal electronaccepting process;predicts thepossibility forreductivedechlorination
One round ofsampling
Sampling at wellhead requires theproduction of 100mL per minute ofwater for 30minutes
Field
Water Oxygenates(includingmethyl-tert-butylether, ethers,acetic acid,methanol, andacetone)
SW8260/8015c Laboratory Contaminant orelectron donorsfor dechlorinationof solvents
At least onesamplinground or asdeterminedby regulators
Collect 1 L ofwater in a glasscontainer;preserve with HCl
Laboratory
a Analyses other than those listed in this table may be required for regulatory compliance.b Site characterization should not be delayed if these methods are unavailable.c “SW” refers to Test Methods for Evaluating Solid Waste, Physical and Chemical Methods (29).
47

Screen the Site, and Assess the Potential forNatural Attenuation
After reviewing available site data and developing apreliminary conceptual model, an assessment of thepotential for natural attenuation must be made. As statedpreviously, existing data can be useful in determiningwhether natural attenuation will be sufficient to preventa dissolved contaminant plume from completing expo-sure pathways, or from reaching a predetermined pointof compliance, in concentrations above applicable regu-latory or risk-based corrective action standards. Deter-mining the likelihood of exposure pathway completion isan important component of the natural attenuation in-vestigation. This is achieved by estimating the migrationand future extent of the plume based on contaminantproperties, including volatility, sorptive properties, andbiodegradability; aquifer properties, including hydraulicgradient, hydraulic conductivity, porosity, and total or-ganic carbon (TOC) content; and the location of theplume and contaminant source relative to potential re-ceptors (i.e., the distance between the leading edge ofthe plume and the potential receptor exposure points).These parameters (estimated or actual) are used in thissection to make a preliminary assessment of the effec-tiveness of natural attenuation in reducing contaminantconcentrations.
If, after completing the steps outlined in this section, itappears that natural attenuation will be a significantfactor in contaminant removal, detailed site charac-terization activities in support of this remedial optionshould be performed. If exposure pathways have al-ready been completed and contaminant concentrationsexceed regulatory levels, or if such completion is likely,other remedial measures should be considered, possi-bly in conjunction with natural attenuation. Even so, thecollection of data in support of the natural attenuationoption can be integrated into a comprehensive remedialplan and may help reduce the cost and duration of otherremedial measures, such as intensive source removaloperations or pump-and-treat technologies. For exam-ple, dissolved iron concentrations can have a profoundinfluence on the design of pump-and-treat systems.
Based on the experience of the authors, in an estimated80 percent of fuel hydrocarbon spills at federal facilities,natural attenuation alone will be protective of humanhealth and the environment. For spills of chlorinatedaliphatic hydrocarbons at federal facilities, however,natural attenuation alone will be protective of humanhealth and the environment in an estimated 20 percentof the cases. With this in mind, it is easy to understandwhy an accurate assessment of the potential for naturalbiodegradation of chlorinated compounds should bemade before investing in a detailed study of naturalattenuation. The screening process presented in thissection is outlined in Figure 2. This approach should
allow the investigator to determine whether natural attenu-ation is likely to be a viable remedial alternative beforeadditional time and money are expended. The data re-quired to make the preliminary assessment of naturalattenuation can also be used to aid the design of anengineered remedial solution, should the screening proc-ess suggest that natural attenuation alone is not feasible.
The following information is required for the screeningprocess:
• The chemical and geochemical data presented inTable 2 for a minimum of six samples. Figure 3shows the approximate location of these data collec-tion points. If other contaminants are suspected, thendata on the concentration and distribution of thesecompounds also should be obtained.
• Locations of source(s) and receptor(s).
• An estimate of the contaminant transport velocity anddirection of ground-water flow.
Once these data have been collected, the screeningprocess can be undertaken. The following steps sum-marize the screening process:
1. Determine whether biodegradation is occurring usinggeochemical data. If biodegradation is occurring,proceed to Step 2. If it is not, assess the amount andtypes of data available. If data are insufficient todetermine whether biodegradation is occurring,collect supplemental data.
2. Determine ground-water flow and solute transportparameters. Hydraulic conductivity and porosity maybe estimated, but the ground-water gradient and flowdirection may not. The investigator should use thehighest hydraulic conductivity measured at the siteduring the preliminary screening because soluteplumes tend to follow the path of least resistance(i.e., highest hydraulic conductivity). This will give the“worst case” estimate of solute migration over agiven period.
3. Locate sources and receptor exposure points.
4. Estimate the biodegradation rate constant. Bio-degradation rate constants can be estimated usinga conservative tracer found commingled with thecontaminant plume, as described by Wiedemeier etal. (36). When dealing with a plume that containsonly chlorinated solvents, this procedure will have tobe modified to use chloride as a tracer. Rateconstants derived from microcosm studies can alsobe used. If it is not possible to estimate thebiodegradation rate using these procedures, thenuse a range of accepted literature values forbiodegradation of the contaminants of concern.
48

Figure 2. Initial screening process flow chart.
49
Analyze Available Site Data to Determine if Biodegradation ... --... Collect More Screening Data
is Occurring
No or
Insufficient Data
Determine Groundwater Flow and Solute Transport Parameters using
Site-Specific Data; Porosity and Dispersivity May be Estimated
Compare the Rate of Transport to the Rate of Attenuation using
Analytical Solute Transport Model
Perform Site Characterization to Support Natural Attenuation
Proceed to Figure 1
No
Yes
Evaluate use of Selected Additional Remedial Options
along with Natural Attenuation
Engineered Remediation Required,
Implement Other Protocols
Proceed to
Figure 1
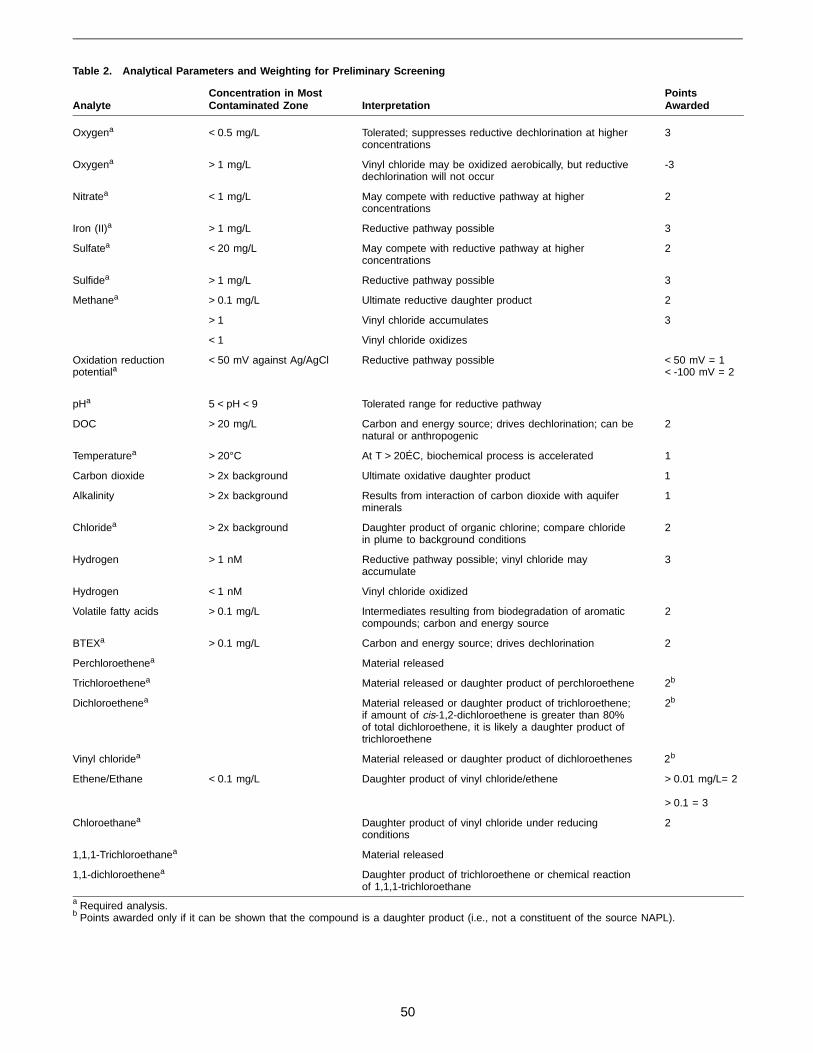
Table 2. Analytical Parameters and Weighting for Preliminary Screening
AnalyteConcentration in MostContaminated Zone Interpretation
PointsAwarded
Oxygena < 0.5 mg/L Tolerated; suppresses reductive dechlorination at higherconcentrations
3
Oxygena > 1 mg/L Vinyl chloride may be oxidized aerobically, but reductivedechlorination will not occur
-3
Nitratea < 1 mg/L May compete with reductive pathway at higherconcentrations
2
Iron (II)a > 1 mg/L Reductive pathway possible 3
Sulfatea < 20 mg/L May compete with reductive pathway at higherconcentrations
2
Sulfidea > 1 mg/L Reductive pathway possible 3
Methanea > 0.1 mg/L Ultimate reductive daughter product 2
> 1 Vinyl chloride accumulates 3
< 1 Vinyl chloride oxidizes
Oxidation reductionpotentiala
< 50 mV against Ag/AgCl Reductive pathway possible < 50 mV = 1< -100 mV = 2
pHa 5 < pH < 9 Tolerated range for reductive pathway
DOC > 20 mg/L Carbon and energy source; drives dechlorination; can benatural or anthropogenic
2
Temperaturea > 20°C At T > 20ÉC, biochemical process is accelerated 1
Carbon dioxide > 2x background Ultimate oxidative daughter product 1
Alkalinity > 2x background Results from interaction of carbon dioxide with aquiferminerals
1
Chloridea > 2x background Daughter product of organic chlorine; compare chloridein plume to background conditions
2
Hydrogen > 1 nM Reductive pathway possible; vinyl chloride mayaccumulate
3
Hydrogen < 1 nM Vinyl chloride oxidized
Volatile fatty acids > 0.1 mg/L Intermediates resulting from biodegradation of aromaticcompounds; carbon and energy source
2
BTEXa > 0.1 mg/L Carbon and energy source; drives dechlorination 2
Perchloroethenea Material released
Trichloroethenea Material released or daughter product of perchloroethene 2b
Dichloroethenea Material released or daughter product of trichloroethene;if amount of cis-1,2-dichloroethene is greater than 80%of total dichloroethene, it is likely a daughter product oftrichloroethene
2b
Vinyl chloridea Material released or daughter product of dichloroethenes 2b
Ethene/Ethane < 0.1 mg/L Daughter product of vinyl chloride/ethene > 0.01 mg/L= 2
> 0.1 = 3
Chloroethanea Daughter product of vinyl chloride under reducingconditions
2
1,1,1-Trichloroethanea Material released
1,1-dichloroethenea Daughter product of trichloroethene or chemical reactionof 1,1,1-trichloroethane
a Required analysis.b Points awarded only if it can be shown that the compound is a daughter product (i.e., not a constituent of the source NAPL).
50
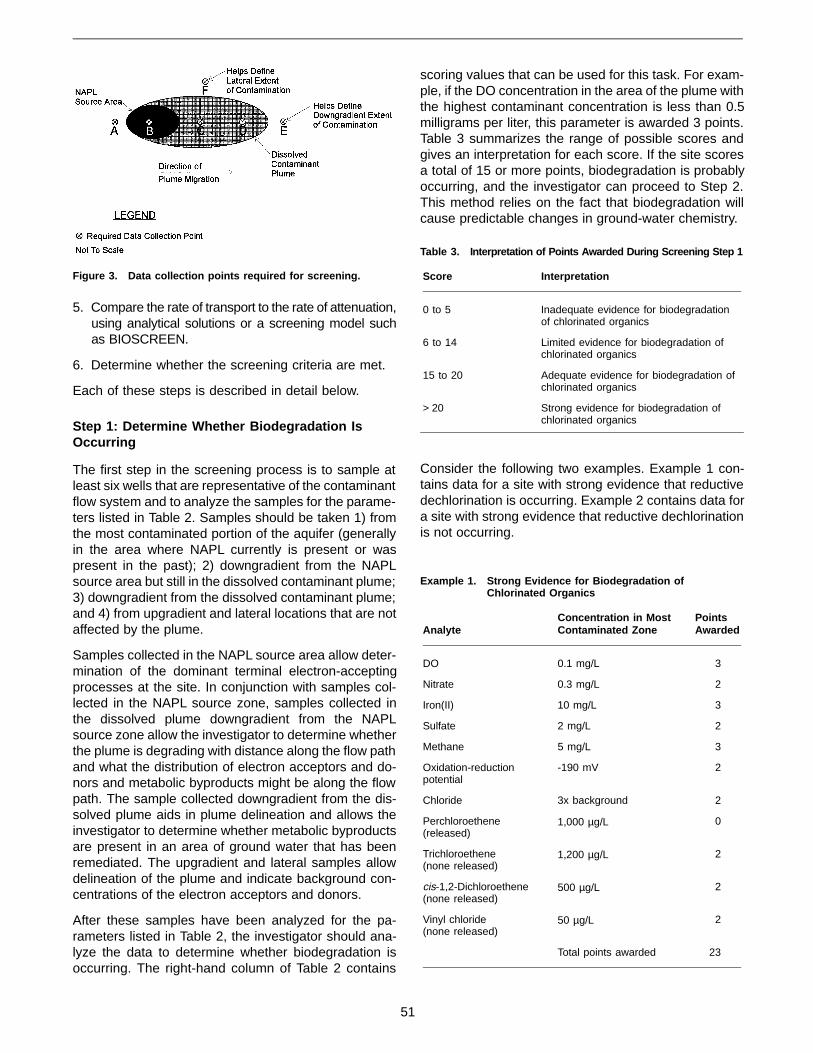
5. Compare the rate of transport to the rate of attenuation,using analytical solutions or a screening model suchas BIOSCREEN.
6. Determine whether the screening criteria are met.
Each of these steps is described in detail below.
Step 1: Determine Whether Biodegradation IsOccurring
The first step in the screening process is to sample atleast six wells that are representative of the contaminantflow system and to analyze the samples for the parame-ters listed in Table 2. Samples should be taken 1) fromthe most contaminated portion of the aquifer (generallyin the area where NAPL currently is present or waspresent in the past); 2) downgradient from the NAPLsource area but still in the dissolved contaminant plume;3) downgradient from the dissolved contaminant plume;and 4) from upgradient and lateral locations that are notaffected by the plume.
Samples collected in the NAPL source area allow deter-mination of the dominant terminal electron-acceptingprocesses at the site. In conjunction with samples col-lected in the NAPL source zone, samples collected inthe dissolved plume downgradient from the NAPLsource zone allow the investigator to determine whetherthe plume is degrading with distance along the flow pathand what the distribution of electron acceptors and do-nors and metabolic byproducts might be along the flowpath. The sample collected downgradient from the dis-solved plume aids in plume delineation and allows theinvestigator to determine whether metabolic byproductsare present in an area of ground water that has beenremediated. The upgradient and lateral samples allowdelineation of the plume and indicate background con-centrations of the electron acceptors and donors.
After these samples have been analyzed for the pa-rameters listed in Table 2, the investigator should ana-lyze the data to determine whether biodegradation isoccurring. The right-hand column of Table 2 contains
scoring values that can be used for this task. For exam-ple, if the DO concentration in the area of the plume withthe highest contaminant concentration is less than 0.5milligrams per liter, this parameter is awarded 3 points.Table 3 summarizes the range of possible scores andgives an interpretation for each score. If the site scoresa total of 15 or more points, biodegradation is probablyoccurring, and the investigator can proceed to Step 2.This method relies on the fact that biodegradation willcause predictable changes in ground-water chemistry.
Consider the following two examples. Example 1 con-tains data for a site with strong evidence that reductivedechlorination is occurring. Example 2 contains data fora site with strong evidence that reductive dechlorinationis not occurring.
Figure 3. Data collection points required for screening.
Table 3. Interpretation of Points Awarded During Screening Step 1
Score Interpretation
0 to 5 Inadequate evidence for biodegradationof chlorinated organics
6 to 14 Limited evidence for biodegradation ofchlorinated organics
15 to 20 Adequate evidence for biodegradation ofchlorinated organics
> 20 Strong evidence for biodegradation ofchlorinated organics
Example 1. Strong Evidence for Biodegradation ofChlorinated Organics
AnalyteConcentration in Most Contaminated Zone
PointsAwarded
DO 0.1 mg/L 3
Nitrate 0.3 mg/L 2
Iron(II) 10 mg/L 3
Sulfate 2 mg/L 2
Methane 5 mg/L 3
Oxidation-reductionpotential
-190 mV 2
Chloride 3x background 2
Perchloroethene(released)
1,000 µg/L 0
Trichloroethene (none released)
1,200 µg/L 2
cis-1,2-Dichloroethene(none released)
500 µg/L 2
Vinyl chloride (none released)
50 µg/L 2
Total points awarded 23
51

In this example, the investigator can infer that biodegra-dation is occurring and may proceed to Step 2.
In this example, the investigator can infer that biodegra-dation is probably not occurring or is occurring too slowlyto be a viable remedial option. In this case, the investi-gator cannot proceed to Step 2 and will likely have toimplement an engineered remediation system.
Step 2: Determine Ground-Water Flow and SoluteTransport Parameters
After biodegradation has been shown to be occurring, itis important to quantify ground-water flow and solutetransport parameters. This will make it possible to usea solute transport model to quantitatively estimate theconcentration of the plume and its direction and rate oftravel. To use an analytical model, it is necessary toknow the hydraulic gradient and hydraulic conductivityfor the site and to have estimates of the porosity anddispersivity. The coefficient of retardation also is helpfulto know. Quantification of these parameters is discussedby Wiedemeier et al. (1).
To make modeling as accurate as possible, the investi-gator must have site-specific hydraulic gradient and hy-draulic conductivity data. To determine the ground-waterflow and solute transport direction, the site must have atleast three accurately surveyed wells. The porosity anddispersivity are generally estimated using accepted lit-erature values for the types of sediments found at thesite. If the investigator does not have TOC data for soil,the coefficient of retardation can be estimated; however,
assuming that the solute transport and ground-watervelocities are the same may be more conservative.
Step 3: Locate Sources and Receptor ExposurePoints
To determine the length of flow for the predictive model-ing conducted in Step 5, it is important to know thedistance between the source of contamination, thedowngradient end of the dissolved plume, and any po-tential downgradient or cross-gradient receptors.
Step 4: Estimate the Biodegradation RateConstant
Biodegradation is the most important process that de-grades contaminants in the subsurface; therefore, thebiodegradation rate is one of the most important modelinput parameters. Biodegradation of chlorinated ali-phatic hydrocarbons can commonly be represented asa first-order rate constant. Site-specific biodegradationrates generally are best to use. Calculation of site-spe-cific biodegradation rates is discussed by Wiedemeieret al. (1, 36, 37). If determining site-specific biodegrada-tion rates is impossible, then literature values for thebiodegradation rate of the contaminant of interest mustbe used. It is generally best to start with the averagevalue and then to vary the model input to predict “bestcase” and “worst case” scenarios. Estimated biodegra-dation rates can be used only after biodegradation hasbeen shown to be occurring (see Step 1).
Step 5: Compare the Rate of Transport to theRate of Attenuation
At this early stage in the natural attenuation demonstra-tion, comparison of the rate of solute transport to the rateof attenuation is best accomplished using an analyticalmodel. Several analytical models are available, but theBIOSCREEN model is probably the simplest to use.This model is nonproprietary and is available from theRobert S. Kerr Laboratory’s home page on the Internet(www.epa.gov/ada/kerrlab.html). The BIOSCREENmodel is based on Domenico’s solution to the advection-dispersion equation (38), and allows use of either afirst-order biodegradation rate or an instantaneous reac-tion between contaminants and electron acceptors tosimulate the effects of biodegradation. To model trans-port of chlorinated aliphatic hydrocarbons usingBIOSCREEN, only the first-order decay rate optionshould be used. BIOCHLOR, a similar model, is underdevelopment by the Technology Transfer Division ofAFCEE. This model will likely use the same analyticalsolution as BIOSCREEN but will be geared towardsevaluating transport of chlorinated compounds underthe influence of biodegradation.
The primary purpose of comparing the rate of transportwith the rate of attenuation is to determine whether the
Example 2. Biodegradation of Chlorinated Organics Unlikely
AnalyteConcentration in MostContaminated Zone
PointsAwarded
DO 3 mg/L -3
Nitrate 0.3 mg/L 2
Iron(II) Not detected 0
Sulfate 10 mg/L 2
Methane ND 0
Oxidation-reductionpotential
100 mV 0
Chloride Background 0
Trichloroethene(released)
1,200 µg/L 0
cis-1,2-Dichloroethene Not detected 0
Vinyl chloride ND 0
Total points awarded 1
52

residence time along the flow path is adequate to beprotective of human health and the environment (i.e., toqualitatively estimate whether the contaminant is attenu-ating at a rate fast enough to allow degradation of thecontaminant to acceptable concentrations before recep-tors are reached). It is important to perform a sensitivityanalysis to help evaluate the confidence in the prelimi-nary screening modeling effort. If modeling shows thatreceptors may not be exposed to contaminants at con-centrations above risk-based corrective action criteria,then the screening criteria are met, and the investigatorcan proceed with the natural attenuation feasibility study.
Step 6: Determine Whether the Screening CriteriaAre Met
Before proceeding with the full-scale natural attenuationfeasibility study, the investigator should ensure that theanswers to all of the following criteria are “yes”:
• Has the plume moved a distance less than expected,based on the known (or estimated) time since thecontaminant release and the contaminant velocity, ascalculated from site-specific measurements of hydrau-lic conductivity and hydraulic gradient, as well as esti-mates of effective porosity and contaminantretardation?
• Is it likely that the contaminant mass is attenuatingat rates sufficient to be protective of human healthand the environment at a point of discharge to asensitive environmental receptor?
• Is the plume going to attenuate to concentrationsless than risk-based corrective action guidelines be-fore reaching potential receptors?
Collect Additional Site Characterization DataTo Support Natural Attenuation, As Required
Detailed site characterization is necessary to documentthe potential for natural attenuation. Review of existingsite characterization data is particularly useful beforeinitiating site characterization activities. Such reviewshould allow identification of data gaps and guide the mosteffective placement of additional data collection points.
There are two goals during the site characterizationphase of a natural attenuation investigation. The first isto collect the data needed to determine whether naturalmechanisms of contaminant attenuation are occurringat rates sufficient to protect human health and the envi-ronment. The second is to provide sufficient site-specificdata to allow prediction of the future extent and concen-tration of a contaminant plume through solute fate-and-transport modeling. Because the burden of proof fornatural attenuation is on the proponent, detailed sitecharacterization is required to achieve these goals andto support this remedial option. Adequate site charac-
terization in support of natural attenuation requires thatthe following site-specific parameters be determined:
• The extent and type of soil and ground-watercontamination.
• The location and extent of contaminant source area(s)(i.e., areas containing mobile or residual NAPL).
• The potential for a continuing source due to leakingtanks or pipelines.
• Aquifer geochemical parameters.
• Regional hydrogeology, including drinking wateraquifers and regional confining units.
• Local and site-specific hydrogeology, including localdrinking water aquifers; location of industrial, agricul-tural, and domestic water wells; patterns of aquiferuse (current and future); lithology; site stratigraphy,including identification of transmissive and nontrans-missive units; grain-size distribution (sand versus siltversus clay); aquifer hydraulic conductivity; ground-water hydraulic information; preferential flow paths;locations and types of surface water bodies; andareas of local ground-water recharge and discharge.
• Identification of potential exposure pathways andreceptors.
The following sections describe the methodologies thatshould be implemented to allow successful site charac-terization in support of natural attenuation. Additional infor-mation can be obtained from Wiedemeier et al. (1, 37).
Soil Characterization
To adequately define the subsurface hydrogeologic sys-tem and to determine the amount and three-dimensionaldistribution of mobile and residual NAPL that can act asa continuing source of ground-water contamination, ex-tensive soil characterization must be completed. De-pending on the status of the site, this work may havebeen completed during previous remedial investigationactivities. The results of soils characterization will beused as input into a solute fate-and-transport model tohelp define a contaminant source term and to supportthe natural attenuation investigation.
The purpose of soil sampling is to determine the subsur-face distribution of hydrostratigraphic units and the dis-tribution of mobile and residual NAPL. These objectivescan be achieved through the use of conventional soilborings or direct-push methods (e.g., Geoprobe or conepenetrometer testing). All soil samples should be col-lected, described, analyzed, and disposed of in accord-ance with local, state, and federal guidance. Wiedemeieret al. (1) present suggested procedures for soil samplecollection. These procedures may require modificationto comply with local, state, and federal regulations or toaccommodate site-specific conditions.
53
The analytical protocol to be used for soil sample analy-sis is presented in Table 1. This analytical protocolincludes all of the parameters necessary to documentnatural attenuation, including the effects of sorption andbiodegradation. Knowledge of the location, distribution,concentration, and total mass of contaminants of regu-latory concern sorbed to soils or present as residualand/or mobile NAPL is required to calculate contaminantpartitioning from NAPL into ground water. Knowledge ofthe TOC content of the aquifer matrix is important forsorption and solute-retardation calculations. TOC sam-ples should be collected from a background location inthe stratigraphic horizon(s) where most contaminanttransport is expected to occur. Oxygen and carbon di-oxide measurements of soil gas can be used to findareas in the unsaturated zone where biodegradation isoccurring. Knowledge of the distribution of contaminantsin soil gas can be used as a cost-effective way toestimate the extent of soil contamination.
Ground-Water Characterization
To adequately determine the amount and three-dimen-sional distribution of dissolved contamination and todocument the occurrence of natural attenuation,ground-water samples must be collected and analyzed.Biodegradation of organic compounds, whether naturalor anthropogenic, brings about measurable changes inthe chemistry of ground water in the affected area. Bymeasuring these changes, documentation and quantita-tive evaluation of natural attenuation’s importance at asite are possible.
Ground-water sampling is conducted to determine theconcentrations and distribution of contaminants, daugh-ter products, and ground-water geochemical parame-ters. Ground-water samples may be obtained frommonitoring wells or with point-source sampling devicessuch as a Geoprobe, Hydropunch, or cone penetrome-ter. All ground-water samples should be collected inaccordance with local, state, and federal guidelines.Wiedemeier et al. (1) suggest procedures for ground-water sample collection. These procedures may need tobe modified to comply with local, state, and federalregulations or to accommodate site-specific conditions.
The analytical protocol for ground-water sample analy-sis is presented in Table 1. This analytical protocol in-cludes all of the parameters necessary to documentnatural attenuation, including the effects of sorption andbiodegradation. Data obtained from the analysis ofground water for these analytes is used to scientificallydocument natural attenuation and can be used as inputinto a solute fate-and-transport model. The followingparagraphs describe each ground-water analytical pa-rameter and the use of each analyte in the naturalattenuation demonstration.
Volatile organic compound analysis (by MethodSW8260a) is used to determine the types, concentra-tions, and distributions of contaminants and daughterproducts in the aquifer. DO is the electron acceptor mostthermodynamically favored by microbes for the biode-gradation of organic carbon, whether natural or anthro-pogenic. Reductive dechlorination will not occur,however, if DO concentrations are above approximately0.5 milligrams per liter. During aerobic biodegradation ofa substrate, DO concentrations decrease because ofthe microbial oxygen demand. After DO depletion, an-aerobic microbes will use nitrate as an electron ac-ceptor, followed by iron(III), then sulfate, and finallycarbon dioxide (methanogenesis). Each sequential re-action drives the oxidation-reduction potential of theground water further into the realm where reductivedechlorination can occur. The oxidation-reduction po-tential range of sulfate reduction and methanogenesis isoptimal, but reductive dechlorination may occur undernitrate- and iron(III)-reducing conditions as well. Be-cause reductive dechlorination works best in the sulfate-reduction and methanogenesis oxidation-reductionpotential range, competitive exclusion between micro-bial sulfate reducers, methanogens, and reductivedechlorinators can occur.
After DO has been depleted in the microbiological treat-ment zone, nitrate may be used as an electron acceptorfor anaerobic biodegradation via denitrification. In somecases iron(III) is used as an electron acceptor duringanaerobic biodegradation of electron donors. During thisprocess, iron(III) is reduced to iron(II), which may besoluble in water. Iron(II) concentrations can thus be usedas an indicator of anaerobic degradation of fuel com-pounds. After DO, nitrate, and bioavailable iron(III) havebeen depleted in the microbiological treatment zone,sulfate may be used as an electron acceptor for anaero-bic biodegradation. This process is termed sulfate re-duction and results in the production of sulfide. Duringmethanogenesis (an anaerobic biodegradation proc-ess), carbon dioxide (or acetate) is used as an electronacceptor, and methane is produced. Methanogenesisgenerally occurs after oxygen, nitrate, bioavailableiron(III), and sulfate have been depleted in the treatmentzone. The presence of methane in ground water isindicative of strongly reducing conditions. Becausemethane is not present in fuel, the presence of methanein ground water above background concentrations incontact with fuels is indicative of microbial degradationof fuel hydrocarbons.
The total alkalinity of a ground-water system is indicativeof a water’s capacity to neutralize acid. Alkalinity isdefined as “the net concentration of strong base inexcess of strong acid with a pure CO2-water system asthe point of reference” (39). Alkalinity results from thepresence of hydroxides, carbonates, and bicarbonatesof elements such as calcium, magnesium, sodium, po-
54

tassium, or ammonia. These species result from thedissolution of rock (especially carbonate rocks), thetransfer of carbon dioxide from the atmosphere, and therespiration of microorganisms. Alkalinity is important inthe maintenance of ground-water pH because it buffersthe ground-water system against acids generated dur-ing both aerobic and anaerobic biodegradation.
In general, areas contaminated by fuel hydrocarbonsexhibit a total alkalinity that is higher than that seen inbackground areas. This is expected because the micro-bially mediated reactions causing biodegradation of fuelhydrocarbons cause an increase in the total alkalinity inthe system. Changes in alkalinity are most pronouncedduring aerobic respiration, denitrification, iron reduction,and sulfate reduction, and are less pronounced duringmethanogenesis (40). In addition, Willey et al. (41) showthat short-chain aliphatic acid ions produced duringbiodegradation of fuel hydrocarbons can contribute toalkalinity in ground water.
The oxidation-reduction potential of ground water is ameasure of electron activity and an indicator of therelative tendency of a solution to accept or transfer
electrons. Redox reactions in ground water containingorganic compounds (natural or anthropogenic) are usuallybiologically mediated; therefore, the oxidation-reductionpotential of a ground-water system depends on andinfluences rates of biodegradation. Knowledge of theoxidation-reduction potential of ground water also isimportant because some biological processes operateonly within a prescribed range of redox conditions. Theoxidation-reduction potential of ground water generallyranges from -400 to 800 millivolts (mV). Figure 4 showsthe typical redox conditions for ground water when dif-ferent electron acceptors are used.
Oxidation-reduction potential can be used to providereal-time data on the location of the contaminant plume,especially in areas undergoing anaerobic biodegrada-tion. Mapping the oxidation-reduction potential of theground water while in the field helps the field scientist todetermine the approximate location of the contaminantplume. To perform this task, it is important to have atleast one redox measurement (preferably more) from awell located upgradient from the plume. Oxidation-re-duction potential measurements should be taken duringwell purging and immediately before and after sample
Figure 4. Redox potentials for various electron acceptors.
55
acquisition using a direct-reading meter. Because mostwell purging techniques can allow aeration of collectedground-water samples (which can affect oxidation-reductionpotential measurements), it is important to minimizepotential aeration.
Dissolved hydrogen concentrations can be used to de-termine the dominant terminal electron-accepting proc-ess in an aquifer. Because of the difficulty in obtaininghydrogen analyses commercially, this parameter shouldbe considered optional at this time. Table 4 presents therange of hydrogen concentrations for a given terminalelectron-accepting process. Much research has beendone on the topic of using hydrogen measurements todelineate terminal electron-accepting processes (42-44). Because the efficiency of reductive dechlorinationdiffers for methanogenic, sulfate-reducing, iron(III)-re-ducing, or denitrifying conditions, it is helpful to havehydrogen concentrations to help delineate redox condi-tions when evaluating the potential for natural attenu-ation of chlorinated ethenes in ground-water systems.Collection and analysis of ground-water samples for
dissolved hydrogen content is not yet commonplace orstandardized, however, and requires a relatively expen-sive field laboratory setup.
Because the pH, temperature, and conductivity of aground-water sample can change significantly shortlyfollowing sample acquisition, these parameters must bemeasured in the field in unfiltered, unpreserved, “fresh”water collected by the same technique as the samplestaken for DO and redox analyses. The measurementsshould be made in a clean glass container separate fromthose intended for laboratory analysis, and the meas-ured values should be recorded in the ground-watersampling record.
The pH of ground water has an effect on the presenceand activity of microbial populations in the ground water.This is especially true for methanogens. Microbes capa-ble of degrading chlorinated aliphatic hydrocarbons andpetroleum hydrocarbon compounds generally prefer pHvalues varying from 6 to 8 standard units. Ground-watertemperature directly affects the solubility of oxygen andother geochemical species. The solubility of DO is tem-
perature dependent, being more soluble in cold waterthan in warm water. Ground-water temperature also affectsthe metabolic activity of bacteria. Rates of hydrocarbonbiodegradation roughly double for every 10°C increasein temperature (“Q”10 rule) over the temperature rangebetween 5°C and 25°C. Ground-water temperaturesless than about 5°C tend to inhibit biodegradation, andslow rates of biodegradation are generally observed insuch waters.
Conductivity is a measure of the ability of a solution toconduct electricity. The conductivity of ground water isdirectly related to the concentration of ions in solution;conductivity increases as ion concentration increases.Conductivity measurements are used to ensure thatground water samples collected at a site are repre-sentative of the water in the saturated zone containingthe dissolved contamination. If the conductivities ofsamples taken from different sampling points are radi-cally different, the waters may be from different hydro-geologic zones.
Elemental chlorine is the most abundant of the halo-gens. Although chlorine can occur in oxidation statesranging from Cl- to Cl+7, the chloride form (Cl-) is the onlyform of major significance in natural waters (45). Chlo-ride forms ion pairs or complex ions with some of thecations present in natural waters, but these complexesare not strong enough to be of significance in the chem-istry of fresh water (45). The chemical behavior of chlo-ride is neutral. Chloride ions generally do not enter intooxidation-reduction reactions, form no important solutecomplexes with other ions unless the chloride concen-tration is extremely high, do not form salts of low solu-bility, are not significantly adsorbed on mineral surfaces,and play few vital biochemical roles (45). Thus, physicalprocesses control the migration of chloride ions in thesubsurface.
Kaufman and Orlob (46) conducted tracer experimentsin ground water and found that chloride moved throughmost of the soils tested more conservatively (i.e., withless retardation and loss) than any of the other tracerstested. During biodegradation of chlorinated hydrocar-bons dissolved in ground water, chloride is released intothe ground water. This results in chloride concentrationsin the ground water of the contaminant plume that areelevated relative to background concentrations. Be-cause of the neutral chemical behavior of chloride, it canbe used as a conservative tracer to estimate biodegra-dation rates using methods similar to those discussedby Wiedemeier et al. (36).
Field Measurement of Aquifer HydraulicParameters
The properties of an aquifer that have the greatest im-pact on contaminant fate and transport include hydraulicconductivity, hydraulic gradient, porosity, and dispersiv-
Table 4. Range of Hydrogen Concentrations for a GivenTerminal Electron-Accepting Process
TerminalElectron-Accepting Process
Hydrogen Concentration(nanomoles per liter)
Denitrification < 0.1
Iron(III) reduction 0.2 to 0.8
Sulfate reduction 1 to 4
Methanogenesis > 5
56

ity. Estimating hydraulic conductivity and gradient in thefield is fairly straightforward, but obtaining field-scaleinformation on porosity and dispersivity can be difficult.Therefore, most investigators rely on field data for hy-draulic conductivity and hydraulic gradient and on litera-ture values for porosity and dispersivity for the types ofsediments present at the site. Methods for field meas-urement of aquifer hydraulic parameters are describedby Wiedemeier et al. (1, 37).
Microbiological Laboratory Data
Microcosm studies are used to show that the microor-ganisms necessary for biodegradation are present andto help quantify rates of biodegradation. If properly de-signed, implemented, and interpreted, microcosm stud-ies can provide very convincing documentation of theoccurrence of biodegradation. Such studies are the only“line of evidence” that allows an unequivocal mass bal-ance determination based on the biodegradation of en-vironmental contaminants. The results of a well-designedmicrocosm study will be easy for decision-makers withnontechnical backgrounds to interpret. Results of suchstudies are strongly influenced by the nature of thegeological material submitted for study, the physicalproperties of the microcosm, the sampling strategy, andthe duration of the study. Because microcosm studiesare time-consuming and expensive, they should be un-dertaken only at sites where there is considerable skep-ticism concerning the biodegradation of contaminants.
Biodegradation rate constants determined by micro-cosm studies often are much greater than ratesachieved in the field. Microcosms are most appropriateas indicators of the potential for natural bioremediationand to prove that losses are biological, but it may beinappropriate to use them to generate rate constants.The preferable method of contaminant biodegradationrate-constant determination is in situ field measurement.The collection of material for the microcosm study, theprocedures used to set up and analyze the microcosm,and the interpretation of the results of the microcosmstudy are presented by Wiedemeier et al. (1).
Refine the Conceptual Model, CompletePremodeling Calculations, and DocumentIndicators of Natural Attenuation
Site investigation data should first be used to refine theconceptual model and quantify ground-water flow, sorp-tion, dilution, and biodegradation. The results of thesecalculations are used to scientifically document the occur-rence and rates of natural attenuation and to help simulatenatural attenuation over time. Because the burden ofproof is on the proponent, all available data must beintegrated in such a way that the evidence is sufficient tosupport the conclusion that natural attenuation is occurring.
Conceptual Model Refinement
Conceptual model refinement involves integrating newlygathered site characterization data to refine the prelimi-nary conceptual model that was developed based onpreviously existing site-specific data. During conceptualmodel refinement, all available site-specific data shouldbe integrated to develop an accurate three-dimensionalrepresentation of the hydrogeologic and contaminanttransport system. This conceptual model can then beused for contaminant fate-and-transport modeling. Con-ceptual model refinement consists of several steps, in-cluding preparation of geologic logs, hydrogeologicsections, potentiometric surface/water table maps, con-taminant contour (isopleth) maps, and electron acceptorand metabolic byproduct contour (isopleth) maps. Re-finement of the conceptual model is described byWiedemeier et al. (1).
Premodeling Calculations
Several calculations must be made prior to implementa-tion of the solute fate-and-transport model. These cal-culations include sorption and retardation calculations,NAPL/water-partitioning calculations, ground-water flowvelocity calculations, and biodegradation rate-constantcalculations. Each of these calculations is discussed inthe following sections. Most of the specifics of eachcalculation are presented in the fuel hydrocarbon naturalattenuation technical protocol by Wiedemeier et al. (1),and all will be presented in the protocol incorporatingchlorinated aliphatic hydrocarbon attenuation (37).
Biodegradation Rate Constant Calculations
Biodegradation rate constants are necessary to simu-late accurately the fate and transport of contaminantsdissolved in ground water. In many cases, biodegrada-tion of contaminants can be approximated using first-or-der kinetics. To calculate first-order biodegradation rateconstants, the apparent degradation rate must be nor-malized for the effects of dilution and volatilization. Twomethods for determining first-order rate constants aredescribed by Wiedemeier et al. (36). One method in-volves the use of a biologically recalcitrant compoundfound in the dissolved contaminant plume that can beused as a conservative tracer. The other method, pro-posed by Buscheck and Alcantar (47) involves interpre-tation of a steady-state contaminant plume and is basedon the one-dimensional steady-state analytical solutionto the advection-dispersion equation presented by Bear(48). The first-order biodegradation rate constants forchlorinated aliphatic hydrocarbons are also presented(J. Wilson et al., this volume).
57

Simulate Natural Attenuation Using SoluteFate-and-Transport Models
Simulating natural attenuation using a solute fate-and-transport model allows prediction of the migration andattenuation of the contaminant plume through time. Natu-ral attenuation modeling is a tool that allows site-specificdata to be used to predict the fate and transport ofsolutes under governing physical, chemical, and biologi-cal processes. Hence, the results of the modeling effortare not in themselves sufficient proof that natural attenu-ation is occurring at a given site. The results of themodeling effort are only as good as the original datainput into the model; therefore, an investment in thor-ough site characterization will improve the validity of themodeling results. In some cases, straightforward ana-lytical models of contaminant attenuation are adequateto simulate natural attenuation.
Several well-documented and widely accepted solutefate-and-transport models are available for simulatingthe fate-and-transport of contaminants under the influ-ence of advection, dispersion, sorption, and biodegra-dation. The use of solute fate-and-transport modeling inthe natural attenuation investigation is described byWiedemeier et al. (1).
Identify Potential Receptors, and Conduct anExposure-Pathway Analysis
After the rates of natural attenuation have been docu-mented and predictions of the future extent and concen-trations of the contaminant plume have been madeusing the appropriate solute fate-and-transport model,the proponent of natural attenuation should combine allavailable data and information to negotiate for imple-mentation of this remedial option. Supporting the naturalattenuation option generally will involve performing areceptor exposure-pathway analysis. This analysis in-cludes identifying potential human and ecological recep-tors and points of exposure under current and futureland and ground-water use scenarios. The results ofsolute fate-and-transport modeling are central to theexposure pathways analysis. If conservative model in-put parameters are used, the solute fate-and-transportmodel should give conservative estimates of contami-nant plume migration. From this information, the poten-tial for impacts on human health and the environmentfrom contamination present at the site can be estimated.
Evaluate Supplemental Source RemovalOptions
Source removal or reduction may be necessary to re-duce plume expansion if the exposure-pathway analysissuggests that one or more exposure pathways may becompleted before natural attenuation can reduce chemi-cal concentrations below risk-based levels of concern.Further, some regulators may require source removal in
conjunction with natural attenuation. Several technolo-gies suitable for source reduction or removal are listedin Figure 1. Other technologies may also be used asdictated by site conditions and local regulatory require-ments. The authors’ experience indicates that sourceremoval can be very effective at limiting plume migrationand decreasing the remediation time frame, especiallyat sites where biodegradation is contributing to naturalattenuation of a dissolved contaminant plume. The im-pact of source removal can readily be evaluated bymodifying the contaminant source term if a solute fate-and-transport model has been prepared for a site; thiswill allow for a reevaluation of the exposure-pathwayanalysis.
Prepare a Long-Term Monitoring Plan
Ground-water flow rates at many Air Force sites studiedto date are such that many years will be required beforecontaminated ground water could potentially reach Baseproperty boundaries. Thus, there frequently is time andspace for natural attenuation alone to reduce contami-nant concentrations in ground water to acceptable lev-els. Experience at 40 Air Force sites contaminated withfuel hydrocarbons using the protocol presented byWiedemeier et al. (1) suggests that many fuel hydrocar-bon plumes are relatively stable or are moving veryslowly with respect to ground-water flow. This informa-tion is complemented by data collected by LawrenceLivermore National Laboratories in a study of over 1,100leaking underground fuel tank sites performed for theCalifornia State Water Resources Control Board (49).These examples demonstrate the efficacy of long-termmonitoring to track plume migration and to validate orrefine modeling results. There is not a large enoughdatabase available at this time to assess the stability ofchlorinated solvent plumes, but in the authors’ experi-ence chlorinated solvent plumes are likely to migratefurther downgradient than fuel hydrocarbon plumes be-fore reaching steady-state equilibrium or before receding.
The long-term monitoring plan consists of locatingground-water monitoring wells and developing aground-water sampling and analysis strategy. This planis used to monitor plume migration over time and toverify that natural attenuation is occurring at rates suffi-cient to protect potential downgradient receptors. Thelong-term monitoring plan should be developed basedon site characterization data, the results of solute fate-and-transport modeling, and the results of the exposure-pathway analysis.
The long-term monitoring plan includes two types ofmonitoring wells: long-term monitoring wells are in-tended to determine whether the behavior of the plumeis changing; point-of-compliance wells are intended todetect movements of the plume outside the negotiatedperimeter of containment, and to trigger an action to
58
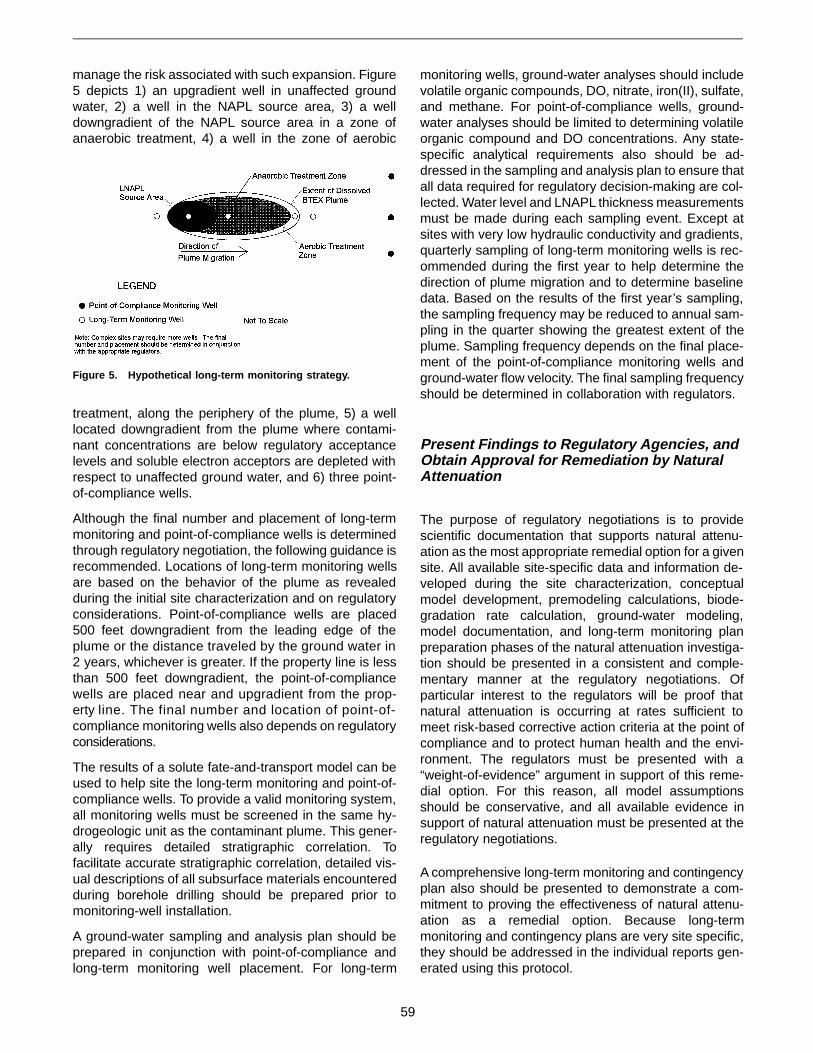
manage the risk associated with such expansion. Figure5 depicts 1) an upgradient well in unaffected groundwater, 2) a well in the NAPL source area, 3) a welldowngradient of the NAPL source area in a zone ofanaerobic treatment, 4) a well in the zone of aerobic
treatment, along the periphery of the plume, 5) a welllocated downgradient from the plume where contami-nant concentrations are below regulatory acceptancelevels and soluble electron acceptors are depleted withrespect to unaffected ground water, and 6) three point-of-compliance wells.
Although the final number and placement of long-termmonitoring and point-of-compliance wells is determinedthrough regulatory negotiation, the following guidance isrecommended. Locations of long-term monitoring wellsare based on the behavior of the plume as revealedduring the initial site characterization and on regulatoryconsiderations. Point-of-compliance wells are placed500 feet downgradient from the leading edge of theplume or the distance traveled by the ground water in2 years, whichever is greater. If the property line is lessthan 500 feet downgradient, the point-of-compliancewells are placed near and upgradient from the prop-erty line. The final number and location of point-of-compliance monitoring wells also depends on regulatoryconsiderations.
The results of a solute fate-and-transport model can beused to help site the long-term monitoring and point-of-compliance wells. To provide a valid monitoring system,all monitoring wells must be screened in the same hy-drogeologic unit as the contaminant plume. This gener-ally requires detailed stratigraphic correlation. Tofacilitate accurate stratigraphic correlation, detailed vis-ual descriptions of all subsurface materials encounteredduring borehole drilling should be prepared prior tomonitoring-well installation.
A ground-water sampling and analysis plan should beprepared in conjunction with point-of-compliance andlong-term monitoring well placement. For long-term
monitoring wells, ground-water analyses should includevolatile organic compounds, DO, nitrate, iron(II), sulfate,and methane. For point-of-compliance wells, ground-water analyses should be limited to determining volatileorganic compound and DO concentrations. Any state-specific analytical requirements also should be ad-dressed in the sampling and analysis plan to ensure thatall data required for regulatory decision-making are col-lected. Water level and LNAPL thickness measurementsmust be made during each sampling event. Except atsites with very low hydraulic conductivity and gradients,quarterly sampling of long-term monitoring wells is rec-ommended during the first year to help determine thedirection of plume migration and to determine baselinedata. Based on the results of the first year’s sampling,the sampling frequency may be reduced to annual sam-pling in the quarter showing the greatest extent of theplume. Sampling frequency depends on the final place-ment of the point-of-compliance monitoring wells andground-water flow velocity. The final sampling frequencyshould be determined in collaboration with regulators.
Present Findings to Regulatory Agencies, andObtain Approval for Remediation by NaturalAttenuation
The purpose of regulatory negotiations is to providescientific documentation that supports natural attenu-ation as the most appropriate remedial option for a givensite. All available site-specific data and information de-veloped during the site characterization, conceptualmodel development, premodeling calculations, biode-gradation rate calculation, ground-water modeling,model documentation, and long-term monitoring planpreparation phases of the natural attenuation investiga-tion should be presented in a consistent and comple-mentary manner at the regulatory negotiations. Ofparticular interest to the regulators will be proof thatnatural attenuation is occurring at rates sufficient tomeet risk-based corrective action criteria at the point ofcompliance and to protect human health and the envi-ronment. The regulators must be presented with a“weight-of-evidence” argument in support of this reme-dial option. For this reason, all model assumptionsshould be conservative, and all available evidence insupport of natural attenuation must be presented at theregulatory negotiations.
A comprehensive long-term monitoring and contingencyplan also should be presented to demonstrate a com-mitment to proving the effectiveness of natural attenu-ation as a remedial option. Because long-termmonitoring and contingency plans are very site specific,they should be addressed in the individual reports gen-erated using this protocol.
Figure 5. Hypothetical long-term monitoring strategy.
59

References
1. Wiedemeier, T.H., J.T. Wilson, D.H. Kampbell, R.N. Miller, andJ.E. Hansen. 1995. Technical protocol for implementing intrinsicremediation with long-term monitoring for natural attenuation offuel contamination dissolved in groundwater. San Antonio, TX:U.S. Air Force Center for Environmental Excellence.
2. National Research Council. 1993. In-situ bioremediation: Whendoes it work? Washington, DC: National Academy Press.
3. Bouwer, E.J., B.E. Rittman, and P.L. McCarty. 1981. Anaerobicdegradation of halogenated 1- and 2-carbon organic compounds.Environ. Sci. Technol. 15 (5):596-599.
4. Wilson, J.T., and B.H. Wilson. 1985. Biotransformation of trichlo-roethylene in soil. Appl. Environ. Microbiol. 49(1):242-243.
5. Miller, R.E., and F.P. Guengerich. 1982. Oxidation of trichlo-roethylene by liver microsomal cytochrome P-450: Evidence forchlorine migration in a transition state not involving trichlo-roethylene oxide. Biochemistry 21:1090-1097.
6. Nelson, M.J.K., S.O. Montgomery, E.J. O’Neille, and P.H.Pritchard. 1986. Aerobic metabolism of trichloroethylene by abacterial isolate. Appl. Environ. Microbiol. 52 (2):949-954.
7. Bouwer, E.J., and J.P. Wright. 1988. Transformations of tracehalogenated aliphatics in anoxic biofilm columns. J. Contam. Hy-drol. 2:155-169.
8. Lee, M.D. 1988. Biorestoration of aquifers contaminated withorganic compounds. CRC Crit. Rev. Environ. Control 18:29-89.
9. Little, C.D., A.V. Palumbo, S.E. Herbes, M.E. Lidstrom, R.L. Tyn-dall, and P.J. Gilmer. 1988. Trichloroethylene biodegradation bya methane-oxidizing bacterium. Appl. Environ. Microbiol.54(4):951-956.
10. Mayer, K.P., D. Grbi-Gali, L. Semprini, and P.L. McCarty. 1988.Degradation of trichloroethylene by methanotrophic bacteria in alaboratory column of saturated aquifer material. Water Sci. Tech.20(11/12):175-178.
11. Arciero, D., T. Vannelli, M. Logan, and A.B. Hooper. 1989. Deg-radation of trichloroethylene by the ammonia-oxidizing bacteriumNitrosomonas europaea. Biochem. Biophys. Res. Commun.159:640-643.
12. Cline, P.V., and J.J. Delfino. 1989. Transformation kinetics of1,1,1-trichloroethane to the stable product 1,1-dichloroethene. In:Biohazards of drinking water treatment. Chelsea, MI: Lewis Pub-lishers.
13. Freedman, D.L., and J.M. Gossett. 1989. Biological reductivedechlorination of tetrachloethylene and trichloroethylene to ethyl-ene under methanogenic conditions. Appl. Environ. Microbiol.55:2144-2151.
14. Folsom, B.R., P.J. Chapman, and P.H. Pritchard. 1990. Phenoland trichloroethylene degradation by Pseudomonas cepacia G4:Kinetics and interactions between substrates. Appl. Environ. Mi-crobiol. 56(5):1279-1285.
15. Harker, A.R., and Y. Kim 1990. Trichloroethylene degradation bytwo independent aromatic-degrading pathways in Alcaligenes eu-trophus JMP134. Appl. Environ. Microbiol. 56(4):1179-1181.
16. Alvarez-Cohen, L.M., and P.L. McCarty. 1991. Effects of toxicity,aeration, and reductant supply on trichloroethylene transforma-tion by a mixed methanotrophic culture. Appl. Environ. Microbiol.57(1):228-235.
17. Alvarez-Cohen, L.M., and P.L. McCarty. 1991. Product toxicityand cometabolic competitive inhibition modeling of chloroformand trichloroethylene transformation by methanotrophic restingcells. Appl. Environ. Microbiol. 57(4):1031-1037.
18. DeStefano, T.D., J.M. Gossett, and S.H. Zinder. 1991. Reductivedehalogenation of high concentrations of tetrachloroethene toethene by an anaerobic enrichment culture in the absence ofmethanogenesis. Appl. Environ. Microbiol. 57(8):2287-2292.
19. Henry, S.M. 1991. Transformation of trichloroethylene bymethanotrophs from a groundwater aquifer. Ph.D. thesis. Stan-ford University, Palo Alto, CA.
20. McCarty, P.L., P.V. Roberts, M. Reinhard, and G. Hopkins. 1992.Movement and transformations of halogenated aliphatic com-pounds in natural systems. In: Schnoor, J.L., ed. Fate of pesti-cides and chemicals in the environment. New York, NY: JohnWiley & Sons.
21. Hartmans, S., and J.A.M. de Bont 1992. Aerobic vinyl chloridemetabolism in Mycobacterium aurum Li. Appl. Environ. Microbiol.58(4):1220-1226.
22. McCarty, P.L., and L. Semprini. 1994. Ground-water treatment forchlorinated solvents, In: Norris, R.D., R.E. Hinchee, R. Brown,P.L. McCarty, L. Semprini, J.T. Wilson, D.H. Kampbell, M. Rein-hard, E.J. Bouwer, R.C. Borden, T.M. Vogel, J.M. Thomas, andC.H. Ward, eds. Handbook of bioremediation. Boca Raton, FL:Lewis Publishers.
23. Vogel, T.M. 1994. Natural bioremediation of chlorinated solvents.In: Norris, R.D., R.E. Hinchee, R. Brown, P.L. McCarty, L. Sem-prini, J.T. Wilson, D.H. Kampbell, M. Reinhard, E.J. Bouwer, R.C.Borden, T.M. Vogel, J.M. Thomas, and C.H. Ward, eds. Hand-book of bioremediation. Boca Raton, FL: Lewis Publishers.
24. Bouwer, E.J. 1994. Bioremediation of chlorinated solvents usingalternate electron acceptors. In: Norris, R.D., R.E. Hinchee, R.Brown, P.L. McCarty, L. Semprini, J.T. Wilson, D.H. Kampbell, M.Reinhard, E.J. Bouwer, R.C. Borden, T.M. Vogel, J.M. Thomas,and C.H. Ward, eds. Handbook of bioremediation. Boca Raton,FL: Lewis Publishers.
25. Vogel, T.M., and P.L. McCarty. 1985. Biotransformation oftetrachloroethylene to trichloroethylene, dichloroethylene, vinylchloride, and carbon dioxide under methanogenic conditions.Appl. Environ. Microbiol. 49(5):1080-1083.
26. Murray, W.D., and M. Richardson. 1993. Progress toward thebiological treatment of C1 and C2 halogenated hydrocarbons.Crit. Rev. Environ. Sci. Technol. 23(3):195-217.
27. Bradley, P.M., and F.H. Chapelle. 1996. Anaerobic mineralizationof vinyl chloride in Fe(III)-reducing aquifer sediments. Environ.Sci. Technol. 40:2084-2086.
28. Wiedemeier, T.H., L.A. Benson, J.T. Wilson, D.H. Kampbell, J.E.Hansen, and R. Miknis. 1996. Patterns of natural attenuation ofchlorinated aliphatic hydrocarbons at Plattsburgh Air Force Base,New York. Platform abstracts presented at the Conference onIntrinsic Remediation of Chlorinated Solvents, Salt Lake City, UT,April 2.
29. U.S. EPA. 1986. Test methods for evaluating solid waste, physicaland chemical methods, 3rd ed. SW-846. Washington, DC.
30. U.S. EPA. 1983. Methods for chemical analysis of water andwastes. EPA/16020-07-71. Cincinnati, OH.
31. Hach Co. 1990. Hach Company Catalog: Products for Analysis.Ames, IA.
32. American Public Health Association. 1992. Standard methods forthe examination of water and wastewater, 18th ed. Washington,DC.
33. AFCEE. 1993. Handbook to support the Installation RestorationProgram (IRP) remedial investigations and feasibility studies(RI/FS). U.S. Air Force Center for Environmental Excellence.September. Brooks Air Force Base, TX.
34. AFCEE. 1992. Environmental chemistry function Installation Res-toration Program analytical protocols. June.
60

35. Kampbell, D.H., J.T. Wilson, and S.A. Vandegrift. 1989. Dissolvedoxygen and methane in water by a GC headspace equilibriumtechnique. Int. J. Environ. Anal. Chem. 36:249-257.
36. Wiedemeier, T.H., M.A. Swanson, J.T. Wilson, D.H. Kampbell,R.N. Miller, and J.E. Hansen. 1996. Approximation of biodegra-dation rate constants for monoaromatic hydrocarbons (BTEX) ingroundwater. Ground Water Monitoring and Remediation. Inpress.
37. Wiedemeier, T.H., M.A. Swanson, D.E. Moutoux, J.T. Wilson,D.H. Kampbell, J.E. Hansen, P. Haas, and F.H. Chapelle. 1996.Technical protocol for natural attenuation of chlorinated solventsin groundwater. San Antonio, TX: U.S. Air Force Center for En-vironmental Excellence. In preparation.
38. Domenico, P.A. 1987. An analytical model for multidimensionaltransport of a decaying contaminant species. J. Hydrol. 91:49-58.
39. Domenico, P.A., and F.W. Schwartz. 1990. Physical and chemicalhydrogeology. New York, NY: John Wiley and Sons.
40. Morel, F.M.M., and J.G. Hering. 1993. Principles and applicationsof aquatic chemistry. New York, NY: John Wiley & Sons.
41. Willey, L.M., Y.K. Kharaka, T.S. Presser, J.B. Rapp, and I. Barnes.1975. Short chain aliphatic acid anions in oil field waters and theircontribution to the measured alkalinity. Geochim. Cosmochim.Acta 39:1707-1711.
42. Lovley, D.R., and S. Goodwin. 1988. Hydrogen concentrationsas an indicator of the predominant terminal electron-acceptingreaction in aquatic sediments. Geochim. Cosmochim. Acta52:2993-3003.
43. Lovley, D.R., F.H. Chapelle, and J.C. Woodward. 1994. Use ofdissolved H2 concentrations to determine distribution of micro-bially catalyzed redox reactions in anoxic groundwater. Environ.Sci. Technol. 28(7):1205-1210.
44. Chapelle, F.H., P.B. McMahon, N.M. Dubrovsky, R.F. Fujii, E.T.Oaksford, and D.A. Vroblesky. 1995. Deducing the distribution ofterminal electron-accepting processes in hydrologically diversegroundwater systems. Water Resour. Res. 31:359-371.
45. Hem, J.D. 1985. Study and interpretation of the chemical char-acteristics of natural water. U.S. Geological Survey Water SupplyPaper 2254.
46. Kaufman, W.J., and G.T. Orlob. 1956. Measuring ground watermovement with radioactive and chemical tracers. Am. WaterWorks Assn. J. 48:559-572.
47. Buscheck, T.E., and C.M. Alcantar. 1995. Regression techniquesand analytical solutions to demonstrate intrinsic bioremediation.In: Proceedings of the 1995 Battelle International Conference onIn-Situ and On Site Bioreclamation. April.
48. Bear, J. 1979. Hydraulics of groundwater. New York, NY:McGraw-Hill.
49. Rice, D.W., R.D. Grose, J.C. Michaelsen, B.P. Dooher, D.H. Mac-Queen, S.J. Cullen, W.E. Kastenberg, L.G. Everett, and M.A.Marino. 1995. California leaking underground fuel tank (LUFT)historical case analyses. California State Water Resources Con-trol Board.
61

The BIOSCREEN Computer Tool
Charles J. Newell and R. Kevin McLeodGroundwater Services, Inc., Houston, Texas
James R. GonzalesU.S. Air Force Center for Environmental Excellence, Brooks Air Force Base, Texas
Introduction
BIOSCREEN is an easy-to-use screening tool for simu-lating the natural attenuation of dissolved hydrocarbonsat petroleum fuel release sites. The software, pro-grammed in the Microsoft Excel spreadsheet environ-ment and based on the Domenico analytical solutetransport model (1), has the ability to simulate advection,dispersion, adsorption, and aerobic decay, as well asanaerobic reactions that have been shown to be thedominant biodegradation processes at many petroleumrelease sites. BIOSCREEN includes three differentmodel types: solute transport without decay, solutetransport with biodegradation modeled as a first-orderdecay process (simple, lumped-parameter approach),and solute transport with biodegradation modeled as an“instantaneous” biodegradation reaction (the approachused by BIOPLUME models) (2).
Intended Uses for BIOSCREEN
BIOSCREEN attempts to answer two fundamentalquestions regarding intrinsic remediation (3):
• How far will the plume extend if no engineered controlor source zone reduction is implemented?
BIOSCREEN uses an analytical solute transport modelwith two options for simulating in situ biodegradation:first order decay and instantaneous reaction. Themodel predicts the maximum extent of plumemigration, which may then be compared with thedistance to potential points of exposure (e.g., drinkingwater wells, ground-water discharge areas, orproperty boundaries).
• How long will the plume persist until natural attenu-ation processes cause it to dissipate?
BIOSCREEN uses a simple mass balance approach,based on the mass of dissolvable hydrocarbons in the
source zone and the rate of hydrocarbons leaving thesource zone, to estimate the source zone concentrationversus time. Because an exponential decay in sourcezone concentration is assumed, the predicted plumelifetimes can be large, usually ranging from 5 to 500years. Note that this is an unverified relationship (thereare little data showing source concentrations versuslong periods), and the results should be consideredorder-of-magnitude estimates of the time to dissipatethe plume.
BIOSCREEN is intended to be used in two ways:
• As a screening model to determine whether intrinsicremediation is feasible at a given site. In this case,BIOSCREEN is used early in the remediation processand before site characterization activities are com-pleted. Some data, such as electron acceptor concen-trations, may not be available, so typical values areused. The BIOSCREEN results are used to determinewhether an intrinsic remediation field program shouldbe implemented to quantify the natural attenuation oc-curring at a site. In addition, BIOSCREEN is an excel-lent communication and teaching tool that can be usedto present information in a graphical manner and helpexplain the concepts behind natural attenuation.
• As the primary intrinsic remediation ground-watermodel at smaller sites. The U.S. Air Force IntrinsicRemediation Protocol describes how intrinsic reme-diation models may be used to help verify that naturalattenuation is occurring and to help predict how farplumes might extend under an intrinsic remediationscenario. At large, high-effort sites, such as Super-fund and Resource Conservation and Recovery Actsites, a more sophisticated intrinsic remediationmodel is probably more appropriate. At smaller,lower-effort sites, such as service stations, BIOSCREEN
62

may be sufficient to complete the intrinsic remedia-tion study.
BIOSCREEN Input and Output
To run BIOSCREEN, the user enters site data in thefollowing categories: hydrogeologic, dispersion, adsorp-tion, biodegradation, general information, source char-acteristics, and observed data. For several parameters(e.g., seepage velocity), the user can either enter thevalue directly or use supporting data (hydraulic conduc-tivity, hydraulic gradient, and effective porosity) to calcu-late the value. Figure 1 shows the actual input screen.BIOSCREEN output includes plume centerline graphs,three-dimensional color plots of plume concentrations,and mass balance data showing the contaminant massremoval by each electron acceptor (instantaneous reac-tion option). Figures 2 and 3 show the two outputscreens. The input and output screens have on-line helpbuilt into the software. A detailed user’s manual is alsoavailable (4).
BIOCHLOR: A BIOSCREEN forChlorinated Solvents
While BIOSCREEN was originally designed to simu-late intrinsic remediation at petroleum release sites,the system can be modified to simulate intrinsic reme-diation of chlorinated hydrocarbons. Current plans call
for converting the BIOSCREEN model to BIOCHLOR.Key changes are:
• Biodegradation using first-order decay only: Micro-bial constraints on kinetics are much more importantfor chlorinated solvents than for petroleum com-pounds. Therefore, the first-order decay approachwill be emphasized in both the BIOCHLOR softwareand manual. A detailed survey of solute decay dataand source decay data from existing sites and theliterature will be provided.
• More detailed information on source terms: Chlorin-ated solvents are associated with the presence offree-phase and residual dense nonaqueous phaseliquids (DNAPLs) rather than residual lightnonaqueous phase liquids (LNAPLs) such as gaso-line and JP-4. The source terms will be discussed inmore detail to ensure that model input data and pre-liminary calculations are representative of DNAPLsites.
• Evaluation of biodegradation products: The genera-tion of products of chlorinated solvent biodegradationwill be discussed. Simple analytical tools may bedeveloped and incorporated into BIOCHLOR.
BIOSCREEN is available by contacting EPA’s Center forSubsurface Modeling Support (CSMoS), NRMRL/SPRD,P.O. Box 1198, Ada, OK 74821-1198, telephone 405-436-8594, fax 405-436-8718, bulletin board 405-436-8506
Figure 1. BIOSCREEN input screen.
63

Figure 2. BIOSCREEN centerline output screen.
Figure 3. BIOSCREEN concentration array output screen.
64

(14,400 baud, 8 bits, 1 stopbit available, no parity), andInternet http://www.epa.gov/ada/kerrlab.html. Electronicmanuals will be available in .pdf format; the AdobeAcrobat Reader is necessary to read and print .pdf files.)
References1. Domenico, P.A. 1987. An analytical model for multidimensional
transport of a decaying contaminant species. J. Hydro. 91:49-58.
2. Rifai, H.S., P.B. Bedient, R.C. Borden, and J.F. Haasbeek. 1987.BIOPLUME II—computer model of two-dimensional transport un-der the influence of oxygen limited biodegradation in ground water.User’s manual, Ver. 1.0. Rice University, Houston, TX.
3. Newell, C.J., J.W. Winters, H.S. Rifai, R.N. Miller, J. Gonzales, andT.H. Wiedemeier. 1995. Modeling intrinsic remediation with multi-ple electron acceptors: Results from seven sites. In: Proceedingsof the Petroleum Hydrocarbons and Organic Chemicals in GroundWater Conference, Houston, TX, November. National GroundWater Association. pp. 33-48.
4. Newell, C.J., R.K. McLeod, and J.R. Gonzales. 1996.BIOSCREEN Natural Attenuation Decision Support System, Ver-sion 1.3, U.S. Air Force Center for Environmental Excellence,Brooks AFB, San Antonio, TX.
65
Case Study: Naval Air Station Cecil Field, Florida
Francis H. Chapelle and Paul M. BradleyU.S. Geological Survey, Columbia, South Carolina
Redox processes at a fire-training area at Naval AirStation Cecil Field in Florida are segregated into distinctand clearly definable zones. Near the source of contami-nation, methanogenesis predominates. As ground waterflows downgradient, distinct sulfate-reducing, iron(III)-re-ducing, and oxygen-reducing zones are encountered. Thisnaturally occurring sequence favors the reductive dehalo-genation of chlorinated ethenes near the contamination
source, followed by oxidative degradation of vinyl chlorideto carbon dioxide and chloride downgradient of thesource. This sequence of redox processes has created anatural bioreactor that effectively treats contaminatedground water without human intervention. These resultsshow that mapping the zonation of redox processes atindividual sites is an important step in evaluating the po-tential for natural attenuation of chlorinated ethenes.
66

Case Study of Natural Attenuation of Trichloroethene at St. Joseph, Michigan
James W. Weaver, John T. Wilson, and Donald H. KampbellU.S. Environmental Protection Agency,
National Risk Management Research Laboratory, Ada, Oklahoma
Introduction
Trichloroethene (TCE) was found in ground water at theSt. Joseph, Michigan, Superfund site in 1982. The site,located 4 miles south of St. Joseph and 0.5 mile east ofLake Michigan, has been used for auto parts manufac-turing since 1942. The aquifer is primarily composed ofmedium, fine, and very fine glacial sands. The base ofthe aquifer is defined by a clay layer that lies between21 and 29 meters below the ground surface, with eleva-tion of the clay layer increasing toward Lake Michigan.Investigation at the site included an exhaustive study of41 possible contaminant sources but did not definitivelyidentify the source.
The source was apparently situated over a ground-water divide, however, as the contamination was dividedinto eastern and western plumes. Both plumes werefound to contain TCE, cis- and trans-1,2-dichloroethene(cis-DCE and t-DCE), 1,1-dichloroethene (1,1-DCE),and vinyl chloride (VC). Initial investigation indicatedthat natural anaerobic degradation of the TCE was oc-curring in the western plume, because of the presenceof transformation products and significant levels ofethene and methane (1, 2).
This paper describes the investigation at the site andpresents the field evidence for natural attenuation ofTCE. Since degradation of TCE is known to occur an-aerobically under differing redox conditions and to pro-duce specific daughter products, the relationshipsbetween measured concentrations of chlorinatedethenes and various redox indicators are emphasized.
Sampling Strategy
Water samples were taken in October 1991 and March1992 from a 5-foot long slotted auger (3). Seventeenboreholes were completed near the source of the west-ern plume (1), which formed three transect crossing thecontaminant plume. Data from these first three transectwere analyzed by Semprini et al. (4).
In 1992, two additional transect (4 and 5 on Figure 1)consisting of nine additional slotted auger boringswere completed. These two transect were chosen tosample the plume in the vicinity of Lake Michigan. Ineach boring, water samples were taken in 5-foot inter-vals from the water table to the base of the aquifer.Onsite gas chromatography was used to determinethe width of the plume and the point of highestconcentration in each transect. The onsite gas chro-matography ensured that the entire width of the con-taminant plume was captured within each transect. InAugust 1994, data were collected from a transectlocated about 100 meters offshore that was roughlyparallel to the shore line and contained four borings.Water samples were taken with a barge-mounted geo-probe (3). Data from the lake transect showed thelocation of the plume by the observed reduction indissolved oxygen concentrations and the measuredredox potentials.
Results
Figures 2 through 5 show the data from all the boreholesseparated by transect, which in effect also separatesthem by sample date. By compositing the data set,sitewide trends can be seen. These figures are supple-mented by Figures 6 through 9, which show contaminantdistribution with depth in single boreholes from repre-sentative locations. Significant methane concentrationsoccurred where dissolved oxygen concentrations werelow (Figure 2). Variation in concentration occurring on ascale smaller than the length of the auger is not accu-rately represented, as waters of differing chemistry maymix upon sampling. This may explain why a few datapoints simultaneously have high methane and high oxy-gen concentrations. Most importantly, the figure indi-cates that a large number of sample locations at the sitehad the necessary strong reducing conditions for reduc-tive dechlorination to occur.
67
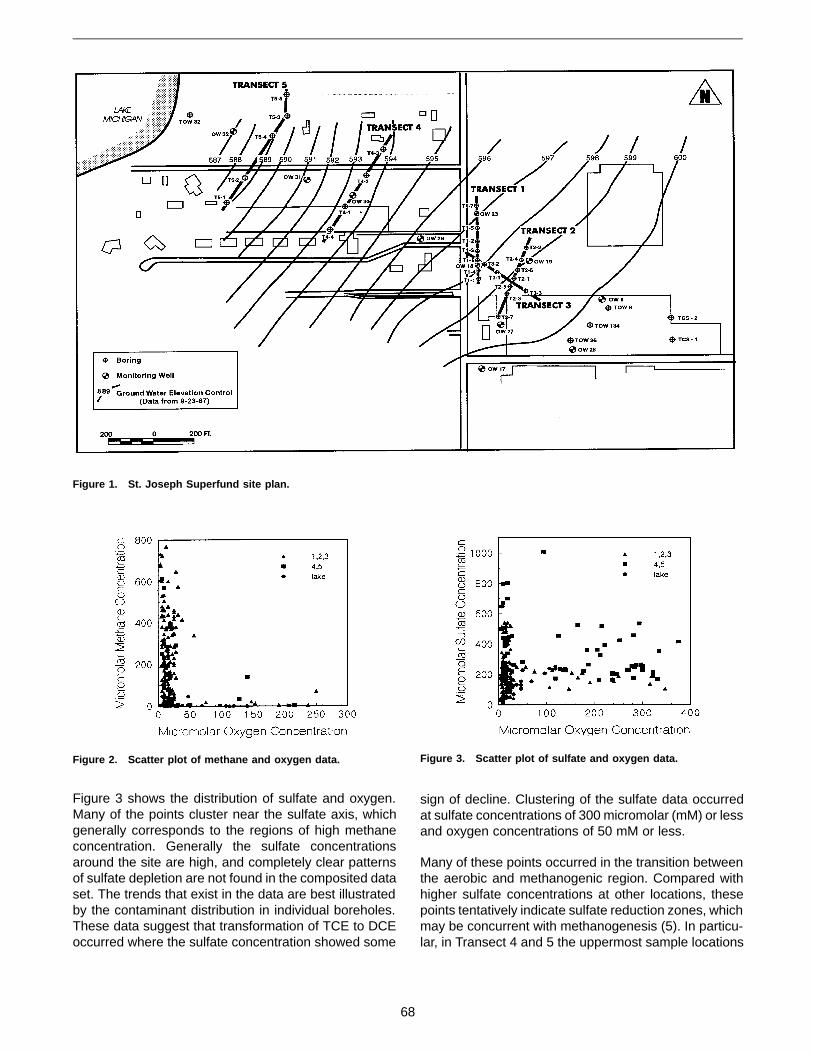
Figure 3 shows the distribution of sulfate and oxygen.Many of the points cluster near the sulfate axis, whichgenerally corresponds to the regions of high methaneconcentration. Generally the sulfate concentrationsaround the site are high, and completely clear patternsof sulfate depletion are not found in the composited dataset. The trends that exist in the data are best illustratedby the contaminant distribution in individual boreholes.These data suggest that transformation of TCE to DCEoccurred where the sulfate concentration showed some
sign of decline. Clustering of the sulfate data occurredat sulfate concentrations of 300 micromolar (mM) or lessand oxygen concentrations of 50 mM or less.
Many of these points occurred in the transition betweenthe aerobic and methanogenic region. Compared withhigher sulfate concentrations at other locations, thesepoints tentatively indicate sulfate reduction zones, whichmay be concurrent with methanogenesis (5). In particu-lar, in Transect 4 and 5 the uppermost sample locations
Figure 1. St. Joseph Superfund site plan.
Figure 2. Scatter plot of methane and oxygen data. Figure 3. Scatter plot of sulfate and oxygen data.
68

were devoid of contaminants and were oxygenated.Sulfate concentrations in the range of 300 to 500 µM atthese points indicate background sulfate levels.
The entire chlorinated ethene (TCE, DCEs, and VC) andethene data set is plotted in Figures 4 and 5 as achlorine number, NCl, that is defined by
NCl = ΣΣ wi Ci
ΣΣ Ci
where wi is the number of chlorine atoms in molecule iand Ci is the molar concentration of each ethene spe-cies. The chlorine number composites the ethene con-centrations and scales them from 0 to 3. At 0 nochlorinated species are present, and at 3 all of theethene is in the form of TCE. Generally, the integerchlorine numbers (0, 1, 2, 3) are obtained with non-0concentration only of the ethene with that number ofchlorine atoms. There are fortuitous combinations, how-ever, of positive non-0 concentrations that give integerchloride numbers. None of these combinations occurredin the St. Joseph data set.
High chlorine numbers were associated with many ofthe high dissolved oxygen concentrations (Figure 4),
indicating that most of the chlorine was contained inTCE molecules at these sampling points. Some of thesehad chlorine numbers of 3, indicating that TCE was the onlyspecies present. The majority of locations with chlorinenumbers below 3 were anaerobic, which also corre-sponded to methanogenic locations. The latter condi-tion, in conjunction with the presence of the TCEdegradation products (indicated by the low chlorinenumbers), indicates degradation of the TCE. When thedata set is plotted against the methane concentration(Figure 5), the data appeared scattered over most of thegraph. Some of the lowest chloride numbers were asso-ciated with the high methane concentrations.
Generally, many of the downgradient locations (squareson Figures 4 and 5) showed chlorine numbers above 2and lower methane concentrations. These data suggestthat in the downgradient transect, TCE degraded to DCEunder other than methanogenic conditions.
Data from selected borings represent the general trendswith depth in each of the transect (Figures 6 and 7). InTransect 2, located near the presumed source of con-tamination, dissolved oxygen was depleted below the60-foot depth (Figure 6). Between 45 and 60 feet, the 45-and 55-foot depths showed significant dissolved oxygenas well as significant methane concentrations. Sulfateshowed a weak declining trend with depth to about 70
Figure 4. Composited chlorine number plotted against oxygenconcentration.
Figure 5. Composited chlorine number plotted against methaneconcentration.
Figure 6. Distribution of chloride, sulfate, dissolved oxygen,and methane with depth in Borehole T23. Figure 7. Distribution of ethenes with depth at Borehole T23.
69
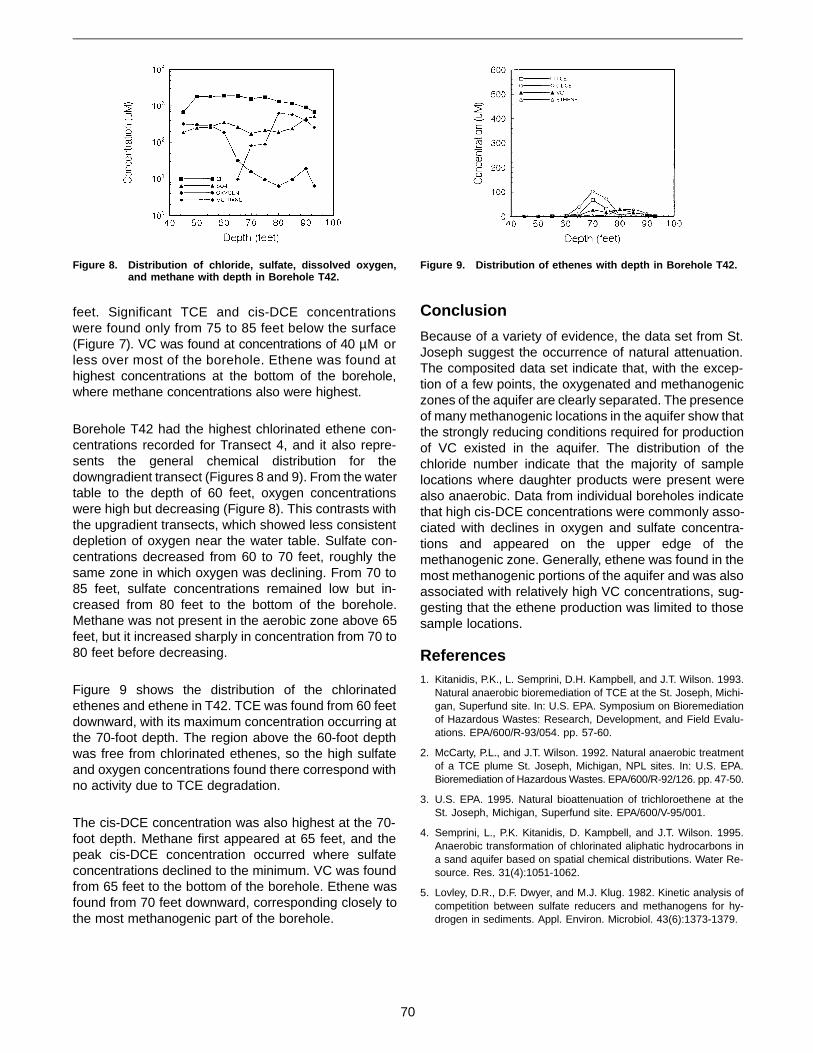
feet. Significant TCE and cis-DCE concentrationswere found only from 75 to 85 feet below the surface(Figure 7). VC was found at concentrations of 40 µM orless over most of the borehole. Ethene was found athighest concentrations at the bottom of the borehole,where methane concentrations also were highest.
Borehole T42 had the highest chlorinated ethene con-centrations recorded for Transect 4, and it also repre-sents the general chemical distribution for thedowngradient transect (Figures 8 and 9). From the watertable to the depth of 60 feet, oxygen concentrationswere high but decreasing (Figure 8). This contrasts withthe upgradient transects, which showed less consistentdepletion of oxygen near the water table. Sulfate con-centrations decreased from 60 to 70 feet, roughly thesame zone in which oxygen was declining. From 70 to85 feet, sulfate concentrations remained low but in-creased from 80 feet to the bottom of the borehole.Methane was not present in the aerobic zone above 65feet, but it increased sharply in concentration from 70 to80 feet before decreasing.
Figure 9 shows the distribution of the chlorinatedethenes and ethene in T42. TCE was found from 60 feetdownward, with its maximum concentration occurring atthe 70-foot depth. The region above the 60-foot depthwas free from chlorinated ethenes, so the high sulfateand oxygen concentrations found there correspond withno activity due to TCE degradation.
The cis-DCE concentration was also highest at the 70-foot depth. Methane first appeared at 65 feet, and thepeak cis-DCE concentration occurred where sulfateconcentrations declined to the minimum. VC was foundfrom 65 feet to the bottom of the borehole. Ethene wasfound from 70 feet downward, corresponding closely tothe most methanogenic part of the borehole.
Conclusion
Because of a variety of evidence, the data set from St.Joseph suggest the occurrence of natural attenuation.The composited data set indicate that, with the excep-tion of a few points, the oxygenated and methanogeniczones of the aquifer are clearly separated. The presenceof many methanogenic locations in the aquifer show thatthe strongly reducing conditions required for productionof VC existed in the aquifer. The distribution of thechloride number indicate that the majority of samplelocations where daughter products were present werealso anaerobic. Data from individual boreholes indicatethat high cis-DCE concentrations were commonly asso-ciated with declines in oxygen and sulfate concentra-tions and appeared on the upper edge of themethanogenic zone. Generally, ethene was found in themost methanogenic portions of the aquifer and was alsoassociated with relatively high VC concentrations, sug-gesting that the ethene production was limited to thosesample locations.
References1. Kitanidis, P.K., L. Semprini, D.H. Kampbell, and J.T. Wilson. 1993.
Natural anaerobic bioremediation of TCE at the St. Joseph, Michi-gan, Superfund site. In: U.S. EPA. Symposium on Bioremediationof Hazardous Wastes: Research, Development, and Field Evalu-ations. EPA/600/R-93/054. pp. 57-60.
2. McCarty, P.L., and J.T. Wilson. 1992. Natural anaerobic treatmentof a TCE plume St. Joseph, Michigan, NPL sites. In: U.S. EPA.Bioremediation of Hazardous Wastes. EPA/600/R-92/126. pp. 47-50.
3. U.S. EPA. 1995. Natural bioattenuation of trichloroethene at theSt. Joseph, Michigan, Superfund site. EPA/600/V-95/001.
4. Semprini, L., P.K. Kitanidis, D. Kampbell, and J.T. Wilson. 1995.Anaerobic transformation of chlorinated aliphatic hydrocarbons ina sand aquifer based on spatial chemical distributions. Water Re-source. Res. 31(4):1051-1062.
5. Lovley, D.R., D.F. Dwyer, and M.J. Klug. 1982. Kinetic analysis ofcompetition between sulfate reducers and methanogens for hy-drogen in sediments. Appl. Environ. Microbiol. 43(6):1373-1379.
Figure 8. Distribution of chloride, sulfate, dissolved oxygen,and methane with depth in Borehole T42.
Figure 9. Distribution of ethenes with depth in Borehole T42.
70
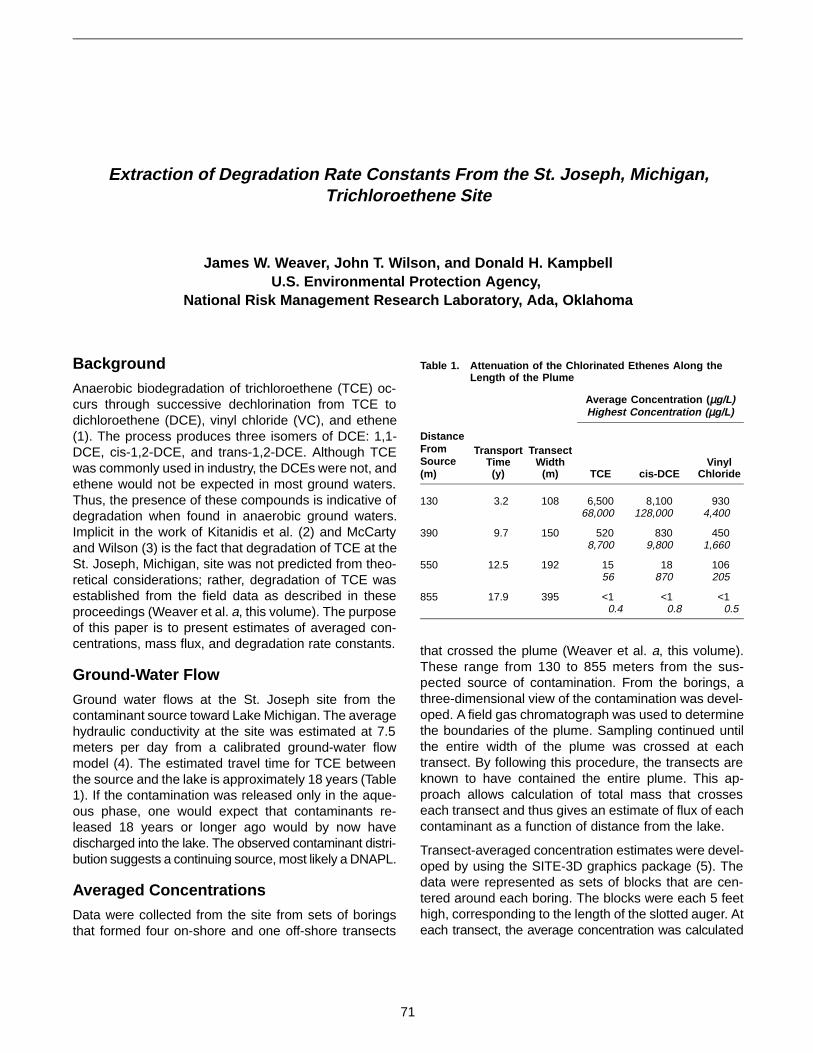
Extraction of Degradation Rate Constants From the St. Joseph, Michigan,Trichloroethene Site
James W. Weaver, John T. Wilson, and Donald H. KampbellU.S. Environmental Protection Agency,
National Risk Management Research Laboratory, Ada, Oklahoma
Background
Anaerobic biodegradation of trichloroethene (TCE) oc-curs through successive dechlorination from TCE todichloroethene (DCE), vinyl chloride (VC), and ethene(1). The process produces three isomers of DCE: 1,1-DCE, cis-1,2-DCE, and trans-1,2-DCE. Although TCEwas commonly used in industry, the DCEs were not, andethene would not be expected in most ground waters.Thus, the presence of these compounds is indicative ofdegradation when found in anaerobic ground waters.Implicit in the work of Kitanidis et al. (2) and McCartyand Wilson (3) is the fact that degradation of TCE at theSt. Joseph, Michigan, site was not predicted from theo-retical considerations; rather, degradation of TCE wasestablished from the field data as described in theseproceedings (Weaver et al. a, this volume). The purposeof this paper is to present estimates of averaged con-centrations, mass flux, and degradation rate constants.
Ground-Water Flow
Ground water flows at the St. Joseph site from thecontaminant source toward Lake Michigan. The averagehydraulic conductivity at the site was estimated at 7.5meters per day from a calibrated ground-water flowmodel (4). The estimated travel time for TCE betweenthe source and the lake is approximately 18 years (Table1). If the contamination was released only in the aque-ous phase, one would expect that contaminants re-leased 18 years or longer ago would by now havedischarged into the lake. The observed contaminant distri-bution suggests a continuing source, most likely a DNAPL.
Averaged Concentrations
Data were collected from the site from sets of boringsthat formed four on-shore and one off-shore transects
that crossed the plume (Weaver et al. a, this volume).These range from 130 to 855 meters from the sus-pected source of contamination. From the borings, athree-dimensional view of the contamination was devel-oped. A field gas chromatograph was used to determinethe boundaries of the plume. Sampling continued untilthe entire width of the plume was crossed at eachtransect. By following this procedure, the transects areknown to have contained the entire plume. This ap-proach allows calculation of total mass that crosseseach transect and thus gives an estimate of flux of eachcontaminant as a function of distance from the lake.
Transect-averaged concentration estimates were devel-oped by using the SITE-3D graphics package (5). Thedata were represented as sets of blocks that are cen-tered around each boring. The blocks were each 5 feethigh, corresponding to the length of the slotted auger. Ateach transect, the average concentration was calculated
Table 1. Attenuation of the Chlorinated Ethenes Along theLength of the Plume
Average Concentration ( µg/L)Highest Concentration ( µg/L)
DistanceFromSource(m)
TransportTime(y)
TransectWidth
(m) TCE cis-DCEVinyl
Chloride
130 3.2 108 6,50068,000
8,100128,000
9304,400
390 9.7 150 5208,700
8309,800
4501,660
550 12.5 192 15 56
18 870
106 205
855 17.9 395 <1 0.4
<1 0.8
<1 0.5
71
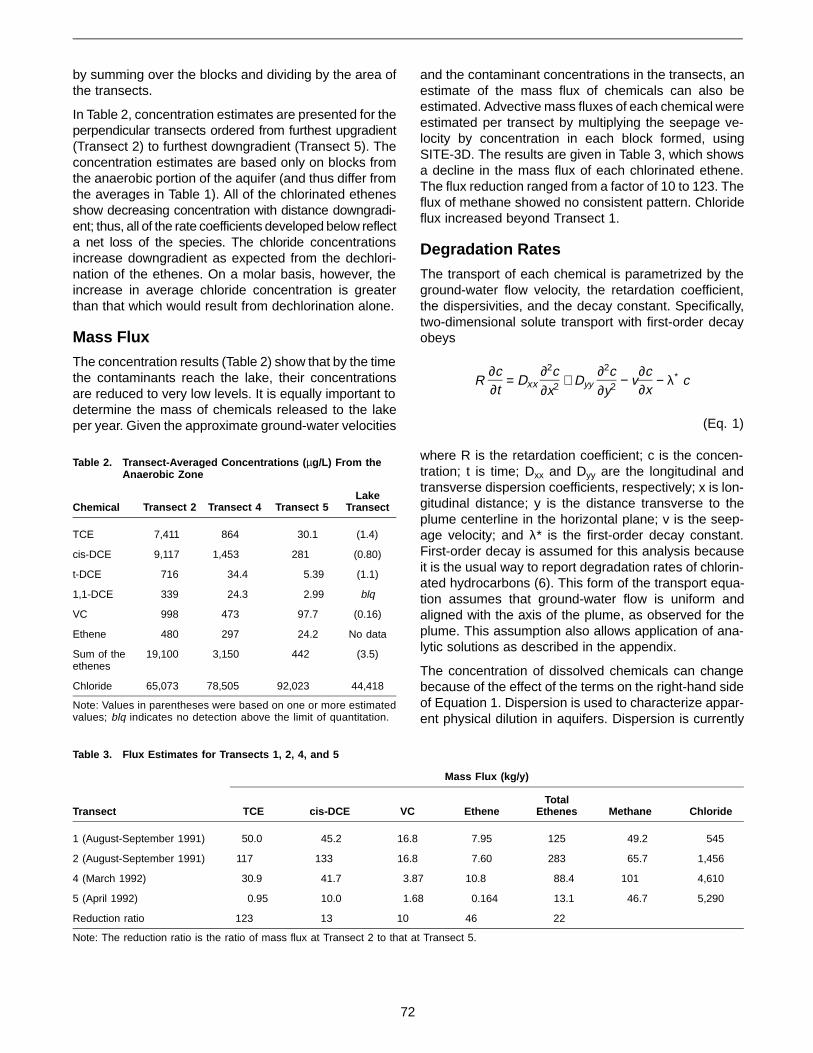
by summing over the blocks and dividing by the area ofthe transects.
In Table 2, concentration estimates are presented for theperpendicular transects ordered from furthest upgradient(Transect 2) to furthest downgradient (Transect 5). Theconcentration estimates are based only on blocks fromthe anaerobic portion of the aquifer (and thus differ fromthe averages in Table 1). All of the chlorinated ethenesshow decreasing concentration with distance downgradi-ent; thus, all of the rate coefficients developed below reflecta net loss of the species. The chloride concentrationsincrease downgradient as expected from the dechlori-nation of the ethenes. On a molar basis, however, theincrease in average chloride concentration is greaterthan that which would result from dechlorination alone.
Mass Flux
The concentration results (Table 2) show that by the timethe contaminants reach the lake, their concentrationsare reduced to very low levels. It is equally important todetermine the mass of chemicals released to the lakeper year. Given the approximate ground-water velocities
and the contaminant concentrations in the transects, anestimate of the mass flux of chemicals can also beestimated. Advective mass fluxes of each chemical wereestimated per transect by multiplying the seepage ve-locity by concentration in each block formed, usingSITE-3D. The results are given in Table 3, which showsa decline in the mass flux of each chlorinated ethene.The flux reduction ranged from a factor of 10 to 123. Theflux of methane showed no consistent pattern. Chlorideflux increased beyond Transect 1.
Degradation Rates
The transport of each chemical is parametrized by theground-water flow velocity, the retardation coefficient,the dispersivities, and the decay constant. Specifically,two-dimensional solute transport with first-order decayobeys
R ∂c∂t
= Dxx ∂2c∂x2 + Dyy
∂2c∂y2 − v
∂c∂x
− λ∗ c
(Eq. 1)
where R is the retardation coefficient; c is the concen-tration; t is time; Dxx and Dyy are the longitudinal andtransverse dispersion coefficients, respectively; x is lon-gitudinal distance; y is the distance transverse to theplume centerline in the horizontal plane; v is the seep-age velocity; and λ* is the first-order decay constant.First-order decay is assumed for this analysis becauseit is the usual way to report degradation rates of chlorin-ated hydrocarbons (6). This form of the transport equa-tion assumes that ground-water flow is uniform andaligned with the axis of the plume, as observed for theplume. This assumption also allows application of ana-lytic solutions as described in the appendix.
The concentration of dissolved chemicals can changebecause of the effect of the terms on the right-hand sideof Equation 1. Dispersion is used to characterize appar-ent physical dilution in aquifers. Dispersion is currently
Table 2. Transect-Averaged Concentrations ( µg/L) From theAnaerobic Zone
Chemical Transect 2 Transect 4 Transect 5Lake
Transect
TCE 7,411 864 30.1 (1.4)
cis-DCE 9,117 1,453 281 (0.80)
t-DCE 716 34.4 5.39 (1.1)
1,1-DCE 339 24.3 2.99 blq
VC 998 473 97.7 (0.16)
Ethene 480 297 24.2 No data
Sum of theethenes
19,100 3,150 442 (3.5)
Chloride 65,073 78,505 92,023 44,418
Note: Values in parentheses were based on one or more estimatedvalues; blq indicates no detection above the limit of quantitation.
Table 3. Flux Estimates for Transects 1, 2, 4, and 5
Mass Flux (kg/y)
Transect TCE cis-DCE VC EtheneTotal
Ethenes Methane Chloride
1 (August-September 1991) 50.0 45.2 16.8 7.95 125 49.2 545
2 (August-September 1991) 117 133 16.8 7.60 283 65.7 1,456
4 (March 1992) 30.9 41.7 3.87 10.8 88.4 101 4,610
5 (April 1992) 0.95 10.0 1.68 0.164 13.1 46.7 5,290
Reduction ratio 123 13 10 46 22
Note: The reduction ratio is the ratio of mass flux at Transect 2 to that at Transect 5.
72

understood to result primarily from ground-water flowthrough heterogeneous materials. In multidimensionalflow, advection can cause concentrations to decreasebecause of the divergence of flow lines. Advection doesnot directly change concentrations in one-dimensionalflow but influences the contribution of dispersion. Decaychanges concentration through removal of mass fromthe aquifer.
The significance of these observations is that whenpresented with a set of contaminant concentrations, thedistribution of contamination may depend on physio-chemical and biological processes. Observed concen-trations in themselves do not indicate the contribution ofeach process to the plume shape. Extraction of apparentrates from the field data needs to account for the multi-ple processes. In Table 4, estimated rate constants aregiven for St. Joseph. These constants were determinedfrom the solution of the transport equation presented inthe appendix. The solution included advection, retarda-tion, longitudinal and transverse dispersion, and first-order loss. Inclusion of transverse dispersion isimportant because this characterizes downgradientspreading of the plume. The observed widths of theplume at St. Joseph are given in Table 1 and were usedto estimate the transverse dispersivity according to theprocedure given in the appendix. The effect of trans-verse dispersivity on the estimated rate constants, how-ever, decreases as the plume widens and the centerlineconcentrations decrease. Longitudinal dispersivity hasbeen shown to have a minor impact on the estimatedrate constants at distances between transects on theorder of 100 meters (7).
The rates given in Table 5 are called net rates because,for the daughter products, the observed concentrationsare a result of production of the daughter from bothdecay of the parent and decay of the daughter itself. Thegross rate of decay of the daughter (Table 4) does notinclude its production and was determined by the proce-dure given in the appendix. The two rates are the same forTCE, since no production of TCE occurred. The grossrates are, as expected, higher than the net rates, be-cause production of a compound must be balanced byhigh gross rates to attain the observed net rate.
Conclusion
The western TCE plume at St. Joseph, Michigan,showed a decrease of maximum TCE concentration bya factor of 50,000 from the furthest upgradient transectto the lake transect. Concentrations of each contami-nant declined to values below the respective maximumcontaminant levels when sampled from the lake sedi-ments. Mass fluxes decrease by factors of 10 to 123from the source to the last on-shore transect (Transect5); thus, not only do the concentrations decline, butso does the loading in the ground water. The reductionin loading is attributed to degradation, because of thegeochemical evidence presented (Weaver et al. a, thisvolume).
Further, when site-specific estimates of the transportparameters are used in solutions of the transport equa-tions, the apparent reduction in concentration is onlyaccounted for by loss of mass. These apparent degra-dation rate constants were calculated from the St.Joseph data set through application of a two-dimen-sional analytical solution of the transport equation. Sincetransverse spreading of the plume reduces the contami-nant concentrations, the effect of transverse dispersivitywas included in the analysis.
Appendix
Extraction of Rate Constants viaTwo-Dimensional, Steady-State TransportAnalysis
The two-dimensional transport equation, subject to theboundary conditions
c (x,y,0) = 0
c (0,y,t) = co exp (−y2
2 σ2)
c (∞,y,t) = c (x,−∞,t) = c (x,∞,t) = 0
(Eq. 2)
Table 4. Apparent Degradation Rate Constants (One PerYear) From the Two-Dimensional Model (Equation 3)and the Gross Rate Correction Given by Equation 7
ChemicalTransect
2 to 4Transect
4 to 5Transect5 to Lake
TCE 0.30 1.7 1.7
cis-DCE 0.54 1.1 4.0
Vinyl chloride 2.6 3.1 20
Table 5. Net Apparent Degradation Rate Constants (One Per Year) From the Two-Dimensional Model (Equation 3)
ChemicalTransect
2 to 4Transect
4 to 5Transect5 to Lake
TCE 0.30 1.7 1.7
cis-DCE 0.26 0.58 3.3
Vinyl chloride 0.15 0.78 2.6
73

has the approximate steady state solution (9)
(Eq. 3)
Vertically averaged concentrations and the distancesbetween each borehole were used to develop theboundary condition (c(0,y,t) in Equation 2) for applicationof Equation 3. The unknown parameters are the up-gradient peak concentration, co, and the standard devia-tion, σ, of the distribution. Since the width of the plume,W, was established via the field sampling program, thestandard deviation of the distribution can be estimatedas W = 6σ. A mass balance can then be solved for thepeak concentration of the Gaussian distribution, co, from
∫ncdy = ∫ nco exp(−y2
2σ2) dy = nco σ √2π(Eq. 4)
where n is the porosity, c is the vertically averaged concen-tration, and the y coordinate runs parallel to the transect.
The transverse dispersivity can also be estimated from themeasured widths of the transects. The width of a contaminantdistribution is related to the transverse dispersivity through
Dyy = ayy v = 1 dσ2
2 dt(Eq. 5)
where ayy is the transverse dispersivity. By applying Equa-tion 5 in a discrete form and substituting ∆ t = ∆ xR/v, anexpression for ayy is obtained in terms of the seepagevelocity, retardation coefficient, distance between tran-sects (∆ x), and change in variance of the Gaussiandistributions for the transect concentrations (∆ σ2):
ayy = 1 ∆σ2
2R ∆x(Eq. 6)
The only remaining unknown in Equation 3 is the decayconstant λ*, which is determined through a bisectionsearch. Table 5 gives the rate constants from the two-dimensional model.
Net and Gross Decay Rates
The rate constants derived from the solution (Equation3 and Table 5) are net rates that include the productionand decay of a given daughter product. It is necessaryto separate production of the compound from its decayto estimate the gross apparent decay rates for cis-DCE,t-DCE, 1,1-DCE, and VC. Previous work (7) used areaction rate model that simultaneously solved ordinarydifferential equations for this purpose. Here, simplifiedexpressions for the rates were used to estimate theapparent decay rates:
λj(n) = fj λj+1(n) S + λj(g) (Eq. 7)
where λj(n) is the net decay rate determined by Equation3, fj is the fraction of an isomer (j) produced from thedegradation of the parent (j+1), λj+1(n) is the apparentdecay rate of the parent defined from Equation 3, S isthe ratio of molar concentration of parent j+1 to daughterj, and λj(g) is the gross apparent decay rate of daughterj. For the DCE isomers, fj is approximated by the aver-age ratio of an isomer j to the sum of the DCEs over thepairs of transects. For VC, fj is equal to 1.0. The grossapparent decay rates for cis-DCE, t-DCE, 1,1-DCE, andVC appear in Table 4. Although Equation 7 is concen-tration dependent because S was assumed to be theaverage of the up- and downgradient ratios, the resultspresented in Table 4 are essentially the same as deter-mined from the reaction rate model (8).
References
1. McCarty, P.L., and L. Semprini. 1994. Ground-water treatment forchlorinated solvents. In: Norris R.D., R.E. Hinchee, R. Brown, P.L.McCarty, L. Semprini, J.T. Wilson, D.H. Kampbell, M. Reinhard,E.J. Bouwer, R.C. Borden, T.M. Vogel, J.M. Thomas, and C.H.Ward, eds. Handbook of bioremediation. Chelsea, MI: Lewis Pub-lishers. pp. 87-116.
2. Kitanidis, P.K., L. Semprini, D.H. Kampbell, and J.T. Wilson. 1993.Natural anaerobic bioremediation of TCE at the St. Joseph, Michi-gan, Superfund site. In: U.S. EPA. Symposium on Bioremediationof Hazardous Wastes: Research, Development, and Field Evalu-ations. EPA/600/R-93/054. pp. 57-60.
3. McCarty, P.L., and J.T. Wilson. 1992. Natural anaerobic treatment ofa TCE plume at the St. Joseph, Michigan, NPL site. In: U.S. EPA.Bioremediation of hazardous wastes. EPA/600/R-92/126. pp. 47-50.
4. Tiedeman, C., and S. Gorelick. 1993. Analysis of uncertainty inoptimal groundwater contaminant capture design. Water Resour.Res. 29:2139-2153.
5. U.S. EPA. 1996. Animated three-dimensional display of field datawith SITE-3D: User’s guide for version 1.00. Technical report.EPA/600/R-96/004.
6. Rifai, H.S., R.C. Borden, J.T. Wilson, and C.H. Ward. 1995. Intrin-sic bioattenuation for subsurface restoration. In: Hinchee, R.E., J.T.Wilson, and D.C. Downey, eds. Intrinsic bioremedation, Vol. 3.Columbus, OH: Battelle Press. pp. 1-29.
74

7. Weaver, J.W., J.T. Wilson, D.H. Kampbell, and M.E. Randolph.1995. Field-derived transformation rates for modeling naturalbioattenuation of trichloroethene and its degradation products.Presented at the Next Generation of Computational Models Com-putational Methods, August 17-19, Bay City, MI. Society of Indus-trial and Applied Mathematics.
8. Smith, V.J., and R.J. Charbeneau. 1990. Probabilistic soil contami-nation exposure assessment procedures. J. Environ. Engineer.116(6):1143-1163.
75

Natural Attenuation of Chlorinated Aliphatic Hydrocarbons at Plattsburgh Air Force Base, New York
Todd H. WiedemeierParsons Engineering Science, Inc., Denver, Colorado
John T. Wilson and Donald H. KampbellU.S. Environmental Protection Agency, National Risk Management Research Laboratory,
Subsurface Protection and Remediation Division, Ada, Oklahoma
Introduction
Activities at a former fire training area (Site FT-002) atPlattsburgh Air Force Base (AFB) in New York resultedin contamination of shallow soils and ground water witha mixture of chlorinated solvents and fuel hydrocarbons.Ground water contaminants include trichloroethene(TCE), cis-1,2-dichloroethene (cis-1,2-DCE), vinyl chlo-ride, and benzene, toluene, ethylbenzene, and xylenes(BTEX). Table 1 contains contaminant data for selectedwells at the site.
Contaminant plumes formed by chlorinated aliphatic hy-drocarbons (CAHs) dissolved in ground water can ex-hibit three types of behavior based on the amount andtype of primary substrate present in the aquifer. Type 1behavior occurs where anthropogenic carbon such asBTEX or landfill leachate is being utilized as the primarysubstrate for microbial degradation. Such plumes typi-cally are anaerobic, and the reductive dechlorination ofhighly chlorinated CAHs introduced into such a systemcan be quite rapid. Type 2 behavior occurs in areas thatare characterized by high natural organic carbon con-centrations and anaerobic conditions. Under these con-ditions, microorganisms utilize the natural organic carbonas a primary substrate; if redox conditions are favorable,highly chlorinated CAHs introduced into this type ofsystem will be reductively dechlorinated. Type 3 behav-ior occurs in areas characterized by low natural organiccarbon concentrations, low anthropogenic carbon con-centrations, and aerobic or weakly reducing conditions.Biodegradation of CAHs via reductive dechlorination willnot occur under these conditions. Biodegradation of theless chlorinated compounds such as vinyl chloride, how-ever, can occur via oxidation.
Plattsburgh AFB is located in northeastern New YorkState, approximately 26 miles south of the Canadianborder and 167 miles north of Albany. Site FT-002 (Fig-ure 1) is located in the northwest corner of the base ona land surface that slopes gently eastward toward theconfluence of the Saranac and the Salmon Rivers, ap-proximately 2 miles east of the site. The site, which isapproximately 700 feet wide and 800 feet long, wasused to train base and municipal fire-fighting personnelfrom the mid-1950s until it was permanently closed tofire-training activities in May 1989.
Four distinct stratigraphic units underlie the site: sand,clay, till, and carbonate bedrock. Figure 2 shows threeof the four stratigraphic units at the site. The sand unitconsists of well-sorted, fine- to medium-grained sandwith a trace of silt, and generally extends from groundsurface to as much as 90 feet below ground surface(bgs) in the vicinity of the site. A 7-foot thick clay unit hasbeen identified on the eastern side of the site. Thethickness of the clay on the western side of the site hasnot been determined. A 30- to 40-foot thick clay till unitis also present from 80 to 105 feet bgs in the vicinity ofthe site. Bedrock is located approximately 105 feet bgs.
Ground-Water Hydraulics
The depth to ground water in the sand aquifer rangesfrom 45 feet bgs on the west side of the site to zero onthe east side of the runway, where ground water dis-charges to a swamp (Figure 2). Ground-water flow at thesite is to the southeast, with the average gradient ap-proximately 0.010 foot per foot (ft/ft). Hydraulic conduc-tivity of the upper sand aquifer was measured usingconstant drawdown tests and rising head tests. Hydrau-lic conductivity values for the unconfined sand aquifer
76
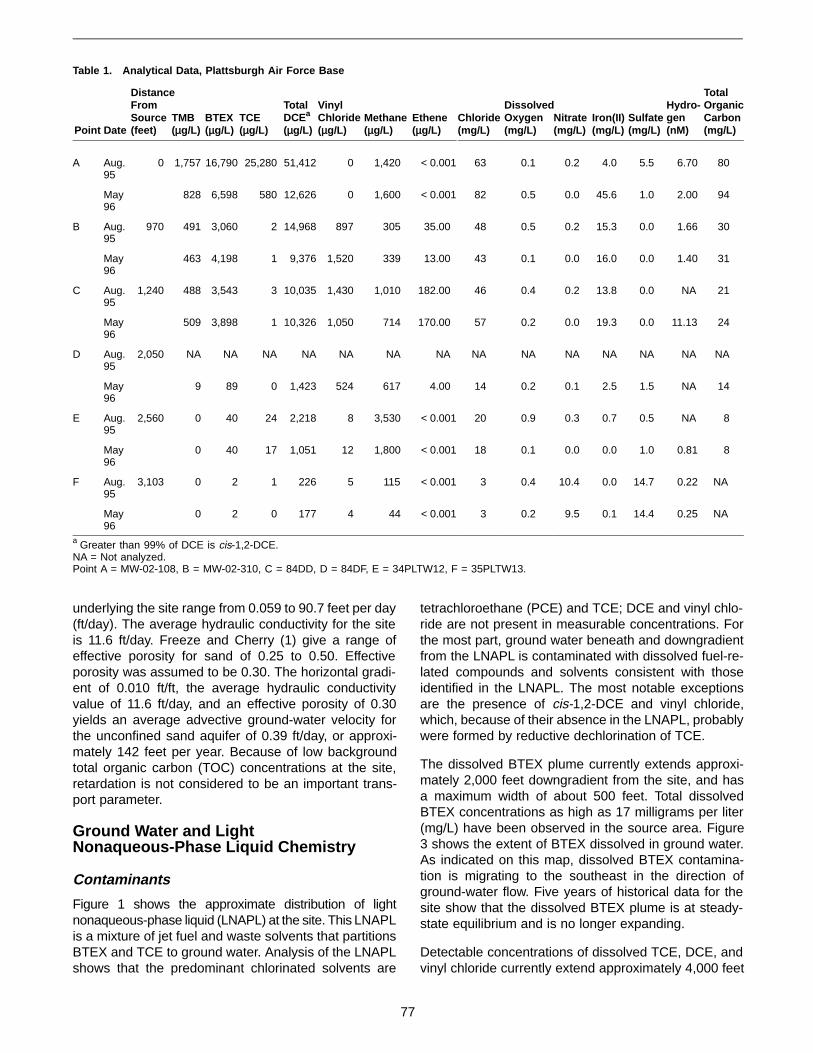
underlying the site range from 0.059 to 90.7 feet per day(ft/day). The average hydraulic conductivity for the siteis 11.6 ft/day. Freeze and Cherry (1) give a range ofeffective porosity for sand of 0.25 to 0.50. Effectiveporosity was assumed to be 0.30. The horizontal gradi-ent of 0.010 ft/ft, the average hydraulic conductivityvalue of 11.6 ft/day, and an effective porosity of 0.30yields an average advective ground-water velocity forthe unconfined sand aquifer of 0.39 ft/day, or approxi-mately 142 feet per year. Because of low backgroundtotal organic carbon (TOC) concentrations at the site,retardation is not considered to be an important trans-port parameter.
Ground Water and LightNonaqueous-Phase Liquid Chemistry
Contaminants
Figure 1 shows the approximate distribution of lightnonaqueous-phase liquid (LNAPL) at the site. This LNAPLis a mixture of jet fuel and waste solvents that partitionsBTEX and TCE to ground water. Analysis of the LNAPLshows that the predominant chlorinated solvents are
tetrachloroethane (PCE) and TCE; DCE and vinyl chlo-ride are not present in measurable concentrations. Forthe most part, ground water beneath and downgradientfrom the LNAPL is contaminated with dissolved fuel-re-lated compounds and solvents consistent with thoseidentified in the LNAPL. The most notable exceptionsare the presence of cis-1,2-DCE and vinyl chloride,which, because of their absence in the LNAPL, probablywere formed by reductive dechlorination of TCE.
The dissolved BTEX plume currently extends approxi-mately 2,000 feet downgradient from the site, and hasa maximum width of about 500 feet. Total dissolvedBTEX concentrations as high as 17 milligrams per liter(mg/L) have been observed in the source area. Figure3 shows the extent of BTEX dissolved in ground water.As indicated on this map, dissolved BTEX contamina-tion is migrating to the southeast in the direction ofground-water flow. Five years of historical data for thesite show that the dissolved BTEX plume is at steady-state equilibrium and is no longer expanding.
Detectable concentrations of dissolved TCE, DCE, andvinyl chloride currently extend approximately 4,000 feet
Table 1. Analytical Data, Plattsburgh Air Force Base
Point Date
DistanceFromSource(feet)
TMB(µµg/L)
BTEX(µµg/L)
TCE(µµg/L)
TotalDCEa
(µµg/L)
VinylChloride (µµg/L)
Methane(µµg/L)
Ethene(µµg/L)
Chloride (mg/L)
DissolvedOxygen(mg/L)
Nitrate(mg/L)
Iron(II) (mg/L)
Sulfate (mg/L)
Hydro-gen(nM)
TotalOrganic Carbon (mg/L)
A Aug.95
0 1,757 16,790 25,280 51,412 0 1,420 < 0.001 63 0.1 0.2 4.0 5.5 6.70 80
May96
828 6,598 580 12,626 0 1,600 < 0.001 82 0.5 0.0 45.6 1.0 2.00 94
B Aug.95
970 491 3,060 2 14,968 897 305 35.00 48 0.5 0.2 15.3 0.0 1.66 30
May96
463 4,198 1 9,376 1,520 339 13.00 43 0.1 0.0 16.0 0.0 1.40 31
C Aug.95
1,240 488 3,543 3 10,035 1,430 1,010 182.00 46 0.4 0.2 13.8 0.0 NA 21
May96
509 3,898 1 10,326 1,050 714 170.00 57 0.2 0.0 19.3 0.0 11.13 24
D Aug.95
2,050 NA NA NA NA NA NA NA NA NA NA NA NA NA NA
May96
9 89 0 1,423 524 617 4.00 14 0.2 0.1 2.5 1.5 NA 14
E Aug.95
2,560 0 40 24 2,218 8 3,530 < 0.001 20 0.9 0.3 0.7 0.5 NA 8
May96
0 40 17 1,051 12 1,800 < 0.001 18 0.1 0.0 0.0 1.0 0.81 8
F Aug.95
3,103 0 2 1 226 5 115 < 0.001 3 0.4 10.4 0.0 14.7 0.22 NA
May96
0 2 0 177 4 44 < 0.001 3 0.2 9.5 0.1 14.4 0.25 NA
a Greater than 99% of DCE is cis-1,2-DCE.NA = Not analyzed.Point A = MW-02-108, B = MW-02-310, C = 84DD, D = 84DF, E = 34PLTW12, F = 35PLTW13.
77
downgradient from FT-002. Concentrations of TCE,DCE, and vinyl chloride as high as 25 mg/L, 51 mg/L,and 1.5 mg/L, respectively, have been observed at thesite. As stated previously, no DCE was detected in theLNAPL plume at the site, and greater than 99 percent ofthe DCE found in ground water is the cis-1,2-DCE iso-mer. Figure 3 shows the extents of CAH compoundsdissolved in ground water at the site. As indicated onthis map, contamination is migrating to the southeast inthe direction of ground-water flow. Five years of histori-cal data for the site show that the dissolved CAH plumeis at steady-state equilibrium and is no longer expanding.
Indicators of Biodegradation
The distribution of electron acceptors used in microbiallymediated oxidation-reduction reactions is shown in Fig-ure 4. Electron acceptors displayed in this figure includedissolved oxygen, nitrate, and sulfate. There is a strongcorrelation between areas with elevated BTEX concen-trations and areas with depleted dissolved oxygen, ni-trate, and sulfate. The absence of these compounds incontaminated ground water suggests that aerobic respi-ration, denitrification, and sulfate reduction are working
to biodegrade fuel hydrocarbons at the site. Backgrounddissolved oxygen, nitrate, and sulfate concentrationsare on the order of 10 mg/L, 10 mg/L, and 25 mg/L,respectively.
Figure 5 shows the distribution of metabolic byproductsproduced by microbially mediated oxidation-reductionreactions that biodegrade fuel hydrocarbons. Metabolicbyproducts displayed in this figure include iron(II) andmethane (Figure 5). There is a strong correlation be-tween areas with elevated BTEX concentrations andareas with elevated iron(II) and methane. The presenceof these compounds in concentrations above back-ground in contaminated ground water suggests thatiron(III) reduction and methanogenesis are working tobiodegrade fuel hydrocarbons at the site. Backgroundiron(II) and methane concentrations are less than 0.05and 0.001 mg/L, respectively.
The pE of ground water is also shown in Figure 5. Areasof low pE correspond to areas with contamination, indi-cating that biologically mediated oxidation-reduction re-actions are occurring in the area with ground-watercontamination.
Figure 1. Site map.
78

Figure 3 illustrates the distribution of chloride in groundwater and compares measured concentrations of totalBTEX and CAHs in the ground water with chloride andethene. There is a strong correlation between areas withcontamination and areas with elevated chloride andethene concentrations relative to measured backgroundconcentrations. The presence of elevated concentra-tions of chloride and ethene in contaminated groundwater suggests that TCE, DCE, and vinyl chloride arebeing biodegraded. Background chloride concentrationsat the site are approximately 2 mg/L; background etheneconcentrations at the site are less than 0.001 mg/L.
Dissolved hydrogen concentrations can be used to de-termine the dominant terminal electron-accepting proc-ess in an aquifer. Table 2 presents the range of hydrogenconcentrations for a given terminal electron-acceptingprocess. Much research has been done on the topic ofusing hydrogen measurements to delineate terminalelectron-accepting processes (2-4). Table 1 presentshydrogen data for the site.
Biodegradation Rate Constant Calculations
Apparent biodegradation rate constants were calculatedusing the method presented in Wiedemeier et al. (5, 6)
for trimethylbenzene (TMB). A modified version of thismethod that takes into account the production of chlo-ride during biodegradation also was used to calculateapproximate biodegradation rates. Table 3 presents theresults of these rate-constant calculations.
Primary Substrate Demand for ReductiveDechlorination
For reductive dechlorination to occur, a carbon sourcethat can be used as a primary substrate must be presentin the aquifer. This carbon substrate can be in the formof anthropogenic carbon (e.g., fuel hydrocarbons) ornative organic material.
Figure 2. Hydrogeologic section.
Table 2. Range of Hydrogen Concentrations for a GivenTerminal Electron-Accepting Process
Terminal ElectronAccepting Process
Hydrogen Concentration (nM/L)
Denitrification < 0.1
Iron(III) reduction 0.2 to 0.8
Sulfate reduction 1 to 4
Methanogenesis > 5
79

Figure 3. Chlorinated solvents and byproducts (1995).
Figure 4. BTEX and electron acceptors (1995).
80
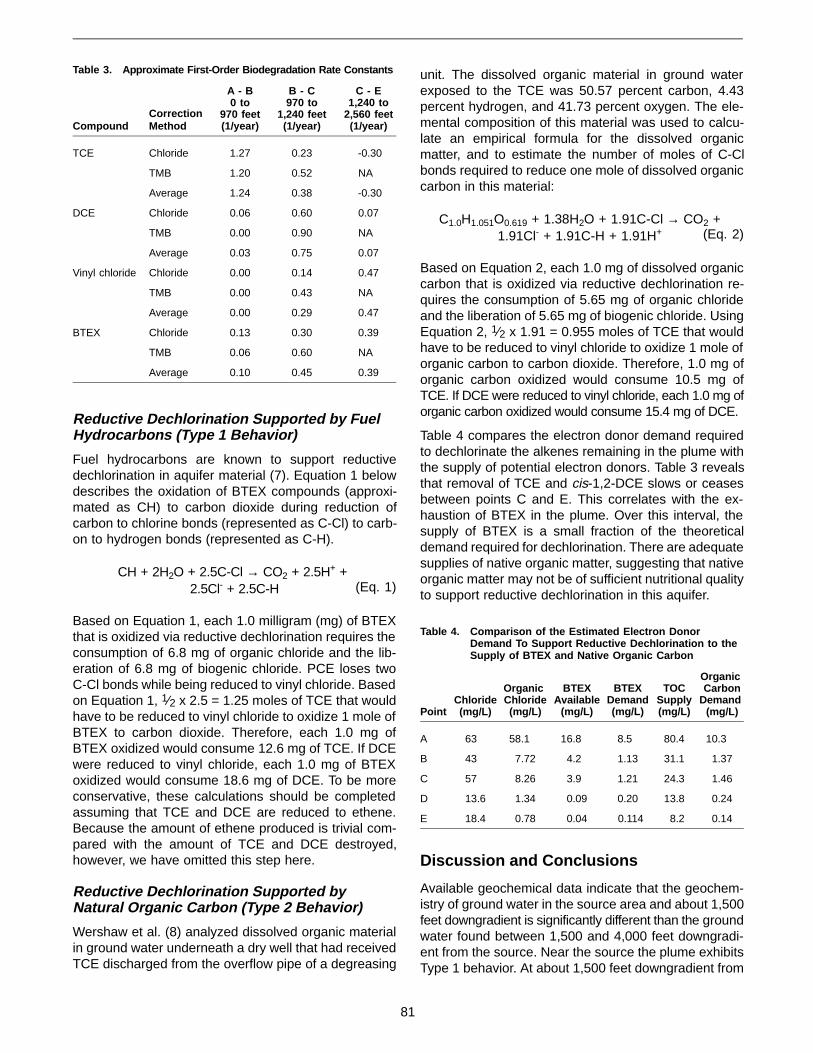
Reductive Dechlorination Supported by FuelHydrocarbons (Type 1 Behavior)
Fuel hydrocarbons are known to support reductivedechlorination in aquifer material (7). Equation 1 belowdescribes the oxidation of BTEX compounds (approxi-mated as CH) to carbon dioxide during reduction ofcarbon to chlorine bonds (represented as C-Cl) to carb-on to hydrogen bonds (represented as C-H).
CH + 2H2O + 2.5C-Cl → CO2 + 2.5H+ + 2.5Cl- + 2.5C-H (Eq. 1)
Based on Equation 1, each 1.0 milligram (mg) of BTEXthat is oxidized via reductive dechlorination requires theconsumption of 6.8 mg of organic chloride and the lib-eration of 6.8 mg of biogenic chloride. PCE loses twoC-Cl bonds while being reduced to vinyl chloride. Basedon Equation 1, 1⁄2 x 2.5 = 1.25 moles of TCE that wouldhave to be reduced to vinyl chloride to oxidize 1 mole ofBTEX to carbon dioxide. Therefore, each 1.0 mg ofBTEX oxidized would consume 12.6 mg of TCE. If DCEwere reduced to vinyl chloride, each 1.0 mg of BTEXoxidized would consume 18.6 mg of DCE. To be moreconservative, these calculations should be completedassuming that TCE and DCE are reduced to ethene.Because the amount of ethene produced is trivial com-pared with the amount of TCE and DCE destroyed,however, we have omitted this step here.
Reductive Dechlorination Supported byNatural Organic Carbon (Type 2 Behavior)
Wershaw et al. (8) analyzed dissolved organic materialin ground water underneath a dry well that had receivedTCE discharged from the overflow pipe of a degreasing
unit. The dissolved organic material in ground waterexposed to the TCE was 50.57 percent carbon, 4.43percent hydrogen, and 41.73 percent oxygen. The ele-mental composition of this material was used to calcu-late an empirical formula for the dissolved organicmatter, and to estimate the number of moles of C-Clbonds required to reduce one mole of dissolved organiccarbon in this material:
C1.0H1.051O0.619 + 1.38H2O + 1.91C-Cl → CO2 + 1.91Cl- + 1.91C-H + 1.91H+ (Eq. 2)
Based on Equation 2, each 1.0 mg of dissolved organiccarbon that is oxidized via reductive dechlorination re-quires the consumption of 5.65 mg of organic chlorideand the liberation of 5.65 mg of biogenic chloride. UsingEquation 2, 1⁄2 x 1.91 = 0.955 moles of TCE that wouldhave to be reduced to vinyl chloride to oxidize 1 mole oforganic carbon to carbon dioxide. Therefore, 1.0 mg oforganic carbon oxidized would consume 10.5 mg ofTCE. If DCE were reduced to vinyl chloride, each 1.0 mg oforganic carbon oxidized would consume 15.4 mg of DCE.
Table 4 compares the electron donor demand requiredto dechlorinate the alkenes remaining in the plume withthe supply of potential electron donors. Table 3 revealsthat removal of TCE and cis-1,2-DCE slows or ceasesbetween points C and E. This correlates with the ex-haustion of BTEX in the plume. Over this interval, thesupply of BTEX is a small fraction of the theoreticaldemand required for dechlorination. There are adequatesupplies of native organic matter, suggesting that nativeorganic matter may not be of sufficient nutritional qualityto support reductive dechlorination in this aquifer.
Discussion and Conclusions
Available geochemical data indicate that the geochem-istry of ground water in the source area and about 1,500feet downgradient is significantly different than the groundwater found between 1,500 and 4,000 feet downgradi-ent from the source. Near the source the plume exhibitsType 1 behavior. At about 1,500 feet downgradient from
Table 3. Approximate First-Order Biodegradation Rate Constants
CompoundCorrection Method
A - B0 to
970 feet(1/year)
B - C970 to
1,240 feet(1/year)
C - E1,240 to
2,560 feet(1/year)
TCE Chloride 1.27 0.23 -0.30
TMB 1.20 0.52 NA
Average 1.24 0.38 -0.30
DCE Chloride 0.06 0.60 0.07
TMB 0.00 0.90 NA
Average 0.03 0.75 0.07
Vinyl chloride Chloride 0.00 0.14 0.47
TMB 0.00 0.43 NA
Average 0.00 0.29 0.47
BTEX Chloride 0.13 0.30 0.39
TMB 0.06 0.60 NA
Average 0.10 0.45 0.39
Table 4. Comparison of the Estimated Electron DonorDemand To Support Reductive Dechlorination to theSupply of BTEX and Native Organic Carbon
PointChloride(mg/L)
Organic Chloride(mg/L)
BTEXAvailable
(mg/L)
BTEXDemand(mg/L)
TOCSupply(mg/L)
Organic Carbon
Demand (mg/L)
A 63 58.1 16.8 8.5 80.4 10.3
B 43 7.72 4.2 1.13 31.1 1.37
C 57 8.26 3.9 1.21 24.3 1.46
D 13.6 1.34 0.09 0.20 13.8 0.24
E 18.4 0.78 0.04 0.114 8.2 0.14
81

the source, the plume reverts to Type 3 behavior. Figure6 shows the zones of differing behavior at the site.
Type 1 Behavior
In the area extending to approximately 1,500 feet down-gradient from the former fire- training pit (source area),the dissolved contaminant plume consists of commin-gled BTEX and TCE and is characterized by anaerobicconditions that are strongly reducing (i.e., Type 1 behav-ior). Dissolved oxygen concentrations are on the orderof 0.1 mg/L (background = 10 mg/L), nitrate concentra-tions are on the order of 0.1 mg/L (background = 10mg/L), iron(II) concentrations are on the order of 15 mg/L(background = less than 0.05 mg/L), sulfate concentra-tions are less than 0.05 mg/L (background = 25 mg/L),and methane concentrations are on the order of3.5 mg/L (background = mg/L). Hydrogen concentra-tions in the source area range from 1.4 to 11 nanomoles(nM). As shown by Table 2, these hydrogen concentra-tions are indicative of sulfate reduction and methano-genesis, even though there is no sulfate available andrelatively little methane is produced. Thus, reductivedechlorination may be competitively excluding theseprocesses.
In this area BTEX is being used as a primary substrate,and TCE is being reductively dechlorinated to cis-1,2-
DCE and vinyl chloride. This is supported by the fact thatno detectable DCE or vinyl chloride was found in theLNAPL present at the site and is strong evidence thatthe DCE and vinyl chloride found at the site are pro-duced by the biogenic reductive dechlorination of TCE.Furthermore, the dominant isomer of DCE found at thesite is cis-1,2-DCE, the isomer preferentially producedduring reductive dechlorination. Average calculated first-order biodegradation rate constants in this zone are ashigh as 1.24, 0.75, and 0.29 per year for TCE, cis-1,2-DCE, and vinyl chloride, respectively. Figure 6 showsthe approximate extent of this type of behavior. Becausereductive dechlorination of vinyl chloride is slower thandirect oxidation, vinyl chloride and ethene are accumu-lating in this area (Figure 7).
Type 3 Behavior
Between 1,500 and 2,000 feet downgradient from thesource area, the majority of the BTEX has been biode-graded and the system begins to exhibit Type 3 behav-ior. Dissolved oxygen concentrations are on the order of0.5 mg/L (background = 10 mg/L). Nitrate concentrationsstart increasing downgradient of where Type 3 behaviorbegins and are near background levels of 10 mg/L at thedowngradient extent of the CAH plume. Iron(II) concen-trations have significantly decreased and are on the
Figure 5. BTEX and metabolic byproducts (1995).
82

order of 1 mg/L (background = less than 0.05 mg/L).Sulfate concentrations start increasing to 15 mg/L at thedowngradient extent of the CAH plume. Methane con-centrations are the highest in this area but could have
migrated from upgradient locations. The hydrogen con-centrations at Points E and F are 0.8 nM and 0.25 nM,respectively, suggesting that the dominant terminal elec-tron-accepting process in this area is iron(III) reduction.
These conditions are not optimal for reductive dechlori-nation, and it is likely that vinyl chloride is being oxidizedvia iron (III) reduction or aerobic respiration. Averagecalculated rate constants in this zone are -0.3, 0.07, and0.47 per year for TCE, cis-1,2-DCE, and vinyl chloride,respectively. The biodegradation rates of TCE and DCEslow because reductive dechlorination stops when theplume runs out of primary substrate (i.e., BTEX). Therate of vinyl chloride biodegradation in this area in-creases, probably because vinyl chloride is being oxi-dized. Because biodegradation of vinyl chloride is fasterunder Type 3 geochemical conditions than the biodegra-dation of other CAH compounds, the accumulation ofvinyl chloride ceases and the accumulated vinyl chloriderapidly degrades. Ethene concentrations also begin todecrease because ethene is no longer being producedfrom the reductive dechlorination of vinyl chloride (Figure 7).
Figure 6. Zonation of CAH plume.
Figure 7. Plot of TCE, DCE, and ethene versus distance down-gradient.
83
References
1. Freeze, R.A., and J.A. Cherry. 1979. Groundwater. EnglewoodCliffs, NJ: Prentice-Hall, Inc.
2. Lovley, D.R., and S. Goodwin. 1988. Hydrogen concentrations asan indicator of the predominant terminal electron-accepting reac-tion in aquatic sediments. Geochim. Cosmochim. Acta 52:2993-3003.
3. Lovley, D.R., F.H. Chapelle, and J.C. Woodward. 1994. Use ofdissolved H2 concentrations to determine distribution of microbiallycatalyzed redox reactions in anoxic ground water. Environ. Sci.Technol. 28(7):1205-1210.
4. Chapelle, F.H., P.B. McMahon, N.M. Dubrovsky, R.F. Fujii, E.T.Oaksford, and D.A. Vroblesky. 1995. Deducing the distribution ofterminal electron-accepting processes in hydrologically diversegroundwater systems. Water Resour. Res. 31:359-371.
5. Wiedemeier, T.H., J.T. Wilson, D.H. Kampbell, R.N. Miller, and J.E.Hansen. 1995. Technical protocol for implementing intrinsic reme-diation with long-term monitoring for natural attenuation of fuelcontamination dissolved in groundwater. San Antonio, TX: U.S. AirForce Center for Environmental Excellence.
6. Wiedemeier, T.H., M.A. Swanson, J.T. Wilson, D.H. Kampbell, R.N.Miller, and J.E. Hansen. 1996. Approximation of biodegradationrate constants for monoaromatic hydrocarbons (BTEX) in ground-water. Ground Water Monitoring and Remediation. Summer.
7. Sewell, G.W., and S.A. Gibson. 1991. Stimulation of the reductivedechlorination of tetrachloroethene in anaerobic aquifer micro-cosms by the addition of toluene. Environ. Sci. Technol. 25:982-984.
8. Wershaw, R.L., G.R. Aiken, T.E. Imbrigiotta, and M.C. Goldberg.1994. Displacement of soil pore water by trichloroethylene. J. En-viron. Quality 23:792-798.
84
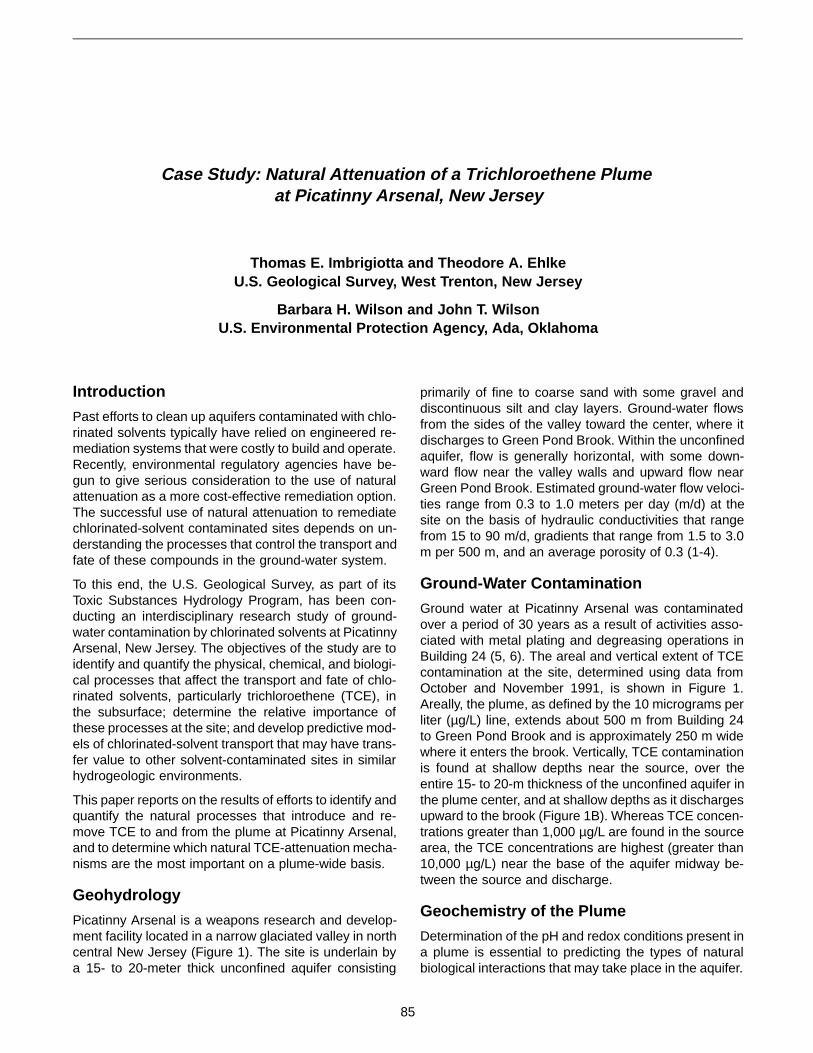
Case Study: Natural Attenuation of a Trichloroethene Plume at Picatinny Arsenal, New Jersey
Thomas E. Imbrigiotta and Theodore A. EhlkeU.S. Geological Survey, West Trenton, New Jersey
Barbara H. Wilson and John T. WilsonU.S. Environmental Protection Agency, Ada, Oklahoma
Introduction
Past efforts to clean up aquifers contaminated with chlo-rinated solvents typically have relied on engineered re-mediation systems that were costly to build and operate.Recently, environmental regulatory agencies have be-gun to give serious consideration to the use of naturalattenuation as a more cost-effective remediation option.The successful use of natural attenuation to remediatechlorinated-solvent contaminated sites depends on un-derstanding the processes that control the transport andfate of these compounds in the ground-water system.
To this end, the U.S. Geological Survey, as part of itsToxic Substances Hydrology Program, has been con-ducting an interdisciplinary research study of ground-water contamination by chlorinated solvents at PicatinnyArsenal, New Jersey. The objectives of the study are toidentify and quantify the physical, chemical, and biologi-cal processes that affect the transport and fate of chlo-rinated solvents, particularly trichloroethene (TCE), inthe subsurface; determine the relative importance ofthese processes at the site; and develop predictive mod-els of chlorinated-solvent transport that may have trans-fer value to other solvent-contaminated sites in similarhydrogeologic environments.
This paper reports on the results of efforts to identify andquantify the natural processes that introduce and re-move TCE to and from the plume at Picatinny Arsenal,and to determine which natural TCE-attenuation mecha-nisms are the most important on a plume-wide basis.
Geohydrology
Picatinny Arsenal is a weapons research and develop-ment facility located in a narrow glaciated valley in northcentral New Jersey (Figure 1). The site is underlain bya 15- to 20-meter thick unconfined aquifer consisting
primarily of fine to coarse sand with some gravel anddiscontinuous silt and clay layers. Ground-water flowsfrom the sides of the valley toward the center, where itdischarges to Green Pond Brook. Within the unconfinedaquifer, flow is generally horizontal, with some down-ward flow near the valley walls and upward flow nearGreen Pond Brook. Estimated ground-water flow veloci-ties range from 0.3 to 1.0 meters per day (m/d) at thesite on the basis of hydraulic conductivities that rangefrom 15 to 90 m/d, gradients that range from 1.5 to 3.0m per 500 m, and an average porosity of 0.3 (1-4).
Ground-Water Contamination
Ground water at Picatinny Arsenal was contaminatedover a period of 30 years as a result of activities asso-ciated with metal plating and degreasing operations inBuilding 24 (5, 6). The areal and vertical extent of TCEcontamination at the site, determined using data fromOctober and November 1991, is shown in Figure 1.Areally, the plume, as defined by the 10 micrograms perliter (µg/L) line, extends about 500 m from Building 24to Green Pond Brook and is approximately 250 m widewhere it enters the brook. Vertically, TCE contaminationis found at shallow depths near the source, over theentire 15- to 20-m thickness of the unconfined aquifer inthe plume center, and at shallow depths as it dischargesupward to the brook (Figure 1B). Whereas TCE concen-trations greater than 1,000 µg/L are found in the sourcearea, the TCE concentrations are highest (greater than10,000 µg/L) near the base of the aquifer midway be-tween the source and discharge.
Geochemistry of the Plume
Determination of the pH and redox conditions present ina plume is essential to predicting the types of naturalbiological interactions that may take place in the aquifer.
85

Results of water-quality analyses indicate that the pH ofground water in the plume is near neutral (6.5 to 7.5),and concentrations of both dissolved oxygen (less than0.5 milligrams per liter [mg/l]) and nitrate (less than 1
mg/L) are very low. Concentrations of iron(II) are greaterthan 1 mg/L in some areas of the plume, whereas sulfateand carbon dioxide are consistently plentiful (greater than40 mg/L and 100 mg/L as bicarbonate, respectively) as
Figure 1. Location of Building 24 study area at Picatinny Arsenal, New Jersey: (A) areal extent of ground-water trichloroetheneplume and (B) vertical distribution of ground-water trichloroethene concentrations, October to November 1991. (Locationof section A-A’ is shown in Figure 1A.)
86
A METERS
215 r----,~~~~~--r_--
210 <1t
205
200
195
DATUM IS SEA I.EVEI.
A' METERS
215
210
205
200
195
190L-----~-----L----~----~~----~----~----~~--~ 200 100 0 100 200 300 400
190 500 600
DISTANCE FROM BUILDING 24 (B-24). IN METERS
A.
--10--
EXPLANATION Area in which trichloroethene concentration exceeds 10 micrograms per liter
LINE OF EQUAL TRICHLOROETHENE CONCENTRATION--Shows trichloroethene concentration, in micrograms per liter. Dashed where approximate
A ---A' Line of section
.41-9 Ground-water sampling site location and local identifier
B.
EXPLANATION
--100--LINE OF EQUAL TRICHLOROETHENE
CONCENTRATION--Shows trichloroethene concentration, in micrograms per liter. Dashed where approximate
~ 10
Well screen and trichloroethene concentration, in micrograms per liter
NS Not sampled
< Less than
CAF·7 Location of well and local identifier

potential terminal electron acceptors. In addition, sulfideodor was noted in water from many wells within theplume, and methane was present at concentrationsranging from 1 to 85 µg/L.
These findings indicate the plume is primarily anaerobicand contains a variety of reducing redox environmentscontrolled in different areas by iron(III) reduction, sulfatereduction, and methanogenesis. Under these condi-tions, reductive dechlorination of TCE can take place ifsufficient electron donors are available. Dissolved or-ganic carbon (DOC), consisting primarily of humic andfulvic acids, may fulfill the electron donor requirement inthis system. Concentrations of DOC are highest imme-diately downgradient from the source area (5 to 14mg/L) and also are elevated near the discharge point (1to 2 mg/L).
The presence of cis-1,2-dichloroethene (cis-DCE) andvinyl chloride (VC)—TCE breakdown products—in 75percent of the wells sampled in and around the plumeindicates that reductive dechlorination of TCE is takingplace in the aquifer. Because neither of these com-pounds was used in Building 24, they are believed tooriginate from the biologically mediated breakdown ofTCE. Further evidence for reductive dechlorination ofTCE is the similarity among the distributions of TCE,cis-DCE, and VC in the aquifer, although the concentra-tions of cis-DCE and VC are highest in the downgradientportion of the plume near the discharge point.
Trichloroethene Mass Distribution
The mass of TCE dissolved in the ground water in theplume was estimated on the basis of results of sixsynoptic sampling taken from 1987 to 1991. By using aplume volume of 2.3 x 10⁶ cubic meters (m3) and aporosity of 0.3, and by assuming that each well repre-sents a finite volume of the aquifer, the average massof TCE dissolved in the plume was determined to be1,000 ± 200 kilograms (kg) (7). This estimate did notshow a consistent increasing or decreasing trend overthe six sampling, which implies that the plume wasessentially at steady state. Most of the dissolved TCEmass (57 percent) is present in the ground water nearthe base of the unconfined aquifer, where TCE concen-trations are greater than 10,000 µg/L.
The mass of sorbed TCE within the plume was esti-mated from methanol-extraction analyses of sedimentsfrom six sites along the centerline of the plume (8). Theratio of the masses of sorbed TCE to dissolved TCE perunit volume of aquifer ranged from 3:1 to 4:1 at thesesix sites. Therefore, 3,000 to 4,000 kg of TCE is calcu-lated to be sorbed to aquifer sediments within the plume.A sorbed mass of 3,500 kg of TCE was used in allcalculations.
Trichloroethene Mass-Flux Estimates
The major naturally occurring processes that affect theinput or removal of TCE to or from the plume wereidentified and studied independently as part of the ToxicSubstances Hydrology Program project at Picatinny Ar-senal (9, 10). The TCE removal processes that wereconsidered include advective transport, lateral disper-sion, anaerobic biotransformation, diffusion-driven vola-tilization, advection-driven volatilization, and sorption.The TCE input processes evaluated include desorption,infiltration, and dissolution. Each of these processes isdescribed briefly below, and a TCE mass-flux estimateis made for each on the basis of the results of researchconducted in the Picatinny Arsenal plume.
Removal-Process Flux Estimates
Advective transport is the process by which dissolvedTCE is removed from the plume in ground water that isdischarging to Green Pond Brook. The mass flux of TCEwas calculated by using an advective flux rate of 800liters per meter squared per week (based on modelinganalyses [4, 11]), a median ground-water TCE concen-tration of 1,200 µg/L, and a cross-sectional area of 980square meters where the aquifer discharges to thebrook. On the basis of these values, approximately 50kilograms per year (kg/yr) of TCE are removed from theplume by discharge to Green Pond Brook.
Lateral dispersion is the process that causes plumespreading by transport of TCE out of the side boundariesof the plume where the concentration is 10 µg/L (Figure1). Using Fick’s Law, the lateral TCE-concentration gra-dient, and the estimated area of the sides of the plume,researchers calculated that less than 1 kg/yr of TCE islost from the plume by this mechanism.
Anaerobic biotransformation is the biologically mediatedprocess of reductive dechlorination whereby TCE un-dergoes the sequential replacement of the chlorine at-oms on the molecule with hydrogen atoms to formcis-DCE, VC, and ethene as breakdown products (12,13). Biotransformation rate constants were determinedin laboratory batch microcosm studies of core samplesfrom five sites along the centerline of the plume (14, 15).The first-order TCE-degradation rate constants obtainedin these studies range from -0.004 to -0.035 per week,with a median of -0.007 per week. If this latter rateconstant is applied to the 1,000 kg of TCE dissolved in theplume, about 360 kg/yr of TCE are removed from theplume by naturally occurring anaerobic biotransformation.
Volatilization is the loss of TCE from ground water intothe soil gas of the unsaturated zone across the watertable. Volatilization is driven by diffusive and advectivemechanisms. The rate of loss of TCE in diffusion-drivenvolatilization is determined by the TCE gradient in thesoil gas of the unsaturated zone. Diffusion-driven vola-
87

tilization was estimated using Fick’s Law, field-meas-ured unsaturated-zone soil-gas TCE gradients, bulk dif-fusion coefficients from the literature for sites with similarsoils, and the area of the plume. Removal of TCE fromthe plume by diffusion-driven volatilization is calculatedto be less than 1 kg/yr over the area of the plume (7,16). In advection-driven volatilization, the rate of loss ofTCE is controlled by pressure and temperature changesin the unsaturated-zone soil gas. Advection-driven vola-tilization was investigated using a prototype vertical-fluxmeasuring device at Picatinny Arsenal (16). On thebasis of flux measurements made with the device ateight sites and the area of the plume, the TCE removedfrom the plume by advection-driven volatilization is cal-culated to be approximately 50 kg/yr.
Sorption is the partitioning of TCE from the ground waterinto the organic-carbon fraction of the aquifer sedi-ments. Field partition coefficients measured at severallocations within the plume (8) indicate that more TCEwas sorbed to aquifer organic materials at all sites thanwould be predicted if the sorbed TCE concentrationswere in equilibrium with the ground-water TCE concen-trations. Therefore, desorption processes rather thansorption processes most likely predominate. Removal ofTCE by sorption is estimated to be less than 1 kg/yr.
Input-Process Flux Estimates
Desorption is the process by which TCE partitions outof the organic phase on the contaminated sedimentsback into the ground water in response to concentrationgradients. This process at Picatinny Arsenal was char-acterized as having two parts: an initial rapid phase ofdesorption, in which 0 to 10 percent of the TCE releases,and a second, slower phase of desorption, in which mostof the TCE releases over a longer period (8). First-orderdesorption rate constants ranging from -0.003 to -0.015per week were measured in flow-through column experi-ments. Because these experiments were conductedwith clean water, the desorption rates obtained probablyare higher than in situ desorption rates. For this reason,the smaller of the desorption rate constants (-0.003 perweek) and the total amount of TCE estimated to besorbed to the plume sediments (3,500 kg) were used tocalculate that 550 kg/yr of TCE is being input to theplume by means of desorption.
Infiltration, the process by which TCE in the soil gas oron the unsaturated-zone soil is dissolved by percolatingrecharge to the ground water, was studied with labora-tory soil columns, field infiltration experiments, and mul-tiphase solute-transport modeling (17). Becauseconcentrations of TCE in the soil gas generally are lowover most of the plume, and because infiltration occursonly during recharge events rather than continuouslythroughout the year, it was estimated that the input ofTCE to the plume by this process is less than 1 kg/yr.
Dissolution is the process by which dense nonaqueous-phase liquid (DNAPL) TCE dissolves into the groundwater. The presence of DNAPL TCE at the base of theunconfined aquifer midway between the source and thebrook has been suspected because concentrations ofTCE in ground water at this location are much higherthan those immediately upgradient. Concentrations ofTCE in deep wells in this area consistently exceed 2percent of saturation, which is one indication of DNAPLpresence (18). DNAPL TCE has not been confirmed bymeasurement or observation of free-phase TCE in anywater or soil sample from the arsenal. Consequently, themass of DNAPL TCE that is input by dissolution cannotbe calculated directly but can only be estimated by thedifference between the sum of the mass removed by allremoval processes and the sum of the mass introducedby all other input processes.
Mass-Balance Analysis
The estimated mass balance for the TCE plume atPicatinny Arsenal is shown in Figure 2. All inputs arerepresented with open arrows; all outputs are repre-sented with solid arrows.
Approximately 460 kg/yr of dissolved TCE is estimatedto be removed from the plume by natural processes. Ofthis, 360 kg/yr, or 78 percent of the TCE removed annu-ally, is removed as a result of anaerobic biotransforma-tion. This is by far the most important TCE removalprocess operating in the Picatinny Arsenal plume. Re-moval by advective transport to Green Pond Brook andadvection-driven volatilization are each estimated at 50kg/yr. Therefore, each of these processes is responsiblefor the removal of about 11 percent of the total TCEremoved annually from the plume. Lateral dispersion,diffusion-driven volatilization, and sorption are all of mi-nor importance compared with these major processes.
The finding that natural anaerobic biotransformation isthe principal mechanism for removal of TCE from theplume at Picatinny Arsenal is significant. Anaerobicbiotransformation has been reported to be a major natu-ral removal process for TCE at only a few sites (19), andthis conclusion has not previously been reached byquantifying and comparing the magnitude of all otherremoval processes occurring at a site. This result islikely to have great transfer value to other sites withsimilar geochemistry, hydrology, and geology.
The process of desorption is the most important inputmechanism evaluated at Picatinny Arsenal; it accountsfor the introduction of an estimated 550 kg/yr of TCE.Input by infiltration is very small in comparison (less than1 kg/yr). Because the sum of the inputs is larger thanthe sum of the outputs, dissolution of DNAPL TCE in thesystem cannot be estimated.
88
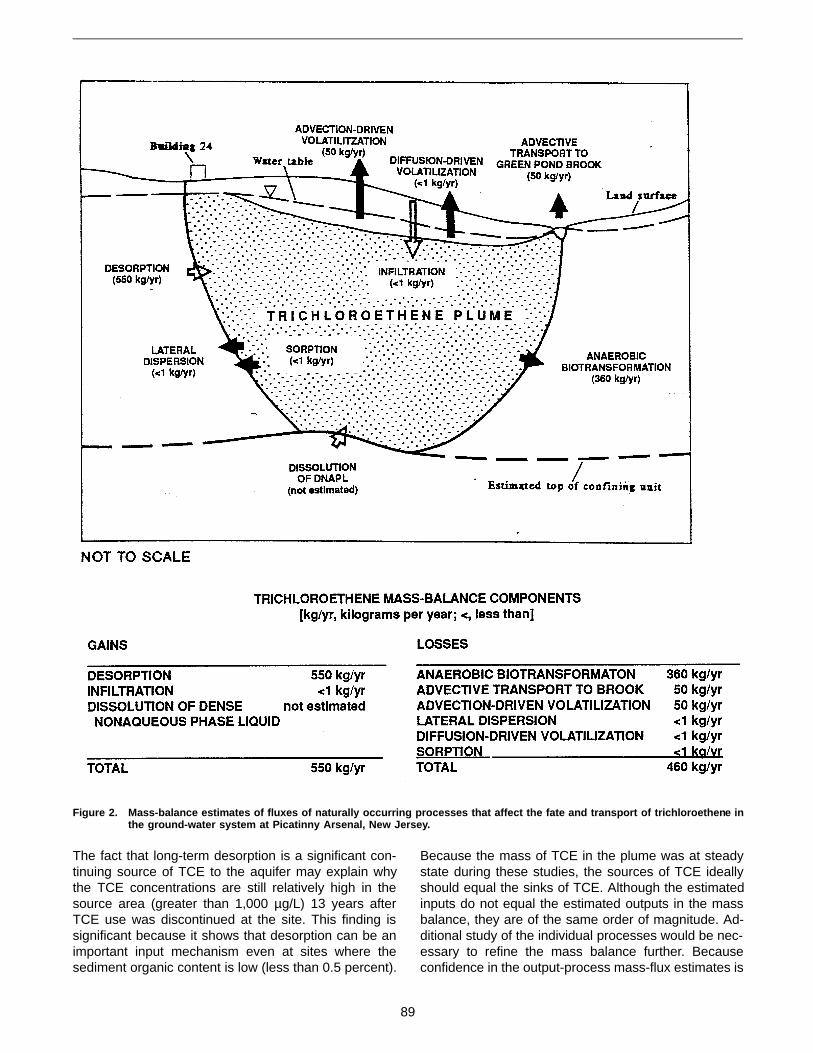
The fact that long-term desorption is a significant con-tinuing source of TCE to the aquifer may explain whythe TCE concentrations are still relatively high in thesource area (greater than 1,000 µg/L) 13 years afterTCE use was discontinued at the site. This finding issignificant because it shows that desorption can be animportant input mechanism even at sites where thesediment organic content is low (less than 0.5 percent).
Because the mass of TCE in the plume was at steadystate during these studies, the sources of TCE ideallyshould equal the sinks of TCE. Although the estimatedinputs do not equal the estimated outputs in the massbalance, they are of the same order of magnitude. Ad-ditional study of the individual processes would be nec-essary to refine the mass balance further. Becauseconfidence in the output-process mass-flux estimates is
Figure 2. Mass-balance estimates of fluxes of naturally occurring processes that affect the fate and transport of trichloroethen e inthe ground-water system at Picatinny Arsenal, New Jersey.
89

high and the TCE desorption rate constants used prob-ably were on the high side, the desorption mass-fluxestimate may be higher than the actual value.
Field-Scale Estimate of NaturalAttenuation Rate
The natural attenuation rate of TCE at Picatinny Arsenalwas calculated from field data and compared with theanaerobic biotransformation rates calculated in the labo-ratory microcosm studies. Assuming first-order kineticsand considering the decrease in TCE concentrationsfrom the source area to the discharge area (1,900 µg/Lto 760 µg/L), the time of travel for TCE between thesetwo points in the plume (3.1 years), and the distancebetween these two sites (470 m), then the field-scalenatural attenuation rate constant is calculated to be-0.006 per week. This field-calculated rate constant isnearly identical to the median rate constant of -0.007 perweek determined in the laboratory microcosm experi-ments. That both methods yield rate constants of similarmagnitude confirms that most of the natural attenuationthat occurs in the Picatinny Arsenal plume is due toanaerobic biotransformation. In addition, it indicates thatthe methods used to make these estimates and meas-urements are valid.
Comparison of Natural AttenutationProcesses to Pump-and-TreatRemediation
A pump-and-treat system was installed in the PicatinnyArsenal TCE plume as an interim remediation measurein September 1992. It consists of a set of five withdrawalwells from which an average of 440,000 liters per dayare pumped to a treatment system equipped with strip-ping towers and granulated activated carbon filters. Onthe basis of average pumpage values and ground-waterTCE concentrations in each withdrawal well during1995, the pump-and-treat system is currently removingabout 70 kg/yr at a cost of $700,000 per year. This isabout one-fifth the amount of TCE being removed fromthe plume each year by anaerobic biotransformation,and just slightly more than the mass of TCE beingremoved by each of the processes of advective trans-port and advection-driven volatilization.
Conclusion
The relative importance of all naturally occurring proc-esses that introduce or remove TCE to or from a con-tamination plume at Picatinny Arsenal, New Jersey, wasdetermined. Anaerobic biotransformation is the mostimportant process for TCE removal from the plume byalmost an order of magnitude over advective transportand advection-driven volatilization. Anaerobic biotrans-formation accounts for an estimated 78 percent of thetotal mass of TCE removed from the plume annually.
Other removal processes—lateral dispersion, diffusion-driven volatilization, and sorption—are minor in com-parison. Desorption is the most significant TCE inputprocess evaluated. A mass-balance analysis shows thatthe removal of TCE from the plume by natural attenu-ation processes is of the same order of magnitude asthe input of TCE to the plume. The natural attenuationrate constant calculated from field TCE concentrationsand time-of-travel data is in close agreement with an-aerobic biotransformation rate constants measured inlaboratory microcosm studies.
Anaerobic biotransformation removes approximatelyfive times the mass of TCE removed by an interimpump-and-treat remediation system operating at the Pi-catinny Arsenal site. The pump-and-treat system re-moves just slightly more mass per year than each of theprocesses of advective transport to Green Pond Brookand advection-driven volatilization.
References
1. Martin, M. 1989. Preliminary results of a study to simulate trichlo-roethylene movement in ground water at Picatinny Arsenal, NewJersey. In: Mallard, G.E., and S.E. Ragnone, eds. U.S. GeologicalSurvey Toxic Substances Hydrology Program—proceedings ofthe technical meeting, Phoenix, AZ, September 26-30, 1988. U.S.Geological Survey Water-Resources Investigations Report 88-4220. pp. 377-383.
2. Martin, M. 1991. Simulation of reactive multispecies transport intwo dimensional ground-water-flow systems. In: Mallard, G.E.,and D.A. Aronson, eds. U.S. Geological Survey Toxic SubstancesHydrology Program—proceedings of the technical meeting, Mon-terey, CA, March 11-15. U.S. Geological Survey Water-Re-sources Investigations Report 91-4034. pp. 698-703.
3. Martin, M. 1996. Simulation of transport, desorption, volatilization,and microbial degradation of trichloroethylene in ground water atPicatinny Arsenal, New Jersey. In: Morganwalp, D.W., and D.A.Aronson, eds. U.S. Geological Survey Toxic Substances Hydrol-ogy Program—proceedings of the technical meeting, ColoradoSprings, CO, September 20-24, 1993. U.S. Geological SurveyWater-Resources Investigations Report 94-4015.
4. Voronin, L.M. 1991. Simulation of ground-water flow at PicatinnyArsenal, New Jersey. In: Mallard, G.E., and D.A. Aronson, eds.U.S. Geological Survey Toxic Substances Hydrology Program—proceedings of the technical meeting, Monterey, CA, March 11-15. U.S. Geological Survey Water-Resources InvestigationsReport 91-4034. pp. 713-720.
5. Sargent, B.P., T.V. Fusillo, D.A. Storck, and J.A. Smith. 1990.Ground-water contamination in the area of Building 24, PicatinnyArsenal, New Jersey. U.S. Geological Survey Water-ResourcesInvestigations Report 90-4057. p. 94.
6. Benioff, P.A., M.H. Bhattacharyya, C. Biang, S.Y. Chiu, S. Miller,T. Patton, D. Pearl, A. Yonk, and C.R. Yuen. 1990. Remedialinvestigation concept plan for Picatinny Arsenal, Vol. 2: Descrip-tions of and sampling plans for remedial investigation sites. Ar-gonne National Laboratory, Environmental Assessment andInformation Sciences Division, Argonne, IL. pp. 22-1 - 22-24.
7. Imbrigiotta, T.E., T.A. Ehlke, M. Martin, D. Koller, and J.A. Smith.1995. Chemical and biological processes affecting the fate andtransport of trichloroethylene in the subsurface at Picatinny Arse-nal, New Jersey. Hydrological Sci. Technol. 11(1-4):26-50.
90

8. Koller, D., T.E. Imbrigiotta, A.L. Baehr, and J.A. Smith. 1996.Desorption of trichloroethylene from aquifer sediments at Picat-inny Arsenal, New Jersey. In: Morganwalp, D.W., and D.A. Aron-son, eds. U.S. Geological Survey Toxic Substances HydrologyProgram—proceedings of the technical meeting, ColoradoSprings, CO, September 20-24, 1993. U.S. Geological SurveyWater-Resources Investigations Report 94-4015.
9. Imbrigiotta, T.E., and M. Martin. 1991. Overview of research ac-tivities on the movement and fate of chlorinated solvents inground water at Picatinny Arsenal, New Jersey. In: Morganwalp,D.W., and D.A. Aronson, eds. U.S. Geological Survey Toxic Sub-stances Hydrology Program—proceedings of the technical meet-ing, Monterey, CA, March 11-15. U.S. Geological SurveyWater-Resources Investigations Report 91-4034. pp. 673-680.
10. Imbrigiotta, T.E., and M. Martin. 1996. Overview of research ac-tivities on the transport and fate of chlorinated solvents in groundwater at Picatinny Arsenal, New Jersey, 1991-93. In: Morgan-walp, D.W., and D.A. Aronson, eds. U.S. Geological Survey ToxicSubstances Hydrology Program—proceedings of the technicalmeeting, Colorado Springs, CO, September 20-24, 1993. U.S.Geological Survey Water-Resources Investigations Report 94-4015.
11. Martin, M., and T.E. Imbrigiotta. 1994. Contamination of groundwater with trichloroethylene at the Building 24 site at PicatinnyArsenal, New Jersey. In: U.S. EPA Symposium on Intrinsic Biore-mediation of Ground Water, Denver, CO, August 30-September1, 1994. EPA/540/R-94/515. pp. 143-153.
12. Parsons, F.Z., P.R. Wood, and J. DeMarco. 1984. Transforma-tions of tetrachloroethene and trichloroethene in microcosms andground water. J. Am. Waterworks Assoc. 76(2):56-59.
13. Vogel, T.M., C.S. Criddle, and P.L. McCarty. 1987. Transforma-tions of halogenated aliphatic compounds. Environ. Sci. Technol.21(8):722-736.
14. Wilson, B.H., T.A. Ehlke, T.E. Imbrigiotta, and J.T. Wilson. 1991.Reductive dechlorination of trichloroethylene in anoxic aquifermaterial from Picatinny Arsenal, New Jersey. In: Morganwalp,D.W., and D.A. Aronson, eds. U.S. Geological Survey Toxic Sub-stances Hydrology Program—proceedings of the technical meet-ing, Monterey, CA, March 11-15. U.S. Geological SurveyWater-Resources Investigations Report 91-4034. pp. 704-707.
15. Ehlke, T.A., T.E. Imbrigiotta, B.H. Wilson, and J.T. Wilson. 1991.Biotransformation of cis-1,2-dichloroethylene in aquifer materialfrom Picatinny Arsenal, Morris County, New Jersey. In: Morgan-walp, D.W., and D.A. Aronson, eds. U.S. Geological Survey ToxicSubstances Hydrology Program—proceedings of the technicalmeeting, Monterey, CA, March 11-15. U.S. Geological SurveyWater-Resources Investigations Report 91-4034. pp. 689-697.
16. Smith, J.A., A.K. Tisdale, and H.J. Cho. In press. Quantificationof natural vapor fluxes of trichloroethene in the unsaturated zoneat Picatinny Arsenal, New Jersey. Environ. Sci. Technol.
17. Cho, H.J., P.R. Jaffe, and J.A. Smith. 1993. Simulating the vola-tilization of solvents in unsaturated soils during laboratory andfield infiltration experiments. Water Resour. Res. 29(10):3329-3342.
18. Cohen, R.M., and J.W. Mercer. 1993. DNAPL site evaluation.Boca Raton, FL: C.K. Smoley.
19. Wilson, J.T., J.W. Weaver, and D.H. Kampbell. 1994. IntrinsicBioremediation of TCE in ground water at an NPL site in St.Joseph, Michigan. In: U.S. EPA Symposium on Intrinsic Bioreme-diation of Ground Water, Denver, CO, August 30-September 1.EPA/540/R-94/515. pp. 154-160.
91
Case Study: Plant 44, Tucson, Arizona
Hanadi S. Rifai and Philip B. BedientRice University, Houston, Texas
Kristine S. BurgessMontgomery Watson, Salt Lake City, Utah
Introduction
A pump-and-treat remediation system operating for thepast 10 years at the Plant 44 site in Tucson, Arizona,allowed hydraulic control of the dissolved chlorinatedsolvents contaminant plume. Additionally, the pump-and-treat network removed a total of approximately6,000 kilograms (kg) of trichloroethene (TCE) in its first5 years of operation. Recent observations using sitedata, however, include resurgence of TCE concentra-tions after pump turnoff and the emergence of the “tail-ing” phenomenon at a number of the pumping wells.
A detailed analysis of the site’s historical information aswell as extensive data collected before and after systemstartup suggested the presence of dense nonaqueousphase liquids (DNAPLs) at the site and revealed that thepump-and-treat system would not achieve the desiredsite cleanup within a reasonable time frame.
Plant 44 Site Description
The site hydrogeology consists of four stratigraphic units(1): a relatively thick unsaturated zone extending be-tween 110 to 130 feet below the surface; an upper zoneextending to a depth of 180 to 220 feet; an aquitardconsisting of 100 to 150 feet of low-permeability clay; anda lower zone. Pump tests indicate that hydraulic conduc-tivity ranges from 2 x 10⁻⁴ to 3 x 10⁻³ feet per second forthe upper zone. The background hydraulic gradient is0.006 feet per foot toward the northwest, and the ground-water velocity ranges from 250 to 800 feet per year (2).
Activities at Plant 44 include development, manufactur-ing, testing, and maintenance of missile systems from1952 until the present. Historical data indicate thatgreater than 50 drums per year of TCE, 1,1-dichlo-roethene (1,1-DCE), and 1,1,1-trichloroethane (1,1,1-TCA) were used at the site. The resulting area of TCEcontamination was approximately 5 miles long by 1.6
miles wide in 1986, before remediation startup (Figure1). A maximum TCE concentration of 2.7 parts per mil-lion (ppm) was measured in 1986, although concentra-tions of up to 15.9 ppm have been observed in theground water (2). Potential sources of contaminationinclude pits, ponds, trenches, and drainage ditches inwhich disposal of solvents and waste water was re-ported from 1952 through 1977 (Figure 2).
Ground-Water Extraction System
The pump-and-treat system began operation in April1987. The system consists of 17 extraction wells and 13recharge wells, shown in Figure 1. Water-level elevationand contaminant concentration data for the pumpingwells and 40 monitoring wells are collected monthly. Thetotal dissolved mass removed by the system in its first5 years of operation (approximately 6,000 kg) exceedsthe 3,800 kg dissolved mass present in the plume in1986. This would suggest the presence of a continuingsource of contamination in the aquifer.
The concentration of dissolved TCE in the extractedground water decreases during remediation, particularlyin those wells with initially high TCE concentrations. Inthe majority of cases, the TCE concentration appears tolevel out between 3 and 5 years, usually to a value thatexceeds the TCE drinking water standard of 5 parts perbillion (ppb). Numerous spikes of high TCE concentra-tion are observed in a number of the pumping wells,possibly due to continuing sources.
Fate-and-Transport Modeling
Modeling of the TCE plume at the site was completedto evaluate the time required for cleanup. Aqueous-phase flow in the upper zone was simulated along withthe pump-and-treat remediation system. Source loca-tions used in the modeling were based on the location
92

of “hot spots” in the plume, areas where formation ofDNAPL pools is likely and areas where the confiningclay layer is thin. An overall mass transfer rate due to acontinuing source of contamination was estimatedbased on the difference between the mass pumped inthe first 5 years of operation of the system and the masspresent in the aquifer.
Additionally, source dissolution mechanisms were ana-lyzed assuming the following four potential configura-tions of DNAPL in the subsurface: unsaturated zoneresidual, a DNAPL pool, saturated zone residual, andDNAPL located in a nonadvective zone. Dissolutiontimes, for example, due to unsaturated zone sourceareas ranged from 1,100 to 13,000 years, while thosefor DNAPL pools ranged from 1 to 60,000 years depend-ing on the source assumptions that were made.
A comparison between the estimated mass transfer rateand the dissolution data indicated that the two mostlikely dissolution mechanisms present at the site includeunsaturated zone residuals and DNAPL pools. The as-sociated dissolution times ranged from 100 to 1,000years. The fate-and-transport modeling results, assum-ing no continuing sources of TCE into the aquifer, indi-cate that 50 more years of the remediation system’soperation are required. If the estimated mass transferrates are incorporated into the model, the required re-mediation time exceeds hundreds of years.
Conclusion
Data from the Plant 44 site indicate that DNAPL may bepresent. Further contamination of the ground watermight occur because of sources present in the unsatu-rated zone and the potential dissolution from TCE plumes.
Figure 1. TCE plume prior to remediation, December 1986 (ppb).
Figure 2. Historical onsite disposal locations.
93

Complete dissolution of the DNAPL pools may take aslong as 100 years under pumped conditions, while dis-solution of unsaturated residual by infiltrating groundwater may continue for thousands of years. The ground-water extraction system at the site has contained thedissolved plume and removed significant amounts ofchlorinated compounds. If DNAPL is present at the site,however, complete removal of TCE using pump-and-treatwill require a very lengthy and costly operation period.
References
1. Hargis and Montgomery, Inc. 1982. Phase II investigation of sub-surface conditions in the vicinity of abandoned waste disposalsites, Hughes Aircraft Company manufacturing facility, Tucson,Arizona, Vol. I. Tucson, AZ.
2. Groundwater Resources Consultants, Inc. 1992. Quarterly groundwater monitoring report, well field reclamation system, July throughSeptember 1991, U.S. Air Force Plant 44.
94
Remediation Technology Development Forum Intrinsic Remediation Project atDover Air Force Base, Delaware
David E. Ellis and Edward J. LutzDuPont Specialty Chemicals-CRG, Wilmington, Delaware
Gary M. KleckaDow Chemical Company, Midland, Michigan
Daniel L. PardieckCiba-Geigy, Greensboro, North Carolina
Joseph J. SalvoGeneral Electric Corporate Research and Development, Schenectady, New York
Michael A. HeitkampMonsanto Company, St. Louis, Missouri
David J. GannonZeneca Bioproducts, Mississauga, Ontario
Charles C. Mikula and Catherine M. VogelU.S. Air Force, Tyndall Air Force Base, Florida
Gregory D. Sayles, Donald H. Kampbell, and John T. WilsonU.S. Environmental Protection Agency,
National Risk Management Research Laboratory, Ada, Oklahoma
Donald T. MaiersU.S. Department of Energy, Idaho National Engineering Laboratory, Idaho Falls, Idaho
Introduction
The Remediation Technology Development Forum(RTDF) Bioremediation Consortium is conducting alarge, integrated field and laboratory study of intrinsicremediation in a plume at the Dover Air Force Base(AFB) in Delaware. The work group is a consortium ofindustrial companies and government agencies workingon various aspects of bioremediation of chlorinated sol-vents, such as tetrachloroethylene (PCE) and trichlo-roethene (TCE). The intrinsic bioremediation program ispart of an integrated study that also includes co-metabolic bioventing and accelerated anaerobic treat-ment. The combination of these three methods can treatall parts of a solvent contamination area.
The goals of the 4-year intrinsic remediation study areto evaluate whether the contaminants at the site arebeing destroyed through intrinsic remediation, to identifythe degradation mechanisms, and to develop and vali-date protocols for implementing intrinsic remediation atother sites.
A wide variety of geological, geochemical, and biologicalresearch is being integrated into this study. This presen-tation emphasizes the geochemical aspects of the studyfor the following reasons: the geochemical data wereavailable early in the study; it clearly shows that solventdestruction is happening; and the primary author’s ex-pertise lies in geochemistry. The participants who fo-cused on the biological aspects of this study will undoubtedlybe presenting their conclusions at future meetings.
95

Background
The RTDF Bioremediation Consortium initiated thisstudy in February 1995. Dover AFB was chosen over themany other sites evaluated for the study because:
• The plume is well-characterized.
• Analyses of ground-water chemistry provided clearevidence that chlorinated solvent contaminants arebeing biodegraded.
• The deep zone of the aquifer has relatively simplegeology and is underlain by a thick confining layer.
• Access for sampling and testing is good, and the siteis easily reached by offsite personnel and visitors.
• The base has a proactive environmental program.
The plume contains primarily TCE and dichloroethene(DCE), with smaller amounts of vinyl chloride (VC). Itoccupies an area north and south of U.S. Highway 113approximately 9,000 feet long and 3,000 feet wide.There are multiple sources of solvent contamination inthe area north of the highway, as well as several minorsources of petroleum hydrocarbons. There appear to beat least three sources of TCE.
The water-bearing unit in the study area is composed offine- to coarse-grained sands ranging in thickness from30 to 60 feet. The ground-water elevation ranges fromapproximately 13 feet mean sea level (MSL) at the northend of the plume to less than 3 feet MSL near the
southern end. Ground water flows to the south. Theplume velocity ranges from about 150 feet per year inthe northern portion of the study area to over 200 feetper year beneath the southern area. The consortiumbelieves that the aquifer contains aerobic and anaerobicmicrozones. This simple sand aquifer exhibits complexmetabolic activity that might not be apparent from acursory examination of geochemical information.
This paper focuses on the lower third of the aquifer,which has the highest permeability and contains themajority of the contaminants.
Current Findings
Intrinsic remediation is clearly occurring in the groundwater, and results suggest that multiple biodegradationpathways are operating. These findings are based on dataon the plume profile, contaminant concentrations and geo-chemical markers, and the presence of the soluble chlo-ride ion produced by biodegradation of the solvents.
Plume Profile
Figure 1 shows the relationship of the constituentswithin the plume. Note that the plumes of the differentsolvent species are “stacked.” There is no chromatographicseparation, as would be expected based on the muchdifferent mobilities of these compounds in ground water.This suggests that the more mobile compounds, suchas VC, are degrading before they can move away fromthe less mobile ones.
Figure 1. Plume configuration in the deep zone at Dover AFB.
96

Contaminants and Geochemical Markers
TCE
TCE concentrations in the ground water range up to20 milligrams per liter (mg/L.) The TCE concentrationdeclines rapidly near Highway 113. TCE is degradedbefore reaching the St. Jones River to the south of theplume.
DCE
DCE concentrations are over 10 mg/L in two areas. TheDCE is primarily cis-1,2-DCE, the isomer produced bybiodegradation of TCE. Chemically manufactured DCEcan be distinguished from biogenic DCE becausechemically manufactured DCE contains a mixture ofisomers, of which cis-DCE is a minor component. TheDCE plume overlaps the TCE plume. DCE concentra-tions also decline rapidly south of Highway 113.
VC
There is a smaller VC plume with concentrations up to1 mg/L. Since VC was never used on the base, theconsortium believes that it is present as a biodegrada-tion product of DCE. If DCE were being lost primarily byreduction to VC, we should be able to detect low, transientconcentrations of VC throughout the area containing
DCE, regardless of the relative degradation rates of thetwo compounds. The area containing VC, however, isconsiderably smaller than the DCE plume.
Ethylene
Ethylene is also present, showing that complete reduc-tive dehalogenation of TCE does occur in the deepzone. The amount of ethylene is small, however: 50micrograms per liter (µg/L) or less. This is much too lowto account for the observed losses of TCE and DCE.
Soluble Chloride Ion
The best evidence that chlorinated solvents are beingdestroyed is the simultaneous increase in soluble chlo-ride ions and decrease in solvent concentrations. Thisis clearly observable at Dover AFB, as shown in Figures2 and 3. While the total chlorocarbon concentrationsdecrease from 15 to around 1 mg/L in the area ofHighway 113 (Figure 2), the dissolved chloride concen-tration increases to over 40 mg/L. Background chloridelevels are approximately 10 mg/L. The dissolved chlo-ride (Figure 3) increases in the deep zone of the aquiferbut not the shallow zone. This eliminates other, extrane-ous chloride sources such as road salt. This evidenceclearly supports the hypothesis that solvents are beingdestroyed by an intrinsic process.
Figure 2. Total chlorinated compounds (mg/L) in the deep zone at Dover AFB.
97

Biodegradation Mechanisms
Processes other than reductive dehalogenation accountfor the majority of the degradation of DCE because oflow levels of VC and ethylene. The consortium hasextensively measured the geochemistry of the groundwater to understand this environment. Clues to themechanisms are found in dissolved oxygen levels,methane data, the redox state of the aquifer, and labo-ratory studies.
In the vicinity of the plume, the dissolved oxygen con-centration is depleted to below 1 mg/L in the groundwater. Dissolved oxygen begins increasing in the vicinityof Highway 113. Outside the contaminated zone, dis-solved oxygen is greater than 4 mg/L.
The methane data show a pattern generally the inverseof the dissolved oxygen data. Methane concentrationsranging from 20 to greater than 500 µg/L are foundwithin the contaminated zone, while no methane is ob-served outside of the plume. This indicates thatmethanogenesis appears to be an important microbialprocess in the anaerobic portion of the aquifer. Theoccurrence of both methane and oxygen south of High-way 113 suggests that cooxidation is likely occurring atDover AFB.
The redox state of the deep zone at Dover AFB isrelatively high. In most of the plume, the bulk phaseredox is above 200 millivolts. All redox potentials areabove 50 millivolts. Sharma and McCarty (1) showed
that bacterial reductive dehalogenation of PCE and TCEto DCE can occur in relatively oxidizing conditions, re-quiring only the absence of oxygen or nitrate, similar toconditions at Dover AFB. Reductive dehalogenation ofDCE to VC or ethylene, however, appears to requiresulfate-reducing or methanogenic conditions (2, 3), proc-esses that occur at redox levels below -200 millivolts.These low oxidation states are probably found in mi-croenvironments but do not dominate the aquifer. Fi-nally, ongoing RTDF microcosm studies of Dover AFBsamples are showing clear production of 14CO2 from14C-labeled DCE under oxygenated conditions. There-fore, the consortium believes that at Dover AFB TCE istransformed to DCE by reductive dehalogenation and thatDCE is then biodegraded by a combination of directoxidation and cooxidation, with a minor component ofreductive dehalogenation to VC and ethylene.
Biodegradation Rates
Table 1 gives estimated half-lives and goodness of fitvalues (r2) at Dover AFB as calculated by two different
Figure 3. Dissolved chloride in the deep zone at Dover AFB.
Table 1. Half-Life Calculations for Dover AFB
Method PCE → TCE TCE → DCE DCE → VC VC → ETH
Buscheck 2.4 2.8 1.4 2.2
r2 0.99 0.94 0.94 0.93
Graphicalextraction
2.80 4.19 2.81 1.84
98
methods. The method developed by Buscheck et al. (4)gives the values shown in the first row of the table. Thevalues in the second row were calculated by a simplegraphical extrapolation method. The values in both rowsare fairly consistent, all on the order of 1 to 2 years.These rate constants are consistent with other chlorin-ated solvent rate constants determined to date. Thisconsistency suggests that a similar set of degradationmechanisms operates at other sites as well.
If the plume is assumed to be in a steady state, isocon-centration maps can be used to calculate that about250 pounds of chlorinated solvents are being biode-graded each year. This is equivalent to destroying 25gallons of dense nonaqueous-phase liquid every year.
Conclusion
The RTDF project at Dover AFB is in the second of 4years. The evidence clearly demonstrates that activeintrinsic remediation of chlorinated solvents is occurring.The key evidence supporting this conclusion is:
• The contaminant plumes are “stacked,” indicatingthat the more mobile contaminants are being de-stroyed before they can move away from the lessmobile contaminants.
• The chloride ion concentration in solution increasesas the solvent concentration declines. The increaseis large enough to account for the entire observedloss of solvents.
• There is clear field evidence of reductive dehalo-genation and oxidation, and possible evidence for co-oxi-dation.
References
1. Sharma, P.K., and P.L. McCarty, 1996. Isolation and charac-terization of a facultative bacterium that reductively dechlorinatestetrachloroethene to cis-1,2 dichloroethene. Appl. Environ. Micro-biol. 62(3):761-765.
2. Kastner, M. 1991. Reductive dechlorination of tri- and tetrachlo-roethylenes depends on transition from aerobic to anaerobic con-ditions. Appl. Environ. Microbiol. 57(7):2039-2046.
3. Holliger, C., and G. Schraa. 1994. Physiological meaning andpotential for application of reductive dechlorination by anaerobicbacteria. FEMS Microbiology Reviews 15:297-305.
4. Buscheck, T.E., K.T. OReilly, S.N. Nelson. 1993. Evaluation ofintrinsic bioremediation at field sites. Proceedings of the confer-ence Petroleum Hydrocarbons and Organic Chemicals in GroundWater: Prevention, Detection and Restoration, Houston, TX, pp. 367-381.
99
Case Study: Wurtsmith Air Force Base, Michigan
Michael J. BarcelonaUniversity of Michigan, The National Center for Integrated Bioremediation Research andDevelopment, Department of Civil and Environmental Engineering, Ann Arbor, Michigan
Introduction
Wurtsmith Air Force Base (WAFB) in Oscoda, Michigan,was decommissioned in June of 1993. Shortly thereaf-ter, the U.S. Environmental Protection Agency (EPA),the Strategic Environmental Research and Develop-ment Program (SERDP) of the Department of Defense(DoD), the University of Michigan, and the MichiganDepartment of Environmental Quality contributed re-sources to develop the National Center for IntegratedBioremediation Research and Development (NCIBRD).NCIBRD is a DoD National Environmental TechnologyTest Site (NETTS) whose mission is to provide a well-defined and controlled research and development plat-form for the evaluation of in situ site characterization andremediation technologies. The emphasis is on bioreme-diation techniques applied to subsurface and sedimentcontamination problems. In situ biological technologieswith the potential to remediate unsaturated- and saturated-zone fuel and organochlorine solvent contamination insubsurface and sediment systems are of particular inter-est. NCIBRD focused its early activities on the de-velopment of an expanded database of contaminant,hydrogeologic, and geochemical conditions at severalcontamination sites. Spatial and temporal variability inthese conditions makes evaluating the progress of intrinsicbioremediation technology applications difficult.
Physical Setting
WAFB is located in Iosco County in northeast Michigan,in the coastal zone of Lake Huron north of Oscoda.Oscoda is accessible by rail, highway, and commercialair routes north of Saginaw-Bay City, Michigan. WAFBis under the authority of the Oscoda-Wurtsmith AirportAuthority and the Wurtsmith Area Economic Develop-ment Commission. The U.S. Air Force Base ConversionAuthority (BCA) is charged with remediating contami-nated sites to enable the transition of site facilities tocivilian use. At present, 10 private or public concernshave leased sites on the base for operations, including
an aircraft maintenance facility, a plastics manufacturer,engineering firms, and educational institutions. Thebase occupies 7 square miles bounded by the AuSableRiver/AuSable River wetlands complex to the south,Lake Van Etten to the east, and bluffs fronting a 5-mile-wide plain extending onto the base to the west. LakeHuron receives the discharge from the associatedground-water flow system and the Au Sable River ap-proximately 0.5 mile south of the base boundary. Thealtitude of the land surface ranges from 580 to 750 feetabove mean sea level. Figure 1 shows the base detail,with an emphasis on Installation Restoration Program(IRP) sites.
Mean monthly temperatures range from 21°F (-6°C) inJanuary to 68°F (20°C) in July. The lowest recordedtemperature was -22°F (-30°C), the highest 102°F(39°C). Average annual precipitation is 30 inches (76centimeters), and average snowfall is 44 inches (112centimeters). Surficial geologic materials are of quater-nary glaciofluvial and aeolian origins, made up largelyof medium to fine sands and coarse sand and graveldeposits to depths of 60 to 90 feet (18 to 27 meters).Below the glacial deposits, a confining lacustrine claylayer (125 to 250 feet thick) separates the upper aquiferground water from lower, more saline waters in bedrockunits. In the eastern regions of the area, intermittentsand, sand/gravel, and clay layers of 1 to 3 feet (lessthan 0.3 to approximately 1 meter) thickness have beenobserved in the saturated zone. These features are sitespecific. Depths to ground water in the upper aquiferrange from less than 10 to approximately 30 feet (lessthan 3 to 9 meters) in areas remote from pumping.Average ground-water recharge rates range from 8 to18 inches per year (20 to 46 centimeters per year). Theaquifer solids are greater than 85 percent quartz miner-als, with organic carbon and inorganic carbon contentsbelow 0.1 and approximately 6.0 percent, respectively.
Hydraulic conductivities at the base range from 75 to310 feet per day (23 to 95 meters per day), with a weighted
100
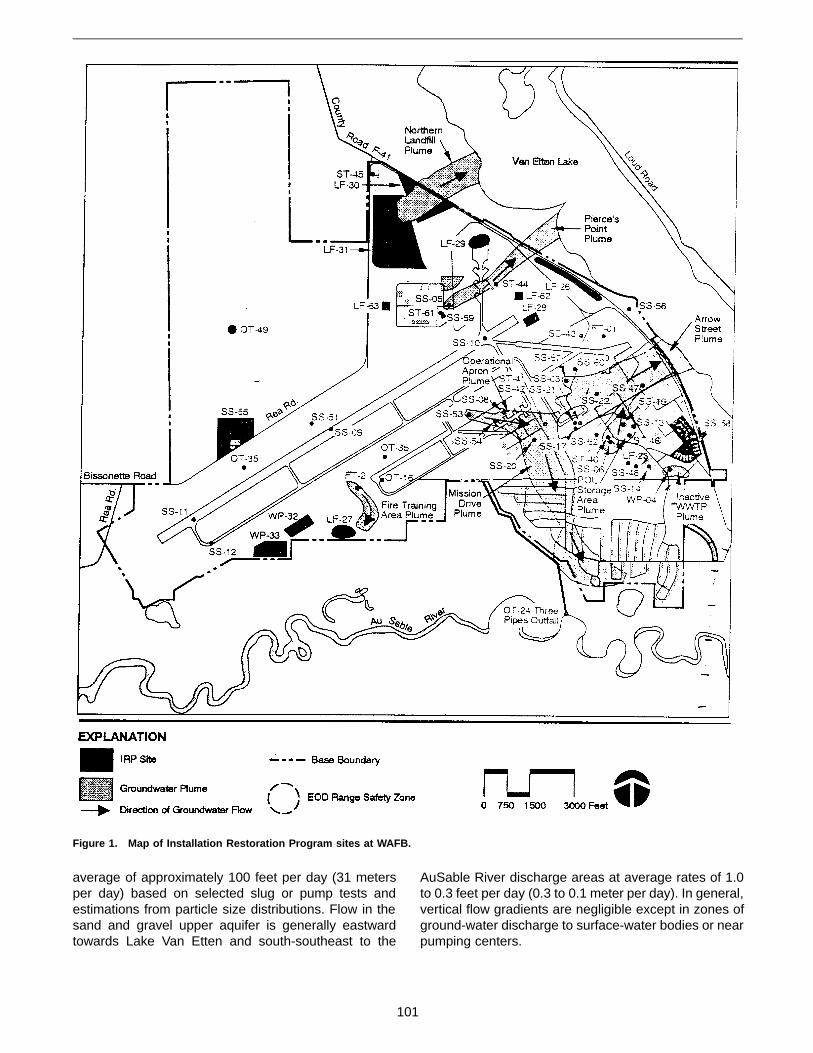
average of approximately 100 feet per day (31 metersper day) based on selected slug or pump tests andestimations from particle size distributions. Flow in thesand and gravel upper aquifer is generally eastwardtowards Lake Van Etten and south-southeast to the
AuSable River discharge areas at average rates of 1.0to 0.3 feet per day (0.3 to 0.1 meter per day). In general,vertical flow gradients are negligible except in zones ofground-water discharge to surface-water bodies or nearpumping centers.
Figure 1. Map of Installation Restoration Program sites at WAFB.
101

Contaminant Profile
Contaminant investigations at the base began in the late1970s. The Air Force and the U.S. Geological Surveyhad been involved in formal studies since 1979. Morethan 50 known and potential contamination sites havebeen identified at the base through their efforts andthose of other contractors. Principal contaminants ofconcern at the base include components of petroleumhydrocarbon fuels, oils, and lubricants (POLs); organo-chlorine solvents (e.g., trichloroethylene [TCE], dichlo-roethylene [DCE]); fire-fighting compounds; combustionproducts (e.g., naphthalene and phenanthrene); andchlorinated aromatic compounds (e.g., dichloroben-zenes). Soil, aquifer solids, sediments, and groundwater are the major environmental media involved. Ofthe 58 high-priority sites at the base, 13 include chlorin-ated solvents or partial microbial degradation productsas primary contaminants. Twelve of these 13 sites iden-tify perchloroethylene (PCE) and TCE as primary con-taminants in soil, aquifer solids, and ground water, andshow evidence of reductive dechlorination processes(i.e., the presence of cis-1,2-DCE, vinyl chloride mono-mer). These sites have abundant levels of nonchlori-nated organic matter and exhibit reduction to suboxicredox conditions, as evidenced by the results from FireTraining Area 2. The only major site at which sparseevidence for microbial dechlorination of TCE exists isthe Pierces Point Plume, where oxic to transitional redoxconditions exist in the dissolved plume. The extent ofcontamination of aquifer materials remains unknown.
Facilities
EPA (Region 5), Michigan Department of Natural Re-sources, and the BCA actively cooperate in the ongoingIRP activities as well as the efforts of NCIBRD. Cur-rently, NCIBRD occupies seven buildings on the base inaddition to 10,000 square feet of office and laboratoryspace in Ann Arbor. Facilities for offices, laboratories,storage, field operation, staging, and decontaminationhave been developed to support activities at three sitesof intensive investigations. Mobile laboratory and drillingvehicles provide additional support for year-round in-field sampling and analysis assisted by experiencedfield and laboratory staff. A basewide ground-water flowmodel has been developed and refined by estimates ofhydraulic conductivity and mass water level measure-ments at more than 500 wells. Site-wide water balanceand refined ground-water transport models exist forsites of current or future technology demonstration ac-tivity as well as for a controlled in situ injection experi-mental facility. This facility, the Michigan IntegratedRemediation Technology Laboratory (MIRTL), will be thesite of a natural gradient reactive tracer test in thesummer of 1996 for aerobic fuel bioremediation. MIRTLwill eventually consist of instrumented parallel test lanes
for both natural and induced gradient in situ testing ofcleanup technologies.
Case Study
Fire Training Area 2, in the southwest portion of thebase, has been the site of the most intensive monitoringattention in the past decade at the base. Forty years offire training exercises using waste solvents and fuelshave resulted in soil and subsurface contamination withhydrocarbons, chlorinated alkenes, aromatics, and poly-cylic aromatics. Early detective monitoring results werecollected by the U.S. Geological Survey from a networkof shallow and deep wells developed in 1987 (1). Focus-ing on the dissolved volatile organic compounds (i.e.,aromatics and chlorinated alkenes), the plume was de-lineated to be approximately 200 to 300 feet (30 to 90meters) wide, approximately 1,800 to 2,000 feet (550 to610 meters) long, and approximately 6 to 25 feet (2 to8 meters) thick. Concentrations of benzene, toluene,ethylbenzene, and xylene compounds ranged fromgreater than 2,000 to less than 10 micrograms per liter.In both cases, the contaminant concentrations werehighest near the pad at the site (Figure 2). Although notthe source, the pad was certainly the locus of recent firetraining activity. Figure 2 shows the rough outline of themajor chlorinated alkene (i.e., principally cis-1,2-dichlo-roethylene, trichloroethylene, and perchloroethylene)plume, which was restricted to the upper 6 feet (approxi-mately 2 meters) of this water table aquifer in 1993.Here, the cis-1,2-DCE metabolite of PCE and TCE wasthe major constituent, accounting for over 90 percent ofthe dissolved contaminants.
In 1994, quarterly contaminant and geochemical moni-toring in the ground water was undertaken as the initialpart of a demonstration of intrinsic bioremediation.Quarterly monitoring results since that time have dis-closed variable dissolved concentrations of the chlorin-ated parent compounds as well as the DCE majormetabolite. It should be noted that vinyl chloride hasbeen detected only once in mid-field shallow wells. Fig-ure 3 shows representative dissolved concentrationvariability of TCE and DCE in the major portion of theplume from available data over the past 9 years. Far-field wells have generally shown diminished concentra-tions of DCE, while near-field (i.e., near-pad) wells haveshown some increase, particularly in the last year. Themajor plume dimensions evidenced in 1993 (Figure 2)have remained stable, and iron- and sulfate-reducing ormethanogenic conditions prevail in its interior.1
The question arises in this case whether significant massremoval has occurred during the course of the investi-gation. Based on dissolved concentrations, distribution
1 Chapelle, F.H., S.K. Haack, P. Adriaens, M.A. Henry, and P.M.Bradley. 1996. Comparison of Eh and H2 measurements for delineat-ing redox processes in a contaminated aquifer. In preparation.
102

variability and roughly ±20 percent precision of samplingand analysis would have to conclude that no significantreduction in dissolved mass has occurred in the mainbody of the plume.
To approach the net loss of chlorinated alkene com-pound mass from the plume, 13 borings were made in1994 along the axis of the plume coincident with domi-nant ground-water flow direction. A total of 300 coresubsamples were taken by Geoprobe techniques col-lecting field-preserved samples subsequently analyzedfor major contaminants by static headspace techniques(2). Companion cores were collected adjacent to theselocations for determination of oily phase, porosity, andwater contents by the methods of Hess et al. (3).
Table 1 contains the average results of these determi-nations at the near- and mid-field locations of the moni-toring wells. It should be noted that, in contrast to thewater samples, which were contaminated by reductivedechlorination metabolites, the solid-associated chlorin-ated hydrocarbon distributions were dominated by par-ent compounds, principally PCE and TCE. It is clear
Figure 2. Plan view of Fire Training Area 2 showing dimensions of major chlorinated VOC plume in ground water in 1993.
Table 1. Comparison of Average Dissolved and AquiferSolid-Associated Masses of Total VolatileChlorinated Compounds in the Fire TrainingArea 2 Plume (masses expressed in milligrams per liter aquifer material) a
Location in MajorPlume
GroundWater(mg/L)
Aquifer Solids(mg/L)
% of TotalAssociated
WithSolids
Volume% ofOily
Phaseb
Near field(Approximately 200 feetdowngradient from Pad Boring 6;Well 4S)
0.08 10.5 99% 2.9
Mid-field(Approximately 450 feetdowngradient fromPad Boring 12;Wells 8S and 8M)
0.003 6.3 99% 0.006
a One liter of aquifer material was assumed to contain approximately1.75 kilograms of aquifer solids and 300 milliliters of ground waterin average unit volume in major plume.
b Oily phase determined on field preserved (dry ice freezing) of coresB-10 and B-12 respectively by the method of Hess et al. (3).
103
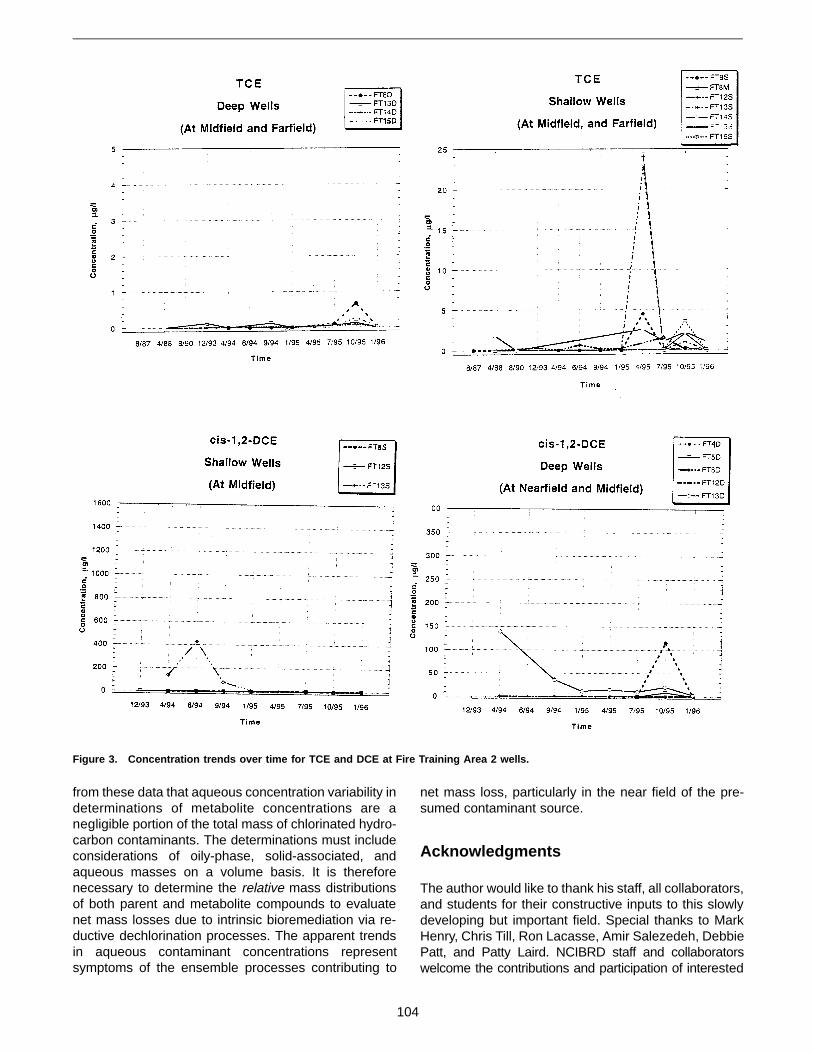
from these data that aqueous concentration variability indeterminations of metabolite concentrations are anegligible portion of the total mass of chlorinated hydro-carbon contaminants. The determinations must includeconsiderations of oily-phase, solid-associated, andaqueous masses on a volume basis. It is thereforenecessary to determine the relative mass distributionsof both parent and metabolite compounds to evaluatenet mass losses due to intrinsic bioremediation via re-ductive dechlorination processes. The apparent trendsin aqueous contaminant concentrations representsymptoms of the ensemble processes contributing to
net mass loss, particularly in the near field of the pre-sumed contaminant source.
Acknowledgments
The author would like to thank his staff, all collaborators,and students for their constructive inputs to this slowlydeveloping but important field. Special thanks to MarkHenry, Chris Till, Ron Lacasse, Amir Salezedeh, DebbiePatt, and Patty Laird. NCIBRD staff and collaboratorswelcome the contributions and participation of interested
Figure 3. Concentration trends over time for TCE and DCE at Fire Training Area 2 wells.
104
groups in future investigations of promising site charac-terization and bioremediation cleanup technologies.
References
1. U.S. Geological Survey. 1993. Data submission via memo to U.S.Air Force Base Conversion Agency, Wurtsmith Air Force Base,U.S. Geological Survey Lansing Regional Office, Michigan.
2. Barcelona, M.J. 1995. Verification of active and passive ground-water contamination remediation efforts. In: Gambolati, G. and G.Verri, eds. Advanced methods for ground water pollution central.International Center for Mechanical Sciences, University of Udine,University of Padua, May 5-6, 1994, Udine, Italy. Courses andSeries No. 364. Wien/New York: Springer-Verlag. pp. 161-175.
3. Hess, K.M., W.N. Herkelrath, and H.I. Essaid. 1992. Determinationof subsurface fluid contents at a crude-oil spill site. J. Contam.Hydrol. 10:75-96.
105

Case Study: Eielson Air Force Base, Alaska
R. Ryan Dupont, K. Gorder, D.L. Sorensen, and M.W. KemblowskiUtah Water Research Laboratory, Utah State University, Logan, Utah
Patrick HaasU.S. Air Force Center for Environmental Excellence, Brooks Air Force Base, Texas
Introduction
One innovative plume management approach that hasbeen the subject of a great deal of recent interest is thatof intrinsic remediation or natural attenuation, the proc-ess of site assessment and data reduction and interpre-tation that focuses on the quantification of the capacityof a given aquifer system to assimilate ground-watercontaminants through physical, chemical, and/or bio-logical means. The intrinsic remediation approach isappropriate for a given site if the plume has not affecteda downgradient receptor and if the rate of contaminantrelease from the source area is equal to or less than thecontaminant degradation rate observed at the site.
While many field sampling protocols are available froma variety of sources describing approaches for collectingand analyzing data necessary to verify that intrinsicremediation processes are taking place at a given site,the connection between these data and decisions re-garding source removal activities or estimates of sourcelifetime has not generally been presented in the litera-ture. An approach for implementing intrinsic remediationconcepts from data collection through source removaland source lifetime considerations has been developedfor the U.S. Environmental Protection Agency and theU.S. Air Force (1-3), and these concepts and proceduresare presented in this paper through a case study at amixed solvent/hydrocarbon contaminated site (Site45/57) at Eielson Air Force Base (AFB), Alaska.
Intrinsic Remediation Protocol
The intrinsic remediation assessment carried out at thefield site at Eielson AFB involved the seven-step proc-ess outlined in Figure 1. This process provides a logicalapproach to evaluating the feasibility and appropriate-ness of implementing intrinsic remediation at a givensite and includes: 1) determining whether steady-state
plume conditions exist; 2) estimating contaminant deg-radation rates; 3) estimating the source mass; 4) esti-mating the source lifetime; 5) predicting long-term plumebehavior with and without source removal; 6) makingdecisions regarding the use of intrinsic remediation andthe impact and desirability of source removal at a givensite; and 7) developing a long-term monitoring strategyif intrinsic remediation is selected for plume manage-ment. Elements of this methodology will be highlightedthrough the following case study.
Site Description
Eielson AFB is located in the Tanana River Valley inCentral Alaska, approximately 200 kilometers south ofthe Arctic Circle. Most of the base is constructed on fillmaterial underlain by an unconfined aquifer consistingof 60 to 90 meters of alluvial sands and gravels over-lying a low-permeability bedrock formation (4). The aquifer
Figure 1. Components of the intrinsic remediation assessmentapproach.
106
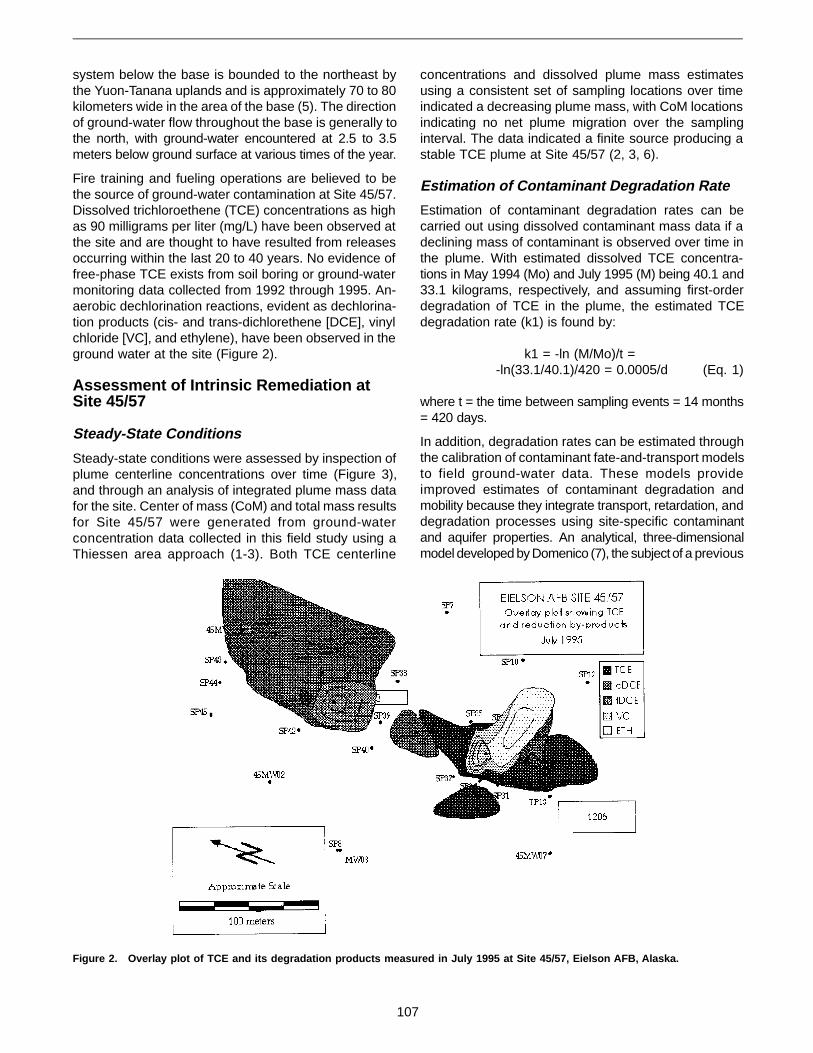
system below the base is bounded to the northeast bythe Yuon-Tanana uplands and is approximately 70 to 80kilometers wide in the area of the base (5). The directionof ground-water flow throughout the base is generally tothe north, with ground-water encountered at 2.5 to 3.5meters below ground surface at various times of the year.
Fire training and fueling operations are believed to bethe source of ground-water contamination at Site 45/57.Dissolved trichloroethene (TCE) concentrations as highas 90 milligrams per liter (mg/L) have been observed atthe site and are thought to have resulted from releasesoccurring within the last 20 to 40 years. No evidence offree-phase TCE exists from soil boring or ground-watermonitoring data collected from 1992 through 1995. An-aerobic dechlorination reactions, evident as dechlorina-tion products (cis- and trans-dichlorethene [DCE], vinylchloride [VC], and ethylene), have been observed in theground water at the site (Figure 2).
Assessment of Intrinsic Remediation atSite 45/57
Steady-State Conditions
Steady-state conditions were assessed by inspection ofplume centerline concentrations over time (Figure 3),and through an analysis of integrated plume mass datafor the site. Center of mass (CoM) and total mass resultsfor Site 45/57 were generated from ground-waterconcentration data collected in this field study using aThiessen area approach (1-3). Both TCE centerline
concentrations and dissolved plume mass estimatesusing a consistent set of sampling locations over timeindicated a decreasing plume mass, with CoM locationsindicating no net plume migration over the samplinginterval. The data indicated a finite source producing astable TCE plume at Site 45/57 (2, 3, 6).
Estimation of Contaminant Degradation Rate
Estimation of contaminant degradation rates can becarried out using dissolved contaminant mass data if adeclining mass of contaminant is observed over time inthe plume. With estimated dissolved TCE concentra-tions in May 1994 (Mo) and July 1995 (M) being 40.1 and33.1 kilograms, respectively, and assuming first-orderdegradation of TCE in the plume, the estimated TCEdegradation rate (k1) is found by:
k1 = -ln (M/Mo)/t = -ln(33.1/40.1)/420 = 0.0005/d (Eq. 1)
where t = the time between sampling events = 14 months= 420 days.
In addition, degradation rates can be estimated throughthe calibration of contaminant fate-and-transport modelsto field ground-water data. These models provideimproved estimates of contaminant degradation andmobility because they integrate transport, retardation, anddegradation processes using site-specific contaminantand aquifer properties. An analytical, three-dimensionalmodel developed by Domenico (7), the subject of a previous
Figure 2. Overlay plot of TCE and its degradation products measured in July 1995 at Site 45/57, Eielson AFB, Alaska.
107
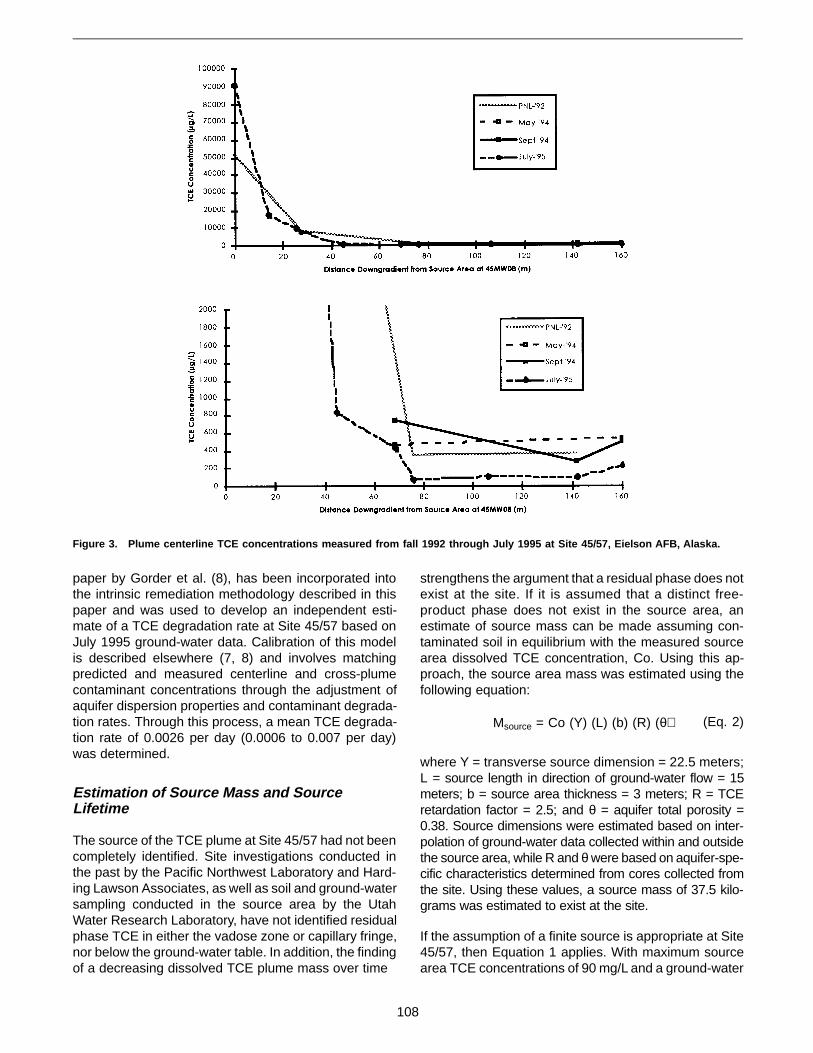
paper by Gorder et al. (8), has been incorporated intothe intrinsic remediation methodology described in thispaper and was used to develop an independent esti-mate of a TCE degradation rate at Site 45/57 based onJuly 1995 ground-water data. Calibration of this modelis described elsewhere (7, 8) and involves matchingpredicted and measured centerline and cross-plumecontaminant concentrations through the adjustment ofaquifer dispersion properties and contaminant degrada-tion rates. Through this process, a mean TCE degrada-tion rate of 0.0026 per day (0.0006 to 0.007 per day)was determined.
Estimation of Source Mass and SourceLifetime
The source of the TCE plume at Site 45/57 had not beencompletely identified. Site investigations conducted inthe past by the Pacific Northwest Laboratory and Hard-ing Lawson Associates, as well as soil and ground-watersampling conducted in the source area by the UtahWater Research Laboratory, have not identified residualphase TCE in either the vadose zone or capillary fringe,nor below the ground-water table. In addition, the findingof a decreasing dissolved TCE plume mass over time
strengthens the argument that a residual phase does notexist at the site. If it is assumed that a distinct free-product phase does not exist in the source area, anestimate of source mass can be made assuming con-taminated soil in equilibrium with the measured sourcearea dissolved TCE concentration, Co. Using this ap-proach, the source area mass was estimated using thefollowing equation:
Msource = Co (Y) (L) (b) (R) (θ) (Eq. 2)
where Y = transverse source dimension = 22.5 meters;L = source length in direction of ground-water flow = 15meters; b = source area thickness = 3 meters; R = TCEretardation factor = 2.5; and θ = aquifer total porosity =0.38. Source dimensions were estimated based on inter-polation of ground-water data collected within and outsidethe source area, while R and θ were based on aquifer-spe-cific characteristics determined from cores collected fromthe site. Using these values, a source mass of 37.5 kilo-grams was estimated to exist at the site.
If the assumption of a finite source is appropriate at Site45/57, then Equation 1 applies. With maximum sourcearea TCE concentrations of 90 mg/L and a ground-water
Figure 3. Plume centerline TCE concentrations measured from fall 1992 through July 1995 at Site 45/57, Eielson AFB, Alaska.
108

impact concentration (maximum contaminant level [MCL])of 5 micrograms per liter (µg/L) established for TCE, anestimated source lifetime for TCE at this site is:
Source lifetime = ln(5/90,000)/k1 = ln(5.6 x 10⁻⁵)/(-0.0026) = 10.3 years (Eq. 3)
A worst-case scenario can be formulated for contamina-tion at Site 45/57 using an assumption that a small massof residual phase material, which has been undetectedin site investigation activities, exists within the sourcearea. The dimensions of this residual-phase source areaare defined by the sampling grid within which it mustexist, making its aerial extent no more than 15 by 5meters (Ys by Ls). The residual phase volume, Sr, con-tained within the sandy aquifer at Site 45/57 is approxi-mated to be 25 percent of the pore volume (9), or 9.5percent of the source area volume. Based on a meas-ured source area TCE concentration of 90 mg/L and aTCE solubility of 1,377 mg/L, the mole fraction of TCEin residual-phase material is estimated from Raoult’slaw to be 90/1,377 = 0.065, making the estimated con-centration of TCE in the residual phase, CTCE:
(MassTCE)/(MassResidual Phase) = 0.065 (MWTCE/MWResidual Phase) =
0.065 (131.4/120) = 0.071
Based on these calculations, the estimated mass of TCEthat could exist at Site 45/57 in an unidentified residualphase is:
MassTCE Residual = Ys (Ls) (b) (θ) (Sr) (ρResidual Phase) (CTCE) (Eq. 4)
MassTCE Residual = (15 m) (5 m) (3 m) (0.38) (0.25) (1,200 kg/m3) (0.071)
= 1,677 kg
With this estimate of residual-phase source mass, thelifetime of the source can be predicted based on the massflux of TCE out of this source area, as indicated below:
Mass flux = Ys (b) (v) (θ) (Co) = (15 m) (3 m) (0.1 m/d) (0.38) (0.09 kg/m3) =
0.15 kg/d (Eq. 5)
where v = ground-water velocity. With this mass fluxvalue, an estimate can be made for the source lifetimeassuming a residual-phase TCE mass of 1,677 kilo-grams exists at the site:
Source lifetime = MassTCE Residual/Mass flux =
(1,677 kg)/(0.15 kg/d) = 10,897 d = 29.9 yy (Eq. 6)
As this example illustrates, if residual mass does exist,the lifetime of the plume is extended significantly, in-creasing the overall cost of plume management at thesite. More information regarding residual-phase distribu-tion at the site is needed to narrow the range of sourcelifetime predictions.
Prediction of Long-Term Plume Behavior
Consideration of long-term plume behavior involves anevaluation of the plume footprint over time with andwithout source removal implemented at a given site.Following source depletion or removal, the dissolvedplume will begin to contract as the assimilation of con-taminants in the aquifer exceeds their release rate fromthe source area. The impact of source removal can bemodeled by superimposing a plume with a negativesource concentration, initiated at the time of sourceremoval or depletion, on top of the existing contaminantplume (7). This allows the prediction of the time requiredfor the entire dissolved plume to degrade below a levelof regulatory concern. Based on this information, a deci-sion can be made regarding the expected benefit fromsource removal in terms of reducing the time required formanagement of the site to ensure long-term risk reduction.
If it is assumed that no free-phase product exists withinthe source area of Site 45/57, then the projected sourcelifetime is relatively short: approximately 10 years. Witha residual phase existing at the site, the projectedsource lifetime is increased to approximately 30 years.Using the field-data-calibrated Domenico model (6, 7),a rapidly shrinking plume is predicted to be assimi-lated to below MCL values within 8 years following100 percent source removal, as shown in Figure 4.While removal of the source reduces the projected life-time of contamination at the site by a factor of two to five,the cost of such a removal action is high, it is highlydisruptive of current site uses, and the efficiency ofcontaminant removal is uncertain. The recommendationmade for this site was against an active source removaleffort because of the marginal and high-cost benefitexpected from such an action.
Long-Term Monitoring Plan for the Site
With implementation of intrinsic remediation recom-mended at Site 45/57, a long-term monitoring networkis required. To have this network serve multiple purposes,a combination of upgradient, downgradient, and within-plume monitoring locations is desirable.
Two sets of wells would be installed at Site 45/57 as partof the long-term monitoring strategy for the intrinsicremediation plume management approach. The first set,the long-term monitoring wells, consists of a transect ofplume centerline wells composed of a proposed welllocated upgradient of the TCE source area at monitoringpoint SP16, three existing wells (45MW01, 45MW03,
109
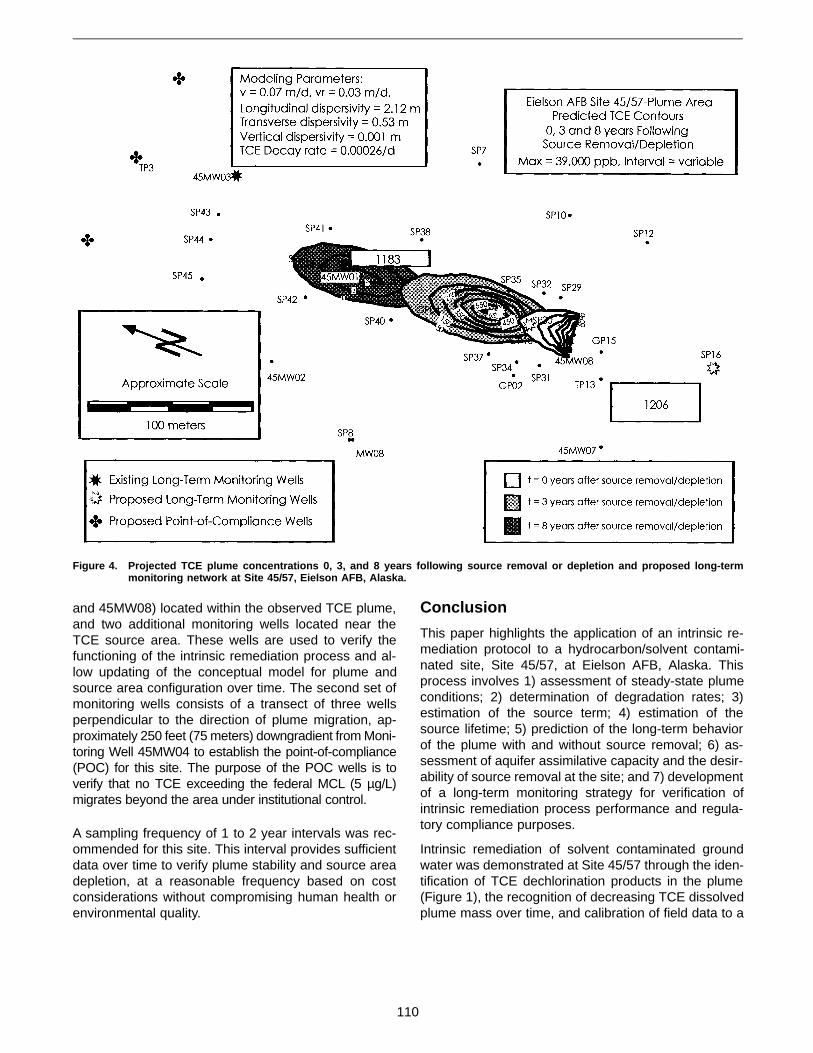
and 45MW08) located within the observed TCE plume,and two additional monitoring wells located near theTCE source area. These wells are used to verify thefunctioning of the intrinsic remediation process and al-low updating of the conceptual model for plume andsource area configuration over time. The second set ofmonitoring wells consists of a transect of three wellsperpendicular to the direction of plume migration, ap-proximately 250 feet (75 meters) downgradient from Moni-toring Well 45MW04 to establish the point-of-compliance(POC) for this site. The purpose of the POC wells is toverify that no TCE exceeding the federal MCL (5 µg/L)migrates beyond the area under institutional control.
A sampling frequency of 1 to 2 year intervals was rec-ommended for this site. This interval provides sufficientdata over time to verify plume stability and source areadepletion, at a reasonable frequency based on costconsiderations without compromising human health orenvironmental quality.
Conclusion
This paper highlights the application of an intrinsic re-mediation protocol to a hydrocarbon/solvent contami-nated site, Site 45/57, at Eielson AFB, Alaska. Thisprocess involves 1) assessment of steady-state plumeconditions; 2) determination of degradation rates; 3)estimation of the source term; 4) estimation of thesource lifetime; 5) prediction of the long-term behaviorof the plume with and without source removal; 6) as-sessment of aquifer assimilative capacity and the desir-ability of source removal at the site; and 7) developmentof a long-term monitoring strategy for verification ofintrinsic remediation process performance and regula-tory compliance purposes.
Intrinsic remediation of solvent contaminated groundwater was demonstrated at Site 45/57 through the iden-tification of TCE dechlorination products in the plume(Figure 1), the recognition of decreasing TCE dissolvedplume mass over time, and calibration of field data to a
Figure 4. Projected TCE plume concentrations 0, 3, and 8 years following source removal or depletion and proposed long-termmonitoring network at Site 45/57, Eielson AFB, Alaska.
110
fate-and-transport model. No residual-phase productwas identified within the source area based on historicaland recent site investigation activities; however, a worst-case estimate was made of the potential residual TCEmass that might exist within the source area. Sourcelifetime estimates ranged from approximately 10 yearswithout residual-phase TCE to approximately 30 yearswith residual-phase material remaining at the site. Froman analysis of source depletion and plume attenuationrates, it was determined that source removal may reducethe projected site management lifetime from approximately20 to 40 years to less than 10 years. Due to the difficultyand expense of source removal, and to the overall shorttimeframe for complete site remediation by intrinsic proc-esses without source removal, long-term monitoring with-out source removal was recommended and has becomethe basis of the record of decision for this site.
References1. Dupont, R.R., D.L. Sorensen, M. Kemblowski, M. Bertleson, D.
McGinnis, I. Kamil, and Y. Ma. 1996. Monitoring and assessmentof in situ biocontainment of petroleum contaminated ground-waterplumes. Final report submitted to the U.S. Environmental Protec-tion Agency, Analytical Sciences Branch, Characterization Re-search Division, Las Vegas, NV.
2. Dupont, R.R., D.L. Sorensen, M. Kemblowski, K. Gorder, and G.Ashby. 1996. Assessment and quantification of intrinsic remedia-
tion at a chlorinated solvent/hydrocarbon contaminated site,Eielson AFB, Alaska. Paper presented at the Conference on In-trinsic Remediation of Chlorinated Solvents, Salt Lake City, UT.April 2. Battelle Memorial Institute.
3. Dupont, R.R., D.L. Sorensen, M. Kemblowski, K. Gorder, and G.Ashby. 1996. An intrinsic remediation assessment methodologyapplied at two contaminated ground-water sites at Eielson AFB,Alaska. Paper presented at the First International IBC Conferenceon Intrinsic Remediation, IBC, London, UK. March 18-19.
4. U.S. Air Force. 1994. OUs 3, 4, 5 RI Report, Vol. 1. Eielson AFB, AK.
5. CH2M-Hill. 1982. Installation restoration program records search,Eielson Air Force Base, AK.
6. Utah Water Research Laboratory. 1995. Intrinsic remediation en-gineering evaluation/cost analysis for Site 45/57, Eielson AFB,Alaska. Final report. Submitted to the U.S. Air Force Center forEnvironmental Excellence, San Antonio, TX, and Eielson AFB, AK.December.
7. Domenico, P.A. 1987. An analytical model for multidimensionaltransport of decaying contaminant species. J. Hydrol. 91:49-58.
8. Gorder, K., R.R. Dupont, D.L. Sorensen, M.W. Kemblowski, andJ.E. McLean. 1996. Application of a simple ground-water model toassess the potential for intrinsic remediation of contaminatedground-water. Presented to the First IBC International Conferenceon Intrinsic Remediation, London, UK. March 18-19.
9. Parker, J.C., R.J. Lenhard, and T. Kuppusamy. 1987. A parametricmodel for constitutive properties governing multiphase flow in po-rous media. Water Resour. Res. 23:618-624.
111

Considerations and Options for Regulatory Acceptance of Natural Attenuationin Ground Water
Mary Jane NearmanU.S. Environmental Protection Agency, Seattle, Washington
Introduction
When approaching areas of ground-water contamina-tion, both technical and regulatory options must be iden-tified and evaluated to ensure compliance with state andfederal regulatory requirements. A strong technical de-fense presented in the appropriate regulatory frameworkis necessary for the selection of natural attenuation asa component of the remedy. At Eielson Air Force Base(AFB) near Fairbanks, Alaska, this approach was usedto select natural attenuation as a major component ofthe remedy for all areas of ground-water contamination.This paper summarizes the various options evaluatedfor addressing both the technical and regulatory issuesassociated with the selection of natural attenuation forground-water contamination.
Background
Ground-water contamination at Eielson AFB generallyconsists of relatively limited areas of contamination thathave an adverse impact on the beneficial uses of theaquifer but are not currently posing an immediate risk toreceptors. This type of situation is frequently encoun-tered under the Superfund program and poses a difficultdilemma from both technical and regulatory perspec-tives for compliance with the U.S. Environmental Pro-tection Agency’s (EPA’s) Ground Water ProtectionStrategy. This strategy, which is outlined in the preambleto the National Contingency Plan (NCP), includes a goalto return usable ground waters to their beneficial useswithin a timeframe that is reasonable given the particularcircumstances of the site. The preamble to the NCPfurther states that ground-water remediation levelsshould generally be attained throughout the contami-nated plume, or at and beyond the edge of the wastemanagement area when waste is left in place.
To comply with the Ground Water Protection Strategy, itwas necessary to first gain an understanding of thesource of the contamination, its fate and transport, and
the feasibility of contaminant removal. Once it was clearwhat the technical approach should be, the second taskwas to identify the most appropriate regulatory ap-proach to accommodate the proposed technical solu-tion. Options and combinations considered and used toaddress ground-water contamination at Eielson AFB areoutlined below.
Technical Options
The first task in the Superfund process is to gain athorough understanding of the type of contamination,the location and extent of the remaining source in boththe unsaturated and saturated zones, and the antici-pated fate and transport of the contamination. Once thisis accomplished, alternatives for addressing the con-tamination can be evaluated.
In the feasibility study, a range of alternatives are devel-oped and evaluated to determine the appropriate levelof source reduction and/or ground-water treatment. Thealternatives considered at Eielson AFB included:
• No action.
• Limited action, including institutional controls andground-water monitoring.
• Source removal (either in situ or ex situ) in the sub-surface soils and smear zone combined with institu-tional controls and ground-water monitoring.
• Ground-water extraction and physical/chemical treat-ment combined with institutional controls andground-water monitoring.
The limited action alternative differed from the no actionalternative by the inclusion of institutional controls toprevent exposure to contaminated ground water. Thisdefinition comes from the NCP (55 Federal Register[FR] 8711), which states that institutional controls, whilenot actively cleaning up the contamination at the site,
112

can control exposure and, therefore, are considered tobe limited-action alternatives.
The selected remedy could be one of the alternatives ora combination, depending on the degree of active res-toration required. Considerations for remedy selectionwere the amount of contamination remaining in theunsaturated and saturated zones and the availabil-ity of the contamination for removal and treatment.The technical evaluation is largely an issue of abalance between the need for and feasibility of con-taminant removal in the unsaturated and/or saturatedzones and the efficiency of natural attenuation. TheNCP (55 FR 8734) addresses this balance by describingground-water extraction and treatment as generally themost effective method of reducing concentrations ofhighly contaminated ground water. It subsequentlynotes, however, that pump-and-treat systems are lesseffective in further reducing low levels of contaminationto achieve remediation goals and allows for the use ofnatural attenuation to complete cleanup actions insome circumstances. If ground-water extraction andtreatment is not warranted due to the low levels pre-sent, then the attention is directed at any residualsource of contamination.
At Eielson AFB, residual source contamination typicallyfit into two categories. In one category, an equilibriumexisted in which the rate of contaminant migration fromthe source was approximately the same as the rate ofnatural attenuation in the aquifer. In the second cate-gory, the source was continuing to overwhelm the rateof natural attenuation, resulting in an expanding con-taminant plume.
Even in situations in which the system was in equilibriumand the plume was not expanding, source removal wasevaluated to determine whether reduction of contami-nant mass would return the aquifer to its beneficialuses throughout the plume in a significantly greatertimeframe than natural attenuation alone. This evalu-ation was not a trivial task given the difficulties in esti-mating the source term, accurately evaluating thecontaminant fate and transport in the subsurface, andassessing the effectiveness of source removal. In evalu-ations conducted at Eielson AFB, modeling was gener-ally the mechanism chosen to evaluate the benefits ofsource removal. Generally, these modeling efforts usedconservative assumptions for fate-and-transport analy-sis and potentially overly optimistic assumptions forsource removal. In combination, the modeling resultsindicated a significant benefit of source removal. Resultsfrom subsequent pilot studies, however, indicated lowremoval rates for the subsurface contamination, andcontradicted the conclusions of the model. Source re-moval, therefore, was not expected to significantly re-duce risks or remediation timeframes.
Regulatory Options
If, based on the technical evaluation, natural attenuationwas identified as a major component of the selectedremedy, regulatory options were reviewed to deter-mine the most relevant approach for the specific situ-ation. All of the regulatory options considered haveseveral common requirements or considerations, whichare outlined below.
• The contaminant plume must be contained by thecontaminant source leach rate being in equilibriumwith the rate of natural attenuation or by hydrauliccontainment of the leading edge of the aqueousplume.
• Institutional controls must be effective, reliable, andenforceable in preventing exposure to the contami-nated ground water.
• Further contaminant reduction in the subsurface isnot indicated either due to technical impracticabilityor because contamination reduction would not resultin significant risk reduction.
• Ground-water monitoring is necessary to confirm theconceptual site model developed during the investi-gation and to ensure that the remedy remains pro-tective.
• Statutory 5-year reviews are required whenever theselected remedy will leave contamination on siteabove levels that allow for unlimited use and unre-stricted exposure (NCP §300.430(f)(4)(ii)).
At Eielson AFB, the regulatory options considered aredescribed below.
Alternate Concentration Limits
Alternate concentration limits (ACLs, 55 FR 8732) areconsidered when the ground water has a known orprojected point of entry to surface water with no statisti-cally significant increases in contaminant concentrationin the surface water. Natural attenuation is the mecha-nism for cleanup in ground water between the contami-nation and the point of surface-water discharge. If ACLsare used, the remedial action must include enforceablemeasures (e.g., institutional controls) that will precludehuman exposure to the contaminated ground water.ACLs should only be used when active restoration of theground water is not practicable (55 FR 8754).
For Eielson AFB, ACLs were not applicable becausecontaminated ground water did not discharge into sur-face water on base.
Alternate Points of Compliance
As stated previously, remediation levels should gener-ally be attained throughout the contaminated plume, orat and beyond the edge of the waste management area.
113

For situations in which the risk of exposure is very slight(i.e., because of remoteness of the site), however, alter-nate points of compliance may be considered in combi-nation with natural attenuation provided contaminationin the aquifer is controlled from further migration (55 FR8735). When releases from several distinct sources inclose geographical proximity cause a plume, the mosteffective cleanup strategy may address the problem asa whole, with the point of compliance encompassing thesources of release (55 FR 8753).
For Eielson AFB, an alternate point of compliance wasestablished for a previously used base landfill. Consis-tent with expectations outlined in the Ground WaterProtection Strategy, an alternate point of compliancewas established at the edge of the waste managementarea (i.e., the landfill boundary).
Technical Impracticability Waiver
The Superfund regulations allow Applicable or Relevantand Appropriate Standards, Limitations, Criteria, andRequirements (ARARs) to be waived under certain cir-cumstances if the remedy can be demonstrated to beprotective. One of the six ARAR waivers provided by theComprehensive Environmental Response, Compensa-tion, and Liability Act (CERCLA §121(d)(4)) is technicalimpracticability (TI). The use of the TI waiver requires ademonstration that compliance with ARARs, includingmaximum contaminant levels (MCLs) or non-zero maxi-mum contaminant level goals (MCLGs), is technicallyimpracticable from an engineering perspective. A dem-onstration that ground-water restoration is technicallyimpracticable generally should be accompanied by ademonstration that contaminant sources have been orwill be identified and removed or treated to the extentpracticable.
In the event that the requirements outlined above aredemonstrated and a TI waiver is invoked, an alternativeremedial strategy must be established that includes 1)exposure control using enforceable, reliable institutionalcontrols such as deed notifications and restrictions onwater supply well construction and use; 2) source con-trol through treatment or containment where feasibleand where significant risk reduction will result; and 3)aqueous plume remediation by preventing contaminantmigration (e.g., through hydraulic containment), estab-lishing a less-stringent cleanup level, and/or using natu-ral attenuation.
At Eielson AFB, TI waivers are being invoked for twolead contamination plumes caused by leaded gasolinereleases. The lead has degraded from the organic leadcontained in the gasoline to a relative immobile inor-ganic lead. Ground-water contamination is confined toareas approximately 600 feet in length. Ground-waterremediation is technically impracticable because the in-organic lead is so strongly adsorbed to the soils.
Reliability of institutional controls is very good; EielsonAFB is not a target of base closure. These institutionalcontrols preventing use of the ground water will protecthuman health.
Selection of Natural Attenuation With orWithout Institutional Controls
Natural attenuation is generally recommended onlywhen more active restoration is not practicable, cost-ef-fective, or warranted because of site-specific conditions(e.g., ground water that is unlikely to be used in theforeseeable future and therefore can be remediatedover an extended timeframe), or in situations in whichthe method is expected to reduce the concentration ofcontaminants in the ground water to remediation goalsin a reasonable timeframe (i.e., in a period comparableto that achievable using other restoration methods). In-stitutional controls may be necessary to ensure thatsuch ground waters are not used before levels protec-tive of human health are reached (55 FR 8734).
The limited action alternative (natural attenuation withinstitutional controls and ground-water monitoring) hasbeen selected for numerous areas at Eielson AFB con-taminated with both petroleum compounds and chlorin-ated organics. For all of these areas, the plume isbelieved to have reached equilibrium where the rate ofcontaminant leaching from the source is balanced withthe rate of natural attenuation. The use of institutionalcontrols was also a critical component of the selectedremedy to prevent exposure to contaminated groundwater until ARARs are achieved throughout the aquiferand beneficial uses are restored.
Building a “Safety Net”
As with any environmental decision, it is prudent todevelop a “safety net” of contingencies to alleviate ap-prehensions associated with the selection of naturalattenuation.
The uncertainty associated with environmental deci-sions, specifically the selection of natural attenuation,was addressed at Eielson AFB through the use of theobservational method. Key components of the obser-vational method are 1) a decision based on the mostprobable site conditions; 2) identification of reasonabledeviations from those conditions; 3) identification of pa-rameters to monitor to detect deviations; and 4) prepa-ration of contingency plans for each potential deviation(1). The conceptual site model developed through theinvestigation will be tested and confirmed through con-tinued ground-water monitoring. A phased approachwith contingencies for additional remediation was estab-lished in the event that the conceptual site model is notconfirmed.
114

In addition, statutory 5-year reviews require an evalu-ation for additional remediation if it becomes apparentthat the remedy is not protective of human health or theenvironment.
For sites where natural attenuation is selected andground-water contamination remains, reliable institu-tional controls are a critical component for a protectiveremedy. For federal facilities, institutional controls toprevent exposure to contaminated ground water aregenerally effective and reliable and are further enhancedby the statutory requirements for property transfer underSection 120(h) of CERCLA.
Summary
Existing regulations and guidance were used to supporta technically defensible selection of natural attenuation
as a component of the selected remedy for all ground-water contamination areas at Eielson AFB. The selectedremedies included a sound regulatory framework that isconsistent with EPA’s Ground Water Protection Strategy.
Continued monitoring, contingencies for implementingadditional remediation if necessary, statutory 5-year pro-tectiveness reviews, and the base closure requirementsof CERCLA Section 120 provide additional checks andreviews to ensure that the selected remedy remainsprotective.
Reference
1. Brown, S.M., D.R. Lincoln, and W.A. Wallace. 1989. Application ofthe observational method to remediation of hazardous waste sites.CH2M Hill, Bellevue, WA. April.
115
Lessons Learned: Risk-Based Corrective Action
Matthew C. SmallU.S. Environmental Protection Agency, Office of Underground Storage Tanks,
Region 9, San Francisco, California
Introduction
With over 300,000 leaking underground storage tanks(LUSTs) nationwide (1) that have contaminated soil,ground-water, and surface-water resources, operationof an underground storage tank (UST) clearly is nolonger a casual undertaking. U.S. Environmental Pro-tection Agency (EPA) regulations (2) created guidelinesand requirements for safe and responsible operation ofUSTs, with provisions for early leak detection, leak re-porting, financial responsibility, and cleanup of leaks.Using a franchise approach, these EPA regulations havebeen adopted—and sometimes supplemented—bystate UST programs in an effort to clean up existingleaks and prevent future leaks. Most state programsalso instituted petroleum cleanup funds to assist ownersand operators of USTs in complying with financial re-sponsibility requirements and to provide money forcleanup of existing releases.
Initially many state programs required cleanup of LUSTsites to very low levels of compounds of concern (petro-leum products) or in some cases even to background ornondetectable levels at all sites, regardless of the actualhazard posed by the site. These levels often proved tobe unattainable both technologically and economically,however, making site closure difficult to obtain, stallingproperty transfers, driving cleanup costs higher, andfrustrating all parties concerned. Even though state USTprograms have made strong efforts to prioritize sites forcleanup and streamline oversight, only about 45 percent(1) of known LUST sites nationwide had cleanups com-pleted by the end of 1995, and some state cleanup fundswere almost exhausted, bordering on insolvency.
The American Society for Testing and Materials’ docu-ment “Standard Guide for Risk-Based Corrective Action(RBCA) Applied at Petroleum Release Sites” (3) wasintroduced as a logical framework for determining theextent and urgency of corrective action required at a LUSTsite. The RBCA standard provides a tiered approach to
evaluating risk, progressing from generic, conservativecalculation of risk-based screening levels (RBSLs) tomore site-specific target levels (SSTLs) derived fromincreasingly site-specific data. Only completed path-ways from contaminant source to potential receptors areevaluated. Risk levels are used to back-calculate ac-ceptable concentrations (RBSLs or SSTLs) for eachcompound of concern for each completed pathway. Siteconditions are then compared with the RBSLs or SSTLsto determine the extent of cleanup required.
Currently 43 states have entered the RBCA training proc-ess. Of these, 6 have implemented RBCA, 12 are workingon the program design, and 25 are still training (4). Thispaper presents some of the lessons learned during theprocess of developing and implementing RBCA.
Lessons Learned
RBCA Program Development
The process of implementing an RBCA program at thestate level requires commitment on the part of the entireorganization. Training is usually required for all inter-ested parties, including state regulators, environmentalconsultants, UST owners and operators, and the gen-eral public. All of these interested parties or stakeholdersmust be involved in the process up front to avoid mis-conceptions and misunderstandings. It is especially im-portant that key decision-makers understand and “buyinto” the process early on.
All interested parties must be involved in making the riskmanagement decisions necessary for implementingRBCA. This includes determination of risk levels, path-ways to be considered, compounds of concern, andother key parameters used to calculate Tier 1 RBSLs.Once the RBSLs have been calculated, it is importantto avoid the temptation to adjust the parameters in aneffort to make the RBSLs fit some preconceived orpre-existing level.
116

Creation of RBCA lookup tables and cleanup numberscan be a contentious process. The general public andmany regulators often want to retain cleanup to back-ground for Tier 1 regardless of the actual hazard posedby the site. Education is the only way to solve thisproblem. People must be made aware that backgroundlevels are unrealistic and often unattainable goals atmost sites, given available technologies and resources.The RBCA process provides a method for determiningcleanup goals to adequately protect human health andthe environment.
Because RBCA often involves some major philosophicalchanges, regulatory and policy changes may also beneeded. Stakeholders may feel wary if a state changesfrom fixed, numerical cleanup standards to risk-basedcleanup goals without legislative authority to do so.These stakeholders may feel more comfortable if the lawsays the change is appropriate. Legislative mandates,however, may also impose limitations that impede orcompromise RBCA implementation. Therefore, a bal-anced approach is required to ensure that regulatorsand other stakeholders feel that the implementationprocess is legitimate but not that RBCA is being forcedupon them against their will.
RBCA Program Implementation
Implementation can be difficult initially. States shouldhave a clear and thorough strategy for implementing ascomplete a RBCA program as possible before they start.If not, the state may end up haphazardly creating piecesof the program in response to problems and issues asthey arise. For example, requirements and definitionsrelating to key issues such as alternate points of com-pliance, acceptable sampling methodologies, and extentof site assessment for Tier 1 versus Tier 2 should beavailable before program implementation.
Modeling data can sometimes be misleading. In particu-lar, estimates of indoor air concentrations that resultfrom a given soil concentration are often overestimated.Monitoring and sampling are important to confirm anymodeling estimates used in the RBCA process.
RBCA is not a cure-all—some difficult issues will remain.For example, third party liability for compounds of con-cern left behind at LUST sites following property transfer
may still cause uncertainty and potential problems. A siteclosed using cleanup levels determined through RBCAor by previous standards will leave some level of com-pounds of concern in place. In most cases, however,RBCA provides a more sound and defensible basis forsite closure and levels of compounds of concern left inplace should third-party issues arise. Another issue isthe fear of having sites reopened after a closure letterhas been granted. Again, RBCA provides a clear, logicalframework for making site closure decisions that canbe easily revisited should the closure be questioned inthe future.
Some consultants and regulators may view RBCA as athreat to their livelihood. Long cleanup times and low siteclosure rates ensure continued work for both consult-ants and regulators. Sites will have to be closed even-tually, however, and the RBCA process is one of the bestways to achieve this goal.
Considerations for the Future
The implementation and acceptance of RBCA involvesa shift in perspective from asking the question “Howmuch or what levels of the compounds of concern canwe cleanup?” to asking “How much of the compoundsof concern can we safely leave in place?” Again, this isnot a significant change in the way we manage sitesbecause some level of compounds of concern havealways been left in place. RBCA simply asks the ques-tion early in the cleanup process to better utilize re-sources to clean up sites posing the most threat. Wemust, however, guard against allowing ourselves to ask“How much contamination can we allow to happen?”It is extremely important to supplement an RBCA pro-gram with a strong program of leak prevention andearly leak detection.
References1. Lund, L. 1996. EPA fiscal year 1996 semi-annual (1st and 2nd
quarter) UST activity report. May 3.
2. U.S. EPA. 1995. 40 Code of Federal Regulations, Part 280. July 1.
3. American Society for Testing and Materials. 1995. Standard guidefor risk-based corrective action (RBCA) applied at petroleum re-lease sites. E-1739-95. September 10.
4. Partnership in RBCA Implementation (PIRI). 1996. RBCA imple-mentation summary graph from EPA/ASTM data. February 6.
117
Informal Dialog on Issues of Ground-Water and Core Sampling
Donald H. KampbellNational Risk Management Research Laboratory,
R.S. Kerr Research Center, Ada, Oklahoma
An assessment of natural attenuation can be no betterthan the site characterization activities that collect thedata used in the assessment. The following issuesshould be considered when planning for field sampling:
• When is a conventional well required, and when cana Geoprobe or CPT push technology be used for wellinstallation?
• What are the advantages and disadvantages of con-ventional wells, mini wells, or water samples col-lected with a Hydropunch and a CPT rig?
• How much water should be purged to prepare a wellfor sampling?
– What is the evidence that a well is ready for sampling?
– What should be measured: conductivity, tempera-ture, pH, turbidity, oxygen, or redox potential?
• What flow rate should be used to purge a well?
• What flow rate should be used to sample a well?
• What is the best way to measure oxygen in ground water?
– What are the relative advantages of oxygen-sensing electrodes and indicator dye kits?
– What level of training is required to use the equip-ment intelligently?
– What problems may arise?
• What is the best way to measure sulfide in ground water?
– What are the relative advantages of lead acetateindicator paper, colorimeter assays, or ion specificelectrodes?
– How accurate should the measurement be?
– What problems may arise?
• What is the best way to measure iron(II) in ground water?
– What field methods are available?
– How accurate should the measurement be?
– What problems may arise?
• How should samples for methane, ethylene, and eth-ane be collected?
– Where can the samples be analyzed, and howmuch should analysis cost?
• What is the best preservative for ground-water samples?
• How is ground water sampled for hydrogen?
– What are the limitations of this technique?
– What problems may arise?
• Must alkalinity be analyzed in the field, or can sam-ples be shipped back to the laboratory?
• When should ground-water samples be acquired forvolatile fatty acids (VFAs)?
– How are VFA samples stabilized and extracted?
• What is the best way to collect core samples?
– What are the advantages and disadvantages ofavailable equipment?
– How should the samples be stabilized for analysisof contaminants?
– What is the best way to screen samples in the field?
– How should the samples be stabilized for analysisof microbial indices?
• How is soil gas analysis used to locate and identifynonaqueous-phase liquid source areas?
– What parameters should be measured?
– What equipment is available?
• What new analyses could be developed to improveunderstanding of natural attenuation?
– What new tracers might be used?
118

• What are the cost tradeoffs of these analyses com-pared with the benefit of improved understanding ofplume behavior?
• What should be the relative investment in sampleacquisition, sample analysis, data reduction, mathe-matical modeling, and report preparation?
• How many wells or cores samples are needed?
– To examine plume flow velocity?
– To examine proximity to sensitive receptors?
119

Appropriate Opportunities for Application of Natural Attenuation in the CivilianSector
Fran KremerU.S. Environmental Protection Agency,
Office of Research and Development, Cincinnati, Ohio
Introduction
This paper examines the historical and current use ofnatural attenuation, with an emphasis on Superfundsites and underground storage tank sites. The paperalso presents the results of a survey of natural attenu-ation policies and guidelines for natural attenuation inboth ground water and soils. Finally, it briefly addressesthe factors that are important for promoting greater ac-ceptance of natural attenuation as a remediation ap-proach for contaminated sites in the civilian sector.
Analysis of Ground-Water Records ofDecision
Earlier this year, EPA’s Superfund office completed ananalysis of ground-water Records of Decision (RODs)from 1982 to 1994. The overall trend in ground-waterRODs using natural attenuation is shown in Figure 1. Inaddition, in 1995, 26 RODs were signed using naturalattenuation; 10 percent of RODs for ground water were
specifically related to natural attenuation. Of the 73RODs shown in Figure 1, 41 were Potentially Respon-sible Party (PRP) lead proposals.
EPA’s Technology Innovation Office analyzed these databased on the use of natural attenuation in the 10 EPARegions. These results are summarized in Figure 2.Region 1 through 6 are the heaviest users of naturalattenuation, while Regions 7 through 10 were marginalusers. No definitive conclusions have been drawn fromthis, but the arid climate in western regions may not beas conducive to selection of natural attenuation inground water. Region 4 had the greatest number ofnatural attenuation RODs (16 sites) followed by Region5 (12 sites). Regions 5 and 9, in general, are the mostfrequent users of both active and passive bioremedia-tion processes.
Figure 3 presents additional analysis of the 73 RODs bytype of site. The figure shows that 35 of the RODsoriginated from industrial and municipal landfills, withfewer from chemical and industrial manufacturing andother types of sites. It should be noted that one out offive National Priority List (NPL) sites is a landfill, a factthat will skew these results.
Figure 4 shows the contaminants present at the 73 sitesfor which natural attenuation was selected. Solvents(chlorinated and nonchlorinated) and inorganics werepresent most often, with both types of contaminantspresent at 35 sites. It should be noted that more thanone contaminant can be identified for a given site.
Natural attenuation is often used with a combination ofother active approaches. This was the case for all but 6of the 73 sites. In many cases the contaminant concen-trations were found to be very low. Contingencies existfor other active measures in the event that the naturalattenuation approach does not prove to be effective forthe particular site.
0
5
10
15
20
85 86 87 88 89 90 91 92 93 94
Fiscal Year
Num
ber
of R
OD
s
1 1
3 3
7 7
9
1213
17
Figure 1. Ground-water RODs using natural attenuation.
120
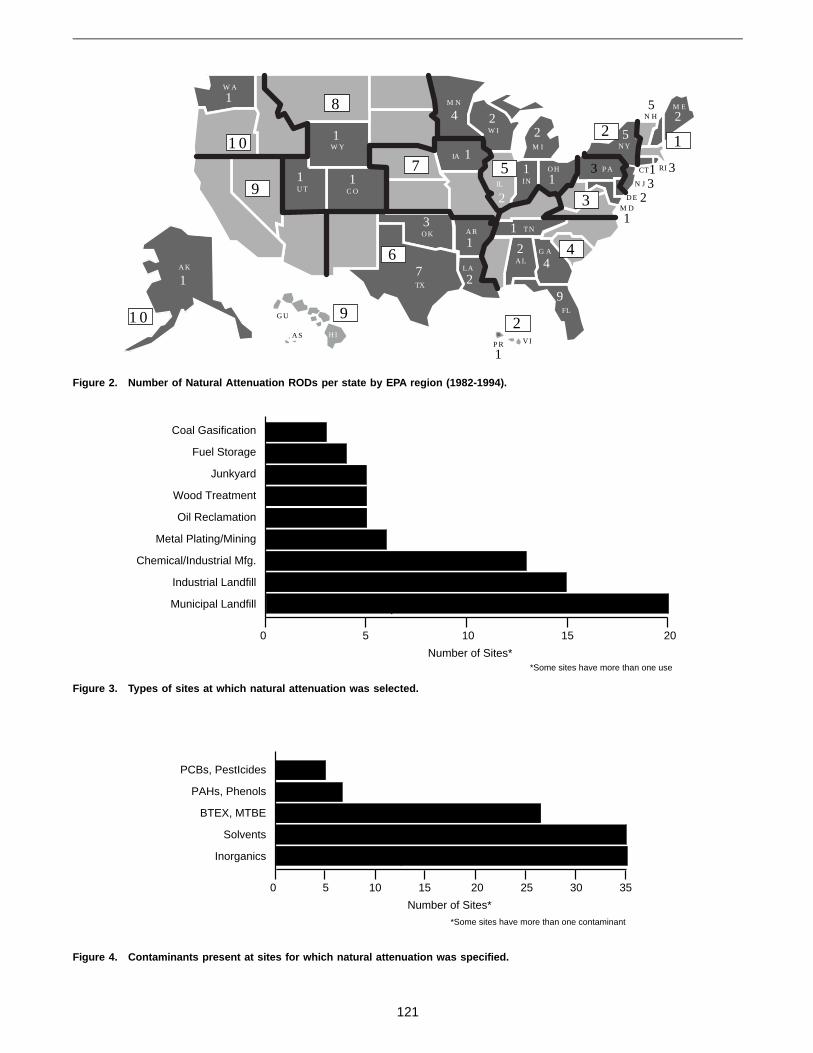
W A
AK
W Y
UT C O
TX
OK
M N
IA
IL
2
W I
M I
IN
OH
TNAR
LAAL
G A
P A
NY
M E
FL
M D
DE
N J
CT RI
H IP R VI
291 0 GU
AS
1
1
1
1 1
7
3
1
2
2
1
9
4
11
1
224
52
1
1
231 3
N H5
3
1 0
9
8
7
6
5
4
3
21
Figure 2. Number of Natural Attenuation RODs per state by EPA region (1982-1994).
0 5 10 15 20
Number of Sites*
Coal Gasification
Fuel Storage
Junkyard
Wood Treatment
Oil Reclamation
Metal Plating/Mining
Chemical/Industrial Mfg.
Industrial Landfill
Municipal Landfill
*Some sites have more than one use
Figure 3. Types of sites at which natural attenuation was selected.
0 5 10 15 20 25 30 35
Number of Sites*
PCBs, PestIcides
PAHs, Phenols
BTEX, MTBE
Solvents
Inorganics
*Some sites have more than one contaminant
Figure 4. Contaminants present at sites for which natural attenuation was specified.
121
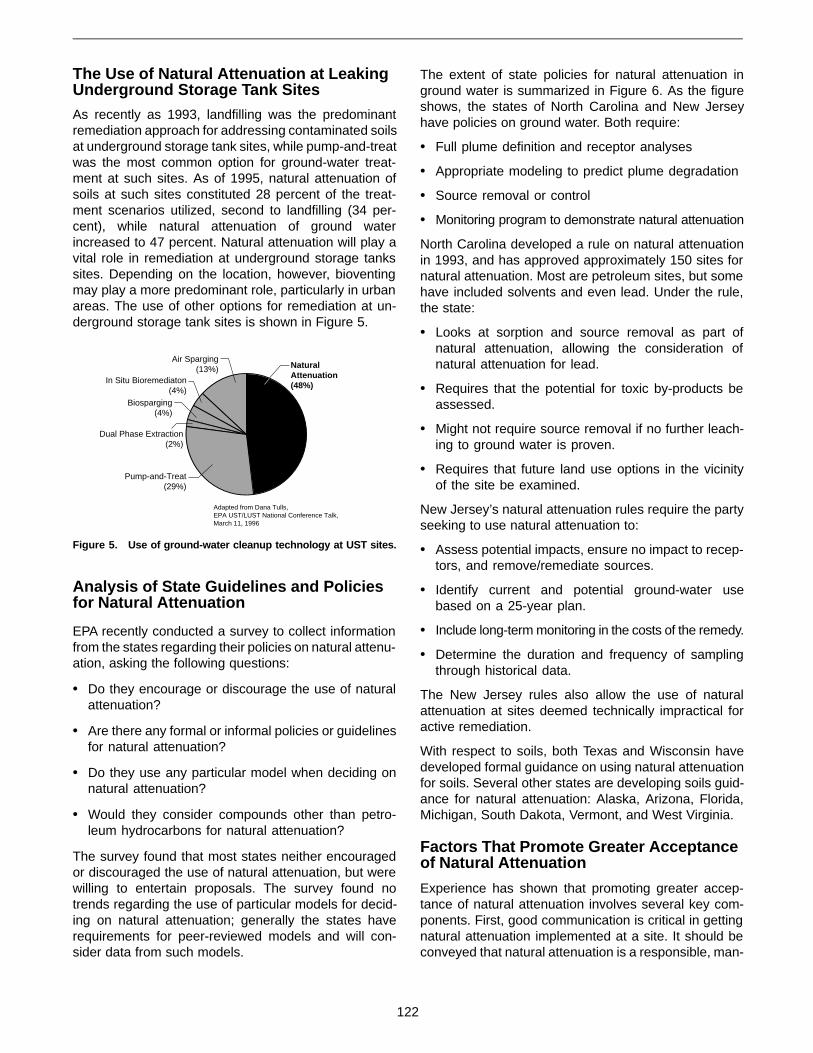
The Use of Natural Attenuation at LeakingUnderground Storage Tank Sites
As recently as 1993, landfilling was the predominantremediation approach for addressing contaminated soilsat underground storage tank sites, while pump-and-treatwas the most common option for ground-water treat-ment at such sites. As of 1995, natural attenuation ofsoils at such sites constituted 28 percent of the treat-ment scenarios utilized, second to landfilling (34 per-cent), while natural attenuation of ground waterincreased to 47 percent. Natural attenuation will play avital role in remediation at underground storage tankssites. Depending on the location, however, bioventingmay play a more predominant role, particularly in urbanareas. The use of other options for remediation at un-derground storage tank sites is shown in Figure 5.
Analysis of State Guidelines and Policiesfor Natural Attenuation
EPA recently conducted a survey to collect informationfrom the states regarding their policies on natural attenu-ation, asking the following questions:
• Do they encourage or discourage the use of naturalattenuation?
• Are there any formal or informal policies or guidelinesfor natural attenuation?
• Do they use any particular model when deciding onnatural attenuation?
• Would they consider compounds other than petro-leum hydrocarbons for natural attenuation?
The survey found that most states neither encouragedor discouraged the use of natural attenuation, but werewilling to entertain proposals. The survey found notrends regarding the use of particular models for decid-ing on natural attenuation; generally the states haverequirements for peer-reviewed models and will con-sider data from such models.
The extent of state policies for natural attenuation inground water is summarized in Figure 6. As the figureshows, the states of North Carolina and New Jerseyhave policies on ground water. Both require:
• Full plume definition and receptor analyses
• Appropriate modeling to predict plume degradation
• Source removal or control
• Monitoring program to demonstrate natural attenuation
North Carolina developed a rule on natural attenuationin 1993, and has approved approximately 150 sites fornatural attenuation. Most are petroleum sites, but somehave included solvents and even lead. Under the rule,the state:
• Looks at sorption and source removal as part ofnatural attenuation, allowing the consideration ofnatural attenuation for lead.
• Requires that the potential for toxic by-products beassessed.
• Might not require source removal if no further leach-ing to ground water is proven.
• Requires that future land use options in the vicinityof the site be examined.
New Jersey’s natural attenuation rules require the partyseeking to use natural attenuation to:
• Assess potential impacts, ensure no impact to recep-tors, and remove/remediate sources.
• Identify current and potential ground-water usebased on a 25-year plan.
• Include long-term monitoring in the costs of the remedy.
• Determine the duration and frequency of samplingthrough historical data.
The New Jersey rules also allow the use of naturalattenuation at sites deemed technically impractical foractive remediation.
With respect to soils, both Texas and Wisconsin havedeveloped formal guidance on using natural attenuationfor soils. Several other states are developing soils guid-ance for natural attenuation: Alaska, Arizona, Florida,Michigan, South Dakota, Vermont, and West Virginia.
Factors That Promote Greater Acceptanceof Natural Attenuation
Experience has shown that promoting greater accep-tance of natural attenuation involves several key com-ponents. First, good communication is critical in gettingnatural attenuation implemented at a site. It should beconveyed that natural attenuation is a responsible, man-
Natural Attenuation (48%)
Pump-and-Treat(29%)
Dual Phase Extraction(2%)
Biosparging(4%)
In Situ Bioremediaton(4%)
Air Sparging(13%)
Adapted from Dana Tulls, EPA UST/LUST National Conference Talk, March 11, 1996
Figure 5. Use of ground-water cleanup technology at UST sites.
122

aged remediation approach, not a “walk-away” option.All parties, including regulatory agencies, need to beinvolved in the consideration of natural attenuation veryearly in the process.
Second, it is critical to have the information to supportnatural attenuation. This includes site-specific data andanalyses that demonstrate occurrence, a defensibleconceptual model, and defensible predictive models,where appropriate.
Other factors that are important for acceptance of naturalattenuation include plans to control, treat, or removesources; to thoroughly monitor plume and downgradientareas; and to implement contingencies for other measuresin case natural attenuation fails to meet the desired goals.
Finally, the burden of proof is on the proponent, not theregulator. In implementing natural attenuation, as in anyactive remediation process, the project is not completeuntil the goals of the regulatory agency have been met.
W AM T
ID
O R
NV
CA
AK
W Y
UT C O
NMAZ
ND
TX
OK
KS
NE
S D
M N
IA
M OIL
W I
M I
INOH
KY
TNAR
LA
M SAL
G A S C
N C
W V
P A
NY
M E
FL
M DVA
DE
N J
CT RI
M A
VT
NH
HI
1 0
9
8
7
6
5
4
3
2
1
91 0 GU
AS
Written policies and guidelines
Developing policies and guidelines
Informal policies and guidelines
Informal guidelines/Do not consider non-UST waste
Do not have any formal policy
Figure 6. State policies regarding natural attenuation in ground water.
123

Appropriate Opportunities for Application: U.S. Air Force and Department ofDefense
Patrick E. HaasU.S. Air Force Center for Environmental Excellence (AFCEE), Technology Transfer Division,
Brooks Air Force Base, Texas
Introduction
U.S. Air Force spill or release sites are most commonlycontaminated with petroleum hydrocarbons. Chlorin-ated solvents, such as trichloroethylene (TCE), are thesecond most common group of Air Force site contami-nants. Sites contaminated with heavy metals are a dis-tant third. The objective of this paper is to outline the roleof natural attenuation in an overall risk-based strategyfor remediating chlorinated solvent sites. The possiblebenefits and importance of considering natural attenu-ation throughout the site characterization and remedialphases are discussed.
Site Characterization Process
The goal of site characterization is to define the natureand extent of contamination as well as the fate andtransport of constituents of concern over time. Naturalattenuation is the combination of the nondestructiveprocesses of dilution, sorption, and volatilization and thedestructive processes of biotic and abiotic degradation.Thus, although the objective of site characterization isto have a reasonable understanding of fate and trans-port, specific quantification of potentially major proc-esses, such as biodegradation, often is overlooked intraditional site characterizations—an egregious over-sight at sites contaminated with petroleum hydrocar-bons.
The Air Force Center for Environmental Excellence (AF-CEE), Technology Transfer Division, has completed 50site characterizations, inclusive of natural attenuationparameters. Each of these investigations has demon-strated the dominant role natural biodegradation playsin the fate and transport of petroleum hydrocarbons. Themessage is not simply “Natural attenuation happens,don’t worry,” but that including natural attenuation pa-rameters gives the owner and regulator the ability todiscern which sites will pose a potential future risk and
which sites do not or will not pose any unacceptable risk.In other words, fate and transport cannot be accuratelypredicted without the inclusion of natural biodegradationeffects.
Natural attenuation can be evaluated as a treatmentoption alongside more intrusive source removal ap-proaches. The final remedial action may include naturalattenuation alone or in concert with these more intrusivesource removal approaches.
Background and Lessons Learned FromPetroleum Sites
The California LUFT Historical Case Analyses (1) pro-vides dramatic confirmation of the dominant effects ofnatural attenuation on fuel-contaminated sites. The“demographics” of 1,500 State Leaking UndergroundFuel Tank (LUFT) cases with confirmed ground-watercontamination were:
• At 50 percent of sites, mean ground-water depth wasless than 15 feet, 25 percent were less than 7.5 feet.
• Ground-water plumes were less than 200 feet at 85percent of sites.
• If all fuel-contaminated ground water was remedi-ated, statewide water basin capacity would increaseby 5/10,000ths of 1 percent.
The current body of evidence supports the above profileas being primarily the result of natural biodegradation.Thus, not considering the effects of natural attenuationwould be an oversight.
Natural Attenuation of ChlorinatedOrganics
The current debate centers around whether naturalprocesses can effectively “treat,” contain, and remove asignificant mass of chlorinated organics from ground-
124

water plumes. A growing body of evidence supports thecontention that natural degradation processes are im-portant in understanding the fate and transport of chlo-rinated organics. Thus, a practical, field-based protocolfor the estimation of these effects is needed and iscurrently under development.
Almost invariably, any concept or approach goesthrough the sequential stages of first being ridiculed andconsidered preposterous, secondly being dismissed astrivial, and thirdly being proclaimed as his or her ownidea. Overall, natural attenuation of fuels is currentlysomewhere between the second and third stages ofacceptance. In contrast, attitudes toward natural attenu-ation of chlorinated organics appear to be closer to thefirst stage or, more fairly, in the “prove it to me” stage.The point of the above discussion is to underline that theinclusion of natural attenuation in the site charac-terization process improves the quality and accuracy ofthe site investigation and facilitates defensible, risk-based decision-making. Also, by proceeding to the fieldand evaluating natural attenuation as part of the sitecharacterization process, data will be generated that willanswer many of the practical questions regarding theapplicability of natural attenuation as part of the cleanupprocess. These data are also directly useful in the evalu-ation and design of other remedial systems.
Given that the contribution of natural attenuation proc-esses to chlorinated organics cleanup is less estab-lished than that of petroleum hydrocarbons, the factremains that the cost and potential risk implicationsof many chlorinated organic contaminated sites arehigher than those of the majority of fuel-contaminatedsites. Many may currently predict that natural attenu-ation may not effectively contain or abate chlorinatedorganic plumes. It is important to point out that less than5 years ago the bulk of the environmental communitybelieved that oxygen was the primary electron acceptorin the natural biodegradation of petroleum-contaminatedground water. The above data greatly dispels this theory.In short, natural attenuation alone may only apply to 20percent of all chlorinated solvent sites.1
AFCEE Technology Transfer Focus: FieldProtocol
Regarding the natural attenuation of chlorinated or-ganics, the AFCEE Technology Transfer Division is con-vinced that the current focus should be on “How can wemeasure natural attenuation processes, like biodegra-dation, during the site characterization process?” and“How can we reduce the cost of sampling and analysisprocedures?” Current efforts center around the develop-
ment and validation of cost-effective and diagnosticnatural attenuation sampling and analysis procedures.
Thus, similar to the Technical Protocol for ImplementingIntrinsic Remediation with Long-Term Monitoring forNatural Attenuation of Fuel Contamination Dissolved inGround Water (2), a field-based natural attenuation pro-tocol for chlorinated organics is under development andis currently in draft form. Development and field valida-tion of this protocol are the first and most necessarysteps toward the development of an integrated risk man-agement strategy for this class of sites. Natural attenu-ation is not selected presumptively. In fact, the selectionof natural attenuation alone or in concert with supple-mental remedial systems is based on the collection of areasonable weight of site-specific supporting evidence.
Lines of Evidence
Site-specific data in support of natural attenuation include:
• Documented loss of contaminants at the field level(e.g., shrinking, stable, or retarded plumes).
• Geochemical indicators of degradation (e.g., degra-dation byproduct formation, electron acceptor usage,or redox potential).
In some cases, it may be beneficial to supplement theabove evidence with laboratory microcosm data. Labo-ratory microcosms can be used to demonstrate thatunder specific conditions the constituent of concern isbiodegraded, as well as to provide estimates of degra-dation rates. Microcosm data are particularly relevant ifthe laboratory conditions closely approximate field con-ditions. Confirmed contaminant removal and contain-ment strongly establish that conditions are adequate tosupport attenuation; however, confirmatory microcosmdata can more clearly elucidate the role of biodegradation.
Controlling Factors of Natural Attenuation
The natural attenuation of petroleum hydrocarbons islargely controlled by the availability or utilization of elec-tron acceptors (i.e., sulfate, nitrate, carbon dioxide) (seethe BIOSCREEN user’s guide [3], for details on electronacceptor utilization profiles at 28 fuel sites). Thus, natu-ral attenuation of petroleum hydrocarbons is overall anelectron acceptor-limited process. In contrast, naturalattenuation of chlorinated organics appears to be anelectron donor-limited process for parent compoundssuch as tetrachloroethylene (PCE) or trichloroethylene(TCE). That is, co-metabolism or reductive dehalogena-tion of chlorinated organics requires the presence of asubstrate or electron donor. As a result of this depend-ence, the draft Technical Protocol for Natural Attenu-ation of Chlorinated Solvents in Ground Water (4)outlines different types of plume behavior.
1 Wilson, J.T. 1996. Personal communication between the author andJohn T. Wilson, U.S. Environmental Protection Agency, National RiskManagement Research Laboratory, Ada, OK.
125

Types of Plume Behavior
Type 1 behavior is associated with areas within theplume where anthropogenic carbon (e.g., petroleum hy-drocarbons or landfill leachate) is present and beingutilized as a carbon source or electron donor. Type 2behavior is associated with areas within the plumewhere a source of naturally occurring carbon is presentand being utilized. Type 3 behavior is associated withareas within a plume where an inadequate carbonsource(s) is present or being utilized. All of these behav-iors can be exhibited within a single plume simultane-ously or in various combinations. The behavior profilecould also change over time.
These plume behaviors or profiles are important fromthe perspective of 1) determining whether site constitu-ents will be degraded over time, thereby preventingexposure to receptors; 2) determining which metabolicbyproducts (e.g., vinyl chloride) might be produced; and3) determining whether metabolic byproducts, such asvinyl chloride, will subsequently be destroyed.
Common Primary Remedial Goals
Plume containment is one of the primary remedial goalsas well as a traditional remedial action (i.e., pump andtreat). Thus, by understanding natural attenuation andplume behaviors, one can evaluate whether plume con-tainment can be achieved with natural attenuation aloneor in concert with supplemental remedial systems. An-other primary remedial objective is to achieve reductionsin the concentrations of constituents of concern to risk-based levels. Considering natural attenuation effects willassist in the assessment of when concentration-basedgoals will be met.
By way of example, the presence of Type 1 or 2 areasmay promote the breakdown of parent compounds (e.g.,PCE, TCE), resulting in significant mass reduction. Inother words, this area, typically near the source, mayrepresent an effective treatment zone or system. Yet,vinyl chloride can also be produced as a metabolicbyproduct in these typically anaerobic zones. The pres-ence of vinyl chloride might be viewed as a disastrousend result; however, vinyl chloride has been shownoverall to be more biodegradable than the parent com-pounds and to be biodegradable under aerobic and/oriron-reducing conditions. Thus, with respect to risk man-agement, a point of critical importance would be todetermine whether the vinyl chloride will enter into azone where the geochemical conditions support biode-gradation. In certain instances, the zone where the con-stituent(s) of concern is located or the area directlydowngradient can be viewed and managed as an effec-tive treatment zone.
Natural Attenuation and Alternative PlumeManagement
Understanding natural attenuation effects allows theconsideration and implementation of alternative reme-dial approaches. Pump and treat systems are tradition-ally used to achieve hydraulic containment; however,more limited ground-water pumping could be used tocreate aerobic conditions in downgradient zones (e.g.,aerobic) that would effectively complete the biodegrada-tion of vinyl chloride. Alternative methods of ground-water aeration are also possible. Pumping upgradient ofsource zones could slow ground-water velocities suffi-ciently so that the kinetics of biodegradation are com-patible with plume containment. These approaches maybe “pump and not have to treat” alternatives. Othertraditional technologies can be used in concert withnatural attenuation in conventional source removal ap-proaches (e.g., soil vapor extraction [SVE]). This com-bination would involve reducing contribution from thesource term down to levels where natural attenuationmechanisms can remediate constituents of concern.
When evaluated as part of the site-specific feasibilitystudy, these approaches may be far more favorablebecause of their lower pumping rates, infrastructure re-quirements, and operation and maintenance require-ments compared with trying to achieve total hydrauliccontrol or complete source removal. In many cases, totalhydraulic control (via pump and treat) and extensivesource removal, especially below the water table, aretechnically impracticable. Natural attenuation with orwithout supplement remedial systems, however, may betechnically practicable.
Conceptual Models
TCE proved to be a highly effective degreasing agent.As a result, the waste stream released to the environ-ment often contained a combination of degreasing agentand solvated petroleum hydrocarbons. Chlorinated sol-vents are also typically found at Air Force fire trainingareas because waste solvents were combined withwaste fuels during training exercises. Thus, chlorinatedsolvents are commonly found to be codistributed withanthropogenic carbon sources. This codistribution canoften result in zones of Type 1 behavior. Due to naturalattenuation effects, typical petroleum hydrocarbonplumes are relatively short. And in fact, in the CaliforniaLUFT Historical Case Analyses (1), 85 percent of the1,500 ground-water plumes surveyed were less than200 feet in length. The volume of the Type 1 zone maybe roughly delineated by the volume of the petroleum-contaminated area. Given that petroleum hydrocarbonsappear to be excellent microbial substrates, however,this area of codistributed solvents and fuels will likelyhave significantly higher reaction kinetics than areas inwhich the substrate is less favorable or absent. Even if
126
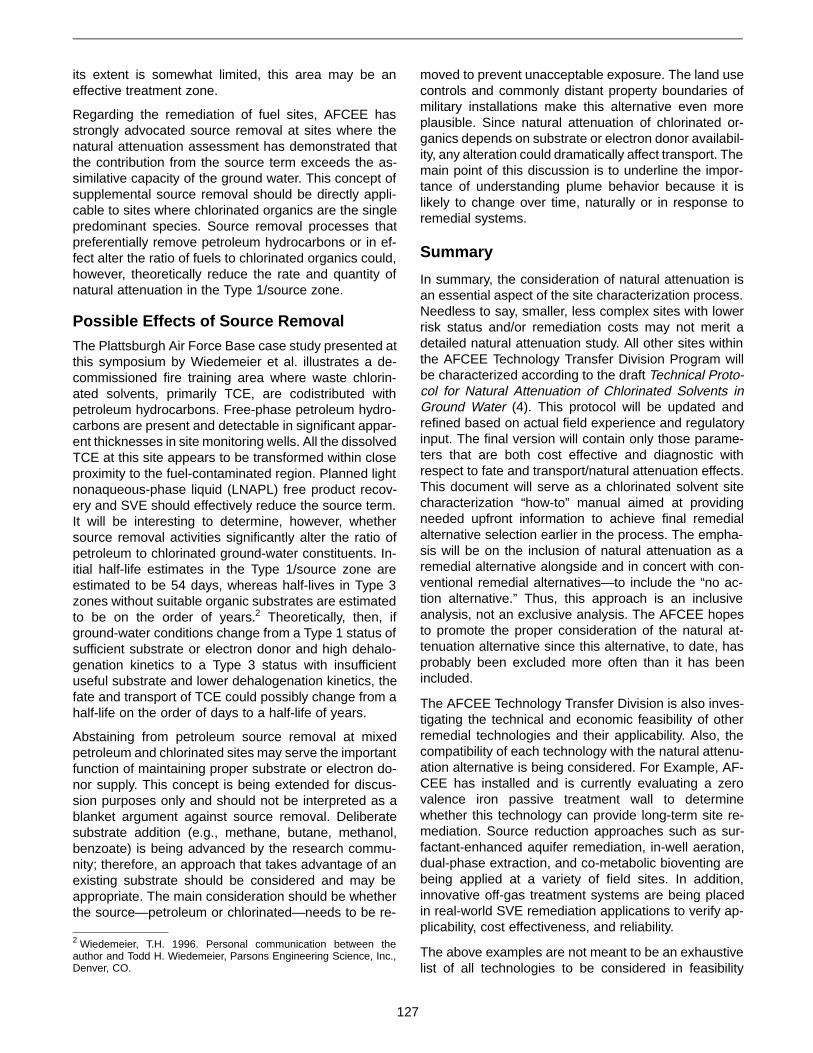
its extent is somewhat limited, this area may be aneffective treatment zone.
Regarding the remediation of fuel sites, AFCEE hasstrongly advocated source removal at sites where thenatural attenuation assessment has demonstrated thatthe contribution from the source term exceeds the as-similative capacity of the ground water. This concept ofsupplemental source removal should be directly appli-cable to sites where chlorinated organics are the singlepredominant species. Source removal processes thatpreferentially remove petroleum hydrocarbons or in ef-fect alter the ratio of fuels to chlorinated organics could,however, theoretically reduce the rate and quantity ofnatural attenuation in the Type 1/source zone.
Possible Effects of Source Removal
The Plattsburgh Air Force Base case study presented atthis symposium by Wiedemeier et al. illustrates a de-commissioned fire training area where waste chlorin-ated solvents, primarily TCE, are codistributed withpetroleum hydrocarbons. Free-phase petroleum hydro-carbons are present and detectable in significant appar-ent thicknesses in site monitoring wells. All the dissolvedTCE at this site appears to be transformed within closeproximity to the fuel-contaminated region. Planned lightnonaqueous-phase liquid (LNAPL) free product recov-ery and SVE should effectively reduce the source term.It will be interesting to determine, however, whethersource removal activities significantly alter the ratio ofpetroleum to chlorinated ground-water constituents. In-itial half-life estimates in the Type 1/source zone areestimated to be 54 days, whereas half-lives in Type 3zones without suitable organic substrates are estimatedto be on the order of years.2 Theoretically, then, ifground-water conditions change from a Type 1 status ofsufficient substrate or electron donor and high dehalo-genation kinetics to a Type 3 status with insufficientuseful substrate and lower dehalogenation kinetics, thefate and transport of TCE could possibly change from ahalf-life on the order of days to a half-life of years.
Abstaining from petroleum source removal at mixedpetroleum and chlorinated sites may serve the importantfunction of maintaining proper substrate or electron do-nor supply. This concept is being extended for discus-sion purposes only and should not be interpreted as ablanket argument against source removal. Deliberatesubstrate addition (e.g., methane, butane, methanol,benzoate) is being advanced by the research commu-nity; therefore, an approach that takes advantage of anexisting substrate should be considered and may beappropriate. The main consideration should be whetherthe source—petroleum or chlorinated—needs to be re-
moved to prevent unacceptable exposure. The land usecontrols and commonly distant property boundaries ofmilitary installations make this alternative even moreplausible. Since natural attenuation of chlorinated or-ganics depends on substrate or electron donor availabil-ity, any alteration could dramatically affect transport. Themain point of this discussion is to underline the impor-tance of understanding plume behavior because it islikely to change over time, naturally or in response toremedial systems.
Summary
In summary, the consideration of natural attenuation isan essential aspect of the site characterization process.Needless to say, smaller, less complex sites with lowerrisk status and/or remediation costs may not merit adetailed natural attenuation study. All other sites withinthe AFCEE Technology Transfer Division Program willbe characterized according to the draft Technical Proto-col for Natural Attenuation of Chlorinated Solvents inGround Water (4). This protocol will be updated andrefined based on actual field experience and regulatoryinput. The final version will contain only those parame-ters that are both cost effective and diagnostic withrespect to fate and transport/natural attenuation effects.This document will serve as a chlorinated solvent sitecharacterization “how-to” manual aimed at providingneeded upfront information to achieve final remedialalternative selection earlier in the process. The empha-sis will be on the inclusion of natural attenuation as aremedial alternative alongside and in concert with con-ventional remedial alternatives—to include the “no ac-tion alternative.” Thus, this approach is an inclusiveanalysis, not an exclusive analysis. The AFCEE hopesto promote the proper consideration of the natural at-tenuation alternative since this alternative, to date, hasprobably been excluded more often than it has beenincluded.
The AFCEE Technology Transfer Division is also inves-tigating the technical and economic feasibility of otherremedial technologies and their applicability. Also, thecompatibility of each technology with the natural attenu-ation alternative is being considered. For Example, AF-CEE has installed and is currently evaluating a zerovalence iron passive treatment wall to determinewhether this technology can provide long-term site re-mediation. Source reduction approaches such as sur-factant-enhanced aquifer remediation, in-well aeration,dual-phase extraction, and co-metabolic bioventing arebeing applied at a variety of field sites. In addition,innovative off-gas treatment systems are being placedin real-world SVE remediation applications to verify ap-plicability, cost effectiveness, and reliability.
The above examples are not meant to be an exhaustivelist of all technologies to be considered in feasibility
2 Wiedemeier, T.H. 1996. Personal communication between theauthor and Todd H. Wiedemeier, Parsons Engineering Science, Inc.,Denver, CO.
127

studies; this listing is provided to communicate thatseveral specific alternatives are being evaluated in thefield in addition to natural attenuation. The overall effortis to collect sufficient real-world applicability and per-formance data to complete the “remediation tool box” forchlorinated solvents.
As stated above, natural attenuation will be applied aspart of a risk management strategy alone or in concertwith supplemental remedial systems. This risk manage-ment strategy shall emphasize plume managementconcepts within current regulatory frameworks to in-clude prioritized focus on higher mobility, higher riskcompounds; emphasis on early pathways analysis toidentify potentially completed pathways; determinationof whether plumes are contained, thus excluding anyfuture completed pathways; implementation of sourceremoval or other supplemental remedial systems whenexposure pathways are complete or natural attenuationprocesses alone will not satisfy remedial objectives; anduse of the feasibility study process to balance technical,economic, public, and regulatory factors. Considerationwill be site specific with respect to data and the regula-tory framework. The use of natural attenuation as a
treatment alternative, however, is considered scientifi-cally supportable, and when properly applied it is con-sidered compatible with federal and state regulatoryprograms.
References1. Rice, D.W., R.D. Grose, J.C. Miachaelson, B.P. Dooher, D.H.
McQueen, S.J. Cullen, W.E. Kastenburg, L.G. Everett, and M.A.Marino. 1995. California Leaking Underground Fuel Tank (LUFT)Historical Case Analysis. California State Water Resources ControlBoard.
2. Weidemeier, T.H., J.T. Wilson, D.H. Kampbell, R.N. Miller, and J.E.Hansen. 1995. Technical Protocol for Implementing Intrinsic Re-mediation with Long-Term Monitoring for Natural Attenuation ofFuel Contamination Dissolved in Ground Water. San Antonio, TX:U.S. Air Force Center for Environmental Excellence.
3. Newell, C.J., R.K. McLeod, and J.R. Gonzalez. 1996.BIOSCREEN Natural Attenuation Decision Support System, Ver-sion 1.30. San Antonio, TX: U.S. Air Force Center for Environ-mental Excellence.
4. Weidemeier, T.H., M.A. Swanson, D.E. Moutoux, J.T. Wilson, D.H.Kampbell, J.E. Hansen, P. Haas, and F.H. Chapelle. 1996. Tech-nical Protocol for Natural Attenuation of Chlorinated Solvents inGround Water. San Antonio, TX: U.S. Air Force Center for Envi-ronmental Excellence. In preparation.
128
Intrinsic Remediation in the Industrial Marketplace
David E. EllisDuPont Specialty Chemicals-CRG, Wilmington, Delaware
Introduction
Intrinsic remediation of chlorinated solvents is a com-mon phenomenon. Most sites contain bacteria that canboth dechlorinate and oxidize chlorinated solvents tonontoxic compounds. The challenge for site owners andfor regulators is to determine whether intrinsic remedia-tion is a safe and effective remedy at individual sites.Intrinsic remediation is an important development forindustry because it protects human health and the envi-ronment yet is more cost-effective than the competing,intrusive ground water remediation techniques.
When To Consider Intrinsic Remediation
Decision-makers should determine whether the follow-ing criteria are met when evaluating the appropriatenessof intrinsic remediation for a given site:
• Intrinsic remediation protects human health and theenvironment.
• Geochemical and volatile organic compound (VOC)analyses demonstrate that intrinsic degradation ofcontaminants is occurring.
• The contaminant source is continuing or cannot beremoved (e.g., dense nonaqueous-phase liquids[DNAPLs]), so ground water will need long-termtreatment.
• Ground water receptors are not affected or can beprotected.
• Minimal disruption of plant operations or property isdesired.
• Alternative remedial technologies pose additionalrisks, such as transferring contaminants to other en-vironmental media or disrupting adjacent ecosystems.
• The rate of degradation balances the rate of migra-tion and the potential for exposure, considering thelikely nature and timing of potential exposures. Forexample, if a plume will degrade within 10 years and
the ground water is not likely to be used for 20 years,intrinsic bioremediation should be seriously considered.
The Data Needed for an IntrinsicRemediation Determination
Determination of the appropriateness of an intrinsic re-mediation demonstration considers the extent of thedata-gathering effort and the cost of the resources re-quired. DuPont has developed the following list of mini-mum data to be gathered at all potential intrinsicremediation sites:
• VOCs, including isomers.
• Dissolved oxygen, redox potential, and conductivity.
• Methane, ethane, ethylene, and propane.
• Total organic carbon (TOC).
• Major anions and cations (sodium, potassium, cal-cium, chloride, iron, magnesium, manganese, nitrate,sulfate, and alkalinity).
DuPont recommends a tiered approach to intrinsic siteassessment, based on the complexity of the site, to betterunderstand what will be needed for a credible intrinsicremediation demonstration. Table 1 characterizes thethree tiers of sites. For further information on requirementsfor demonstrations, consult the newly issued RemediationTechnology Development Forum (RTDF) guidelines (1).
The Economics of Intrinsic Remediation
Those who have been involved in selecting the “best”remedy for a site know that this is a time-consumingtask, which typically requires expensive sampling andanalysis; the more parameters, the greater the analyticalcost. Therefore, there is often a reluctance to evaluatea large number of remedial alternatives. DuPont hasfound, however, that the incremental cost of evaluatingintrinsic bioremediation along with other options is rela-tively small. This incremental cost may be more thanoffset if intrinsic remediation is chosen over a technology
129

that would be more expensive to implement. This con-clusion is based on using a “template” site to perform anengineering cost estimate. The template site has thefollowing characteristics:
• 10-acre site
• Contaminant: tetrachloroethene (PCE)
• Concentration: 10 mg/L
• 20 monitoring wells, sampled twice a year for 30 years
• Completed remedial investigation
• Long-term monitoring costs are brought to presentcosts using an inflation rate of 3 percent and a dis-count rate of 12 percent, the corporate cost of capital
Much of the investigation cost is the same regardless ofthe remedy chosen. Therefore, only incremental costsare considered in this analysis. The incremental presentcost of an intrinsic remediation demonstration abovethat of a standard investigation and long-term monitor-ing is approximately $100,000 over 30 years. The sim-plest pump-and-treat remedy (air stripping and vapor-phase granulated activated carbon) has a present costof $2.1 million over 30 years. A comparable intrinsicremediation remedy has a present cost of $900,000.(See Table 2 for cost details.) If intrinsic remediation isprotective, the saving is $1.2 million.
The Average Plume
DuPont recently surveyed over 50 sites and plumes toget a statistical picture of how and where intrinsic biode-gradation is operating. The survey looked for evidenceof reductive dehalogenation at these sites, which wereprimarily DuPont Resource Conservation and RecoveryAct and Comprehensive Environmental Response,Compensation, and Liability Act sites. Some outsidesites were included where data were available, as wellas several sites clearly described in the scientific litera-ture. To be included, the sites needed to have eitherSW846 Method 8240 analyses for VOCs, good geologi-cal delineation, and credible isoconcentration maps, orto be thoroughly described in the technical literature.
Biodegradation
The sites selected for analysis were ones at which theoriginal contaminants could be identified; thus, field datacould be examined for the biodegradation byproducts ofthose contaminants. The presence of these byproductsindicates activity by naturally occurring bacteria. Forexample, if most of the dichloroethene (DCE) present inground water is the cis-1,2-DCE isomer, that is conclu-sive evidence of the biological degradation of trichlo-roethene (TCE). The biodegradation results arepresented in Table 3. The data showed that:
• 88 percent of the sites have bacteria that can biode-grade PCE and TCE to DCE.
Table 1. Tiered Site Characteristics
Tier 1 (Easy Sites) Tier 2 (Intermediate Sites) Tier 3 (Difficult Sites)
Simple hydrogeology Moderately complex hydrogeology Hydrogeology complex
Single parent compound Few contaminants Confusing mixture
Size known (areal extent) Plume size questionable Large plume
Source and mass known Source and mass not well defined Very large or inaccessible source
Highest ground-water concentration < 10 mg/L Highest ground-water concentration < 100 mg/L Mobil DNAPLs
Static or shrinking plume Plume-size trend not known Growing plume or trend not known
Bioindicators obvious Some bioindicators No bioindicators
Receptors very far away Receptors are “not too far” Receptors close or affected
Analytical model sufficient Flow-and-transport model needed Needs a detailed fate-and-transportmodel
Table 2. Present Cost of Intrinsic Remediation Versus Investigation and Long-Term Monitoring
Cost Element
Investigationand Long-TermMonitoring Cost
IntrinsicRemedy
Cost
Incremental Cost—Intrinsic
Versus Investigation and Monitoring
SimplePump-and-Treat Cost
Incremental Cost—Pump-and-TreatVersus Intrinsic
Up front $95,000 $35,000 $40,000 $650,000 $515,000
Annual $62,000 $68,000 $6,000 $35,000 $67,000
Present cost (30 years) $800,000 $900,000 $100,000 $2,100,000 $1,200,000
Note: 12 percent discount rate, 3 percent annual inflation.
130

• 75 percent of the sites have bacteria that can biode-grade DCE to vinyl chloride (VC) or ethylene.
Some sites may not have enough bioavailable substrateto complete the degradation reactions. Insufficient sub-strate should always be suspected at sites where biode-gradation stops at either TCE or VC. Sites without thefull bacterial population needed for complete degrada-tion would be expected to show either no degradationor degradation that stops at DCE.
Half-Lives
Two simple methods were used to estimate half-lives.The first method, developed by Buscheck et al. (2), is asemilog plot of individual well analyses versus time oftransport. The second method is a simple graphicalextrapolation. The graphical extraction method assumesthat the plume is at steady state so that dilution, disper-sion, and sorption factors are constant; measures con-centration declines along the centerline of plumes onhigh-quality isoconcentration maps; and calculates thetime for the water package to move each of those dis-tances. The results of the two methods show goodagreement, with the graphical extraction method givingsomewhat longer half-lives. These data suggest that thekey factor in evaluating intrinsic remediation should bethe time of residence of contaminants in a plume beforeit reaches a potential receptor, if it ever does. The aver-age solvent half-lives are shown in Table 4.
Intrinsic Remediation Capacity
As a further criteria, it may be advantageous to calculatethe assimilative capacity of the aquifer, which is definedas its capacity to biodegrade a contaminant. At many sites,there appears to be no synthetic source of substrate. Thisimplies that natural organic material in the aquifer is
supplying electrons to drive the biodegradation reac-tions. Based on this assumption, one can calculate theamount of chlorinated solvent that an aquifer can biode-grade, although this estimate can only apply to sites atwhich the soils contain bacteria that can degrade chlo-rinated solvents.
Here is an example calculation. Typical aquifers containbetween 0.3 percent and 1 percent natural organic carb-on. This equals 8 to 28 pounds of organic carbon percubic yard of soil at 2,800 pounds of soil per cubic yard.A conservative assumption is that the aquifer containsonly 0.1 percent TOC and only 10 percent of the naturalorganic carbon is bioavailable. If bacteria can use only10 percent of the bioavailable organic carbon as food forbiodegrading chlorinated solvents, 0.03 pounds oforganic carbon per cubic yard (1 percent of the totalcarbon present) is used as food in chlorocarbon degra-dation. Electron balance indicates that bacteria use 0.25to 0.50 pounds of organic carbon to degrade 1 pound ofsolvents (3). Therefore, each cubic yard of this hypo-thetical aquifer has the capacity to biodegrade at least0.06 pounds of chlorinated solvent.
The plume that the RTDF is studying at Dover Air ForceBase in Delaware involves approximately 7.5 millioncubic yards of aquifer. Using the previous estimate, bacteriain this aquifer should be able to biodegrade a minimumof 450,000 pounds of solvents—the equivalent of 820drums of DNAPL. It is very unlikely that there are 820drums of DNAPL at Dover. Therefore, the bacteria in thisaquifer have an adequate supply of organic carbon tobiodegrade all the contaminants that are currently in it.
What About Existing Pump-and-TreatSystems?
Shutting down a pump-and-treat system to let intrinsicprocesses complete the restoration is now regarded asacceptable during hydrocarbon remediation. Benzene isthe main component of concern in most hydrocarbonplumes and is regulated at levels similar to those re-quired for VC. Why shouldn’t chlorinated solvent pump-and-treat systems be shut down at some logical pointand intrinsic remediation be allowed to finish their workas well? Many chlorinated solvent pump-and-treat sys-tems have already reached their useful lifetime for con-taminant removal.
All of the following criteria should be met before intrinsicremediation can replace an existing, operating pump-and-treat system that treats chlorinated solvents:
• It can be demonstrated that intrinsic activity is al-ready occurring in the aquifer.
• It is possible to predict how far the plume mightextend if the pump-and-treat system was not oper-ating, and it can be shown that no receptor will beaffected.
Table 3. Biodegradation Results at Survey Sites
ReactionNumber of
Sites PresentTotalSites Percentage
PCE to TCE 27 31 87
TCE to DCE 39 44 88
DCE to VC 28 37 75
VC to ethane 18 31 58a
a Ethane data often are unavailable.
Table 4. Half-Lives Calculated by Graphical Extraction
Reaction Average Half-Life (years) Number of Sites
PCE to TCE 1.20 7
TCE to DCE 1.19 15
DCE to VC 1.05 12
VC to ethane 1.22 9
131
• Intrinsic remediation is protective of human healthand the environment.
Conclusions
• Intrinsic remediation is real. It is protective whenproperly employed.
• Intrinsic biodegradation occurs at many sites. Eachbiodegradation step has an average half-life of 1 to 2years.
• The most important factors in determining the effec-tiveness of intrinsic remediation are plume residencetime and the half-lives of the sequential biodegrada-tion reactions.
• Most aquifers contain much more organic carbonthan necessary to support intrinsic bioremediation.While anthropogenic carbon may help support intrin-sic degradation, it is not essential.
• Intrinsic remediation is not a “do nothing” approach,and there is a moderate cost associated with it. Thepresent cost of an intrinsic remediation remedy is
approximately $900,000, compared with $2.1 millionfor the cheapest pump-and-treat system.
References
1. Remediation Technology Development Forum Consortium forBioremedaiation of Chlorinated Solvents. 1996. Guidance hand-book on intrinsic remeidation of chlorinated solvents. http://www.rtdf.org.
2. Buscheck, T.E., K.T. OReilly, and S.N. Nelson. 1993. Evaluationof intrinsic bioremediation at field sites. In: Proceedings of theConference on Petroleum Hydrocarbons and Organic Chemicalsin Ground Water: Prevention, Detection, and Restoration, Hous-ton, TX. pp. 367-381.
3. De Bruin, W.P., M.J.J. Kotterman, M.A. Posthumus, G. Schraa,and A.J.B. Zehnder. 1992. Complete biological reductive transfor-mation of tetrachloroethene to ethane. Appl. Environ. Microbiol.58(6):1966-2000.
Additional Reading
Klecka, G.M., J.T. Wilson, E.J. Lutz, N. Klier, R. West, J. Davis, J.Weaver, D. Kampbell, and B. Wilson. 1996. Intrinsic remediation ofchlorinated solvents in groundwater. Paper presented at the IBC Con-ference on Intrinsic Remediation, London, UK.
132

Environmental Chemistry and the Kinetics of Biotransformation of Chlorinated Organic Compounds in Ground Water
John T. Wilson, Donald H. Kampbell, and James W. WeaverU.S. Environmental Protection Agency, National Risk Management Research Laboratory,
R.S. Kerr Research Center, Ada, Oklahoma
Introduction
Responsible management of the risk associated withchlorinated solvents in ground water involves a realisticassessment of the natural attenuation of these com-pounds in the subsurface before they are captured byground-water production wells or before they dischargeto sensitive ecological receptors. The reduction in risk islargely controlled by the rate of the biotransformation ofthe chlorinated solvents and their metabolic daughterproducts. These rates of biotransformation are sensitiveparameters in mathematical models describing the trans-port of these compounds to environmental receptors.
Environmental Chemistry ofBiodegradation of Chlorinated Solvents
[This section is designed specifically for engineers andmathematical modelers who have little or no chemistrybackground; other readers may wish to proceed directlyto the next section.]
The initial metabolism of chlorinated solvents such astetrachloroethylene, trichloroethylene, and carbon tetra-chloride in ground water usually involves a biochemicalprocess described as sequential reductive dechlorina-tion. This process only occurs in the absence of oxygen,and the chlorinated solvent actually substitutes for oxy-gen in the physiology of the microorganisms carrying outthe process.
The chemical term “reduction” was originally derivedfrom the chemistry of smelting metal ores. Ores are chemi-cal compounds of metal atoms coupled with other materi-als. As the ores are smelted to the pure element, theweight of the pure metal are reduced compared with theweight of the ore. Chemically, the positively charged metalions receive electrons to become the electrically neutralpure metal. Chemists generalized the term “reduction”
to any chemical reaction that added electrons to anelement. In a similar manner, the chemical reaction ofpure metals with oxygen results in the removal of elec-trons from the neutral metal to produce an oxide. Chem-ists have generalized the term “oxidation” to refer to anychemical reaction that removes electrons from a mate-rial. For a material to be reduced, some other materialmust be oxidized.
The electrons required for microbial reduction of chlorin-ated solvents in ground water are extracted from nativeorganic matter, from other contaminants such as thebenzene, toluene, ethylene, and xylene compounds re-leased from fuel spills, from volatile fatty acids in landfillleachate, or from hydrogen produced by the fermenta-tion of these materials. The electrons pass through acomplex series of biochemical reactions that support thegrowth and function of the microorganisms that carry outthe process.
To function, the microorganisms must pass the electronsused in their metabolism to some electron acceptor. Thisultimate electron acceptor can be dissolved oxygen,dissolved nitrate, oxidized minerals in the aquifer, dis-solved sulfate, a dissolved chlorinated solvent, or carb-on dioxide. Important oxidized minerals used as electronacceptors include iron and manganese. Oxygen is re-duced to water, nitrate to nitrogen gas or ammonia,iron(III) or ferric iron to iron(II) or ferrous iron, manga-nese(IV) to manganese(II), sulfate to sulfide ion, chlo-rinated solvents to a compound with one less chlorineatom, and carbon dioxide to methane. These processesare referred to as aerobic respiration, nitrate reduction,iron and manganese reduction, sulfate reduction, reduc-tive dechlorination, and methanogenesis, respectively.
The energy gained by the microorganisms follows thesequence listed above: oxygen and nitrate reductionprovide a good deal of energy, iron and manganese
133

reduction somewhat less energy, sulfate reduction anddechlorination a good deal less energy, and methano-genesis a marginal amount of energy. The organismscarrying out the more energetic reactions have a com-petitive advantage; as a result, they proliferate and ex-haust the ultimate electron acceptors in a sequence.Oxygen and then nitrate are removed first. When theirsupply is exhausted, then other organisms are able toproliferate, and manganese and iron reduction begins.If electron donor supply is adequate, then sulfate reduc-tion begins, usually with concomitant iron reduction,followed ultimately by methanogenesis. Ground waterwhere oxygen and nitrate are being consumed is usuallyreferred to as an oxidized environment. Water wheresulfate is being consumed and methane is being pro-duced is generally referred to as a reduced environment.
Reductive dechlorination usually occurs under sulfate-re-ducing and methanogenic conditions. Two electrons aretransferred to the chlorinated compound being reduced.A chlorine atom bonded with a carbon receives one ofthe electrons to become a negatively charged chlorideion. The second electron combines with a proton (hydro-gen ion) to become a hydrogen atom that replaces thechlorine atom in the daughter compound. One chlorineat a time is replaced with hydrogen; as a result, each
transfer occurs in sequence. As an example, tetrachlo-roethylene is reduced to trichlorethylene, then any of thethree dichloroethylenes, then to monochloroethylene(commonly called vinyl chloride), then to the chlorine-free carbon skeleton ethylene, then finally to ethane.
Kinetics of Transformation in Ground Water
Table 1 lists rate constants for biotransformation oftetrachloroethylene (P.E.), trichloroethylene (TCE),cis-dichloroethylene (cis-DCE), and vinyl chlorideextrapolated from field-scale investigations. In somecases, a mathematical model was used to extract a rateconstant from field data; however, many of the rateconstants were calculated by John Wilson from publish-ed raw data. In several cases, the primary authors didnot choose to calculate a rate constant or felt that theirdata could not distinguish degradation from dilution ordispersion.
The data were collected or estimated to build a statisticalpicture of the distribution of rate constants, in support ofa sensitivity analysis of a preliminary assessment usingpublished rate constants. They serve as a point of ref-erence for “reasonable” rates of attenuation; applyingthem to other sites without proper site-specific validationis inappropriate.
Table 1. Apparent Attenuation Rate Constants (Field Scale Estimates)
Location ReferenceDistance
From SourceTime From
SourceResidence
Time TCE cis-DCEVinyl
Chloride
(meters) (years) (years) Apparent Loss Coefficient (1/year)
St. Joseph, MI 1-3 130 to 390390 to 550550 to 855240 to 460
3.2 to 9.7 9.7 to 12.512.5 to 17.9
2.2 to 4.2
6.52.85.42.0
0.381.3 0.931.4
0.500.833.1
Produced
0.180.882.2
Produced
PicatinnyArsenal, NJ
4, 5 320 to 460240 to 320 0 to 250
2.9 to 4.22.2 to 2.90.0 to 2.3
1.30.7
1.2 Produced1.6 0.5
Produced
Sacramento,CA 6 70 to 300 0.5 to 2.3 1.8 1.1 0.86 3.1
Necco Park, NY 7 0 to 570 0 to 660
0.0 to 1.60.0 to 1.8
1.61.8
0.7 0.7
PlattsburghAFB, NY
Weidemeider,this volume
0 to 300300 to 380380 to 780
0.0 to 6.76.7 to 8.6
8.6 to 17.7
6.71.99.1
1.3 0.23
Absent
Produced0.6 0.07
Produced1.160.47
Tibbitt’s Road, NH B. Wilson,this volume
0 to 24 0 to 40 0 to 55
0.0 to 2.40.0 to 6.40.0 to 10
2.46.4
10
0.210.420.73
Produced0.68
> 0.73
San FranciscoBay Area, CA
8 4.4 5.11
Perth, Australia 9 0 to 600 0.0 to 14 0.32
Eielson AFB, AK 10 0.732.3
Not identified 11 0.8 0.8 0.8
Cecil FieldNAS, FL
Chapelle,this volume
0 to 140 0.0 to 1.2 1.2 3.3 to 7.3 3.3 to 7.3
134

The estimates of rates of attenuation tend to clusterwithin an order of magnitude. Figure 1 compares therates of removal of TCE in those plumes that demon-strated evidence of biodegradation. Most of the first-or-der rates are very close to 1.0 per year, equivalent to ahalf life of 8 months. Table 1 also reveals that the rateof removal of P.E., TCE, and cis-DCE, and vinyl chlorideare similar; they vary by little more than one order ofmagnitude.
Table 2 lists first-order and zero-order rate constantsdetermined in laboratory microcosm studies. The ratesof removal in the laboratory microcosm studies are simi-lar to estimates of removal at field scale for TCE, cis-DCE, and vinyl chloride. Rates of removal of1,1,1-trichloroethane (1,1,1-TCA) are similar to the ratesof removal of the chlorinated alkenes.
Summary
The rates of attenuation of chlorinated solvents and theirless chlorinated daughter products in ground water areslow as humans experience time. If concentrations ofchlorinated organic compounds near the source are inthe range of 10,000 to 100,000 micrograms per liter,then a residence time in the plume on the order of adecade or more will be required to bring initial con-centrations to current maximum contaminant levels for
drinking water. Biodegradation as a component of natu-ral attenuation can be protective of ground-water qualityin those circumstances where the travel time of a plumeto a receptor is long. In many cases, it will be necessaryto supplement the benefit of natural attenuation withsome sort of source control or plume management.
Figure 1. The first-order rate constant for biotransformation ofTCE in a variety of plumes of contamination in groundwater.
Table 2. Apparent Attenuation Rate Constants From Laboratory Microcosm Studies
Location ofMaterial Reference
DistanceFromSource
TimeFromSource
IncubationTime TCE cis-DCE
VinylChloride 1,1,1-TCA
(meters) (years) (years)Apparent First-Order Loss (1/year)
Apparent Zero OrderLoss ((µµg ⁄⁄ L∗∗day))
Laboratory Microcosm Studies Done on Material From Field-Scale Plumes
PicatinnyArsenal, NJ
1213
240320460
2.22.94.2
0.50.50.5
0.640.420.21
0.529.43.1
St. Joseph, MI 14 0.12, 0.077 1.8, 1.2
Traverse City, MI 15 300 1.8 1.8
Tibbitts Road, NH 16 At Source 4.8
Laboratory Microcosm Studies Done on Material Not Previously Exposed to the Chlorinated Organic Compound
NormanLandfill, OK
17 Aerobicmaterial
4.210
18 Sulfatereducing
1.281.62 1.75
Methan-ogenic
1.201.65 1.42
FL 16 Reducing 3.6
19 Reducing 0.012
135
References 1. Semprini, L., P.K. Kitanidis, D.H. Kampbell, and J.T. Wilson. An-
aerobic Transformation of chlorinated aliphatic hydrocarbons ina sand aquifer based on spatial chemical distributions. WaterResour. Res. 31(4):1051-1062.
2. Weaver, J.W., J.T. Wilson, D.H. Kampbell, and M.E. Randolph.1995. Field derived transformation rates for modeling naturalbioattenuation of trichloroethene and its degradation products. In:Proceedings: Next Generation Environmental Models and Com-putational Methods, August 7-9, Bay City, MI.
3. Wilson, J.T., J.W. Weaver, D.H. Kampbell. 1994. Intrinsic biore-mediation of TCE in ground water at an NPL site in St. Joseph,Michigan. In: U.S. EPA. Symposium on Natural Attenuation ofGround Water, Denver, CO, August 30-September 1. EPA/600/R-94/162. pp. 116-119.
4. Ehlke, T.A., B.H. Wilson, J.T. Wilson, and T.E. Imbrigiotta. 1994.In-situ biotransformation of trichloroethylene and cis-1,2-dichlo-roethylene at Picatinny Arsenal, New Jersey. In: Morganwalp,D.W., and D.A. Aronson, eds. Proceedings of the U.S. GeologicalSurvey Toxic Substances Hydrology Program, Colorado Springs,Colorado, September 20-24, 1993. Water Resources Investiga-tions Report 94-4014. In press.
5. Martin, M., and T.E. Imbrigiotta. 1994. Contamination of groundwater with trichloroethylene at the Building 24 site at PicatinnyArsenal, New Jersey. In: U.S. EPA. Symposium on Natural At-tenuation of Ground Water. Denver, CO, August 30-September1. EPA/600/R-94/162. pp. 109-115.
6. Cox, E., E. Edwards, L. Lehmicke, and D. Major. 1995. Intrinsicbiodegradation of trichloroethylene and trichloroethane in a se-quential anaerobic-aerobic aquifer. In: Hinchee, R.E., J.T. Wilson,and D.C. Downey, eds. Intrinsic bioremediation. Columbus, OH:Battelle Press. pp. 223-231.
7. Lee, M.D., P.F. Mazierski, R.J. Buchanan, Jr., D.E. Ellis, and L.S.Sehayek. 1995. Intrinsic and in situ anaerobic biodegradation ofchlorinated solvents at an industrial landfill. In: Hinchee, R.E., J.T.Wilson, and D.C. Downey, eds. Intrinsic bioremediation. Colum-bus, OH: Battelle Press. pp. 205-222.
8. Buscheck, T., and K. O’Reilly. 1996. Intrinsic anaerobic biodegra-dation of chlorinated solvents at a manufacturing plant. Abstractpresented at the Conference on Intrinsic Remediation of Chlorin-ated Solvents, Salt Lake City, UT, April 2. Columbus, OH: BattelleMemorial Institute.
9. Benker, E., G.B. Davis, S. Appleyard, D.A. Berry, and T.R. Power.1994. Groundwater contamination by trichloroethene (TCE) in aresidential area of Perth: Distribution, mobility, and implications formanagement. In: Proceedings of the Water Down Under 94, 25thCongress of IAH, Adelaide, South Australia, November 21-25.
10. Gorder, K.A., R.R. Dupont, D.L. Sorensen, and M.W. Kem-blowski. 1996. Intrinsic remediation of TCE in cold regions. Ab-stract presented at the Conference on Intrinsic Remediation ofChlorinated Solvents, Salt Lake City, UT, April 2. Columbus, OH:Battelle Memorial Institute.
11. De, A., and D. Graves. 1996. Intrinsic bioremediation of chlorin-ated aliphatics and aromatics at a complex industrial site. Ab-stract presented at the Conference on Intrinsic Remediation ofChlorinated Solvents, Salt Lake City, UT, April 2. Columbus, OH:Battelle Memorial Institute.
12. Ehlke, T.A., T.E. Imbrigiotta, B.H. Wilson, and J.T. Wilson. 1991.Biotransformation of cis-1,2-dichloroethylene in aquifer materialfrom Picatinny Arsenal, Morris County, New Jersey. In: U.S. Geo-logical Survey Toxic Substances Hydrology Program—Proceed-ings of the Technical Meeting, Monterey, CA, March 11-15. WaterResources Investigations Report 91-4034. pp. 689-697.
13. Wilson, B.H., T.A. Ehlke, T.E. Imbigiotta, and J.T. Wilson. 1991.Reductive dechlorination of trichloroethylene in anoxic aquifermaterial from Picatinny Arsenal, New Jersey. In: U.S. GeologicalSurvey Toxic Substances Hydrology Program—Proceedings ofthe Technical Meeting, Monterey, CA, March 11-15. Water Re-sources Investigations Report 91-4034. pp. 704-707.
14. Haston, Z.C., P.K. Sharma, J.N.P. Black, and P.L. McCarty. 1994.Enhanced reductive dechlorination of chlorinated ethenes. In:U.S. EPA. Proceedings of the EPA Symposium on Bioremediationof Hazardous Wastes: Research, Development, and Field Evalu-ations. EPA/600/R-94/075. pp. 11-14.
15. Wilson, B.H., J.T. Wilson, D.H. Kampbell, B.E. Bledsoe, and J.M.Armstrong. 1990. Biotransformation of monoaromatic and chlo-rinated hydrocarbons at an aviation gasoline spill site. Geomicro-biol. J. 8:225-240.
16. Parsons, F., G. Barrio Lage, and R. Rice. 1985. Biotransformationof chlorinated organic solvents in static microcosms. Environ.Toxicol. Chem. 4:739-742.
17. Davis, J.W., and C.L. Carpenter. 1990. Aerobic biodegradationof vinyl chloride in groundwater samples. Appl. Environ. Microbiol.56(12):3878-3880.
18. Klecka, G.M., S.J. Gonsior, and D.A. Markham. 1990. Biologicaltransformations of 1,1,1-trichloroethane in subsurface soils andground water. Environ. Toxicol. Chem. 9:1437-1451.
19. Barrio-Lage, G.A., F.Z. Parsons, R.M. Narbaitz, and P.A. Lorenzo.1990. Enhanced anaerobic biodegradation of vinyl chloride inground water. Environ. Toxicol. Chem. 9:403-415.
136

Future Vision: Compounds With Potential for Natural Attenuation
Jim SpainU.S. Air Force Armstrong Laboratory, Tyndall Air Force Base, Florida
Introduction
Attenuation of natural organic compounds, such asthose present in hydrocarbon fuels, is predictable be-cause the responsible microorganisms are ubiquitous insoil and the subsurface. Bacteria able to use hydrocar-bons as their source of carbon and energy under eitheraerobic or anaerobic conditions have a tremendous se-lective advantage over other members of the microbialcommunity. Therefore, the process can be self-sustain-ing and is limited only by the presence of electron ac-ceptors or inorganic nutrients.
Bacteria able to grow at the expense of chlorinated aliphaticcompounds are not widely distributed; natural attenu-ation of such compounds is consequently less predict-able. The use of a chlorinated compound as a terminalelectron acceptor (chlororespiration or dehalorespira-tion) can yield energy and thus provides a selectiveadvantage to a limited range of anaerobic bacteria (1).Many of the transformations of chloroaliphatic com-pounds, such as trichloroethylene, are co-metabolic andyield no advantage to the bacteria that catalyze thereactions. In fact, co-metabolism can select against theorganism because of the wasting of energy and productionof toxic metabolites.
Between the extremes of readily degradable hydrocar-bons and chlorinated aliphatic compounds that serveonly as electron acceptors are many other syntheticorganic compounds that can provide sources of carbonand energy for bacteria. This paper describes com-pounds that are known to be biodegradable and havethe potential for natural attenuation in the field. Somesynthetic chemicals are expected to be readily suscep-tible to natural attenuation, others are degraded at alimited number of sites, and some show only a limitedpotential. Where possible, recent review articles ratherthan primary literature will be cited. More detailed infor-mation on many of the compounds is also available in arecent book that provides an excellent analysis of thepotential for biodegradation (2).
The first question to be asked when considering thepotential for natural attenuation is whether biodegrada-tion of the chemical contaminant has been reported. Thequestion could be phrased, “Does the biology exist?”Biodegradation of some of the compounds has beenstudied extensively under field conditions. Transforma-tion of others has only recently been discovered inlaboratory systems or waste streams. Such laboratorystudies should not be ignored because the processesdiscovered in such systems are catalyzed by bacteriaobtained from the field. Laboratory studies are essentialfor revealing the mechanisms of the reactions and theconditions required for the process. They can also de-termine whether the process provides energy or nutri-ents—and thus a selective advantage—to the bacteriathat catalyze the reactions.
The second question is whether the activity of the nec-essary specific organisms is present at the site underconsideration. A considerable amount of effort has beenspent on enumerating and identifying bacteria at hydro-carbon-contaminated sites under consideration forbioremediation. Because such bacteria are ubiquitous,it is much more useful to assess their activity as re-vealed by degradation of the hydrocarbons or transfor-mation of electron acceptors. The biology can beassumed to be present but limited by other factors. Incontrast, bacteria able to degrade specific syntheticchemicals cannot be assumed to be widely distributedin the field. Detection of bacteria able to grow on specificcompounds in contaminated sites and failure to detectthem in nearby uncontaminated areas can be taken asstrong evidence for natural attenuation. Absence of bac-teria able to catalyze the degradation of compoundsknown to be biodegradable could provide an opportunityfor bioaugmentation, a strategy that has earned a poorreputation because of misapplication in the past.
The third question is whether conditions appropriate fornatural attenuation exist or can be created at the site.Issues of electron donors and acceptors, bioavailability,mass transfer, contaminant mixtures, and concentration
137
must be resolved. A good understanding of the biode-gradation process, including reaction stoichiometry andkinetics, is essential for evaluation of the potential fornatural attenuation. Fortunately, such understanding ex-ists for a wide range of synthetic chemical contaminants.
Chloroaromatic Compounds
Bacteria able to degrade all but the most complex chlo-roaromatic compounds have been discovered duringthe past 20 years. Polychlorobenzenes, including hex-achlorobenzene, can be sequentially dehalogenated tomonochlorobenzene under methanogenic conditions insoil slurries (3). Reductive dehalogenation of chloroben-zene has not been reported, but chlorotoluenes aredehalogenated to toluene in the above methanogenicsystems, and it seems likely that chlorobenzene couldserve as a substrate for reductive dehalogenation.
Chlorobenzenes up to and including tetrachlorobenzeneare readily biodegraded under aerobic conditions. Bacteriaable to grow on chlorobenzene (4), 1,4-dichlorobenzene(4-6), 1,3-dichlorobenzene (7), 1,2-dichlorobenzene (8),1,2,4-trichlorobenzene (9), and 1,2,4,5-tetrachlorobenzene(10) have been isolated and their metabolic pathwaysdetermined. The pathways for aerobic degradation areremarkably similar and lead to the release of the halogensas hydrochloride (HCl).
Chlorobenzenes are very good candidates for naturalattenuation under either aerobic or anaerobic condi-tions. Aerobic bacteria able to grow on chlorobenzenehave been detected at a variety of chlorobenzene-con-taminated sites but not at uncontaminated sites (11).This provides strong evidence that the bacteria are se-lected for their ability to derive carbon and energy fromchlorobenzene degradation in situ. Removal of multiplehalogens as HCl consumes a large amount of alkalinityand produces a considerable drop in the pH of unbuf-fered systems, which could lead to a loss of microbialactivity at some sites.
Chlorophenols and chlorobenzoates are dehalogenatedunder anaerobic conditions in sediments and subsur-face material (12-13). In some instances, the dehalo-genation clearly yields energy for the growth of specificbacteria. In other examples, the dehalogenation is spe-cific and enriched in the community but has not beenrigorously linked to energy production. The addition ofsmall fatty acids or alcohols as either electron donors orsources of carbon can enhance the process of reductivedehalogenation. Aerobic pathways for the degradationof chlorophenols and chlorobenzoates are initiatedby an oxygenase catalyzed attack on the aromaticring and the subsequent removal of the halogenafter ring fission or hydrolytic replacement of thehalogen with a hydroxyl group. Bacteria able togrow on chlorophenols and chlorobenzoates arewidely distributed and are readily enriched from a variety
of sources, which indicates a high potential for naturalattenuation. The chlorophenols are unusual among thesynthetic compounds discussed here, however, as theycan be very toxic to microorganisms. They are oftenused as biocides, and, therefore, high concentrationscan dramatically inhibit biodegradation. Inoculation withspecific bacteria has been helpful in overcoming toxic-ity and stimulating degradation of chlorophenols (12).
Pentachlorophenol deserves special consideration be-cause it has been widely used as a wood preservativeand has been released into the environment through-out the world. Reductive dehalogenation of pentachlo-rophenol under methanogenic conditions can lead tomineralization (12). Aerobic bacteria catalyze the re-placement of the chlorine in the 4 position by a hy-droxyl group to form tetrachlorohydroquinone, andsubsequent reductive dehalogenations lead to the for-mation of ring fission substrates. Bacteria able to de-grade pentachlorophenol are widely distributed, andboth experimental and full-scale bioremediation projectshave been successful in field applications (12). In someinstances, the addition of selected strains has beenhelpful, whereas in others indigenous strains have beenused. Wood treatment facilities are typically contami-nated with complex mixtures of organic compounds, soinvestigations of toxicity must be conducted for each siteunder consideration. Natural attenuation of pentachlo-rophenol seems to be possible because specific bacte-ria able to use it as a growth substrate are enrichedat contaminated sites. Rates seem to be low at the sitesinvestigated to date, however, due to the toxicity andbioavailability of the pentachlorophenol.
Polychlorinated biphenyls (PCB) have been studied ex-tensively because of their stability, toxicity, and bioaccu-mulation potential (14). Anaerobic transformation ofPCB is catalyzed by bacteria in aquatic sediment froma wide range of both contaminated and uncontaminatedsites. Higher activity in contaminated sites suggests thatthe dehalogenation reactions provide a selective advan-tage to the microbial population, which indicates thepotential for significant natural attenuation. Studies haveclearly demonstrated that natural attenuation of PCB istaking place in anaerobic sediments at significant rates,with methanogenic conditions in freshwater sedimentsapparently providing the highest rates of reductive de-halogenation. Dehalogenation converts the more highlychlorinated congeners to less chlorinated products con-taining one to four chlorine. Complete dehalogenationdoes not occur, but the depletion of the more highlychlorinated congeners dramatically reduces not only thetoxicity and carcinogenicity, but also the bioaccumula-tion of the mixture.
A variety of different dechlorination patterns have beenidentified as a function of the microbial community in-volved. The patterns are constant within a given microbial
138

community or enrichment, which supports the premisethat dehalogenation provides a selective advantage tothe organisms involved. The results also suggest that awide range of different bacteria have the ability to deha-logenate PCB. The electron donors for the dehalogena-tion in sediment are unknown. The addition ofexogenous carbon sources does not stimulate the reac-tion. In contrast, “priming” the mixtures with low levelsof bromobiphenyl or specific isomers of tetrachloro-biphenyl (15) seems to selectively enrich a populationof PCB-dechlorinating bacteria and dramatically stimu-late the dechlorination of the other congeners.
The lower chlorinated PCB congeners, whether part ofthe original Arochlor mixture or derived from reductivedehalogenation, are biodegraded by aerobic bacteria(16). The initial attack is catalyzed by a 2,3- or 3,4-di-oxygenase, followed by a sequence of reactions thatlead to ring cleavage and the accumulation of chlo-robenzoates which are readily degraded by a variety ofbacteria. The enzymes that oxidize PCB are producedby bacteria grown on biphenyl, and adding biphenyl toslurry-phase reactors stimulates the growth and activityof PCB degraders. Such stimulation has been shown tobe effective in the field (17). There is also good evidencethat aerobic PCB degradation is taking place in contami-nated river sediments (18).
Clearly, reductive dechlorination is ongoing at a widerange of PCB contaminated sites. The strategy of an-aerobic dehalogenation followed by aerobic degradationseems to be particularly effective with PCB whether inan engineered system or in natural systems (e.g., duringresuspension of anaerobic sediments). To date the com-plete biodegradation of PCB is slow and difficult topredict or control in the field. Several new strategies,including construction of novel strains, may increase thepotential for effective PCB biodegradation.
Chloroaliphatic Compounds
Several good reviews have recently appeared on thebiodegradation of small (one- and two-carbon) chlo-roaliphatic compounds (19-21); therefore, this paperbriefly mentions only some aspects that might otherwisebe overlooked. Among the one- and two-carbon chlorin-ated compounds, the more highly chlorinated moleculesare subject to reductive dehalogenation under a varietyof conditions. Thus, carbon tetrachloride can be se-quentially reduced to chloroform and dichloromethane.Similarly, perchloroethylene can be reduced to ethylenevia trichloroethylene, dichloroethylene, and vinyl chlo-ride. The degradation of chloroethylenes is discussed inconsiderable detail by Gossett and Zinder (this volume).Most of the work to date has focused on mixed microbialcultures that use chlorinated solvents fortuitously aselectron acceptors. Such activity is very widely distrib-uted in anaerobic ecosystems and catalyzes the slow and
often partial reduction of chlorinated contaminants. Incontrast, some microbial communities and a few iso-lated strains can derive energy from the use of chlorin-ated compounds as terminal electron acceptors(Gossett and Zinder, this volume). Such processes aremuch faster than the co-metabolic processes becausethey provide a selective advantage for the bacteria andare self-sustaining.
Several chloroaliphatic compounds can serve as growthsubstrates for aerobic bacteria. The more chlorinatedcompounds such as trichloroethylene and chloroform donot provide energy and carbon for aerobic growth, al-though they can be degraded co-metabolically. In con-trast, methylene chloride can support the growth of bothanaerobes (22) and aerobes (20). 1,2-Dichloroethane(23) and vinyl chloride (20) similarly can be readilydegraded by aerobic bacteria. Any of these compoundsthat serve as growth substrates would be excellent can-didates for natural attenuation where oxygen is present.Aerobic mineralization of the related molecule, ethylenedibromide, has been reported in soil (24), but the distri-bution of the responsible bacteria and the correspondingability to predict degradation are not well understood.
Nitroaromatic Compounds
The literature on biodegradation of nitroaromatic com-pounds has been reviewed recently (25). Nitroaromaticcompounds are subject to reduction of the nitro groupsin the environment under either aerobic or anaerobicconditions. Co-metabolic reduction does not lead tocomplete degradation in most instances and could beconsidered nonproductive for purposes of natural at-tenuation. In contrast, aerobic bacteria able to grow onnitrobenzene, nitrotoluenes, dinitrotoluenes, dinitroben-zene, nitrobenzoates, and nitrophenols have been iso-lated from a variety of contaminated sites, which suggeststhat natural attenuation is taking place at such sites. Thesimple nitroaromatic compounds (not including trinitro-toluene) can be considered excellent candidates fornatural attenuation. Some of the compounds, including3-nitrophenol, nitrobenzene, 4-nitrotoluene, and 4-ni-trobenzoate, are degraded via catabolic pathways thatinvolve a partial reduction of the molecule prior to oxy-genative ring fission. The pathways minimize the use ofmolecular oxygen and are particularly well suited foroperation in the subsurface, where oxygen is limiting.
Mixtures of the isomeric nitro compounds can be prob-lematic for microbial degradation. For example, the in-dustrial synthesis of polyurethane produces largeamounts of 2,4- and 2,6-dinitrotoluene in a ratio of fourto one. Bacteria able to grow on 2,4-dinitrotoluene havebeen studied extensively. Unfortunately, 2,6-dinitrotolu-ene inhibits the degradation of 2,4-dinitrotoluene andmay prevent natural attenuation. Bacteria able to growon 2,6-dinitrotoluene have been isolated recently (26),
139

and insight about the metabolic pathway might allowbetter prediction of the mixture’s degradation.
Ketones
Acetone and other ketones are not xenobiotic com-pounds, but most of the current production is via syn-thetic routes. They are readily biodegraded by bothaerobic and anaerobic (27) bacteria in soil and have avery high potential for natural attenuation.
Methyl- tert -butyl Ether
Gasoline oxygenates such as ethanol, methyl-tert-butylether (MTBE), and tert-butyl alcohol are used extensivelyas octane enhancers in unleaded gasoline. The etherbond of MTBE makes it particularly resistant to biodegra-dation. Its water solubility, low volatility, and high concen-trations in gasoline (up to 15 percent) create concernsabout its behavior in the subsurface.
Preliminary studies indicate that it behaves almost as aconservative tracer in gasoline-contaminated sites.1
Mixed cultures able to grow on MTBE have been en-riched from refinery and chemical plant waste treatmentsystems (24),2 so bacteria clearly can successfully at-tack the ether bond. The degradation rates are slow,however, and there is no evidence that the bacteria arewidely distributed in soil. MTBE and other oxygenatescontaining ether bonds biodegrade very slowly, if at all,under anaerobic conditions (28). At present, eventhough the biological capability for MTBE degradation isknown to exist, the potential for natural attenuation ofMTBE seems low. The problem is sufficiently importantto merit additional study, perhaps involving extensiveacclimation of soil communities or bioaugmentation. Theavailable evidence indicates that tert-butyl alcohol ismuch more readily degradable than MTBE under aerobicor anaerobic conditions.
Nitrate Esters
A variety of nitrate esters, including glycerol trinitrate,pentaerythritol tetranitrate, and nitrocellulose, havebeen used extensively as explosives. Recent studiesindicate that the nitrate esters can be degraded bybacteria from a variety of sources (29, 30). Bacterialmetabolism releases nitrite, which can serve as a nitro-gen source and yield a selective advantage for theorganisms. The biodegradation of nitrate esters hasonly recently been studied extensively, and little isknown about degradation in the environment. Recentlaboratory results strongly suggest that natural attenu-ation is possible, but more information is needed on thebioavailability, toxicity, and kinetics of the process.
Pesticides
Most pesticides used in the past 20 years in the UnitedStates have been formulated to degrade in the environ-ment, and a considerable amount of information is avail-able on degradation kinetics in soil and water. The U.S.Environmental Protection Agency Risk Reduction Engi-neering Laboratory in Cincinnati, Ohio, has developedan extensive Pesticide Treatability Database that con-tains information on a variety of compounds. Many pes-ticides hydrolyze and yield compounds that serve asgrowth substrates for bacteria. For example, car-bamates, chlorophenoxyacetates, dinitrocresol, cou-maphos, atrazines, and some organophosphates serveas growth substrates for bacteria and would be goodcandidates for natural attenuation. A variety of otherpesticides are hydrolyzed by extracellular enzymes de-rived from soil bacteria but provide no advantage to theorganisms that produce the enzymes. Similarly, some ofthe organohalogen insecticides can be reductively de-halogenated but provide no advantage to specific organ-isms. Their biodegradation rates are proportional to thebiomass and activity in the soil.
Conclusion
To date, the focus of natural attenuation has been onhydrocarbon fuels and chlorinated aliphatic solvents. Awide range of synthetic chemicals released in the envi-ronment are known to be biodegradable by bacteria, andmuch is known about the processes and their require-ments. The potential for natural attenuation of biode-gradable contaminants should be considered beforemore costly and disruptive treatment options.
References 1. Mohn, W.W., and J.M. Tiedje. 1992. Microbial reductive dehalo-
genation. Microbiol. Rev. 56:482-507.
2. Young, L.Y., and C.E. Cerniglia, eds. 1995. Microbial transforma-tion and degradation of toxic organic chemicals. New York, NY:Wiley-Liss.
3. Ramanand, K., M.T. Balba, and J. Duffy. 1993. Reductive deha-logenation of chlorinated benzenes and toluenes under methano-genic conditions. Appl. Environ. Microbiol. 59:3266-3272.
4. Reineke, W., and H.-J. Knackmuss. 1984. Microbial metabolismof haloaromatics: Isolation and properties of a chlorobenzene-de-grading bacterium. Eur. J. Appl. Microbiol. Biotechnol. 47:395-402.
5. Schraa, G., M.L. Boone, M.S.M. Jetten, A.R.W. van Neerven, P.J.Colberg, and A.J.B. Zehnder. 1986. Degradation of 1,4-dichlo-robenzene by Alcaligenes sp. strain A175. Appl. Environ. Micro-biol. 52:1374-1381.
6. Spain, J.C., and S.F. Nishino. 1987. Degradation of 1,4-dichlo-robenzene by a Pseudomonas sp. Appl. Environ. Microbiol.53:1010-1019.
7. de Bont, J.A.M., M.J.A.W. Vorage, S. Hartmans, and W.J.J. vanden Tweel. 1986. Microbial degradation of 1,3-dichlorobenzene.Appl. Environ. Microbiol. 52:677-680.
1 Weaver, J. 1996. Personal communication with the author.
2 Cowan, R. 1996. Personal communication with the author.
140

8. Haigler, B.E., S.F. Nishino, and J.C. Spain. 1988. Degradation of1,2-dichlorobenzene by a Pseudomonas sp. Appl. Environ. Mi-crobiol. 54:294-301.
9. van der Meer, J.R., W. Roelofsen, G. Schraa, and A.J.B. Zehnder.1987. Degradation of low concentrations of dichlorobenzenesand 1,2,4-trichlorobenzene by Pseudomonas sp. strain P51 innonsterile soil columns. FEMS Microbiol. Lett. 45:333-341.
10. Sander, P., R.-M. Wittaich, P. Fortnagel, H. Wilkes, and W.Francke. 1991. Degradation of 1,2,4-trichloro- and 1,2,4,5-tetrachlorobenzene by Pseudomonas strains. Appl. Environ. Mi-crobiol. 57:1430-1440.
11. Nishino, S.F., J.C. Spain, and C.A. Pettigrew. 1994. Biodegrada-tion of chlorobenzene by indigenous bacteria. Environ. Toxicol.Chem. 13:871-877.
12. Haggblom, M.M., and R.J. Valo. 1995. Bioremediation of chlo-rophenol wastes. In: Young, L.Y., and C.E. Cerniglia, eds. Micro-bial transformation and degradation of toxic organic chemicals.New York, NY: Wiley-Liss. pp. 389-434.
13. Suflita, J.M., and G.T. Townsend. 1995. The microbial ecologyand physiology of aryl dehalogenation reactions and implicationsfor bioremediation. In: Young, L.Y., and C.E. Cerniglia, eds. Mi-crobial transformation and degradation of toxic organic chemi-cals. New York, NY: Wiley-Liss. pp. 243-268.
14. Bedard, D.L., and J.F. Quensen. 1995. Microbial reductivedechlorination of polychlorinated biphenyls. In: Young, L.Y., andC.E. Cerniglia, eds. Microbial transformation and degradation oftoxic organic chemicals. New York, NY: Wiley-Liss. pp. 127-216.
15. Bedard, D.L., S.C. Bunnell, and L.A. Smullen. 1996. Stimulationof microbial para-dechlorination of polychlorinated biphenyls thathave persisted in Housatonic River sediment for decades. Envi-ron. Sci. Technol. 30:687-694.
16. Bedard, D.L., R. Unterman, L. Bopp, M.J. Brennan, M.L. Haberl,and C. Johnson. 1986. Rapid assay for screening and charac-terizing microorganisms for the ability to degrade polychlorinatedbiphenyls. Appl. Environ. Microbiol. 51:761-768.
17. Harkness, M.R., J.B. McDermott, D.A. Abramowicz, J.J. Salvo,W.P. Flanagan, M.L. Stephens, F.J. Mondello, R.J. May, J.H. Lo-bos, K.M. Carrol, M.J. Brennan, A.A. Bracco, K.M. Fish, G.L.Warner, P.R. Wilson, D.K. Dietrich, D.T. Lin, C.B. Morgan, andW.L. Gately. 1993. In situ stimulation of aerobic PCB biodegra-dation in Hudson River sediments. Science 259:503-507.
18. Flanagan, W.P., and R.J. May. 1993. Metabolite detection asevidence for naturally occurring aerobic PCB biodegradation inHudson River sediments. Environ. Sci. Technol. 27:2207-2212.
19. Adriaens, P., and T.M. Vogel. 1995. Biological treatment of chlo-rinated organics. In: Young, L.Y., and C.E. Cerniglia, eds. Micro-bial transformation and degradation of toxic organic chemicals.New York, NY: Wiley-Liss. pp. 435-486.
20. Fetzner, S., and F. Lingens. 1994. Bacterial dehalogenases: Bio-chemistry, genetics, and biotechnological applications. Microbiol.Rev. 58:641-685.
21. Wackett, L.P. 1995. Bacterial co-metabolism of halogenated or-ganic compounds. In: Young, L.Y., and C.E. Cerniglia, eds. Mi-crobial transformation and degradation of toxic organicchemicals. New York, NY: Wiley-Liss. pp. 217-242.
22. Magli, A., F.A. Rainey, and T. Leisinger. 1995. Acetogenesis fromdichloromethane by a two-component mixed culture comprisinga novel bacterium. Appl. Environ. Microbiol. 61:2943-2949.
23. Stucki, G., U. Krebser, and T. Leisinger. 1983. Bacterial growthon 1,2-dichloroethane. Experientia 39:1271-1273.
24. Salanitro, J.P., L.A. Diaz, M.P. Williams, and H.L. Wisniewski. 1994.Isolation of a bacterial culture that degrades methyl t-butyl ether.Appl. Environ. Microbiol. 60:2593-2596.
25. Spain, J.C. 1995. Biodegradation of nitroaromatic compounds.Ann. Rev. Microbiol. 49:523-55.
26. Nishino, S.F., and J.C. Spain. 1996. Degradation of 2,6-dinitro-toluene by bacteria. In: Proceedings of the Annual Meeting, American Society for Microbiology. pp. Q-381.
27. Janssen, P.H., and B. Schink. 1995. Catabolic and anabolicenzyme activities and energetics of acetone metabolism of thesulfate-reducing bacterium Desulfococcus biacutus. J. Bac-teriol. 177:277-282.
28. Mormile, M.R., S. Liu, and J.M. Suflita. 1994. Anaerobic biodegra-dation of gasoline oxygenates: Extrapolation of information tomultiple sites and redox conditions. Environ. Sci. Technol.28:1727-1732.
29. White, G.F., and J.R. Snape. 1993. Microbial cleavage of nitrateesters: Defusing the environment. J. Gen. Microbiol. 139:1947-1957.
30. White, G.F., J.R. Snape, and S. Nicklin. 1996. Biodegradation ofglycerol trinitrate and pentaerythritol tetranitrate by Agrobac-terium radiobacter. Appl. Environ. Microbiol. 62:637-642.
141

Natural Attenuation of Chlorinated Compounds in Matrices Other Than Ground Water: The Future of Natural Attenuation
Robert E. HincheeParsons Engineering Science, Salt Lake City, Utah
Introduction
To date, natural attenuation study and application havefocused on the dissolved phase in ground water inunconsolidated sediments. There are good reasons forthis. Ground-water transport is the primary pathway ofconcern at many sites, our understanding of aqueous-phase processes with relatively short half-lives (1 yearor less) in ground water is relatively well developed, andwe have a better understanding of ground-water proc-esses in unconsolidated media than in rock. This paperaddresses the potential importance of both natural at-tenuation in other media and of slower processes. Spe-cifically, natural attenuation in fractured rock, ofnonaqueous-phase liquids (NAPLs), and in the vadosezone, as well as low-rate processes, will be discussed.
Fractured Rock
Ground water in fractured rock presents a special prob-lem. In most rock formations, surface area is limited andflow paths tend to be complex when compared withunconsolidated sediments. Many of the same processesoccur, but they tend to be more difficult to monitor. TheTest Area North (TAN) site, located at the Idaho NationalEngineering Laboratory (INEL), contains a trichloroethene(TCE) ground-water plume approximately 9,000 feetlong. The geology is characterized by basalt flows withsedimentary interbeds that consist primarily of low per-meability, fine-grained sediments. The basalt flows arehighly variable, and ground-water flow appears to occurprimarily in the fractured basalt. The basalt varies frommassive to highly fractured. The source of contamina-tion appears to be an abandoned waste disposal well.In addition to chlorinated solvents, the well received avariety of wastes including nonchlorinated sludges andsome radioactive materials. TCE appears to be the onlysignificant chlorinated solvent in the source material, yetin ground water near the source, dichloroethene (DCE)concentrations are in the same range as TCE. The DCE:TCEratio then declines downgradient to a distance of about6,000 feet beyond which only TCE is found. All the TANsite data can be found in INEL (1).
What appears to be happening is anaerobic dechlorina-tion near the source, very likely driven by the carbonsource in the nonchlorinated sludge. Downgradient con-ditions appear to be aerobic, and no evidence ofdechlorination is seen more then a few hundred feetfrom the source well. One possible explanation for thesmaller DCE plume is aerobic degradation. This sitealso has a tritium plume originating from the samesource. If we assume that all of the plumes are of thesame age, we can estimate the kinetics of the aerobicdegradation of DCE and make some inferences con-cerning the TCE.
The DCE plume is approximately 6,000 feet, the tritiumplume 7,500 feet, and the TCE plume 9,000 feet long.Ignoring retardation and assuming a 12 year half-life fortritium, the DCE half-life would be approximately 10years. If the TCE is degrading aerobically, its half-life isprobably greater than 14 years. Based on these fieldobservations, it appears that the same processes thathave been observed at many sites in consolidated sedi-ments are occurring in the fractured basalt at the TANsite. Therefore, anaerobic dechlorination and aerobicoxidation of the less chlorinated solvents should occurin fractured rock. The significant challenge presented byfractured rock will be the accurate determination of flowpaths, the same as for any ground-water investigation.
Nonaqueous-Phase Liquid
When NAPL is present on a site, the mass of contami-nant in the NAPL is typically orders of magnitude greaterthan that dissolved in ground water. With the exceptionof dissolution (and evaporation in the vadose zone), littleis known about natural attenuation processes that occurin or near the NAPL phase. While evaporation can be asignificant attenuation mechanism and should certainlybe considered whenever vadose-zone contamination isof concern, the NAPL below the water table is normallythe greatest concern. Dissolution is the mechanism bywhich the ground water is initially contaminated, andalthough rates are high enough to create a ground-water
142

problem at many sites, dissolution is often quite slowwhen compared with the mass of contaminant present.
At the Hill Air Force Base (AFB) OU-2 site, thousandsof gallons of NAPL (primarily TCE) have been recoveredand many thousands of gallons remain below the watertable, yet the rate of dissolution (based on mass ofdissolved contaminant migrating off site) is tens of gal-lons per year.1 This is not unusual. It is difficult basedon our current understanding of the fate and behavior ofchlorinated solvents to postulate mechanisms for thebiotic or biotic degradation of NAPLs, but a few yearsago the same would have been concluded about dis-solved TCE or even benzene. The rates of any suchdegradation would not have to be high to be significant.
In the fractured rock discussion above, aerobic DCEdegradation with a half life on the order of 9 years isnoted. This phenomenon is rarely observed in laborato-ries or in short-term field studies, yet such a processcould be quite important. It is conceivable that an as yetunidentified process exists that degrades NAPL in situwith a half life of 10 years, which could result in a muchmore significant mass removal than the dissolution proc-ess followed by degradation in ground water. This is anarea which has been largely overlooked, and the re-search needed to evaluate these mechanisms will re-quire a longer-term and significantly different approachthan is current practice; however, to achieve a reason-able understanding of the long-term effects of naturalattenuation, it should not be overlooked.
Vadose and Discharge Processes
One of the primary practical values of natural attenuationis plume stability. In many plumes, at some point the rateof degradation of dissolved contaminants is more or lessequal to the rate of dissolution, and the plume achieves aquasi-steady state. To date, most of the work on naturalattenuation has focused on degradation in the aqueous-phase in the aquifer. Little attention has been given to thevadose zone or discharge points. Any attenuation mecha-nism that contributes to plume stability is important, and itappears that other mechanisms such as volatilization tothe vadose zone and ground-water discharge can be im-portant mechanisms in creating plume stability, althoughvolatilization from ground water to the vadose zone isprobably only important where net evaporation exceedsinfiltration to ground water. The process of contaminantdiffusion to the water table and through the capillary fringeinto ground water is likely too slow to be of much signifi-cance at most sites.
There are sites in the western United States, however, atwhich net ground-water evaporation occurs. The obviousmanifestation of this is the caliche found in many western
soils. This appears to be happening at Hill AFB. Forexample, there is a TCE plume approximately 5,000 feetlong at the OU-6 site. In the first several thousand feetof plume, the depth to ground water is about 100 feet,and net infiltration appears to be occurring. Near thedowngradient extreme of the plume, ground water ismuch shallower (10 feet or less), and net evaporationappears to be occurring. Significant TCE concentrationshave been observed in soil gas above the downgradientend of the plume, possible evidence of volatilization tothe vadose zone.
Discharge is an obvious attenuation mechanism, andthe nature of the discharge will determine its usefulness.For example, if the discharge is to a surface-waterstream where the result is unacceptably high contami-nant concentrations, this would not be a helpful mecha-nism. Frequently, however, discharge may not result inunacceptable exposure. At Hill AFB there are six plumesthat vary in length, but all are in the thousands of feet.In five of the plumes, TCE is the predominant contami-nant; in one DCE predominates. Although the plumesare miles apart and their source elevations vary, all ofthe plumes end at approximately the same elevation,and most of these plumes appear stable.
One reason for the stability is discharge. An old, low-per-meability deposit from Lake Bonneville occurs just belowthis depth that causes the ground water to discharge. Thisdischarge takes several forms: evaporation, evaportran-spiration, discharge into field drains which in turn dischargeto ditches, and discharge into seeps or springs. To theauthor’s knowledge, no contamination reaches a watersupply, a permanent surface-water body, or a stream. Atthe Hill AFB sites, plume stability appears to have beenachieved by a combination of mechanisms. There is cer-tainly evidence of conventional degradation in groundwater, and at all of the sites some anaerobic dechlorinationis occurring. Plume stability appears to have beenachieved as a result of this degradation, coupled withvolatilization and discharge.
Summary
Natural attenuation of chlorinated compounds is an impor-tant process, and a full understanding will require lookingbeyond the conventional aqueous-phase processes atmany sites. This will probably include both very slowmechanisms we do not yet understand and a more carefulconsideration of physical, chemical, and evapotranspora-tive processes we have not often quantified in naturalattenuation studies.
Reference1. INEL. 1995. Record of decision, declaration for the technical support
facility injection well (TSF-05) and surrounding groundwater contami-nation (TSF-23) and miscellaneous no action sites, final remedialaction. Idaho National Engineering Laboratory, Idaho Falls, ID.
1 Parsons Engineering Science. 1996. Unpublished compilation ofdata from six chlorinated solvent sites at Hill Air Force Base, UT.
143

Poster Session

Anaerobic Mineralization of Vinyl Chloride in Iron(III)-Reducing Aquifer Sediments
Paul M. Bradley and Francis H. ChapelleU.S. Geological Survey, Columbia, South Carolina
In anaerobic aquifer systems, intrinsic bioremediation ofchlorinated ethenes is considered problematic becauseof both the production of vinyl chloride during microbialreductive dechlorination of higher chlorinated contami-nants and the apparent poor biodegradability of vinylchloride under anaerobic conditions. Previous investiga-tions have suggested that reductive dechlorination ofvinyl chloride to ethene may represent an environmen-tally significant pathway for in situ bioremediation ofvinyl chloride contamination. This poster provides labo-ratory evidence for an alternative mechanism of vinylchloride degradation: anaerobic oxidation of vinyl chlo-ride under iron(III)-reducing conditions.
Microcosm experiments conducted with material col-lected from two geographically isolated, chlorinated-
ethene-contaminated aquifers demonstrated oxida-tion of [1,2-14C]vinyl chloride to 14CO2 by indigenousmicroorganisms under iron(III)-reducing conditions.Addition of chelated iron(III) (as Fe-EDTA) to aquifermicrocosms resulted in mineralization of up to 34percent of [1,2-14C]vinyl chloride within 84 hours. Theresults indicate that vinyl chloride can be mineralizedunder iron(III)-reducing conditions, and that thebioavailability of iron(III) is an important factor affect-ing the rates of mineralization. The microcosm resultsare consistent with the attenuation of vinyl chlorideconcentrations observed in the field and suggest thatcontaminant oxidation coupled to microbial iron(III) re-duction may be an environmentally significant mecha-nism contributing to intrinsic bioremediation of vinylchloride in anaerobic ground-water systems.
146

Intrinsic Biodegradation of Chlorinated Aliphatics Under SequentialAnaerobic/Co-metabolic Conditions
Evan E. Cox and David W. MajorBeak Consultants, Guelph, Ontario
Leo L. LehmickeBeak Consultants, Kirkland, Washington
Elizabeth A. EdwardsMcMaster University, Hamilton, Ontario
Richard A. MechaberGEI Consultants, Inc., Concord, New Hampshire
Benjamin Y. SuGEI Consultants, Inc., Winchester, Massachusetts
Tetrachloroethene (PCE) and trichloroethene (TCE) arebeing biodegraded under naturally occurring sequentialanaerobic/co-metabolic conditions in ground water at aninactive landfill in New Hampshire. Ground water in thevicinity of the landfill is predominantly aerobic, with theexception of an anaerobic zone that has developed atthe landfill source area where significant historicalbiodegradation of dichloromethane, ketones, and aro-matic hydrocarbons has occurred. Acetogenesis,methanogenesis, sulphate reduction, and iron reductionare the dominant microbial processes occurring in theanaerobic zone. PCE and TCE have been sequentiallydechlorinated to cis-1,2-dichloroethene (cis-1,2-DCE) inthe anaerobic zone, to the extent that PCE and TCE areno longer present at significant concentrations in the siteground water. Cis-1,2-DCE concentrations attenuatemore rapidly (e.g., from 20 to less than 1 milligrams perliter) than can be predicted based on physical processes(i.e., advection, dispersion, retardation) alone. Vinylchloride (VC) and ethene concentrations do not accountfor the extent of cis-1,2-DCE attenuation occurring.
Degradation of VC and ethene to carbon dioxide underaerobic conditions (1) or anaerobic iron-reducing condi-tions (2) may result in an underestimation of cis-1,2-DCE reductive dechlorination. Toluene and methane arepresent in the downgradient aerobic ground water, how-ever, and are likely promoting co-metabolic biodegrada-tion of cis-1,2-DCE. Preliminary laboratory microcosmstudies have confirmed that the indigenous microorgan-isms can co-metabolize cis-1,2-DCE (and VC) in thepresence of toluene and methane at the concentrationsfound in the site ground-water.
References
1. Cox, E.E., E.A. Edwards, L.L. Lehmicke, and D.W. Major. 1995.Intrinsic biodegradation of trichloroethene and trichloroethane in asequential anaerobic-aerobic aquifer. In: Hinchee, R.E., J.T. Wil-son, and D.C. Downey, eds. Intrinsic bioremediation. Columbus,OH: Battelle Press. pp. 223-231.
2. Bradley, P.M., and F.H. Chapelle. Anaerobic mineralization of vinylchloride in Fe(III)-reducing, aquifer sediments. Environ. Sci. Tech-nol. In press.
147

Analysis of Methane and Ethylene Dissolved in Ground Water
Steve Vandegrift, Bryan Newell, and Jeff HickersonManTech Environmental Research Services Corporation, Ada, Oklahoma
Donald H. KampbellU.S. Environmental Protection Agency,
National Risk Management Research Laboratory, Ada, Oklahoma
A headspace equilibrium technique and gas chromatog-raphy can be used to measure dissolved methane andethylene in water. A water sample is collected in a50-milliliter (mL) glass serum bottle. Several drops of 1:1diluted sulfuric acid are added. The bottles are thencapped using Teflon-lined butyl rubber septa. Later atthe analytical laboratory, a headspace is prepared byreplacing 10 percent of the water sample by helium. Thebottle is then shaken for 5 minutes. Aliquots of head-space, usually 300 microliters, are removed using agas-tight syringe. The subsample is injected into a gaschromatograph with a Porapak Q stainless-steel columnand a flame ionization detector. The gaseous compo-nents are separated, and chromatogram peak retentiontimes and areas are compared with calibration stand-ards. The concentration of the aqueous gas componentscan be calculated using sample temperature, bottle vol-ume, headspace concentrations, and Henry’s Law.
Limits of detection for methane and ethylene are0.001 and 0.003 milligrams per liter (mg/L), respectively.Determination of precision and accuracy for a 19.8mg/L methane prepared sample using six replicateswas a standard deviation of 0.6 mg/L, risk-specificdose (RSD) = 3.2 percent, and average recovery of87 percent. Similar statistics for 118 mg/L ethylene us-ing three replicates was a standard deviation of8.8 mg/L, RSD=7.5 percent, and an average recov-ery of 90 percent. Typical dissolved methaneand ethene concentrations at natural attenuationfield sites have been less than 1 and less than 0.1mg/L, respectively. Methane levels have always beenhigher.
The method can also be adapted to determine ethane,nitrous oxide, vinyl chloride, carbon dioxide, and possi-bly other dissolved gases in ground water.
148

Estimation of Laboratory and In Situ Degradation Rates for Trichloroethene and cis-1,2-Dichloroethene in a Contaminated Aquifer at
Picatinny Arsenal, New Jersey
Theodore A. Ehlke and Thomas E. ImbrigiottaU.S. Geological Survey, West Trenton, New Jersey
Natural attenuation of chlorinated organic compounds inaquifers includes apparent loss mechanisms, such asbiodegradation, advective transport, volatilization, sorp-tion, and diffusion. Determination of quantitative degra-dation rates for the different processes is an importantstep in planning cost-effective site remediation. Soil andground water at Picatinny Arsenal, New Jersey, havebeen studied by the U.S. Geological Survey since 1986to determine fate and transport of chlorinated ethenesin a shallow unconfined aquifer. This poster describesthe methods used to quantify the major processes af-fecting fate and transport of trichloroethene (TCE) andcis-1,2-dichloroethene (cis-DCE) in the aquifer.
Analyses of water and soil core samples, collected at aseries of locations within and outside a contaminantplume, were used to identify the lateral and verticaldistribution of organic contaminants in the aquifer, majorelectron acceptors, background geochemistry, and dis-solved chemicals that affect biodegradation of chlorin-ated ethenes within the plume. Results indicated thatground water within the plume contained TCE concen-trations ranging up to 20 mg/L-1, methane concentra-tions generally less than 85 mg/L-1, and dissolved oxygenand nitrate concentrations of less than 0.5 mg/L-1,the major terminal electron accepting processes weresulfate and iron(III) reduction; and anaerobic in situbiodegradation of TCE and cis-DCE was occurring.Following initial site characterization, soil cores werecollected from a series of locations along the majorground-water flow path within the plume for determi-nation of TCE and cis-DCE biodegradation rates in alaboratory study.
Static batch microcosms were constructed under an-aerobic conditions to determine the rates of TCE andcis-DCE biodegradation. Sterilized 50-milliliter serum vi-als were filled to the base of the neck with compositedcore materials and amended with a 2-milliliter sterile
aqueous solution of TCE or cis-DCE to bring the pore-water chlorinated ethene concentration to 1,100 mg/L-1.
Pore-water samples from duplicate serum vials wereperiodically assayed by gas chromatography to quantifythe chlorinated ethene concentrations. The results wereused to determine the first-order biodegradation rateconstants for TCE and cis-DCE, after compensation forabiotic losses. First-order biodegradation rate constantsfor TCE ranged from -0.004 wk-1 to -0.035 wk-1 and weregreater near the plume origin and the discharge point(Green Pond Brook) than in the plume center. Geo-chemical results indicated that natural organic acidsleached from shallow peat deposits in the vadose zoneprobably were a major electron donor for biodegradationof chlorinated ethenes in situ. In general, cis-DCE wasdegraded more slowly than TCE. First-order biodegra-dation rate constants for cis-DCE ranged from less than-0.01 wk-1 to -0.05 wk-1. Biodegradation of cis-DCE wasmost rapid in soils underlying a peat layer near theplume discharge point.
Degradation of TCE in situ also was estimated using theconcentrations of chlorinated ethenes determined for aseries of monitoring wells along the major ground-waterflow path within the plume. Chlorinated ethene concen-trations in ground water at up- and downgradient wellsmeasured at time intervals corresponding to the esti-mated TCE solute transport time between sites wereused to estimate first-order TCE removal rate constantsin the aquifer. In situ first-order rate constants for TCEremoval generally ranged from -0.012 wk-1 to -0.02 wk-1.The close approximation of these in situ removal esti-mates to laboratory biodegradation rates indicated thatbiodegradation in situ probably was a major removalprocess for TCE at Picatinny Arsenal.
Results of in situ geochemistry and ground-water mod-eling were used to quantify the removal of TCE by majorprocesses in the unconfined aquifer at Picatinny Arsenal.
149

Diffusive, sorptive, and volatilization losses were esti-mated separately and used to correct for apparent in situTCE removal. Biodegradation is probably the major re-moval process for chlorinated ethenes in the aquifer,removing about 400 kg/y-1 of TCE from the contaminantplume. Advective transport removes about 47 kg/y-1 of
TCE in ground water, discharging to Green Pond Brook.Volatilization and lateral diffusive losses of TCE from theplume are estimated to total 10 to 50 kg/y-1. Sorptivelosses of TCE to aquifer soils are minor because of thelow organic carbon concentration of sediments in thesaturated zone.
150

Measurement of Dissolved Hydrogen in Ground Water
Mark BlankenshipManTech Environmental Research Services Corporation, Ada, Oklahoma
Francis H. ChapelleU.S. Geological Survey, Columbia, South Carolina
Donald H. KampbellU.S. Environmental Protection Agency,
National Risk Management Research Laboratory, Ada, Oklahoma
A gas stripping procedure and reduction gas detectorcan be used to measure aqueous concentrations ofhydrogen in ground water. Polyethylene tubing is placednear the center of the screen in a well casing with theother end connected to a peristaltic pump. After purgingseveral well volumes, a 250-milliliter (mL) glass sam-pling bulb is placed in the water sampling line. The bulbis completely filled with water. Then the pump isstopped, and nitrogen gas is injected into the bulb tocreate a 20-mL headspace. The bulb outlet is placed ata lower level then the inlet, and the pump is turned on.A water flow of 200 mL per minute is maintained for 20minutes to equilibrate the dissolved hydrogen with thenitrogen gas phase. Duplicate 2-mL gas samples arethen removed with a gas-tight syringe for analysis bythe hydrogen detector. The hydrogen analyzer oper-ates on the reaction principle of X + HgO (solid) → XO+ Hg (vapor), where X represents any reducing gas. An
ultraviolet photometer quantitatively measures the resul-tant mercury vapor. Reduction gas species are identifiedas chromatograph peaks at different retention times.Retention time for hydrogen is less than 1 minute. Thelimit of detection is 0.01 parts per million (ppm) hydro-gen. A standard calibration curve over the range of 0.01to 1.26 ppm hydrogen has a linear correlation coefficientof R2=1.00. A 1.0-ppm hydrogen in the gas phase cor-responds to 0.8 nanomoles per liter of dissolved hydro-gen for fresh water in equilibrium with a gas phase at 1atmosphere. Typical dissolved hydrogen concentrationsdetected at four different natural attenuation sites wereless than 10 nanomoles and most frequently less than1 nanomole.
Successful sample assays depend on careful followingof procedure detail and overnight stabilization of thedetector.
151
Evidence of Natural Attenuation of Chlorinated Organics at Ft. McCoy, Wisconsin
Jason MartinRust Environment and Infrastructure, Sheboygan, Wisconsin
Ft. McCoy is a Resource Conservation and RecoveryAct regulated U.S. Army facility located in westernWisconsin. Fire Training Burn Pit 1 (FTBP1) on thesite was operated from approximately 1973 to 1987.Operations at the pit consisted of filling the pit with alayer of water and fuel, then repeatedly igniting andextinguishing the contents until the fuel was con-sumed. The soil beneath the 3-foot deep and 30-footdiameter pit is a well sorted sand (low organic content)with an average hydraulic conductivity of 0.0048 centi-meters per second. The water table is generally 12 feetbelow the ground surface.
Sampling activities conducted in 1993 and 1994 indi-cated significant concentrations of chlorinated organics(1,2-dichloroethene [1,2-DCE], trichloroethene, and per-chloroethene) in the soil and ground water. Chlorinatedorganic contamination in the soil was limited to the areaunder the former fire pit. Based on the local hydraulicgradient and hydraulic conductivity, ground water pre-sent under FTBP1 when operations were initiated in1973 has traveled an estimated 7,000 feet. Evidence ofnatural attenuation of ground-water contamination isprovided by the short travel distance (approximately 600feet) of the leading edge (1 microgram per liter) of the
chlorinated organics relative to the ground water overthe 20-year period and the decrease in size and concen-tration of the chlorinated organic contaminant plumeduring the period of sampling (e.g., peak 1,2-DCE con-centrations decreased from 2,100 to 700 microgramsper liter during the sampling period).
Natural attenuation mechanisms potentially active onground-water contamination at the site include disper-sion, sorption, volatilization, and biological degradation.The bulk of the ground-water contamination was re-cently remediated using air sparging/soil vapor extrac-tion. Based on the evidence of natural attenuationpresent at the site and information in the U.S. Air Forcetechnical protocol on intrinsic remediation (1), naturalattenuation will be included as a component of the rec-ommended remedial alternative for remaining ground-water contamination at this site.
Reference1. Wiedemeier, T.H., J.T. Wilson, D.H. Kampbell, R.N. Miller, and J.E.
Hansen. 1995. Technical protocol for implementing intrinsic reme-diation with long-term monitoring for natural attenuation of fuelcontamination dissolved in groundwater. U.S. Air Force Center forEnvironmental Excellence, San Antonio, TX.
152

Challenges in Using Conventional Site Characterization Data To ObserveCo-metabolism of Chlorinated Organic Compounds in the Presence of an
Intermingling Primary Substrate
Ian D. MacFarlane, Timothy J. Peck, and Joy E. LigéEA Engineering, Science, and Technology, Inc., Sparks, Maryland
Site characterization data from a leaking undergroundstorage tank (LUST) site and adjacent dry cleaners wereretrospectively analyzed for evidence of chlorinated sol-vent biodegradation. The sites are in the path of a widechlorinated solvent ground-water plume emanating fromthe Dover Air Force Base (DAFB) in Dover, Delaware.Discrete hydrocarbon and tetrachlorethene plumesoriginate from the aforementioned LUST and dry cleanersources and mingle with the DAFB plume (1, 2). Fromthe chlorinated organics natural attenuation program atDAFB (3) and our own laboratory studies using DAFBsediment (4), evidence abounds regarding the potentialfor natural biodegradation of chlorinated compounds inthe shallow Columbia aquifer.
We hypothesized that the subsurface, containing gaso-line product, gasoline vapors, and high levels of dis-solved hydrocarbons, was a likely area for co-metabolismof chlorinated compounds derived from either DAFB orthe dry cleaners. In this case, the hydrocarbons wouldserve as the primary substrate for co-metabolism ofchlorinated compounds mixing within the hydrocarbon-contaminated zone. Soil vapor, multilevel hydropunch,and monitoring well data from the LUST and dry cleanerinvestigations were reviewed, looking specifically forrelationships between concentrations of hydrocarbons(the presumed primary substrate), chlorinated solvents(e.g., tetrachloroethene [PCE], trichloroethene [TCE],and carbon tetrachloride), and chlorinated solventbreakdown products (e.g., vinyl chloride, dichloroethene[DCE], TCE, and chloroform).
Although some patterns of intrinsic biodegradation wereevident, the data did not make a compelling case forco-metabolism in or near the hydrocarbon plume. Themost promising data were the soil gas concentrations,which generally showed a decrease in the PCE:TCEratio with increase in hydrocarbon concentration, imply-ing degradation of PCE to TCE in the presence of
hydrocarbon vapors. Even though numerous ground-water samples were obtained for the site charac-terization studies, no relationships could be establishedfor the ground-water regime.
We conclude that the data from this conventional sitecharacterization effort were either too limited in quality(e.g., not enough analytes) or quantity to adequatelydiscern patterns, or that co-metabolism was not occur-ring in the saturated zone. Perhaps vapor diffusion in theunsaturated zone promotes better substrate mixing thanin the saturated zone, where slow dispersion may limitthe effects of co-metabolism. This retrospective analysispoints out the need for careful development of a naturalattenuation conceptual model while planning site char-acterization efforts. Sampling and analysis not conven-tionally used in contaminant site assessments, particularlyfor chlorinated natural attenuation assessments, may berequired to test the hypothesized conceptual model.
References
1. Peck, T.J., and I.D. MacFarlane. 1991. Multiphased environmentalassessment of intermingling subsurface contamination: A casestudy. Proceedings of the 1991 Environmental Site Assessments:Case Studies and Strategies Conference. Association of GroundWater Scientists and Engineers. July.
2. Peck, T.J., and I.D. MacFarlane. 1993. Characterization of inter-mingling organic plumes from multiple sources. Presented at theNGWA Annual Convention and Exposition. October.
3. Klecka, G.M. 1995. Chemical and biological characterization ofintrinsic bioremediation of chlorinated solvents: The RTDF Pro-gram at Dover Air Force Base. Presented at the IBC IntrinsicBioremediation/Biological Dehalogenation Conference, Annapolis,MD. October 16-17.
4. Ligé, J.E., I.D. MacFarlane, and T.R. Hundt. 1995. Treatabilitytesting to evaluate in situ chlorinated solvent and pesticide biore-mediation. In: Hinchee, R.E., A. Leeson, and L. Semprini, eds.Bioremediation of chlorinated solvents. Columbus, OH: BattellePress.
153

Development of an Intrinsic Bioremediation Program for Chlorinated Solvents atan Electronics Facility
Michael J. K. NelsonNelson Environmental, Kirkland, Washington
Anne G. UdaloyUdaloy Environmental Services, Lake Forest Park, Washington
Frank DeaverDeaver Environmental Group, Portland, Oregon
From 1963 to 1978, an area on a manufacturing facilityfor electronic components was used to dispose of re-sidual sludge from cleaning baths. The sludge con-tained chlorinated solvents, including trichloroethylene(TCE), tetrachloroethylene (PCE) and 1,1,1-trichlo-roethane (TCA). An initial investigation of the site duringthe mid to late 1980s revealed substantial levels of TCE(up to 5,700 micrograms per liter) and TCA (up to 6,900micrograms per liter) in the ground water. A correctivemeasures study was performed, and corrective actionwas implemented in the form of standard pump-and-treat activities.
After 5 years of pumping, it was evident that this methodwas removing very little chlorinated solvent mass, andalternative remediation methods were assessed. Dur-ing a review of the historical data, it was determinedthat the concentration of chlorinated solvents hadgreatly decreased before implementation of the pump-and-treat program and that site soils were likely to beanaerobic, potentially allowing natural biodegradationof TCE and related solvents. Discussions held with theregulatory agencies, the U.S. Environmental ProtectionAgency and the Oregon Department of EnvironmentalQuality, resulted in a program designed to investigateintrinsic bioremediation as a viable remedial option forthe site.
Information was obtained using Geoprobe sampling tech-niques; evidence of anaerobic conditions and of the an-aerobic breakdown products of the contaminants wassought. The results indicated anaerobic conditions; thiswas based on low to nondetectable dissolved oxygen,dissolved nitrogen predominantly as ammonia, high levelsof ferrous iron (up to 85 milligrams per liter), and significantlevels of methane (up to 1.2 milligrams per liter). Theresults also indicated that TCE was being biodegraded bysequential, reductive dechlorination to nonchlorinatedproducts prior to reaching the site boundary. Both cis-1,2-dichloroethylene and vinyl chloride were detected near thesource area at maximum concentrations of 130 and 12micrograms per liter, respectively, then decreased to nearor below the detection level at the site boundary. Lowlevels of the nonchlorinated product, ethylene, were de-tected downgradient of the source area.
Subsequent discussions with the agencies led to anagreement that intrinsic bioremediation was a viableremedial alternative for contaminant containment andeventual cleanup. The ground-water pump-and-treatsystem is being decommissioned, and a monitoring pro-gram is being implemented to track and ensure thatadequate remediation of the site continues by intrinsicbioremediation. Implementation of this program is allow-ing redevelopment of this site.
154

Overview of the U.S. Air Force Protocol for Remediation of Chlorinated Solventsby Natural Attenuation
Todd H. WiedemeierParsons Engineering Science, Inc., Denver, Colorado
John T. Wilson and Donald H. KampbellU.S. Environmental Protection Agency, National Risk Management Research Laboratory,
Subsurface Protection and Remediation Division, Ada, Oklahoma
Jerry E. Hansen and Patrick HaasU.S. Air Force Center for Environmental Excellence, Technology Transfer Division,
Brooks Air Force Base, Texas
The U.S. Air Force Center for Environmental Excel-lence, Technology Transfer Division (AFCEE/ERT), inconjunction with personnel from the U.S. EnvironmentalProtection Agency’s National Risk Management Re-search Laboratory (NRMRL) and Parsons EngineeringScience, Inc. (Parsons ES), has developed a technicalprotocol to document the effects of natural attenuationof fuel hydrocarbons dissolved in ground water. Thissame group is currently developing a similar protocol forconfirming and quantifying natural attenuation of chlo-rinated solvents. The intended audience for the newprotocol is U.S. Air Force personnel and their contrac-tors, scientists, and consultants, as well as regulatorypersonnel and others charged with remediating groundwater contaminated with chlorinated solvents.
Mechanisms of natural attenuation of chlorinated sol-vents include biodegradation, hydrolysis, volatilization,advection, dispersion, dilution from recharge, and sorp-tion. Patterns and rates of natural attenuation can varymarkedly from site to site depending on governing physi-cal and chemical processes. The proposed protocolpresents a straightforward approach based on state-of-the-art scientific principles that will allow quantificationof the mechanisms of natural attenuation. In this way,the effectiveness of each mechanism can be evaluatedin a cost-effective manner, allowing a decision to bemade regarding the effectiveness of natural attenuationas a remedial approach.
155

Incorporation of Biodegradability Concerns Into a Site Evaluation Protocol for Intrinsic Remediation
Robert M. Cowan, Keun-Chan Oh, Byungtae Kim, and Gauri RanganathanRutgers University, Cook College, Department of Environmental Sciences,
New Brunswick, New Jersey
A project is being conducted to develop a site evaluationprotocol for determining the potential applicability of in-trinsic remediation at industrial sites with soil andground-water contamination. The project is sponsoredby an industry-supported research center because thesponsor industries are interested in extending the appli-cability of currently available intrinsic remediation proto-cols (e.g., the U.S. Air Force guidance document byWiedemeier et al. [1]) to include any biodegradable con-taminant, not just benzene, toluene, ethylbenzene, andxylenes and related (fuel-derived) compounds. To ex-tend the protocol in this manner, the biodegradability ofany contaminants that may exist at these sites must beaddressed because the knowledge of contaminant bio-degradability can be an absolute requirement for appli-cation of intrinsic remediation. How to go about this isthe focus of the work.
Progress on the project to date has been the develop-ment of a preliminary site screening document and adraft of the protocol to determine biodegradability. Inaddition, information has been collected concerningcontamination at several industrial sites, and one sitehas been selected for more detailed study. The siteselected contains a contaminated fractured bedrockaquifer so we are experiencing difficulty concerning thepredictability of contaminant transport in addition to thecontaminant biodegradability issues that were initiallythe focus of the project.
This poster will:
• Present an overview of intrinsic remediation technol-ogy and definitions for related terminology.
• Discuss preliminary site screening using existingdata to make an initial determination as to whetherintrinsic bioremediation is likely to be suitable for agiven site; the goal is to decide whether a moredetailed look at the site should be taken.
• Describe the biodegradability assessment protocol,which contains two sections: assessment of biode-gradability through a search of existing databasesand the literature, and experimental methods for thedetermination of in situ biodegradability.
• Depict a flow chart, based on biodegradability con-cerns, that can be used to select and implement theappropriate approach for making a detailed assess-ment of the potential for intrinsic remediation.
• Give the current status of the industrial site study.
Reference
1. Wiedemeier, T.H., J.T. Wilson, D.H. Kampbell, R.N. Miller, and J.E.Hansen. 1995. Technical protocol for implementing intrinsic reme-diation with long-term monitoring for natural attenuation of fuelcontamination dissolved in groundwater. U.S. Air Force Center forEnvironmental Excellence, San Antonio, TX.
156

A Field Evaluation of Natural Attenuation of Chlorinated Ethenes in a Fractured Bedrock Environment
Peter Kunkel and Chris VaughanABB Environmental Services, Inc., Portland, Maine
Chris WallenHazardous Waste Remedial Actions Program, Oliver Springs, Tennessee
Before a long-term ground-water monitoring programwas conducted in support of natural attenuation as aremedial remedy for halogenated organic contamina-tion, a focused evaluation of ground-water chemistryprovided valuable insight into attenuative mechanismsin areas where remedial options were being evaluated.This poster describes a field investigation and data analy-sis at Loring Air Force Base, Limestone, Maine, and pre-sents the results of the evaluation of natural attenuation.
Chemical data collected prior to this evaluation indicatedthe presence of chlorinated ethenes (tetrachloroethene[PCE] and trichloroethene [TCE], cis-1,2-dichloroethene[cis-1,2-DCE] and vinyl chloride [VC]) in the fracturedbedrock ground-water environment at several locations
on site. Samples representative of the interior and exteriorof the chlorinated hydrocarbon plumes were collected atpre-existing basewide remedial investigation locations.The analytical protocol included hydrocarbon targetcompounds, ground-water quality parameters, indicatorparameters, electron acceptors, and microbial commu-nity evaluations. Several of the contaminant plumesdemonstrated characteristics of reductive dehalogena-tion, indicating a potential for natural degradation ofPCE and TCE to cis-1,2-DCE and VC in a fracturedbedrock environment. Dissolved oxygen and nitrateconcentrations were depleted, oxidation/reduction po-tential values and sulfate concentrations decreased,and methane concentrations were observed at locationswhere chlorinated ethenes were detected.
157
Intrinsic Bioattenuation of Chlorinated Solvents in a Fractured Bedrock System
William R. Mahaffey and K. Lyle DokkenWalsh Environmental Scientists & Engineers, Inc., Boulder, Colorado
Spent chlorinated solvents were released from two un-derground storage tanks at the Colorado Department ofTransportations materials testing laboratory in Denver,Colorado. An estimated 5,000 to 15,000 liters of trichlo-roethene, 1,1,1-trichloroacetic acid (TCA), 1,1,2-TCA,dichloromethane, benzene, toluene, ethylbenzene,xylene, and asphaltic compounds were released into ahighly fractured bedrock consisting of interbeddedclaystone, siltstone, and fine-grained sandstone. Theresulting dense, nonaqueous-phase liquid resides be-tween 20 and 30 feet below ground surface (bgs).Downward migration has been impeded by a relativelymassive claystone at 30 to 40 feet bgs, although somesolvents are present at a depth of more than 50 feet ina siltstone. The ground-water plume, consisting ofsource compounds and products of reductive dechlori-nation (e.g., 1,1-DCE, 1,2-DCE, 1,1-DCA and 1,2-DCA),has migrated in excess of 4,500 feet off site.
This site is being characterized for intrinsic bioattenu-ation to establish baseline conditions prior to the poten-tial implementation of a source removal action,recognizing that substantial residuals would likely re-main. An anaerobic core in the source area has beencharacterized on the basis of water chemistry differ-ences between the plume and inflowing upgradientground water. Downwell probe sondes were used tomeasure dissolved oxygen, pH, redox potential, andtemperature. Zero headspace ground-water samples
were collected into 160 milliliter serum bottles using aGrundfos submersible pump and were immediatelycapped with Teflon lined caps. Analysis for methane,ethane, ethene, and hydrogen was performed by head-space analysis after displacing a fixed volume of waterby nitrogen gas displacement. Aqueous samples wereanalyzed for NO3-, PO4-3, SO4-2, Cl-, S-2, and Fe+2
using Hach methodologies; total organic carbon, chemi-cal oxygen demand, and bicarbonate were analyzedusing standard methods. An evaluation of microbialpopulations in ground water was performed using thephospholipid fatty acid procedure.
Low levels of dissolved oxygen, in conjunction withthe identification of elevated methane, ferrous iron,and chloride levels in the source area of the plume,indicate the presence of anaerobic activity. Significantreductions in the levels of inflowing nitrate within thesource area of the plume have been observed andappear to be coincident with the reductions in the levelsof aromatic hydrocarbon constituents within and down-gradient of the source area. Intrinsic bioattenuation ofdichloromethane (DCM) appears to be occurring basedon contaminant transport model predictions (MT3D)and actual field measurements of the DCM plumedimensions. Further indication of intrinsic bioattenu-ation has been the identification of low levels (15 partsper billion) of vinyl chloride immediately downgradientof the source area.
158

Modeling Natural Attenuation of Selected Explosive Chemicalsat a Department of Defense Site
Mansour Zakikhani and Chris J. McGrathU.S. Army Engineers Waterways Experiment Station, Vicksburg, Mississippi
Natural attenuation of explosives in the subsurface hasreceived considerable attention during recent years.The idea behind natural attenuation is that within areasonable time natural processes can degrade effec-tively some explosive chemicals. One site selected toevaluate natural attenuation is located at the LouisianaArmy Ammunition Plant (LAAP) in northwest Louisianaapproximately 22 miles east of Shreveport. The studysite is the area including the former Area P lagoons, 16unlined lagoons covering approximately 25 acres. TheArea P lagoons were used sporadically between 1940and 1981. Untreated, explosive-laden wastewater frommunition packing operations within LAAP was collectedin concrete sumps at each of several facilities andhauled by tanker to Area P. The site also was used as aburning ground for many years.
LAAP was placed on the National Priority List (NPL) inMarch 1989 due to detection of measurable explosivechemicals in the soil and ground water and its proximityto water supply wells. As part of an interim remediation,the wastewaters at Area P were removed and the soilwas excavated to a depth of 5 feet. The total explosivesconcentration in untreated soil was in excess of 100milligrams per kilogram. Excavated soil was incinerated,and treated soil was used to backfill the area. Theconcentration of treated soil was below a detection limit(BDL). A natural cap of low permeability was placed over
the site to inhibit infiltration and further migration ofresidual explosives below the excavation depth.
The monitoring wells at LAAP have been sampled andanalyzed for explosives since 1982. The results of theseanalyses are maintained in the U.S. Army EnvironmentalCenter database (IRDMIS). A comparison between 1990and 1994 data for trinitrotoluene (TNT) and RDX concen-trations within and adjacent to Area P showed a generaldecrease during this period. The concentration of TNT in1990 ranged from 16,000 to 55.6 micrograms per liter(µg/L); by 1994, the concentration ranged from 11,000 µg/Lto BDL. The RDX concentration ranged from 7,600 to 33.8µg/L in 1990 and from 8,400 to 14.4 µg/L in 1994. Althoughthese two data sets indicated a general downward trendin contamination at Area P due to remedial measuresand/or natural attenuation, a few monitoring wells showedthe opposite trend. To clarify the conflicting results andprovide a better understanding of explosives attenuation,eight additional monitoring wells have been installed at thesite since 1995.
This poster discusses the feasibility of applying three-di-mensional ground-water flow and transport to this het-erogeneous aquifer. The capability of a comprehensivecomputer graphical system—Groundwater ModelingSystem (GMS)—which is used in the modeling of thesite, also will be discussed and illustrated.
159
Long-Term Application of Natural Attenuation at Sierra Army Depot
Jerry T. WickhamMontgomery Watson, Walnut Creek, California
Harry R. KleiserU.S. Army Environmental Center, Aberdeen Proving Ground, Maryland
A record of decision (ROD) for Sierra Army Depot se-lecting natural attenuation and degradation for treatmentof ground water was signed by the state of Californiaand the Army on September 8, 1995—the first approvedROD in the United States selecting natural attenuation asa primary remedial alternative for trichloroethene (TCE)and explosives in ground water. The natural attenuationalternative consists of institutional controls to eliminatefuture use of ground water in the area surrounding thesite, long-term ground-water monitoring, and evaluationof contaminant migration and degradation rates.
Explosives and volatile organic compounds (VOCs) arepresent in shallow ground water over a 26-acre area ofSierra Army Depot, which is located approximately 50miles northwest of Reno, Nevada. No surface waterfeatures or water supply wells exist within the area ofthe site. A ground-water plume of explosive compoundsoriginates from the TNT Leaching Beds, a facility usedduring the 1940s for percolation of waste water from ashell washout facility. Dissolved explosive compoundsin the ground water include RDX, 1,3,5-trinitrobenzene,HMX, and minor concentrations of numerous other ex-plosive compounds. The highest concentration of totalexplosive compounds detected is 1,200 micrograms per
liter within the vicinity of the former leaching beds. AVOC plume originates from a former paint shop usedduring the 1940s and 1950s for the renovation of am-munition. Dissolved VOCs present in the highest concen-trations are TCE, chloroform, and carbon tetrachloride.The highest concentration of trichloroethene detected is1,000 micrograms per liter in a monitoring well 175 feetdowngradient from the former paint shop.
Under current conditions, the plumes appear to migrateat slow rates. Estimated ground-water flow velocitiesacross the site range from 1 to 140 feet per year, withaverage estimated ground-water velocities of 2 to 6 feetper year. The shallow aquifer is highly stratified, withnumerous fine-grained layers in the upper 25 feet. Be-cause contaminants have diffused into the fine-grainedlayers over approximately a 50-year period, restorationof ground water to background or drinking-water qualityby pump-and-treat or other active remediation does notappear feasible. Long-term ground-water monitoring ofthe plumes is expected to provide data on degradationreactions that may occur at slow rates over extendedperiods. In addition to providing these data, this actioncould save the Army up to $10 million in ground-waterremediation costs at Sierra Army Depot.
160
When Is Intrinsic Bioremediation Cost-Effective? Financial-Risk Cost-BenefitAnalysis at Two Chlorinated Solvent Sites
Bruce R. James, Evan E. Cox, and David W. MajorBeak Consultants, Guelph, Ontario
Katherine FisherBeak Consultants, Brampton, Ontario
Leo G. LehmickeBeak Consultants, Kirkland, Washington
Interest in intrinsic bioremediation and natural attenu-ation as remediation alternatives for chlorinated solventsites is rapidly growing because the methods are signifi-cantly more cost-effective than conventional remedia-tion alternatives (e.g., pump-and-treat). When evaluatingthe long-term cost-effectiveness of intrinsic bioremedia-tion and natural attenuation alternatives, however, manyanalysts and decision-makers consider direct engineer-ing costs, such as capital, operation and maintenance,and monitoring costs, but fail to adequately assess thepotential legal and corporate costs that may arise fromchoosing an intrinsic-based remediation alternative. Ifthe alternative fails, for example, additional costs wouldbe incurred to address remediation with a new methodor to deal with the land’s decrease in value or market-ability or possible legal action. Financial-risk cost-benefit
analysis, which incorporates a more comprehensive setof costs in the cost-effectiveness analysis, is a tool thatanalysts and decision-makers can use to evaluate ob-jectively whether intrinsic bioremediation and naturalattenuation are in fact the most cost-effective remedia-tion alternatives in the long run.
This poster presents the results of using financial-riskcost-benefit analysis to examine the impact of cost fac-tors other than engineering costs on the long-term cost-effectiveness of intrinsic bioremediation versus otherremediation alternatives under various scenarios at twochlorinated solvent sites. At both sites, chlorinated vola-tile organic compounds are currently being intrinsicallybioremediated to environmentally acceptable end prod-ucts (e.g., ethene and ethane).
161

Natural Attenuation of Chlorinated Organics in Ground Water:The Dutch Situation
Lex W.A. Oosterbaan and Hans RoversTebodin, Environment and Safety Department, The Hague, The Netherlands
National Policy in General
The official goal of the policy on soil remediation in theNetherlands is future “multifunctional use” of the sites inquestion. This goal is triggered by the shortage of suit-able sites for development (including the developmentof nature reserves and ecological values) and by con-sciousness and care for the environment.
A recent chapter of the Soil Protection Act, however,presents guidelines for decision-makers to deviate frommultifunctional use. These guidelines are based on“specific local conditions.” Thus, the goal in the field hasshifted to future “functional use” of sites.
Through a remedial option analysis, which is compara-ble to the U.S. Environmental Protection Agency’s reme-dial investigation/feasibility study, remedial technologiesare identified and remedial action alternatives evalu-ated. The evaluation is based on technical and financialfeasibility on one hand and environmental impact on theother. Environmental impact is substantiated by analy-ses of human risks and by considerations of ecologicaldeterioration and migration of contaminants into theenvironment.
National Policy on Natural Attenuation
Chlorinated volatile organic compounds (VOCs) havebeen extensively used in metal processing and drycleaning industries in the Netherlands and are a majorcomponent in many soil and ground-water contamina-tion problems. This is due to the chemical and physicalproperties of the contaminants in relation to permeablesoils, high water tables, and regional aquifers, whichcontain valuable ground-water resources for the drink-ing water supply.
Target and intervention values for these compounds inground water are set low, as illustrated below.
Target ValueFrom the SoilProtection Act
InterventionValue From theSoil ProtectionAct
Trichloroethylene (TCE)Perchloroethylene (PCE)Vinylchloride (VC)
0.01 µg/L0.01 µg/LNot available
500 µg/L40 µg/L0.7 µg/L
Provisionaltarget value
Provisionalintervention value
cis-1,2-Dichloroethene (DCE) 0.01 µg/L 10 µg/L
To date, no protocols have been developed for naturalattenuation. Information on the behavior and fate ofVOCs and on the survey of these items is available,although not readily so. Practical experience is emerg-ing. Target and intervention values are absolute values,that is, definitive and ultimate. The benefit of a time spanfavoring ongoing attenuation is not considered fully.
Presently much energy and funding are put into theNOBIS research program, a government-subsidizedprogram to develop in situ bioremediation techniquesfor a great variety of contamination problems. Theprogram focuses on investigation and remediation andconsists of laboratory and field experiments and ofthe enhancement of potentially promising technologies,feasibility studies, and methodologies for decisionanalysis. Unique in this program is the collaborationbetween government, industrial polluters, research insti-tutes, and environmental consultancy firms/contractors.The results of the various projects are accessible forNOBIS participants immediately and will become publicdomain later.
162

Natural Attenuation as a Cleanup Alternative for Tetrachloroethylene-AffectedGround Water
Steve NelsonEMCON, Bothell, Washington
A chlorinated solvent storage and transfer facility op-erated in an industrial area of Seattle, Washington,from the mid-1940s to the mid-1970s. Historical re-leases of tetrachloroethylene (PCE) at fill pipes andunderground storage tanks have migrated into a shallowsand aquifer underlying the site. A recently completedfield screening and ground-water sampling investiga-tion characterized the nature and extent of a localPCE ground-water plume and a more extensive plumeof cis-1,2-dichloroethylene and vinyl chloride. Addi-tional ground-water chemistry data, including nitro-gen, phosphorus, iron, sulfur, dissolved oxygen, andpermanent gas (methane, ethane, ethene) concentra-tions, were collected. Elevated concentrations of fer-rous iron (11 parts per million [ppm]), sulfide (0.39ppm), and ammonia (14 ppm), and low concentrationsof dissolved oxygen (0.25 ppm) indicate anaerobicconditions in the source area that are conducive to
natural attenuation of PCE. Methane, ethane, ethene,cis-1,2-dichloroethylene, and vinyl chloride concen-trations increase by one to two orders of magnitude150 feet downgradient of the source area. Near-saturation concentrations of PCE decrease by severalorders of magnitude over the same distance. Prelimi-nary estimates indicate a half-life of 150 to 200 daysfor PCE degradation.
There are no beneficial uses of ground water in theindustrial area, and ground-water discharges to a sur-face-water body 2,500 feet from the site. Concentrationsof the contaminants of concern at the property boundaryare lower than Washington State surface-water qualitycriteria. Because natural attenuation appears to effec-tively remediate the chlorinated hydrocarbons, the pro-posed remedial action for the site will be limited toground-water monitoring.
163

Natural Attenuation of Trichloroethene in a Sandy Unconfined Aquifer
Neale Misquitta, Dale Foster, and Jeff HaleKey Environmental, Inc., Carnegie, Pennsylvania
Primo Marchesi and Jeff BlankenshipAmerican Color and Chemical Corporation, Lockhaven, Pennsylvania
The natural attenuation of dissolved-phase trichlo-roethene (TCE) in ground water was evaluated at astate-regulated, operating chemical plant in South Caro-lina. Natural attenuation was documented via the ob-served attenuation and loss of TCE within a sandyunconfined aquifer (approximately 25 feet thick withKh=10-3 centimeters per second), 8 years of ground-water monitoring data, and modeling with site-specificretardation coefficients.
The evaluation and demonstration of natural attenuationof TCE was part of a successful technical argument thatconsidered the natural microbial and/or geochemicalattenuation processes in the establishment of down-gradient ground-water quality compliance points, obvi-ating the need for containment or other remedial actions.The recently promulgated South Carolina GroundwaterMixing Zone Regulations require that, under very spe-cific and stringent attenuation conditions, alternateground-water protection standards are addressed inzones where attenuation of dissolved-phase chemicalsis demonstrated.
No relationship between TCE, electron acceptors, andbiodegradation byproduct isopleth maps was observed,suggesting that TCE was not degrading via aerobic oranaerobic pathways. Elevated microtoxicity levels wereobserved, and minimal quantities of both aerobic andanaerobic TCE degraders were identified. The empirically
calculated Kd (using soil total organic carbon [TOC]) wasestimated to be 0.4 liters per kilogram. The resultingempirically calculated retardation factor did not correlatewith the observed attenuation of TCE at the site, indicat-ing that non-TOC related mechanisms were contribut-ing to TCE attenuation. Consequently, a site-specificKd was estimated via batch adsorption tests employ-ing toxicity characteristic leaching procedure extrac-tion techniques, using ground water and soils from thesite area of interest. A site-specific Kd of 10 liters perkilogram was estimated through these tests. The site-specific retardation factor correlated with the observednatural attenuation of TCE. Differences in the site-specific retardation factor and the empirically calcu-lated estimate may be attributed to soil/ground-watergeochemical interactions, such as low pH-inducedbonding of the TCE to the soil matrix, which are unre-lated to TOC.
Subsequent ground-water modeling using the site-spe-cific retardation factor (and Kd) indicates that dissolved-phase TCE would not migrate to the downgradientreceptor for a minimum period of 100 years. The finalnatural attenuation remedy for the site, recommendedin the mixing zone application submitted to South Caro-lina, included a time-weighted “monitoring only” compo-nent with no active remediation. This application iscurrently under review.
164
Analysis of Intrinsic Bioremediation of Trichloroethene-ContaminatedGround Water at Eielson Air Force Base, Alaska
Kyle A. Gorder, R. Ryan Dupont, Darwin L. Sorensen,Maria W. Kemblowski, and Jane E. McLean
Utah Water Research Laboratory, Utah State University, Logan, Utah
A simple ground-water model was used to determine theapparent rate of trichloroethene (TCE) transformation,to estimate the mass of TCE and its transformationproducts, and to predict the effects of active treatmentoptions, such as source removal, at Eielson Air ForceBase, Alaska.
A modification of the three-dimensional solution to theadvection-dispersion-reaction equation (ADRE) pro-posed by Domenico (1) was used to estimate the rateof TCE transformation. The model was calibrated usingthe spatial distribution of TCE observed during a fieldsampling event conducted in July 1995. TCE concentra-tions as high as 90,000 micrograms per liter were ob-served at the site and utilized in the model calibrationeffort. The calibrated model showed that intrinsic reme-diation of TCE is occurring at the site. The estimatedfirst-order degradation rate for TCE ranged from 0.0020to 0.0064 day-1.
TCE mass and apparent mass degraded were also esti-mated using the calibrated model. TCE mass predictions
using the model closely matched TCE mass calculatedfrom observed ground-water data. The TCE mass de-graded was used to estimate the mass of TCE productsthat would be present in the system, assuming theseproducts are accumulating. A comparison of observedproduct mass to the estimated mass of these com-pounds showed that the mass of these compoundspresent was significantly less than estimated, suggest-ing rapid transformation of the compounds to nonchlori-nated compounds.
The calibrated model was also used to predict the ef-fects of source removal on the lifetime of the dissolvedTCE plume. These predictions, along with source life-time estimations, suggest that source removal activitiesmay not significantly reduce the time required to meetcleanup goals for the site.
Reference1. Domenico, P.A. 1987. An analytical model for multidimensional
transport of a decaying contaminant species. J. Hydrol. 91:49-58.
165
Involvement of Dichloromethane in the Intrinsic Biodegradation of Chlorinated Ethenes and Ethanes
Leo L. LehmickeBeak Consultants, Kirkland, Washington
Evan E. Cox and David W. MajorBeak Consultants, Guelph, Ontario
The metabolism of dichloromethane (DCM) by acetogenicmicroorganisms has resulted in the production of an elec-tron donor (acetic acid) that is stimulating reductivedechlorination of tetrachloroethene (PCE), trichloroethene(TCE), and 1,1,1-trichloroethane (TCA) to ethene and eth-ane in a shallow aquifer beneath a bulk chemical transferfacility in Oregon. DCM, TCE, and toluene releases as wellas de minimis losses of PCE, TCA, ethylbenzene, andxylene have occurred at the site. DCM concentrations inthe source area decreased by an order of magnitude (from2,300 milligrams per liter [mg/L] to 190 mg/L) between1990 and 1995, with corresponding production of aceticacid. The distribution of DCM attenuates two orders ofmagnitude to less than 1 mg/L within 100 meters from the
source area, far more rapidly than predicted by its mo-bility in the site ground water. PCE, TCE, and TCA con-centrations also attenuate more rapidly downgradient fromthe source area than would be predicted by their mobilitiesrelative to the ground-water velocity at the site. The distri-butions of 1,2-dichloroethene, vinyl chloride (VC), 1,1-di-chloroethane, and chloroethane (CA) increase downgradientfrom the source area. Ethene and ethane are present inthe ground water downgradient from the source area, inassociation with VC and CA, indicating that the chlorinatedvolatile organic compounds are being dechlorinated toenvironmentally acceptable end products. Intrinsic biore-mediation is being considered as a remediation alternativefor this site.
166
Intrinsic Bioremediation of 1,2-Dichloroethane
Michael D. LeeDuPont Central Research and Development, Newark, Delaware
Lily S. SehayekDuPont Environmental Remediation Services, Wilmington, Delaware
Terry D. VandellConoco, Ponca City, Oklahoma
Spills of 1,2-dichloroethane, also known as ethylenedichloride (EDC), resulted in free- phase contaminationof a Gulf Coast site. There are two aquifers beneath thesite, as well as peat, clay, and silt layers. An ongoingrecovery and hydraulic containment program in the shal-low aquifer is recovering nonaqueous-phase liquid(NAPL) and dissolved-phase EDC. Degradation prod-ucts of EDC, including 2-chloroethanol, ethanol, ethene,and ethane, were detected in both the highly contami-nated upper aquifer as well as in the deeper, less con-taminated aquifer. Possibly as a result of crosscontamination during drilling operations, low concentra-tions (less than 1.0 parts per million) of dissolved EDCwere detected in the deeper aquifer.
EDC concentrations in wells in the deeper aquifer havedecreased greatly over the last year, to between lessthan 0.005 parts per million (the detection limit) and 0.05parts per million. First-order decay half-lives for loss ofEDC from wells in this aquifer range from 64 to 165days. Laboratory microcosm studies demonstrated thatmicrobes from the deeper aquifer can transform EDCunder anaerobic conditions. A geochemical evaluationdemonstrated that microbes at the site are capable ofusing oxygen, nitrate, sulfate, iron, manganese, and
carbon dioxide as electron acceptors; elevated methaneconcentrations indicate carbon dioxide is the major elec-tron acceptor.
Modeling efforts with DuPonts comprehensive multi-phase NAPL model revealed that free-phase EDC willnot reach the underlying aquifer because of retention ofthe free-phase EDC in the overlying silt and clay zonesand ongoing intrinsic biodegradation of the dissolved-phase EDC. The three-dimensional, three-phase finitedifference model includes simultaneous flow of water,gas, and organic phases; energy transport; tempera-ture-, pressure-, and composition-dependent interphasepartitioning; and dispersive transport within phases. Themodel was originally developed by Sleep and Sykes (1,2) and modified by Sehayek. The modified model is notcommercially available.
References1. Sleep, B.E., and J.F. Sykes. 1993. Compositional simulation of
groundwater contamination by organic compounds, 1. Model de-velopment and verification. Water Resour. Res. 29(6):1697-1708.
2. Sleep, B.E., and J.F. Sykes. 1993. Compositional simulation ofgroundwater contamination by organic compounds, 2. Model ap-plications. Water Resour. Res. 29(6):1709-1718.
167

A Practical Evaluation of Intrinsic Biodegradation of Chlorinated Volatile Organic Compounds
Frederick W. Blickle and Patrick N. McGuireBlasland, Bouck & Lee, Inc., Boca Raton, Florida
Gerald LeoneWaste Management, Inc., Atlanta, Georgia
Douglas D. MacauleyReynolds Metals Corporation, Richmond, Virginia
At a former industrial site, intrinsic bioremediation wasevaluated to address low levels (less than 100 micro-grams per liter [µg/L]) of chlorinated volatile organiccompounds (VOCs) in ground water. The VOCs de-tected in ground water include chlorinated ethanes, 1,1-dichloroethene, vinyl chloride, chlorobenzene, benzene,toluene, and ethylbenzene. Total VOC concentrationsranged from not detected to 530 µg/L. Historically, thesite was mined for rock and subsequently used for thedisposal of tailing sands and clay waste from ore proc-essing. As a result, a complicated ground-water systemconsisting of at least five water-bearing units exists atthe site. Although current remedial activities at the site,including a ground-water pump-and-treat system, havebeen effective at reducing VOC levels to their presentconcentrations, continued pumping does not appear tobe effective at further concentration reduction.
To reevaluate remedial options, an assessment of naturallyoccurring transformation processes was performed. In-itially, the assessment included VOC data over time,collected to monitor the ground-water pump-and-treat sys-tem. Long-term ground-water monitoring results indicate
that concentrations of parent VOC compounds havebeen reduced in all water-bearing units; after an asso-ciated temporary increase, a reduction in concentrationsof reduction dehalogenation breakdown products wasobserved.
To further determine whether the natural attenuationobserved at the site is a result of intrinsic bioremedia-tion, a study was implemented involving field monitoringand ground-water sampling and analysis for select geo-chemical indicator compounds and dissolved perma-nent gases. The geochemical indicator compoundsincluded NO3/N, total and dissolved iron, and SO4/S.Dissolved permanent gases include oxygen, CH4, andCO2. Redox potential and pH were field measured. Con-centrations of organic compounds were evaluated overtime, and trends in inorganic indicator compound anddissolved permanent gas concentrations were evalu-ated spatially. Results of this study strongly suggest thatintrinsic bioremediation is responsible for transformationof the VOCs present in site ground water. This posterdiscusses the study and provides results for evaluatingbioremediation of chlorinated VOCs in ground water.
168
New Jersey’s Natural Remediation Compliance Program:Practical Experience at a Site Containing Chlorinated Solvents and
Aromatic Hydrocarbons
James Peterson and Martha MackieMcLaren/Hart Environmental Engineering Corporation, Warren, New Jersey
In recent years, regulatory agencies have begun toplace increasing emphasis on understanding the naturalmechanisms of contaminant degradation/attenuation inground-water at sites undergoing remediation. Guide-lines and criteria for natural remediation assessmentshave been established at both the state and federallevel, providing the regulated community with an im-proved ability to determine site conditions under whicha natural remediation approach is feasible and will beacceptable to regulators. These initiatives reflect transi-tion from conventional remedy selection to considera-tion and appropriate implementation of alternateremedies that incorporate considerations of risk andcost-effectiveness.
One good example of this evolving regulatory processis the Natural Remediation Compliance Program(NRCP), developed by the New Jersey Department ofEnvironmental Protection (NJDEP). General guidelines(termed “minimum requirements”) for natural remedia-tion proposals were defined concurrent with NJDEP’sestablishment of the NRCP in 1994 and have beenaugmented recently by detailed technical suggestionsfor screening of sites (1).
In late 1994, McLaren/Hart Environmental EngineeringCorporation conducted investigative and remedial activi-ties that led to a proposal to implement the NRCP at aNew Jersey industrial site with soil and ground-wateraffected by chlorinated solvents and aromatic hydrocar-bons. The NRCP proposal, submitted as part of a reme-dial action workplan for site ground water andconcurrent with a remedial action report for source areasoils, addressed the following NJDEP prerequisite con-ditions (“minimum requirements”) for natural remedia-tion proposals: delineation and remediation of sources;contaminant migration assessment to confirm receptors
not at risk; documentation of degradibility and/or attenu-ation capacity; identification of site-specific charac-teristics favorable to natural degradation and/orattenuation; establishment of a sentinel well system;development of a ground-water monitoring program;documentation regarding current and potential futureground-water uses; and written notification to potentiallyaffected downgradient property owners.
Specific activities conducted to address the require-ments included delineation of source area soils using aGeoprobe, source area soil excavation/disposal,postexcavation sampling, ground-water sampling, in situmeasurement of ground-water field parameters, a wellsearch, and an evaluation of potential receptor impactsthrough modeling. The results of these investigationssuggested that “steady state” conditions of contaminantinflux and attenuation were in effect, and that, even inthe absence of the source remediation conducted, re-ceptor impacts were not expected. Accordingly, theNRCP proposal was submitted, requesting approval toimplement the monitoring program outlined therein.
This program could save the property owner significantremediation costs. Given NJDEP’s rigorous minimumrequirements for NRCP implementation, the costs todemonstrate applicability of the NRCP should be com-pared with costs for active ground-water plume manage-ment. This cost evaluation will allow a property owner tomake informed decisions regarding remedial optionsand cash flow management.
Reference
1. New Jersey Department of Environmental Protection. 1996. Siteremediation news. March.
169

Field and Laboratory Evaluations of Natural Attenuationof Chlorinated Organics at a Complex Industrial Site
M. Alexandra De, Julia Klens, Gary Gaillot, and Duane GravesIT Corporation, Knoxville, Tennessee
Natural attenuation of tetrachloroethene (PCE), trichlo-roethene (TCE), carbon tetrachloride, and hexachlo-robenzene (HCB) is under investigation at a largeindustrial site. The site has a number of complexitiesdue to past manufacturing activities, topography, hydrol-ogy, and the presence of several surface water bodiesthat are connected to shallow ground water. Perchedground water, shallow and deep aquifers, creeks, rivers,and a manufactured impoundment all contribute to sitehydrology and affect ground-water flow direction andvelocity. Regions of high ground-water pH (pH 10 to 14)are found beneath settling ponds that contain high pHwaste liquors from past manufacturing processes.Ground-water microbes have been shown to be inactivewhen the pH exceeds 9.5. The aquifer apparently hassignificant buffering capacity to neutralize the groundwater as it migrates away from the impoundments.
Contaminant concentration varies across the site,with dense nonaqueous-phase liquid contributing ahigh concentration of dissolved contaminants in a fewlocations. Contaminant concentration changes and theoccurrence of anaerobic biodegradation products of
PCE and TCE support the conclusion that intrinsicbiodegradation is occurring. Attenuation rates for PCE,TCE, and cis-1,2-dichloroethene indicate a half-life ofapproximately 300 days for each. Preliminary evidenceof intrinsic biodegradation has also been derived fromground-water geochemistry data. Increased concentra-tions of iron(II) and dissolved manganese correspondwith neutral ground-water pH, chemicals of concern,and biodegradation products. Nitrate is found in verylow concentrations in the general area, and this respi-ratory substrate does not significantly contribute tobiodegradation. Ground-water alkalinity is affected bysite activities and pH, which mask changes in alkalinitydue to intrinsic biodegradation. Dissolved methaneconcentrations, oxidation reduction potential, sulfateconcentrations, and dissolved oxygen in the groundwater are currently being examined.
This poster discusses the intrinsic remediation of PCEand TCE with respect to contaminant concentrationsand ground-water geochemistry. Laboratory studiesconducted to evaluate the rate of biodegradation arealso described.
170

Assessment of Intrinsic Bioremediation of Chlorinated Aliphatic Hydrocarbons at Industrial Facilities
Marleen A. Troy and C. Michael SwindollDuPont Environmental Remediation Services, Wilmington, Delaware
Intrinsic bioremediation of chlorinated aliphatics at sev-eral industrial sites was evaluated to determine its sig-nificance and whether it could be used as a correctiveaction alternative for reducing potential environmentalimpact. The premise behind the implementation of anintrinsic bioremediation approach was that naturally oc-curring microorganisms present in subsurface environ-ments of each site were capable of degrading thecontaminants of interest and that the contaminant con-centrations would be degraded to acceptable levels.
A variety of chlorinated aliphatic hydrocarbons weredetected in ground water at the sites, including tetrachlo-roethene (PCE), trichloroethene (TCE), dichloroethene(DCE), vinyl chloride (VC), trichloroethane (TCA), andmethylene chloride. Concentrations of individual chlorin-ated aliphatics typically ranged from nondetect to lessthan 500 micrograms per liter (mg/L), with the highestconcentrations in the 1,000 to 3,000 mg/L range.
Ground-water data from each site were examined forindicators of intrinsic bioremediation and the existenceof conditions favorable for bioremediation. Indicators ofintrinsic bioremediation included changes in contami-
nant concentrations, detection of biodegradation meta-bolites, and changes in geochemical measurements.Indicators of conditions favorable for bioremediation thatwere evaluated included pH, oxidation-reduction poten-tial, concentrations of electron acceptors, nutrients, pri-mary substrates sufficient to support microbial activity,and the lack of inhibitory concentrations of toxicants.
The data from each site were collectively evaluatedthrough a “weight-of-evidence” approach to determinewhether intrinsic bioremediation was a viable remedialalternative for each site. Based on these evaluations, itwas concluded that intrinsic bioremediation was occur-ring under anaerobic conditions at each site, nonchlori-nated co-contaminants served as primary substrates,and microbial activity was limited by nutrient availability.
Although the data indicated that intrinsic bioremediationwas occurring, the existing data were insufficient tosupport intrinsic bioremediation as the sole remedialalternative. Ground-water monitoring for indicator pa-rameters continued to allow further evaluation of thepotential application of intrinsic bioremediation as a re-medial alternative for the sites.
171

Natural Attenuation as Remedial Action: A Case Study
Andrea PutscherCamp Dresser & McKee, Woodbury, New York
Betty MartinovichPolytechnic University, Farmingdale, New York, and Camp Dresser & McKee,
Woodbury, New York
The subject site is an informative case study of factorsleading to a decision by state regulators to acknowledgenatural attenuation as the principal action to remediatetrichloroethene (TCE), cis-1,2-dichloroethene (cis-1,2-DCE), and vinyl chloride.
A team of hydrogeologists and engineers, under contractwith the New York State Department of Environmental Con-servation (NYSDEC), completed a remedial investigationand feasibility study for a site in Rockland County, NewYork. The site is in the glaciated northeast, with a 100-foot thick glacial till underlying the site. The till overliesBrunswick (Passaic) formation fractured silty sandstonebedrock, which comprises the principal aquifer systemin the site vicinity. Heterogeneity in the till and fracturedrock ground-water hydraulics have resulted in a com-plex array of potential contaminant migration pathways.
A lighting fixture manufacturing operation discharged anunknown volume of liquid waste containing TCE-domi-nated mixed volatile organic compounds (VOCs), inconcentrations ranging from 1 to 1,000 parts per milliontotal VOC, into a shallow, ephemeral stream/drainageditch on site for an unknown period, ending in 1980. Theremedial investigation was initiated in 1994, 14 yearsafter the discharge was eliminated, and implemented intwo phases over a 1.5-year period. The timing and dura-tion of the investigation facilitated identification andcharacterization of natural degradation and attenuationof the chlorinated constituents (TCE, cis-1,2-DCE, andvinyl chloride) in the site subsurface.
Project personnel used conventional techniques, includ-ing soil gas survey and stream sediment, soil, surfacewater, and ground-water sampling and analysis, duringthe initial Phase I remedial investigation. The Phase IRemedial Investigation and Phase I and II FeasibilityStudy lasted 1 year. The investigation and study resultssuggested that concentrations of chlorinated constitu-ents were naturally attenuating to levels below NYSDECestablished cleanup standards (in the parts per billionrange). Furthermore, the rates of natural attenuationappeared to be sufficient to preclude offsite migration viamost of the potential pathways.
Due to the indications that natural attenuation was func-tioning on site, project personnel designed and imple-mented a focused Phase II remedial investigation that,in part, addressed natural attenuation related issues.The latter phase of the remedial investigation was im-plemented over a period of 6 months and includedmodified techniques and strategies for stream sediment,soil, surface water, and ground-water sampling andanalysis, in addition to a treatability study at the field andlaboratory scale. The remedial investigation/feasibilitystudy RI/FS was completed in February 1996. The re-cord of decision was signed in March 1996, and theselected remedy allows for limited (near-surface hot-spot removal) soils remedial action and continuedground-water monitoring to demonstrate the efficacy ofnatural attenuation in the subsurface as the principalground-water remedial action for the site.
172
Patterns of Natural Attenuation of Chlorinated Aliphatic Hydrocarbonsat Cape Canaveral Air Station, Florida
Matt Swanson, Todd H. Wiedemeier, and David E. MoutouxParsons Engineering Science, Inc., Denver, Colorado
Donald H. KampbellU.S. Environmental Protection Agency, National Risk Management Research Laboratory,
Subsurface Protection and Remediation Division, Ada, Oklahoma
Jerry E. HansenU.S. Air Force Center for Environmental Excellence, Technology Transfer Division,
Brooks Air Force Base, Texas
Activities at a former fire training area (Site CCFTA-2[FT-17]) at Cape Canaveral Air Station in Florida re-sulted in contamination of shallow soils and groundwater with a mixture of chlorinated aliphatic hydrocar-bons (CAHs) and fuel hydrocarbons. The dissolvedcontaminant plume, beneath and at least 1,200 feetdowngradient from a body of mobile, light nonaqueousphase liquid (LNAPL) containing commingled petro-leum and chlorinated solvents, consists of commin-gled benzene, toluene, ethylbenzene, and xylenes(BTEX) and CAHs. Before construction of a horizontalair sparging system, contaminated ground water dis-charged to surface water in a canal downgradient ofthe source area. The desire for a long-term approachto address the dissolved contaminant mass promptedan assessment of the potential for natural attenuationmechanisms to reduce the mass, toxicity, and mobilityof trichloroethene (TCE), dichloroethene (DCE), vinylchloride (VC), and BTEX dissolved in ground water atCCFTA-2 (FT-17).
Several lines of chemical and geochemical evidenceindicate that dissolved CAHs at the site are undergoingreductive dehalogenation, facilitated by microbial oxidation
of BTEX compounds and native organic matter. Data onthe distributions of TCE, cis-1,2-DCE, VC, and etheneindicate that TCE dissolved from the LNAPL body isbeing sequentially dehalogenated, with VC accumulat-ing near the terminus of the CAH plume. While theground-water system outside of the plume is nearlyanaerobic due to microbial degradation of native organicmatter, petroleum hydrocarbons released at the sitehave fostered additional microbial activity and createdconditions that favor reductive dehalogenation of CAHs.Distribution of electron acceptors and metabolic bypro-ducts, along with dissolved hydrogen concentrations,indicate that biodegradation mechanisms operating atthe site include aerobic respiration, iron reduction, sul-fate reduction, and methanogenesis.
Approximation of field-scale biodegradation rates at thesite suggests that TCE and cis-1,2-DCE have a half-lifeof approximately 2.4 to 3.2 years. Because reducingconditions persist from the source area to the canal, VChas accumulated and therefore affected surface water.Air sparging near the canal, however, will serve to bothphysically remove dissolved contaminants and fostermore rapid (aerobic) biodegradation of VC.
173

Applying Natural Attenuation of Chlorinated Organicsin Conjunction With Ground-Water Extraction for Aquifer Restoration
W. Lance Turley and Andrew RawnsleyHull & Associates Engineering, Inc., Austin, Texas
Natural attenuation of dissolved chlorinated organics(primarily tetrachloroethene, trichloroethene, and 1,1,1-trichloroethane) via dilution is being successfully em-ployed near the end of a 2,200-foot long plume at theSouth Municipal Water Supply Well Superfund site inPeterborough, New Hampshire. The U.S. Environ-mental Protection Agency’s (EPA’s) record of decisionrequired that the entire plume be remediated throughpumping a network of extraction wells. Installation andoperation of an extraction well near the end of the plumewas not practical, however, because of property accessdifficulties, the presence of a flood plain, and anticipatedproblems in conveying extracted water via a forcemaindue to expected low flows and a large head differential.
Field measurements were supported by finite-difference,three-dimensional flow modeling and indicated that theaquifer at the end of the plume discharges into the Con-toocook River. Furthermore, modeling indicated that dis-charge would occur, although at a lower rate, when theaquifer was pumped in upgradient portions of the plume.
Modeled flux through the end of the plume wascompared with projected removal rates by an extractionwell and was found to be similar. Concentrationsof water discharging into the river were conservativelyestimated based on the highest concentration detectedin a monitoring well within the proposed attenuationzone. Dilution factors were calculated based on theflux of contaminated water from the aquifer versusthe river’s 7-day low flow over a period of 10 years(7Q10). Dilution factors were applied to discharge con-centrations, and results were compared with health-based water quality criteria (for water and fish ingestion)and found to be acceptable. Finally, a flushing modelwas used to determine that the attenuation zone wouldbe reduced to cleanup levels within the time framestated in the record of decision. EPA accepted thetechnical arguments for integrating natural attenuationinto the ground-water remediation system, and the re-cord of decision was modified accordingly through issu-ance of an explanation of significant difference.
174
A Modular Computer Model for Simulating Natural Attenuation ofChlorinated Organics in Saturated Ground-Water Aquifers
Yunwei Sun and James N. PetersenChemical Engineering Department, Washington State University, Pullman, Washington
T. Prabhakar Clement and Brian S. HookerPacific Northwest National Laboratory, Richland, Washington
Although several field-scale natural attenuation projectshave already been considered for managing benzene,toluene, ethylbenzene, and xylene (BTEX) plumes, arational basis for implementing natural attenuation tech-nology has yet to be formulated for chlorinated solventplumes. Successful validation of natural attenuation in-volves significant upfront and followup field charac-terization to ensure that intrinsic processes are indeeddestroying contaminants of concern at reasonable rates.Given the extensive amount of data collected during thistype of effort, computer-aided design and data analysistools are needed. These tools must facilitate the inter-pretation of these data so that the design engineer candetermine whether intrinsic remediation can achieve thecleanup objectives and assess the risks associated withthe action. Computer models are also useful for fore-casting the influence of natural attenuation processesover long periods.
To adequately analyze natural attenuation processes,models should also consider simultaneous multispeciestransport and bio- and geochemical interactions. Thisposter describes a newly developed computational tool,designated RT3D (Reactive Transport in Three Dimen-sions). This tool can simulate natural attenuation ofvarious subsurface contaminants and their decay prod-ucts in saturated ground-water aquifers.
RT3D was developed from the U.S. Environmental Pro-tection Agency’s public domain computer code MT3D.
The MT3D model simulates single-species transportwith or without sorption and first-order reaction. Con-taminant transport velocities are calculated from thehead distribution computed by the U.S. Geological Sur-vey’s model MODFLOW.
We have extended MT3D to describe multispeciestransport and reactions. The present version of RT3Dcan simulate three-dimensional transport of multipleaqueous-phase species and the fate of multiple solid-phase species, along with the physical, chemical, andbiological interactions among them. The code is organ-ized in a modular fashion to ensure flexibility. The reac-tive portion of the code is a separate module using anoperator-split strategy; hence, any type of reaction kinet-ics can be accommodated through an appropriate reac-tion module. The present version has four separatereaction modules: aerobic, instantaneous BTEX reac-tions (similar to BIOPLUME II); multiple-electron ac-ceptor, kinetic-limited BTEX reactions (similar toBIOPLUME III); denitrification-based carbon tetrachlo-ride transformation reactions; and chlorinated ethenereactions.
This poster describes the numerical details of the RT3Dcode and the chlorinated ethene reaction module. Anexample problem is solved to illustrate the potential useof this code for planning natural attenuation of chlorin-ated organics in saturated ground-water aquifers.
175

State and Federal Regulatory Issues
Federal and State Meeting on Issues Impacting the Use of Natural Attenuation forChlorinated Solvents in Ground Water—An Overview
Introduction
On September 10, 1996, a meeting took place in Dallas,Texas, to discuss state and federal regulatory issuesaffecting natural attenuation of chlorinated solvents.This meeting was held in conjunction with EPA’s Sym-posium on Natural Attenuation of Chlorinated Organicsin Ground Water. The major topics of discussion were:
• Site characterization
• Monitoring
• Degradation rates
• Risk management and closure issues
• Technical impracticability (TI) waivers
Fran Kremer and John Wilson of EPA’s Office of Re-search and Development chaired the meeting; an over-view of the topics discussed at the meeting is presentedbelow.
Site Characterization
The discussion of site characterization addressed fourmajor issues:
• The identification of important indicator parametersfor natural attenuation, and the development ofstandard operating procedures, quality assur-ance/quality control plans, and data quality objec-tives for the measurement of those parameters.
• An overall protocol for assessing the redox chemistryof the subsurface environment.
• The reliability of rapid field estimation techniques.
• The need for methods to characterize nonaqueousphase liquids (NAPLs).
The redox chemistry of the subsurface environmentplays an important role in governing the rate and extentof natural attenuation. A representative of the U.S. Geo-logical Survey (USGS) stated that the 10 parameterscurrently measured by the Survey as indicators of natu-ral attenuation are dissolved oxygen, nitrate, nitrite, fer-rous sulfate, sulfite, methane, chloride, carbon dioxide,and hydrogen. The need for an overall protocol for as-
sessing the redox chemistry was recognized. It wassuggested that USGS and EPA collaborate in develop-ing such a protocol.
The discussion emphasized the need for rapid and reli-able field techniques. Participants debated the pros andcons of field and laboratory analytical methods, anddiscussed, for example, the need to consider the trade-offs between sample integrity (collection, preservation,and laboratory analysis) and the relative accuracy ofsimple Hach kits. Also important is the need for trainedpersonnel to perform onsite analytical measurements.
The importance of identifying the sources of contamina-tion due to NAPLs was stressed. Participants urgedconsideration of push-technologies such as cone pene-trometer because they can provide quick and depend-able estimates of parameters. Further work needs to beundertaken to develop improved methods to charac-terize subsurface NAPLs.
Monitoring
Natural attenuation is not a “walk-away” remedy. In fact,it requires a rigorous and long-term monitoring strategyto indicate that natural processes are effective in reduc-ing contaminants to acceptable levels before potentialreceptors are reached. Since improper monitoring maylead to misconceptions about the extent and/or the typesof biotic and abiotic processes occurring at a contami-nated site, a thorough remediation strategy should in-clude a complete site characterization investigationfollowed by performance monitoring. The need to selectproper monitoring locations and sampling frequencies toindicate spatial and temporal variability of a site was arecurring theme in the discussion. Developing a concep-tual model is essential for the interpretation of datacollected during the monitoring process.
The discussion reemphasized that compared to otherremedial efforts, natural attenuation requires a moreintensive hydrogeologic characterization. During the im-plementation of other proactive remedial technologies,such as pump and treat, the natural gradients of ground-water flow are significantly altered. Since natural attenu-ation is a passive remedy, however, understanding theexisting flow conditions is very important.
179

In addition to establishing points of compliance toachieve a primary goal of monitoring, it is important toshow that a plume will not migrate beyond acceptedboundaries. Achieving these goals entails performing adetailed geochemical study prior to the selection of natu-ral attenuation as a remedial alternative and conductingperiodic sampling to assure that remediation is occur-ring. The duration and frequency of sampling is dictatedby the velocity of flow, location of monitoring wells, andvarious site-specific factors. Monitoring should occurmore frequently initially and then be reduced when re-mediation rates, pattern of migration, and seasonal in-fluences are established.
Participants discussed the need for validation of datafrom conventional wells and mass balance calculations,as well as the role and importance of numerical modelsversus field data. The extent to which numerical model-ing could replace field data and assist regulators inpredicating degradation of chlorinated compoundsand/or behavior of a plume was the topic of interest.Participants expressed a need for standard operatingprocedures for analyzing different classes of com-pounds, in particular dissolved gases. They also dis-cussed the importance and role of hydrogen levels in thehierarchical scheme of terminal electron acceptor proc-esses. In general, the discussion indicated a need forinformation about potential parameters for evaluatingbiodegradation of chlorinated solvents in ground water.
Degradation Rates
Estimating the rate of natural attenuation requires agood understanding of both degradation rates and hy-drogeology. Participants expressed concerns about theevaluation of natural attenuation in the presence of amixture of contaminants, both organic and inorganic.Although the degradation of dissolved petroleum hydro-carbons has been observed to follow first-order kinetics,it is unclear whether the degradation of chlorinated hy-drocarbons is generally a first-order process. Toxicity,competitive inhibition, and nutrient availability areamong the factors that can cause the kinetics of themicrobial degradation process to significantly deviatefrom the first-order model.
Participants discussed three methods for estimating thefirst-order degradation rate constant (k): conservativetracer study, microcosm study, and transport modeling.Tracer studies are not commonly performed becausethey are time consuming and the results have a greatdeal of uncertainty associated with them. Laboratorymicrocosm studies are more commonly used to esti-mate k, but they too are prone to uncertainty becausethe laboratory setup cannot truly mimic field conditions.If field data cannot be obtained to determine degradationrates, microcosm studies have to be relied upon for theestimation of the rates. A properly calibrated flow and
transport model can be a valuable tool for the estimationof first-order rate constants. Participants suggested thatan extensive catalogue of information on rate constantsaccording to contamination scenarios and ground-watergeochemistry would be very useful. This would facilitatethe estimation of k for a given scenario by simply ex-trapolating k values from similar, but known, conditions.
Risk Management and Closure Criteria
This segment of the meeting focused on guidelines forthe types of information regulators need to perform riskassessment and management at sites using naturalattenuation of chlorinated solvents. Regulators stressedthe immediate need for better methodologies for as-sessing environmental risks and determining action lev-els. Better methodologies are needed to ensure thatinstitutional controls can be implemented effectively.The current cleanup guidelines are based only on con-centration and not on real site-specific health and eco-logical risks of available contaminants. Although theNational Contingency Plan is explicit about achievingmaximum contaminant levels (MCLs) within a plume, italso allows for alternate concentration limits (ACLs).The ACLs, however, are seldom used because the as-sociated caveats restrict their use.
Participants concluded that there is a need to betterdescribe and quantify the interactions between surfacewater and ground water. It is important not only to as-sess the risk of ground-water discharge into surfacewater, but also to consider the contamination of groundwater by surface water infiltration. Although the pres-ence of microorganisms as health hazards does notrequire monitoring under Superfund regulations, the is-sue is handled very differently in the proposed ground-water disinfection rule. It is clear that the implications ofthe different ground-water rules need to be clarified.
Another concern repeatedly expressed by participantswas the current data gap in determining whether biode-gradation is actually taking place. There is a need for abetter data base on biodegradation rates to improvejudgments on whether apparent contaminant reductionresults from retardation or degradation. Risk manage-ment and assessment are more difficult for sites con-taminated with chlorinated contaminants than for thosecontaminated with petroleum products. This is becauseof a lack of data bases constructed from case studiesdocumenting both successes and failures of natural at-tenuation under field conditions.
Other important factors to consider in the selection ofnatural attenuation as a remediation option are costeffectiveness and cleanup time. Decision-makers andregulators need to be certain that natural attenuation isachievable within a “reasonable time frame.” In somecases, natural attenuation may be more cost effective
180
than other alternatives, while in other cases, active re-mediation may be more cost effective.
Clear, simple information about the appropriate situ-ations for selecting natural attenuation over other reme-dial alternatives should be made available. Participantssuggested developing protocols to indicate the parame-ters to be selected and the analytical methodologies tobe used. They also stressed the critical need for deci-sion support systems to assist site coordinators in eachstep of the process. Specifically, they requested trainingfor the federal and state decision-makers in evaluatingenvironmental risks.
There is a need to convince both regulators and thepublic that natural attenuation is not a “walk-away” rem-edy. Some participants suggested that the selection ofnatural attenuation may be more appropriate at siteswhere contamination is relatively low, the risk to drinkingwater is negligible, and sources of contamination havebeen removed.
The final critical issue discussed in this segment dealtwith closure criteria. Participants considered it para-mount to have information that can assist in establishingclosure criteria and in determining when a site can beconsidered clean. They questioned the adequacy of thecriteria in current use. It would be of enormous value togenerate information about toxicological testing, pre-sented in clear, simple terms, that addresses specificson toxicity of the daughter products and by-products ofthe degradation process.
Technical Impracticability (TI) Waiver
Participants were concerned that there is considerableconfusion regarding natural attenuation and TI waiversas options for remediation of ground water. Both areerroneously regarded as a “do-nothing” approach andboth typically rely on monitoring and institutional con-trols to ensure continued protection of public health andthe environment. A TI waiver is used when it is nottechnically feasible to return contaminated ground waterto relevant and appropriate cleanup levels (e.g., federalor state drinking water standards). When attainment ofrequired cleanup levels is feasible, natural attenuationcan be selected as the cleanup method, as a alternative
to pump and treat or other methods, if natural processescan achieve the cleanup goals in a time frame that isreasonable compared to other alternatives. Thus, a TIwaiver is not needed in order to select natural attenu-ation as the appropriate remedy because natural proc-esses are expected to attain the required level ofcleanup in a reasonable time frame. At some sites it willbe appropriate to use a TI waiver over a portion of theplume where highly contaminated ground water cannotbe cleaned up but will be contained, and to clean up theremainder of the plume using natural attenuation orother methods.
Monitoring of remedy performance is a critical compo-nent of all ground-water remedies, to ensure that reme-diation remedies are being met and that there are noadverse impacts to public health or the environment.The monitoring data collected to ensure that a naturalattenuation remedy is progressing as expected may bedifferent than that for other types of remedies. As dis-cussed above, geochemical indicators, degradation by-products, and other parameters may need to bemeasured in addition to the contaminants of concern todetermine if biotic and/or abiotic processes are continu-ing as expected.
Summary
The meeting identified the following needs as being ofparamount importance:
• Standard operating procedures for the indicator pa-rameters of natural attenuation and protocols for thedemonstration of natural attenuation of chlorinatedorganics.
• Rapid and reliable field techniques for characterizingthe sources of contamination.
• Improved methods for the estimation of field degra-dation rate constants.
• Development of guidance for the use of natural at-tenuation.
• Training for federal and state decision-makers inevaluating data supporting the use of natural attenu-ation.
181
Summary of Roundtable Discussion on Regulatory Issues
Panelists
• Michael Barden , Hydrogeologist, Wisconsin Depart-ment of Natural Resources
• Mark Ferrey , Research Scientist, Minnesota Pollu-tion Control Agency
• Ruth Izraeli , EPA Hydrogeologist, Co-Chair of Su-perfund/RCRA Ground-water Forum
• Tim Larson , Professional Engineer, Florida Depart-ment of Environmental Protection
• Kenneth Lovelace , Environmental Engineer, Officeof Emergency and Remedial Response, SuperfundDivision, EPA
• Kay Wischkaemper , EPA Hydrogeologist, Co-Chairof Superfund/RCRA Ground-water Forum
Summary
A roundtable discussion on how natural attenuation fitsinto state and federal regulatory frameworks concludedthe symposium. Panelists from state and federal regu-latory agencies answered questions from the audience.The following points were made during the discussion:
• Public acceptance of natural attenuation. Public ac-ceptance of natural attenuation as a tool for risk man-agement and site closure is as critical as regulatoryacceptance. It is important to stress that natural at-tenuation is one technical approach that often is usedin combination with other technical approaches suchas source control, hydraulic containment, and pumpand treat. In other words, stakeholders need to con-vey to the public that natural attenuation is an engi-neered application of a technology, not a “do-nothing”approach. Another public misconception is that con-taminated sites can be cleaned up in several yearsif enough money is allocated. It is therefore importantto emphasize that complete cleanup of a site over ashort time period is often not the most cost-effectivestrategy and may not always be possible.
One person in the audience asked panelists how toconvince regulators and the public that natural attenu-ation is a viable alternative for a large, chlorinatedplume in the Phoenix area. Panelists responded thatkey issues in deciding between various alternatives
and presenting a decision to the public include com-prehensive site characterization, integration of otherremediation tools, ground-water demand, and futureplans for aquifer use.
• Regulatory flexibility with a technical impracticability(TI) waiver. TI waivers can waive ARAR-basedcleanup levels for some ground-water plumes, suchas in those areas with a fractured rock substrate,where the ARAR levels are impossible to achieve. TIwaivers can also be specific to the source zone of aplume, with ARAR-based cleanup levels applying toouter parts of the plume.
• Alternative Concentration Limits (ACLs). ACLs are aseparate regulatory tool that has not been used fre-quently. ACLs might be appropriate in a situationwhere an aquifer under the land between a site anda river is discharging contaminants into the surfacewater of that river. If there is a direct point of dis-charge and if people are not and will not be usingthe aquifer for drinking water as guaranteed by insti-tutional controls, ACLs that are protective of the sur-face water could be set for the ground-water plume.In many places, however, the public will not acceptlong-term or permanent restrictions on aquifer use.
• Site closure via natural attenuation. Natural attenu-ation is an ongoing remedial strategy, the use ofwhich does not necessarily lead to site closure. Thereal issue involved in site closure decisions at naturalattenuation sites is how long the site should be moni-tored before ultimate closure. Trend analysis forplumes of chlorinated solvents is more difficult thanfor hydrocarbon plumes, and site closure decisionsare accordingly more difficult.
• Ground-water classification at the state and federallevel. EPA has various classifications for groundwater in place, but states are encouraged to developtheir own classification schemes to reflect state pri-orities for ground-water protection. For example, astate might declare a certain area as a kind of nonat-tainment zone if that area is subject to contaminationfrom a number of sources and potential for cleanupis low. The federal government is working to developa tool for states to apply consistently in such situ-ations.
183
One person in the audience asked how to classifyaquifers in the arid west that have high alkalinity, hightotal dissolved solids, and high concentrations ofheavy metals and how to classify surface water bod-ies that have extremely high pH levels. EPA hasground-water and surface water classification sys-tems, and these aquifers and surface water bodiesmight fall into a lower-priority class, depending on theconcentrations involved and the quantity of water (forthe aquifers) and on ecological sensitivity (for thesurface water bodies). States, however, may alsodevelop their own classification schemes for groundwater and surface water.
• Natural attenuation at sites that do not fit the classic“sandbox” model. Natural attenuation is an option forsites that do not fit the classic “sandbox” model, suchas sites with a high soil clay content and low ratesof ground-water flow. There are benefits and draw-backs to applying natural attenuation at these sites.The largest drawback is often that natural attenuationmay take a long time to achieve cleanup goals. Aswith any site, site characterization is the most impor-tant step in determining the benefits of natural at-tenuation.
• Cost-benefit analyses for restoring water resources.Cost-benefit analysis can be an important techniquefor setting priorities for cleanup of contaminatedsites. Economists and policy-makers have not yetagreed on a model for conducting cost-benefit analy-
sis, although a number of economists are developingsuch models. One major difficulty is that it is difficultto place a value on water resources.
• Natural attenuation and the “land ban.” If natural at-tenuation is occurring in ground water, the ban onland disposal of untreated hazardous waste does notapply.
• Natural attenuation and natural resources damageclaims. States will probably not pursue natural re-source damage claims under CERCLA on ground-water issues as often as on soil or surface waterissues. Sites at which states might consider pursuingsuch a claim include aquifers used by municipalitiesthat become so contaminated that they are no longeravailable for use.
• Natural attenuation and deed restrictions. Whendeed restrictions are required for controls on futureground-water use, states are generally concernedonly with the end result and let the involved partiesnegotiate these restrictions according to whateverprocess they choose.
• Permeable walls as an alternative remediation strat-egy. Researchers and regulators in a number ofstates are conducting pilot tests on permeable walls.Permeable walls appear to be a promising tool forremediation of sites contaminated with chlorinatedorganic solvents.
184

Appendix A

187
Symposium on Natural Attenuation ofChlorinated Organics in Ground WaterHyatt Regency DallasDallas, TXSeptember 11-13, 1996
Final AgendaWednesday, September 11
Session Chair: Fran Kremer, U.S. EPA
BACKGROUND/PROCESS DESCRIPTION
8:00AM Introductory Remarks . . . . . . . . . . . . . . . . . . . . . . . . . . . . . . . . . . . . . . . . Patricia RiversOffice of the Deputy Undersecretary of Defense,
(Environmental Cleanup),Washington, DC
8:20AM Welcome and Overview Remarks . . . . . . . . . . . . . . . . . . . . . . . . . . . . . . . . . Fran KremerOffice of Research and Development (ORD),
U.S. Environmental Protection Agency (U.S. EPA), Cincinnati, OHCatherine Vogel, U.S. Air Force (USAF), Tyndall AFB, FL
8:50AM Introductory Talk: Where Are We Now?Moving to a Risk-Based Approach . . . . . . . . . . . . . . . . . . . . . . . . . . . . . . . C. Herb Ward
Rice University, Houston, TX
9:15AM Introductory Talk: Where Are We Now With Public and Regulatory Acceptance? (Resource Conservation and Recovery Act [RCRA] and Comprehensive Environmental Response, Compensation, and Liability Act [CERCLA]) . . . . . . . . . . . . . . . . . . . . Kenneth Lovelace
Office of Emergency and Remedial Response,Superfund Division, U.S. EPA, Washington, DC
9:45AM Biotic and Abiotic Transformations of Chlorinated Solvents in Ground Water . . . . . . . . . . . . . . . . . . . . . . . . . . . Perry McCarty
Stanford University, Stanford, CA
10:15AM B R E A K

188
Wednesday, September 11 (cont'd)
10:45AM Microbiological Aspects Relevant to Natural Attenuationof Chlorinated Ethenes . . . . . . . . . . . . . . . . . . . . . . . . . . . . . . . . . . . . . . . James Gossett
Cornell University, Ithaca, NY
11:00AM Microbiological Aspects Relevant to Natural Attenuationof Chlorinated Ethenes (cont'd) . . . . . . . . . . . . . . . . . . . . . . . . . . . . . . . . . . . Steve Zinder
Cornell University, Ithaca, NY
11:15AM Microbial Ecology of Adaptation and Response in the Subsurface . . . . . . . . . . . . . . . . . . . . . . . . . . . . . . . . . . . . . . . . . . . . . . Guy Sewell
National Risk Management Research Laboratory (NRMRL),U.S. EPA, Ada, OK
11:45AM Identifying Redox Conditions That Favor the Natural Attenuation of Chlorinated Ethenes in ContaminatedGround-Water Systems . . . . . . . . . . . . . . . . . . . . . . . . . . . . . . . . . . . . . Francis Chapelle
U.S. Geological Survey (USGS), Columbia, SC
12:15PM L U N C H
Session Chair: Catherine Vogel, U.S. Air Force
1:30PM Design and Interpretation of Microcosm Studies for Chlorinated Compounds . . . . . . . . . . . . . . . . . . . . . . . . . . . . . . . . . . . . . Barbara Wilson
NRMRL, U.S. EPA, Ada, OK
2:00PM Conceptual Models for Chlorinated Solvent Plumes and Their Relevance to Intrinsic Remediation . . . . . . . . . . . . . . . . . . . . . . . . . . . . . . . . John Cherry
University of Waterloo, Waterloo, Ontario, Canada
2:30PM Site Characterization Tools: Using a BoreholeFlowmeter To Locate and Characterize the Transmissive Zones of an Aquifer . . . . . . . . . . . . . . . . . . . . . . . . . . . . . . . . . . . Fred Molz
Clemson University, Anderson, SC
3:00PM B R E A K
3:30PM Evaluation of Natural Attenuation: Current Practices and Opportunities for Ground Water . . . . . . . . . . . . . . . . . . . . . . . . . . . . . . . . Joseph Salvo
General Electric,Corporate Research & Development, Schenectady, NY
4:00PM Overview of the Technical Protocol for Natural Attenuation of Chlorinated Aliphatic Hydrocarbons in Ground Water Under Development for the U.S. Air Force Center for Environmental Excellence . . . . . . . . . . . . . . . . . . . . . . . . . . . . . . John Wilson
NRMRL, U.S. EPA, Ada, OK

189
Wednesday, September 11 (cont'd)
4:30PM The BIOSCREEN Computer Tool . . . . . . . . . . . . . . . . . . . . . . . . . . . . . . Charles NewellGroundwater Services, Inc., Houston, TX
5:00PM A D J O U R N
5:30PM to 7:30PM POSTER SESSION AND CASH BAR
Posters will be on display of projects involving natural attenuation of chlorinated organics and otherxenobiotic compounds. Authors will be present to discuss their projects and answer questions duringthe Poster Session. Posters will remain on display throughout the symposium.
Thursday, September 12
Session Chair: John Wilson, U.S. EPA
CASE STUDIES
8:00AM Introductory Remarks . . . . . . . . . . . . . . . . . . . . . . . . . . . . . . . . . . . . . . . . . Patrick Haas AFCEE, USAF, Brooks AFB, TX
8:15AM Case Study: Naval Air Station, Cecil Field, Florida . . . . . . . . . . . . . . . . . Francis ChapelleUSGS, Columbia, SC
9:00AM Case Study of Natural Attenuation of Trichloroethene at St. Joseph, Michigan . . . . . . . . . . . . . . . . . . . . . . . . . . . . . . . . . . . . . . . . . . James Weaver
NRMRL, U.S. EPA, Ada, OK
9:45AM Natural Attenuation of Chlorinated Aliphatic Hydrocarbons atPlattsburgh Air Force Base, New York . . . . . . . . . . . . . . . . . . . . . . . . Todd Wiedemeier
Parsons Engineering Science, Inc., Denver, CO
10:30AM B R E A K
11:00AM Case Study: Natural Attenuation of a Trichloroethene Plume at Picatinny Arsenal, New Jersey . . . . . . . . . . . . . . . . . . . . . . . . . . . . . Thomas Imbrigiotta
USGS, West Trenton, NJ
11:45AM Case Study: Plant 44, Tucson, Arizona . . . . . . . . . . . . . . . . . . . . . . . . . . . . . Hanadi RifaiRice University, Houston, TX
12:30PM L U N C H
190
Thursday, September 12 (cont'd)
Session Chair: Patrick Haas, U.S. Air Force
1:45PM Remediation Technology Development Forum, Intrinsic Remediation Project at Dover Air Force Base, Delaware . . . . . . . . . . . . . . . . . . . . . . . . . . David Ellis
DuPont Specialty Chemicals-CRG,Wilmington, DE;Joe Salvo, General Electric, Schenectady, NY;
and Gary Klecka, Dow Chemical Company, Midland, MI
2:30PM Case Study: Wurtsmith Air Force Base, Michigan . . . . . . . . . . . . . . . Michael BarcelonaUniversity of Michigan, Ann Arbor, MI
3:15PM B R E A K
3:45PM Case Study: Eielson Air Force Base, Alaska . . . . . . . . . . . . . . . . . . . . . . R. Ryan DupontUtah State University, Logan, UT
4:30PM Considerations and Options for Regulatory Acceptance of Natural Attenuation in Ground Water . . . . . . . . . . . . . . . . . . . . . . Mary Jane Nearman
U.S. EPA, Seattle, WA
4:45PM Lessons Learned: Risk-Based Corrective Action . . . . . . . . . . . . . . . . . . Matthew SmallOffice of Underground Storage Tanks (UST),
U.S. EPA, San Francisco, CA
5:00PM A D J O U R N
7:00PM - 9:00PM EVENING DISCUSSION Informal Dialog on Issues of Ground Water and Core Sampling . . . . . . . . . . . . . . . . . . . . . . . . . . . . . . . . . . . . . . . . Donald Kampbell
NRMRL, U.S. EPA, Ada, OK
Friday, September 13
Session Chair: Marty Faile, U.S. Air Force
8:00AM Introductory Remarks: Appropriate Opportunities for Application—Civilian Sector (RCRA and CERCLA) . . . . . . . . . . . . . . . . . . . Fran Kremer
ORD, U.S. EPA, Cincinnati, OH
8:20AM Introductory Remarks: Appropriate Opportunities for Application—U.S. Air Force and Department of Defense . . . . . . . . . . . . . Patrick Haas
AFCEE, USAF, Brooks Air Force Base, TX
8:40AM Intrinsic Remediation in the Industrial Marketplace . . . . . . . . . . . . . . . . . . . . . David EllisDuPont Specialty Chemicals-CRG, Wilmington, DE
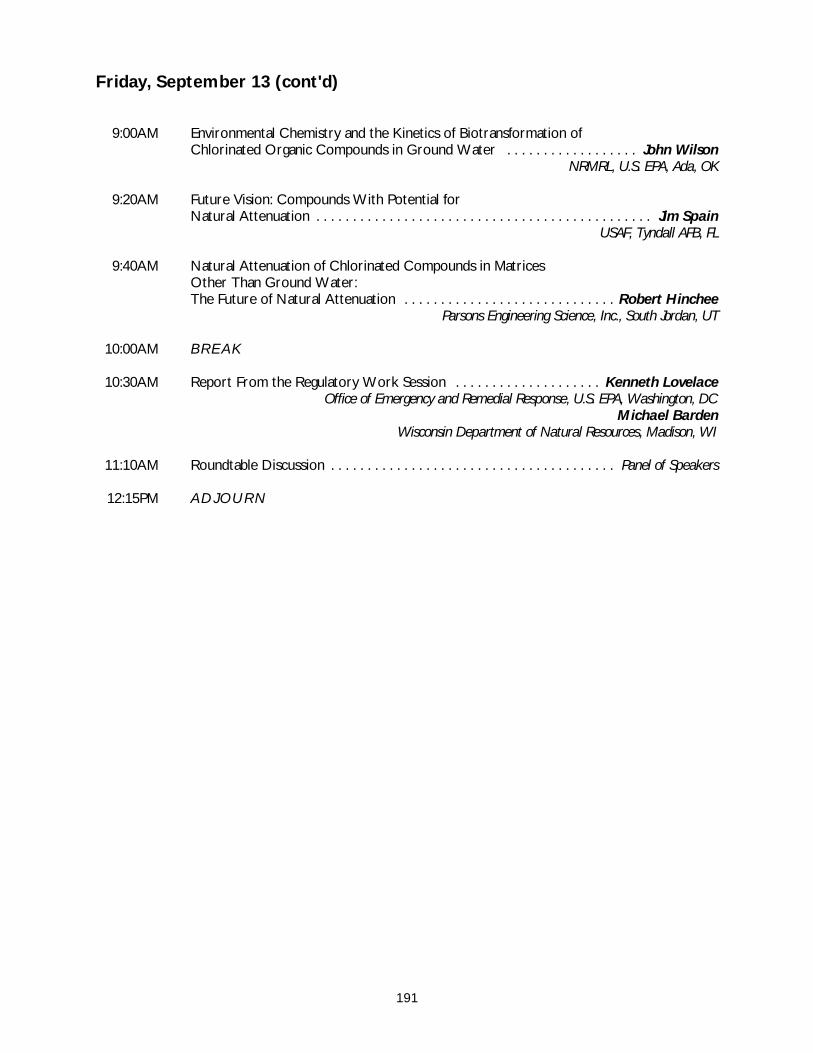
191
Friday, September 13 (cont'd)
9:00AM Environmental Chemistry and the Kinetics of Biotransformation of Chlorinated Organic Compounds in Ground Water . . . . . . . . . . . . . . . . . . John Wilson
NRMRL, U.S. EPA, Ada, OK
9:20AM Future Vision: Compounds With Potential for Natural Attenuation . . . . . . . . . . . . . . . . . . . . . . . . . . . . . . . . . . . . . . . . . . . . . . Jim Spain
USAF, Tyndall AFB, FL
9:40AM Natural Attenuation of Chlorinated Compounds in Matrices Other Than Ground Water:The Future of Natural Attenuation . . . . . . . . . . . . . . . . . . . . . . . . . . . . . Robert Hinchee
Parsons Engineering Science, Inc., South Jordan, UT
10:00AM B R E A K
10:30AM Report From the Regulatory Work Session . . . . . . . . . . . . . . . . . . . . Kenneth LovelaceOffice of Emergency and Remedial Response, U.S. EPA, Washington, DC
Michael BardenWisconsin Department of Natural Resources, Madison, WI
11:10AM Roundtable Discussion . . . . . . . . . . . . . . . . . . . . . . . . . . . . . . . . . . . . . . . Panel of Speakers
12:15PM A D J O U R N