from world development indicators 44642 the little data
TRANSCRIPT
1818 H Street N.W.
Washington, D.C. 20433 USA
Telephone: 202 473 1000
Fax: 202 477 6391
Web site: www.worldbank.org
Email: [email protected]
AFGHANISTAN ALBANIA ALGERIA AMERICAN SAMOA ANDORRA ANGOLA ANTIGUA ANDBARBUDA ARGENTINA ARMENIA ARUBA AUSTRALIA AUSTRIA AZERBAIJAN THE BAHAMASBAHRAIN BANGLADESH BARBADOS BELARUS BELGIUM BELIZE BENIN BERMUDA BHUTANBOLIVIA BOSNIA AND HERZEGOVINA BOTSWANA BRAZIL BRUNEI DARUSSALAM BULGARIABURKINA FASO BURUNDI CAMBODIA CAMEROON CANADA CAPE VERDE CAYMAN ISLANDSCENTRAL AFRICAN REPUBLIC CHAD CHANNEL ISLANDS CHILE CHINA COLOMBIA COMOROSDEMOCRATIC REPUBLIC OF CONGO REPUBLIC OF CONGO COSTA RICA CÔTE D’IVOIRECROATIA CUBA CYPRUS CZECH REPUBLIC DENMARK DJIBOUTI DOMINICA DOMINICANREPUBLIC ECUADOR ARAB REPUBLIC OF EGYPT EL SALVADOR EQUATORIAL GUINEA ERITREAESTONIA ETHIOPIA FAEROE ISLANDS FIJI FINLAND FRANCE FRENCH POLYNESIA GABON THEGAMBIA GEORGIA GERMANY GHANA GREECE GREENLAND GRENADA GUAM GUATEMALA GUINEAGUINEA-BISSAU GUYANA HAITI HONDURAS HONG KONG, CHINA HUNGARY ICELAND INDIAINDONESIA ISLAMIC REPUBLIC OF IRAN IRAQ IRELAND ISLE OF MAN ISRAEL ITALY JAMAICAJAPAN JORDAN KAZAKHSTAN KENYA KIRIBATI DEMOCRATIC REPUBLIC OF KOREA REPUBLICOF KOREA KUWAIT KYRGYZ REPUBLIC LAO PEOPLE’S DEMOCRATIC REPUBLIC LATVIA LEBANONLESOTHO LIBERIA LIBYA LIECHTENSTEIN LITHUANIA LUXEMBOURG MACAO, CHINA FORMERYUGOSLAV REPUBLIC OF MACEDONIA MADAGASCAR MALAWI MALAYSIA MALDIVES MALIMALTA MARSHALL ISLANDS MAURITANIA MAURITIUS MAYOTTE MEXICO FEDERATED STATESOF MICRONESIA MOLDOVA MONACO MONGOLIA MONTENEGRO MOROCCO MOZAMBIQUEMYANMAR NAMIBIA NEPAL NETHERLANDS NETHERLANDS ANTILLES NEW CALEDONIA NEWZEALAND NICARAGUA NIGER NIGERIA NORTHERN MARIANA ISLANDS NORWAY OMANPAKISTAN PALAU PANAMA PAPUA NEW GUINEA PARAGUAY PERU PHILIPPINES POLANDPORTUGAL PUERTO RICO QATAR ROMANIA RUSSIAN FEDERATION RWANDA SAMOA SANMARINO SÃO TOMÉ AND PRINCIPE SAUDI ARABIA SENEGAL SERBIA SEYCHELLES SIERRALEONE SINGAPORE SLOVAK REPUBLIC SLOVENIA SOLOMON ISLANDS SOMALIA SOUTHAFRICA SPAIN SRI LANKA ST. KITTS AND NEVIS ST. LUCIA ST. VINCENT & GRENADINESSUDAN SURINAME SWAZILAND SWEDEN SWITZERLAND SYRIAN ARAB REPUBLIC TAJIKISTANTANZANIA THAILAND TIMOR-LESTE TOGO TONGA TRINIDAD AND TOBAGO TUNISIA TURKEYTURKMENISTAN UGANDA UKRAINE UNITED ARAB EMIRATES UNITED KINGDOM UNITEDSTATES URUGUAY UZBEKISTAN VANUATU REPÚBLICA BOLIVIARANA DE VENEZUELA VIETNAMU.S. VIRGIN ISLANDS WEST BANK AND GAZA REPUBLIC OF YEMEN ZAMBIA ZIMBABWE
From World Development Indicators
Economic and social context
Business environment
Private sector investment
Finance and banking
Infrastructure
The Little Data Book on Private Sector Development
The Little Data Book on Private SectorDevelopment
ISBN 978-0-8213-7430-6
SKU 17430
44642

2008 THE LITTLE DATA BOOKON PUBLIC SECTORDEVELOPMENT

Copyright ©2008 by the International Bank for
Reconstruction and Development/THE WORLD BANK
1818 H Street, N.W., Washington, D.C. 20433
U.S.A.
All rights reserved
Manufactured in the United States of America
First printing May 2008
ISBN: 978-0-8213-7430-6
E-ISBN: 978-0-8213-7431-3
DOI: 10.1596/978-0-8213-7430-6
The Little Data Book on Private Sector Development 2008 is a product
of the Development Data Group of the Development Economics
Vice Presidency and the Investment Climate Department of the Financial
and Private Sector Development Vice Presidency of the World Bank Group.
Editing, design, and layout by Communications Development Incorporated,
Washington, D.C. Cover design by Peter Grundy Art & Design, London, U.K.

iiiThe Little Data Book on Private Sector Development 2008
Acknowledgments . . . . . . . . . . . . . . . . . . . . . . . . . . . . . . . . . . . . . . . . . . . iv
Preface . . . . . . . . . . . . . . . . . . . . . . . . . . . . . . . . . . . . . . . . . . . . . . . . . . v
Data notes . . . . . . . . . . . . . . . . . . . . . . . . . . . . . . . . . . . . . . . . . . . . . . . . vi
Regional tables. . . . . . . . . . . . . . . . . . . . . . . . . . . . . . . . . . . . . . . . . . . . . 1
World . . . . . . . . . . . . . . . . . . . . . . . . . . . . . . . . . . . . . . . . . . . . . . . . . 2
East Asia and Pacific. . . . . . . . . . . . . . . . . . . . . . . . . . . . . . . . . . . . . . 3
Europe and Central Asia . . . . . . . . . . . . . . . . . . . . . . . . . . . . . . . . . . . 4
Latin America and the Caribbean . . . . . . . . . . . . . . . . . . . . . . . . . . . . . 5
Middle East and North Africa . . . . . . . . . . . . . . . . . . . . . . . . . . . . . . . . 6
South Asia . . . . . . . . . . . . . . . . . . . . . . . . . . . . . . . . . . . . . . . . . . . . . 7
Sub-Saharan Africa . . . . . . . . . . . . . . . . . . . . . . . . . . . . . . . . . . . . . . . 8
Income group tables . . . . . . . . . . . . . . . . . . . . . . . . . . . . . . . . . . . . . . . . . 9
Low income . . . . . . . . . . . . . . . . . . . . . . . . . . . . . . . . . . . . . . . . . . . 10
Middle income . . . . . . . . . . . . . . . . . . . . . . . . . . . . . . . . . . . . . . . . . 11
Lower middle income . . . . . . . . . . . . . . . . . . . . . . . . . . . . . . . . . . . . 12
Upper middle income . . . . . . . . . . . . . . . . . . . . . . . . . . . . . . . . . . . . 13
Low and middle income. . . . . . . . . . . . . . . . . . . . . . . . . . . . . . . . . . . 14
Euro area . . . . . . . . . . . . . . . . . . . . . . . . . . . . . . . . . . . . . . . . . . . . . 15
High income . . . . . . . . . . . . . . . . . . . . . . . . . . . . . . . . . . . . . . . . . . . 16
Country tables (in alphabetical order) . . . . . . . . . . . . . . . . . . . . . . . . . . . . 17
Glossary. . . . . . . . . . . . . . . . . . . . . . . . . . . . . . . . . . . . . . . . . . . . . . . . 227
Contents

iv 2008 The Little Data Book on Private Sector Development
The Little Data Book on Private Sector Development 2008 is based on World
Development Indicators 2008 and its accompanying CD-ROM, with a focus
on the private sector in development. The Little Data Book on Private Sector
Development 2008 is the result of close collaboration between the staff of
the World Bank’s Development Data Group of the Development Economics
Vice Presidency and the Investment Climate Department of the Financial and
Private Sector Development Vice Presidency. The Development Data Group
team included David Cieslikowski, Richard Fix, Buyant Erdene Khaltarkhuu,
Raymond Muhula, Beatriz Prieto-Oramas, and William Prince. The Investment
Climate Department’s project coordinator was Shokraneh Minovi. This effort
benefited from input by Leora Klapper, Anjali Kumar, Veselin Kuntchev, and
Jorge Luis Rodriquez Meza. The work was carried out under the management
of Shaida Badiee, director of the Development Data Group, and Pierre Guislain,
director of the Investment Climate Department. Meta de Coquereaumont,
Christopher Trott, and Elaine Wilson of Communications Development
Incorporated provided design, editing, and layout. Staff from External Affairs
oversaw publication and dissemination of the book.
Acknowledgments

vThe Little Data Book on Private Sector Development 2008
PrefacePublication of this edition of The Little Data Book on Private Sector Development
coincides with continued rising interest in private sector development and
growing understanding of the links between private sector development and
economic growth. Well functioning finance markets and a robust private sector
play critical roles in increasing productivity and growth and in spreading
equality of opportunity. The availability of cross-country data on the business
environment has expanded rapidly in recent years, including data from the
World Bank’s Doing Business project and Enterprise Surveys. These data
sources report on the scope and types of regulations that enhance—and
constrain—business activity and provide information on business owners’
assessments of the business environment. The data have led to new research,
enabled benchmarking, and informed the reform process in many developing
countries.
Included in this guide are indicators on the economic and social context,
the business environment, private sector investment, finance and banking,
and infrastructure. Though not all relevant variables can be included in a
pocket guide, the indicators that are included provide users with a general
understanding of the private sector in each country. Indicators displayed in
the tables are defined in the Glossary, which also lists data sources.
We welcome your suggestions for how to improve future editions and make
them more useful.

vi 2008 The Little Data Book on Private Sector Development
The data in this book are for 2000 and 2006 or the most recent year unless
otherwise noted in the Glossary.
• Growth rates are proportional changes from the previous year unless
otherwise noted.
• Regional aggregates include data for low- and middle-income
economies only.
• Figures in italics indicate data for years or periods other than those
specified.
Symbols used:
.. indicates that data are not available or that aggregates cannot
be calculated because of missing data.
0 or 0.0 indicates zero or small enough that the number would round
to zero at the displayed number of decimal places.
$ indicates current U.S. dollars.
Data are shown for economies with populations greater than 30,000 or for
smaller economies if they are members of the World Bank. The term country
(used interchangeably with economy) does not imply political independence
or official recognition by the World Bank but refers to any economy for which
the authorities report separate social or economic statistics.
In keeping with World Development Indicators 2008, this edition of The Little
Data Book on Private Sector Development uses terminology in line with the
1993 System of National Accounts (SNA).
Data notes

1The Little Data Book on Private Sector Development 2008
The country composition of regions is based on the World Bank’s analytical
regions and may differ from common geographic usage.
East Asia and Pacific
American Samoa, Cambodia, China, Fiji, Indonesia, Kiribati, Democratic
Republic of Korea, Lao People’s Democratic Republic, Malaysia, Marshall
Islands, Federated States of Micronesia, Mongolia, Myanmar, Northern
Mariana Islands, Palau, Papua New Guinea, Philippines, Samoa, Solomon
Islands, Thailand, Timor-Leste, Tonga, Vanuatu, Vietnam
Europe and Central Asia
Albania, Armenia, Azerbaijan, Belarus, Bosnia and Herzegovina, Bulgaria,
Croatia, Georgia, Hungary, Kazakhstan, Kyrgyz Republic, Latvia, Lithuania,
Former Yugoslav Republic of Macedonia, Moldova, Montenegro, Poland,
Romania, Russian Federation, Serbia, Slovak Republic, Tajikistan, Turkey,
Turkmenistan, Ukraine, Uzbekistan
Latin America and the Caribbean
Argentina, Belize, Bolivia, Brazil, Chile, Colombia, Costa Rica, Cuba,
Dominica, Dominican Republic, Ecuador, El Salvador, Grenada, Guatemala,
Guyana, Haiti, Honduras, Jamaica, Mexico, Nicaragua, Panama, Paraguay,
Peru, St. Kitts and Nevis, St. Lucia, St. Vincent and the Grenadines,
Suriname, Uruguay, Bolivarian Republic of Venezuela
Middle East and North Africa
Algeria, Djibouti, Arab Republic of Egypt, Islamic Republic of Iran, Iraq,
Jordan, Lebanon, Libya, Morocco, Oman, Syrian Arab Republic, Tunisia,
West Bank and Gaza, Republic of Yemen
South Asia
Afghanistan, Bangladesh, Bhutan, India, Maldives, Nepal, Pakistan,
Sri Lanka
Sub-Saharan Africa
Angola, Benin, Botswana, Burkina Faso, Burundi, Cameroon, Cape Verde,
Central African Republic, Chad, Comoros, Democratic Republic of the
Congo, Republic of Congo, Côte d’Ivoire, Equatorial Guinea, Eritrea,
Ethiopia, Gabon, The Gambia, Ghana, Guinea, Guinea-Bissau, Kenya,
Lesotho, Liberia, Madagascar, Malawi, Mali, Mauritania, Mauritius,
Mayotte, Mozambique, Namibia, Niger, Nigeria, Rwanda, São Tomé and
Principe, Senegal, Seychelles, Sierra Leone, Somalia, South Africa,
Sudan, Swaziland, Tanzania, Togo, Uganda, Zambia, Zimbabwe
Regional tables

Economic and social contextPopulation (millions)Labor force (millions)Unemployment rate (% of labor force)GNI per capita, World Bank Atlas method ($)GDP growth, 1995–2000 and 2000–06 (average annual %)Agriculture value added (% of GDP)Industry value added (% of GDP)
Manufacturing value added (% of GDP)Services value added (% of GDP)Inflation (annual % change in consumer price index)Exchange rate (local currency units per $)Exports of goods and services (% of GDP)Imports of goods and services (% of GDP) Business environmentEase of doing business (ranking 1-178; 1=best)Time to start a business (days)Procedures to start a business (number)Firing cost (weeks of wages)Closing a business (years to resolve insolvency)Total tax rate (% of profit)Highest marginal tax rate, corporate (%)Business entry rate (new registrations as % of total)Enterprise surveys
Time dealing with gov’t officials (% of management time)Firms expected to give gifts in meetings w/tax officials (%)Firms using banks to finance investments (% of firms)Delay in obtaining an electrical connection (days)ISO certification ownership (% of firms)
Private sector investmentInvest. in infrastructure w/private participation ($ millions)Private foreign direct investment, net (% of GDP)Gross fixed capital formation (% of GDP)Gross fixed private capital formation (% of GDP) Finance and bankingGovernment cash surplus or deficit (% of GDP)Government debt (% of GDP)Deposit money banks’ assets (% of GDP)Total financial system deposits (% of GDP)Bank capital to asset ratio (%)Bank nonperforming loans to total gross loans ratio (%)Domestic credit to the private sector (% of GDP)Real interest rate (%)Interest rate spread (percentage points) Infrastructure Paved roads (% of total roads)Electric power consumption (kWh per capita)Power outages in a typical month (number)Fixed line and mobile subscribers (per 100 people)Internet users (per 100 people)Cost of telephone call to U.S. ($ per 3 minutes)
2 2008 The Little Data Book on Private Sector Development
6,076.7 6,538.12,801.1 3,081.8
5.4 6.75,252 7,448
3.2 3.03.7 3.2
29.2 27.919.3 17.767.1 69.0
24.6 27.124.7 27.3
.. 44.. 9.. 48.3.. 3.0.. 50.7
7.9 8.6
93,044 114,6584.9 2.8
21.6 21.2.. ..
–0.1 –1.2.. ..
99.2 90.992.9 84.9
8.7 8.99.5 3.0
131.1 136.7
7.4 6.6
35.9 ..2,389 2,678
28 59
6.5 21.43.01 1.42
World
2000 2006

Economic and social contextPopulation (millions)Labor force (millions)Unemployment rate (% of labor force)GNI per capita, World Bank Atlas method ($)GDP growth, 1995–2000 and 2000–06 (average annual %)Agriculture value added (% of GDP)Industry value added (% of GDP)
Manufacturing value added (% of GDP)Services value added (% of GDP)Inflation (annual % change in consumer price index)Exchange rate (local currency units per $)Exports of goods and services (% of GDP)Imports of goods and services (% of GDP) Business environmentEase of doing business (ranking 1-178; 1=best)Time to start a business (days)Procedures to start a business (number)Firing cost (weeks of wages)Closing a business (years to resolve insolvency)Total tax rate (% of profit)Highest marginal tax rate, corporate (%)Business entry rate (new registrations as % of total)Enterprise surveys
Time dealing with gov’t officials (% of management time)Firms expected to give gifts in meetings w/tax officials (%)Firms using banks to finance investments (% of firms)Delay in obtaining an electrical connection (days)ISO certification ownership (% of firms)
Private sector investmentInvest. in infrastructure w/private participation ($ millions)Private foreign direct investment, net (% of GDP)Gross fixed capital formation (% of GDP)Gross fixed private capital formation (% of GDP) Finance and bankingGovernment cash surplus or deficit (% of GDP)Government debt (% of GDP)Deposit money banks’ assets (% of GDP)Total financial system deposits (% of GDP)Bank capital to asset ratio (%)Bank nonperforming loans to total gross loans ratio (%)Domestic credit to the private sector (% of GDP)Real interest rate (%)Interest rate spread (percentage points) Infrastructure Paved roads (% of total roads)Electric power consumption (kWh per capita)Power outages in a typical month (number)Fixed line and mobile subscribers (per 100 people)Internet users (per 100 people)Cost of telephone call to U.S. ($ per 3 minutes)
3The Little Data Book on Private Sector Development 2008
1,804.0 1,898.9
997.0 1,074.13.6 4.9
908 1,8566.0 8.6
14.9 12.044.5 46.930.7 32.040.6 41.1
36.1 47.331.8 40.2
.. 47.. 9.. 37.2.. 3.1.. 39.9
3.0 7.6
18,027 18,4722.6 2.9
30.7 37.211.3 8.4
–2.6 –1.3.. ..
104.9 99.645.8 46.4
.. ..
.. ..101.3 98.7
6.9 6.5
11.4 ..886 1,492
15 58
1.9 11.14.32 1.16
East Asia & Pacific
2000 2006

Economic and social contextPopulation (millions)Labor force (millions)Unemployment rate (% of labor force)GNI per capita, World Bank Atlas method ($)GDP growth, 1995–2000 and 2000–06 (average annual %)Agriculture value added (% of GDP)Industry value added (% of GDP)
Manufacturing value added (% of GDP)Services value added (% of GDP)Inflation (annual % change in consumer price index)Exchange rate (local currency units per $)Exports of goods and services (% of GDP)Imports of goods and services (% of GDP) Business environmentEase of doing business (ranking 1-178; 1=best)Time to start a business (days)Procedures to start a business (number)Firing cost (weeks of wages)Closing a business (years to resolve insolvency)Total tax rate (% of profit)Highest marginal tax rate, corporate (%)Business entry rate (new registrations as % of total)Enterprise surveys
Time dealing with gov’t officials (% of management time)Firms expected to give gifts in meetings w/tax officials (%)Firms using banks to finance investments (% of firms)Delay in obtaining an electrical connection (days)ISO certification ownership (% of firms)
Private sector investmentInvest. in infrastructure w/private participation ($ millions)Private foreign direct investment, net (% of GDP)Gross fixed capital formation (% of GDP)Gross fixed private capital formation (% of GDP) Finance and bankingGovernment cash surplus or deficit (% of GDP)Government debt (% of GDP)Deposit money banks’ assets (% of GDP)Total financial system deposits (% of GDP)Bank capital to asset ratio (%)Bank nonperforming loans to total gross loans ratio (%)Domestic credit to the private sector (% of GDP)Real interest rate (%)Interest rate spread (percentage points) Infrastructure Paved roads (% of total roads)Electric power consumption (kWh per capita)Power outages in a typical month (number)Fixed line and mobile subscribers (per 100 people)Internet users (per 100 people)Cost of telephone call to U.S. ($ per 3 minutes)
4 2008 The Little Data Book on Private Sector Development
460.0 460.5207.1 214.610.6 10.0
1,965 4,8152.8 5.89.9 7.0
32.2 33.419.1 20.157.9 59.6
38.9 40.137.4 40.0
.. 26.. 9.. 25.4.. 3.2.. 51.4
6.7 8.3
24,117 22,7722.8 5.0
20.7 21.117.1 17.3
.. 1.8.. ..
30.4 ..28.1 ..11.1 10.311.1 3.220.7 35.1
8.6 6.8
74.3 ..3,276 3,633
31 88
2.8 19.23.03 1.55
Europe & Central Asia
2000 2006

Economic and social contextPopulation (millions)Labor force (millions)Unemployment rate (% of labor force)GNI per capita, World Bank Atlas method ($)GDP growth, 1995–2000 and 2000–06 (average annual %)Agriculture value added (% of GDP)Industry value added (% of GDP)
Manufacturing value added (% of GDP)Services value added (% of GDP)Inflation (annual % change in consumer price index)Exchange rate (local currency units per $)Exports of goods and services (% of GDP)Imports of goods and services (% of GDP) Business environmentEase of doing business (ranking 1-178; 1=best)Time to start a business (days)Procedures to start a business (number)Firing cost (weeks of wages)Closing a business (years to resolve insolvency)Total tax rate (% of profit)Highest marginal tax rate, corporate (%)Business entry rate (new registrations as % of total)Enterprise surveys
Time dealing with gov’t officials (% of management time)Firms expected to give gifts in meetings w/tax officials (%)Firms using banks to finance investments (% of firms)Delay in obtaining an electrical connection (days)ISO certification ownership (% of firms)
Private sector investmentInvest. in infrastructure w/private participation ($ millions)Private foreign direct investment, net (% of GDP)Gross fixed capital formation (% of GDP)Gross fixed private capital formation (% of GDP) Finance and bankingGovernment cash surplus or deficit (% of GDP)Government debt (% of GDP)Deposit money banks’ assets (% of GDP)Total financial system deposits (% of GDP)Bank capital to asset ratio (%)Bank nonperforming loans to total gross loans ratio (%)Domestic credit to the private sector (% of GDP)Real interest rate (%)Interest rate spread (percentage points) Infrastructure Paved roads (% of total roads)Electric power consumption (kWh per capita)Power outages in a typical month (number)Fixed line and mobile subscribers (per 100 people)Internet users (per 100 people)Cost of telephone call to U.S. ($ per 3 minutes)
5The Little Data Book on Private Sector Development 2008
513.9 556.1227.2 257.4
9.2 8.93,766 4,785
3.0 3.16.1 6.2
29.6 31.318.1 18.364.3 62.4
20.4 25.721.4 23.3
.. 73.. 10.. 58.1.. 3.2.. 48.7
7.2 8.4
39,377 27,6534.0 2.4
18.4 19.8.. ..
–1.3 .... ..
42.7 48.931.1 36.09.6 10.17.5 2.6
27.9 30.9
8.6 7.4
24.3 ..1,580 1,715
27 73
3.8 18.42.46 1.21
Latin America & Caribbean
2000 2006

Economic and social contextPopulation (millions)Labor force (millions)Unemployment rate (% of labor force)GNI per capita, World Bank Atlas method ($)GDP growth, 1995–2000 and 2000–06 (average annual %)Agriculture value added (% of GDP)Industry value added (% of GDP)
Manufacturing value added (% of GDP)Services value added (% of GDP)Inflation (annual % change in consumer price index)Exchange rate (local currency units per $)Exports of goods and services (% of GDP)Imports of goods and services (% of GDP) Business environmentEase of doing business (ranking 1-178; 1=best)Time to start a business (days)Procedures to start a business (number)Firing cost (weeks of wages)Closing a business (years to resolve insolvency)Total tax rate (% of profit)Highest marginal tax rate, corporate (%)Business entry rate (new registrations as % of total)Enterprise surveys
Time dealing with gov’t officials (% of management time)Firms expected to give gifts in meetings w/tax officials (%)Firms using banks to finance investments (% of firms)Delay in obtaining an electrical connection (days)ISO certification ownership (% of firms)
Private sector investmentInvest. in infrastructure w/private participation ($ millions)Private foreign direct investment, net (% of GDP)Gross fixed capital formation (% of GDP)Gross fixed private capital formation (% of GDP) Finance and bankingGovernment cash surplus or deficit (% of GDP)Government debt (% of GDP)Deposit money banks’ assets (% of GDP)Total financial system deposits (% of GDP)Bank capital to asset ratio (%)Bank nonperforming loans to total gross loans ratio (%)Domestic credit to the private sector (% of GDP)Real interest rate (%)Interest rate spread (percentage points) Infrastructure Paved roads (% of total roads)Electric power consumption (kWh per capita)Power outages in a typical month (number)Fixed line and mobile subscribers (per 100 people)Internet users (per 100 people)Cost of telephone call to U.S. ($ per 3 minutes)
6 2008 The Little Data Book on Private Sector Development
278.8 310.7
90.6 111.812.1 13.8
1,684 2,5074.5 4.2
12.1 11.843.8 40.212.3 13.444.0 48.0
28.1 37.825.8 34.9
.. 39.. 10.. 47.0.. 3.5.. 41.4
9.8 7.9
4,115 10,9541.2 4.2
21.5 23.113.5 15.1
–0.4 1.0.. ..
47.6 46.645.3 49.9
.. ..
.. ..38.3 41.3
4.8 4.3
62.8 70.21,077 1,358
11 53
0.9 13.84.06 1.66
Middle East & North Africa
2000 2006

Economic and social contextPopulation (millions)Labor force (millions)Unemployment rate (% of labor force)GNI per capita, World Bank Atlas method ($)GDP growth, 1995–2000 and 2000–06 (average annual %)Agriculture value added (% of GDP)Industry value added (% of GDP)
Manufacturing value added (% of GDP)Services value added (% of GDP)Inflation (annual % change in consumer price index)Exchange rate (local currency units per $)Exports of goods and services (% of GDP)Imports of goods and services (% of GDP) Business environmentEase of doing business (ranking 1-178; 1=best)Time to start a business (days)Procedures to start a business (number)Firing cost (weeks of wages)Closing a business (years to resolve insolvency)Total tax rate (% of profit)Highest marginal tax rate, corporate (%)Business entry rate (new registrations as % of total)Enterprise surveys
Time dealing with gov’t officials (% of management time)Firms expected to give gifts in meetings w/tax officials (%)Firms using banks to finance investments (% of firms)Delay in obtaining an electrical connection (days)ISO certification ownership (% of firms)
Private sector investmentInvest. in infrastructure w/private participation ($ millions)Private foreign direct investment, net (% of GDP)Gross fixed capital formation (% of GDP)Gross fixed private capital formation (% of GDP) Finance and bankingGovernment cash surplus or deficit (% of GDP)Government debt (% of GDP)Deposit money banks’ assets (% of GDP)Total financial system deposits (% of GDP)Bank capital to asset ratio (%)Bank nonperforming loans to total gross loans ratio (%)Domestic credit to the private sector (% of GDP)Real interest rate (%)Interest rate spread (percentage points) Infrastructure Paved roads (% of total roads)Electric power consumption (kWh per capita)Power outages in a typical month (number)Fixed line and mobile subscribers (per 100 people)Internet users (per 100 people)Cost of telephone call to U.S. ($ per 3 minutes)
7The Little Data Book on Private Sector Development 2008
1,358.8 1,499.4
524.8 597.14.5 5.3
443 7685.4 7.0
23.9 18.025.8 27.715.4 16.650.3 54.3
14.2 22.015.9 26.0
.. 33.. 8.. 66.0.. 5.0.. 41.4
5.0 7.7
3,451 21,7930.7 2.0
22.2 28.015.8 21.2
–4.0 –3.169.3 55.138.6 54.739.0 50.7
4.9 6.619.5 7.727.7 42.6
6.9 6.7
30.8 56.9359 432
3 19
0.5 4.93.48 2.02
South Asia
2000 2006

Economic and social contextPopulation (millions)Labor force (millions)Unemployment rate (% of labor force)GNI per capita, World Bank Atlas method ($)GDP growth, 1995–2000 and 2000–06 (average annual %)Agriculture value added (% of GDP)Industry value added (% of GDP)
Manufacturing value added (% of GDP)Services value added (% of GDP)Inflation (annual % change in consumer price index)Exchange rate (local currency units per $)Exports of goods and services (% of GDP)Imports of goods and services (% of GDP) Business environmentEase of doing business (ranking 1-178; 1=best)Time to start a business (days)Procedures to start a business (number)Firing cost (weeks of wages)Closing a business (years to resolve insolvency)Total tax rate (% of profit)Highest marginal tax rate, corporate (%)Business entry rate (new registrations as % of total)Enterprise surveys
Time dealing with gov’t officials (% of management time)Firms expected to give gifts in meetings w/tax officials (%)Firms using banks to finance investments (% of firms)Delay in obtaining an electrical connection (days)ISO certification ownership (% of firms)
Private sector investmentInvest. in infrastructure w/private participation ($ millions)Private foreign direct investment, net (% of GDP)Gross fixed capital formation (% of GDP)Gross fixed private capital formation (% of GDP) Finance and bankingGovernment cash surplus or deficit (% of GDP)Government debt (% of GDP)Deposit money banks’ assets (% of GDP)Total financial system deposits (% of GDP)Bank capital to asset ratio (%)Bank nonperforming loans to total gross loans ratio (%)Domestic credit to the private sector (% of GDP)Real interest rate (%)Interest rate spread (percentage points) Infrastructure Paved roads (% of total roads)Electric power consumption (kWh per capita)Power outages in a typical month (number)Fixed line and mobile subscribers (per 100 people)Internet users (per 100 people)Cost of telephone call to U.S. ($ per 3 minutes)
8 2008 The Little Data Book on Private Sector Development
673.3 781.8276.2 323.0
.. ..483 8293.2 4.7
17.7 14.531.9 30.313.7 14.350.4 55.1
32.6 35.530.9 36.3
.. 56.. 11.. 68.3.. 3.4.. 68.0
6.1 6.6
2,166 12,1652.0 2.4
16.8 19.812.0 14.2
.. .... ..
39.9 40.631.1 32.7
.. ..
.. ..61.2 78.1
13.1 9.6
11.9 ..490 542
3 15
0.5 3.85.88 2.43
Sub-Saharan Africa
2000 2006

9The Little Data Book on Private Sector Development 2008
For operational and analytical purposes the World Bank’s main criterion
for classifying economies is gross national income (GNI) per capita. Every
economy in The Little Data Book on Private Sector Development is classified
as low income, middle income, or high income. Low- and middle-income
economies are sometimes referred to as developing economies. The use of
the term is convenient; it is not intended to imply that all economies in the
group are experiencing similar development or that other economies have
reached a preferred or final stage of development. Classification by income
does not necessarily reflect development status.
Low-income economies are those with a GNI per capita of $905 or less
in 2006.
Middle-income economies are those with a GNI per capita of more than
$905 but less than $11,116. Lower-middle-income and upper-middle-income
economies are separated at a GNI per capita of $3,595.
High-income economies are those with a GNI per capita of $11,116 or
more.
Euro area includes the member states of the Economic and Monetary
Union of the European Union that have adopted the euro as their currency:
Austria, Belgium, Cyprus, Finland, France, Germany, Greece, Ireland, Italy,
Luxembourg, Malta, Netherlands, Portugal, Slovenia, and Spain.
Income group tables

Economic and social contextPopulation (millions)Labor force (millions)Unemployment rate (% of labor force)GNI per capita, World Bank Atlas method ($)GDP growth, 1995–2000 and 2000–06 (average annual %)Agriculture value added (% of GDP)Industry value added (% of GDP)
Manufacturing value added (% of GDP)Services value added (% of GDP)Inflation (annual % change in consumer price index)Exchange rate (local currency units per $)Exports of goods and services (% of GDP)Imports of goods and services (% of GDP) Business environmentEase of doing business (ranking 1-178; 1=best)Time to start a business (days)Procedures to start a business (number)Firing cost (weeks of wages)Closing a business (years to resolve insolvency)Total tax rate (% of profit)Highest marginal tax rate, corporate (%)Business entry rate (new registrations as % of total)Enterprise surveys
Time dealing with gov’t officials (% of management time)Firms expected to give gifts in meetings w/tax officials (%)Firms using banks to finance investments (% of firms)Delay in obtaining an electrical connection (days)ISO certification ownership (% of firms)
Private sector investmentInvest. in infrastructure w/private participation ($ millions)Private foreign direct investment, net (% of GDP)Gross fixed capital formation (% of GDP)Gross fixed private capital formation (% of GDP) Finance and bankingGovernment cash surplus or deficit (% of GDP)Government debt (% of GDP)Deposit money banks’ assets (% of GDP)Total financial system deposits (% of GDP)Bank capital to asset ratio (%)Bank nonperforming loans to total gross loans ratio (%)Domestic credit to the private sector (% of GDP)Real interest rate (%)Interest rate spread (percentage points) Infrastructure Paved roads (% of total roads)Electric power consumption (kWh per capita)Power outages in a typical month (number)Fixed line and mobile subscribers (per 100 people)Internet users (per 100 people)Cost of telephone call to U.S. ($ per 3 minutes)
10 2008 The Little Data Book on Private Sector Development
2,160.9 2,419.7
865.2 995.4.. ..
381 6495.0 6.5
26.4 20.426.4 27.714.0 15.847.2 51.9
19.4 26.720.8 30.1
.. 54.. 10.. 62.6.. 3.8.. 67.4
4.2 6.4
4,907 29,7851.2 2.6
21.3 26.714.5 19.6
–3.7 –2.6.. ..
34.2 50.533.5 44.6
.. ..
.. ..24.5 38.3
13.1 11.3
12.1 ..325 391
2 17
0.3 4.25.93 1.99
Low income
2000 2006
Economic and social contextPopulation (millions)Labor force (millions)Unemployment rate (% of labor force)GNI per capita, World Bank Atlas method ($)GDP growth, 1995–2000 and 2000–06 (average annual %)Agriculture value added (% of GDP)Industry value added (% of GDP)
Manufacturing value added (% of GDP)Services value added (% of GDP)Inflation (annual % change in consumer price index)Exchange rate (local currency units per $)Exports of goods and services (% of GDP)Imports of goods and services (% of GDP) Business environmentEase of doing business (ranking 1-178; 1=best)Time to start a business (days)Procedures to start a business (number)Firing cost (weeks of wages)Closing a business (years to resolve insolvency)Total tax rate (% of profit)Highest marginal tax rate, corporate (%)Business entry rate (new registrations as % of total)Enterprise surveys
Time dealing with gov’t officials (% of management time)Firms expected to give gifts in meetings w/tax officials (%)Firms using banks to finance investments (% of firms)Delay in obtaining an electrical connection (days)ISO certification ownership (% of firms)
Private sector investmentInvest. in infrastructure w/private participation ($ millions)Private foreign direct investment, net (% of GDP)Gross fixed capital formation (% of GDP)Gross fixed private capital formation (% of GDP) Finance and bankingGovernment cash surplus or deficit (% of GDP)Government debt (% of GDP)Deposit money banks’ assets (% of GDP)Total financial system deposits (% of GDP)Bank capital to asset ratio (%)Bank nonperforming loans to total gross loans ratio (%)Domestic credit to the private sector (% of GDP)Real interest rate (%)Interest rate spread (percentage points) Infrastructure Paved roads (% of total roads)Electric power consumption (kWh per capita)Power outages in a typical month (number)Fixed line and mobile subscribers (per 100 people)Internet users (per 100 people)Cost of telephone call to U.S. ($ per 3 minutes)
11The Little Data Book on Private Sector Development 2008
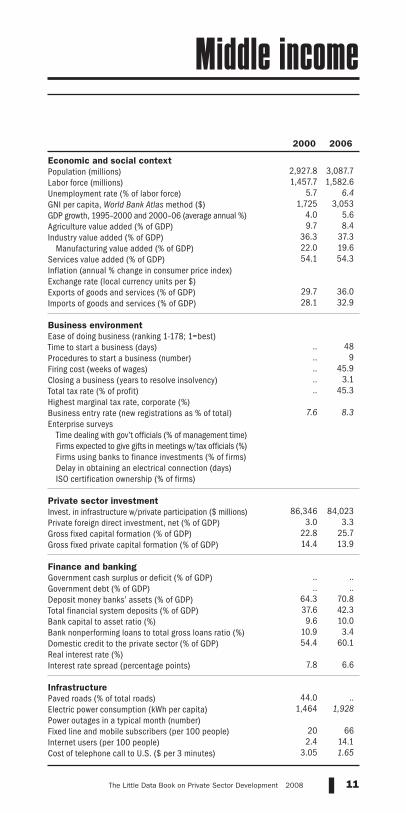
2,927.8 3,087.71,457.7 1,582.6
5.7 6.41,725 3,053
4.0 5.69.7 8.4
36.3 37.322.0 19.654.1 54.3
29.7 36.028.1 32.9
.. 48.. 9.. 45.9.. 3.1.. 45.3
7.6 8.3
86,346 84,0233.0 3.3
22.8 25.714.4 13.9
.. .... ..
64.3 70.837.6 42.39.6 10.0
10.9 3.454.4 60.1
7.8 6.6
44.0 ..1,464 1,928
20 662.4 14.1
3.05 1.65
Middle income
2000 2006

Economic and social contextPopulation (millions)Labor force (millions)Unemployment rate (% of labor force)GNI per capita, World Bank Atlas method ($)GDP growth, 1995–2000 and 2000–06 (average annual %)Agriculture value added (% of GDP)Industry value added (% of GDP)
Manufacturing value added (% of GDP)Services value added (% of GDP)Inflation (annual % change in consumer price index)Exchange rate (local currency units per $)Exports of goods and services (% of GDP)Imports of goods and services (% of GDP) Business environmentEase of doing business (ranking 1-178; 1=best)Time to start a business (days)Procedures to start a business (number)Firing cost (weeks of wages)Closing a business (years to resolve insolvency)Total tax rate (% of profit)Highest marginal tax rate, corporate (%)Business entry rate (new registrations as % of total)Enterprise surveys
Time dealing with gov’t officials (% of management time)Firms expected to give gifts in meetings w/tax officials (%)Firms using banks to finance investments (% of firms)Delay in obtaining an electrical connection (days)ISO certification ownership (% of firms)
Private sector investmentInvest. in infrastructure w/private participation ($ millions)Private foreign direct investment, net (% of GDP)Gross fixed capital formation (% of GDP)Gross fixed private capital formation (% of GDP) Finance and bankingGovernment cash surplus or deficit (% of GDP)Government debt (% of GDP)Deposit money banks’ assets (% of GDP)Total financial system deposits (% of GDP)Bank capital to asset ratio (%)Bank nonperforming loans to total gross loans ratio (%)Domestic credit to the private sector (% of GDP)Real interest rate (%)Interest rate spread (percentage points) Infrastructure Paved roads (% of total roads)Electric power consumption (kWh per capita)Power outages in a typical month (number)Fixed line and mobile subscribers (per 100 people)Internet users (per 100 people)Cost of telephone call to U.S. ($ per 3 minutes)
12 2008 The Little Data Book on Private Sector Development
2,153.1 2,276.51,111.9 1,208.6
4.6 5.71,055 2,038
5.3 7.614.1 11.942.5 43.525.5 26.743.4 44.6
30.5 40.428.5 36.4
.. 53.. 10.. 50.2.. 3.3.. 45.8
8.0 7.6
21,801 38,1542.4 3.0
27.7 33.512.5 10.9
–2.6 –0.9.. ..
84.9 87.840.5 43.1
9.5 10.713.4 4.077.9 81.3
8.0 7.2
49.2 65.8968 1,502
15 601.6 11.4
3.33 2.08
Lower middle income
2000 2006

Economic and social contextPopulation (millions)Labor force (millions)Unemployment rate (% of labor force)GNI per capita, World Bank Atlas method ($)GDP growth, 1995–2000 and 2000–06 (average annual %)Agriculture value added (% of GDP)Industry value added (% of GDP)
Manufacturing value added (% of GDP)Services value added (% of GDP)Inflation (annual % change in consumer price index)Exchange rate (local currency units per $)Exports of goods and services (% of GDP)Imports of goods and services (% of GDP) Business environmentEase of doing business (ranking 1-178; 1=best)Time to start a business (days)Procedures to start a business (number)Firing cost (weeks of wages)Closing a business (years to resolve insolvency)Total tax rate (% of profit)Highest marginal tax rate, corporate (%)Business entry rate (new registrations as % of total)Enterprise surveys
Time dealing with gov’t officials (% of management time)Firms expected to give gifts in meetings w/tax officials (%)Firms using banks to finance investments (% of firms)Delay in obtaining an electrical connection (days)ISO certification ownership (% of firms)
Private sector investmentInvest. in infrastructure w/private participation ($ millions)Private foreign direct investment, net (% of GDP)Gross fixed capital formation (% of GDP)Gross fixed private capital formation (% of GDP) Finance and bankingGovernment cash surplus or deficit (% of GDP)Government debt (% of GDP)Deposit money banks’ assets (% of GDP)Total financial system deposits (% of GDP)Bank capital to asset ratio (%)Bank nonperforming loans to total gross loans ratio (%)Domestic credit to the private sector (% of GDP)Real interest rate (%)Interest rate spread (percentage points) Infrastructure Paved roads (% of total roads)Electric power consumption (kWh per capita)Power outages in a typical month (number)Fixed line and mobile subscribers (per 100 people)Internet users (per 100 people)Cost of telephone call to U.S. ($ per 3 minutes)
13The Little Data Book on Private Sector Development 2008
774.8 811.3345.8 374.0
10.4 9.83,588 5,913
3.0 3.96.2 5.7
31.3 32.419.0 19.462.5 62.0
29.1 32.727.7 30.3
.. 41.. 9.. 39.7.. 2.9.. 44.5
7.1 9.1
64,545 45,8693.6 3.5
19.1 19.9.. .. .. .... ..
46.2 52.935.1 41.4
9.6 9.87.8 3.2
35.9 41.4
7.4 5.9
34.1 ..2,855 3,131
33 884.7 22.2
2.55 1.06
Upper middle income
2000 2006

Economic and social contextPopulation (millions)Labor force (millions)Unemployment rate (% of labor force)GNI per capita, World Bank Atlas method ($)GDP growth, 1995–2000 and 2000–06 (average annual %)Agriculture value added (% of GDP)Industry value added (% of GDP)
Manufacturing value added (% of GDP)Services value added (% of GDP)Inflation (annual % change in consumer price index)Exchange rate (local currency units per $)Exports of goods and services (% of GDP)Imports of goods and services (% of GDP) Business environmentEase of doing business (ranking 1-178; 1=best)Time to start a business (days)Procedures to start a business (number)Firing cost (weeks of wages)Closing a business (years to resolve insolvency)Total tax rate (% of profit)Highest marginal tax rate, corporate (%)Business entry rate (new registrations as % of total)Enterprise surveys
Time dealing with gov’t officials (% of management time)Firms expected to give gifts in meetings w/tax officials (%)Firms using banks to finance investments (% of firms)Delay in obtaining an electrical connection (days)ISO certification ownership (% of firms)
Private sector investmentInvest. in infrastructure w/private participation ($ millions)Private foreign direct investment, net (% of GDP)Gross fixed capital formation (% of GDP)Gross fixed private capital formation (% of GDP) Finance and bankingGovernment cash surplus or deficit (% of GDP)Government debt (% of GDP)Deposit money banks’ assets (% of GDP)Total financial system deposits (% of GDP)Bank capital to asset ratio (%)Bank nonperforming loans to total gross loans ratio (%)Domestic credit to the private sector (% of GDP)Real interest rate (%)Interest rate spread (percentage points) Infrastructure Paved roads (% of total roads)Electric power consumption (kWh per capita)Power outages in a typical month (number)Fixed line and mobile subscribers (per 100 people)Internet users (per 100 people)Cost of telephone call to U.S. ($ per 3 minutes)
14 2008 The Little Data Book on Private Sector Development
5,088.8 5,507.42,322.9 2,578.0
5.3 6.81,154 1,997
4.1 5.712.0 10.134.9 36.020.8 19.053.1 54.0
28.2 34.727.0 32.5
.. 50.. 10.. 51.9.. 3.3.. 53.2
6.8 7.9
91,253 113,8082.8 3.2
22.6 25.914.4 14.9
.. .... ..
60.1 68.137.0 42.69.5 9.4
11.5 5.350.4 57.3
8.6 7.3
26.8 ..1,004 1,290
13 441.6 8.0
3.97 1.81
Low and middle income
2000 2006

Economic and social contextPopulation (millions)Labor force (millions)Unemployment rate (% of labor force)GNI per capita, World Bank Atlas method ($)GDP growth, 1995–2000 and 2000–06 (average annual %)Agriculture value added (% of GDP)Industry value added (% of GDP)
Manufacturing value added (% of GDP)Services value added (% of GDP)Inflation (annual % change in consumer price index)Exchange rate (local currency units per $)Exports of goods and services (% of GDP)Imports of goods and services (% of GDP) Business environmentEase of doing business (ranking 1-178; 1=best)Time to start a business (days)Procedures to start a business (number)Firing cost (weeks of wages)Closing a business (years to resolve insolvency)Total tax rate (% of profit)Highest marginal tax rate, corporate (%)Business entry rate (new registrations as % of total)Enterprise surveys
Time dealing with gov’t officials (% of management time)Firms expected to give gifts in meetings w/tax officials (%)Firms using banks to finance investments (% of firms)Delay in obtaining an electrical connection (days)ISO certification ownership (% of firms)
Private sector investmentInvest. in infrastructure w/private participation ($ millions)Private foreign direct investment, net (% of GDP)Gross fixed capital formation (% of GDP)Gross fixed private capital formation (% of GDP) Finance and bankingGovernment cash surplus or deficit (% of GDP)Government debt (% of GDP)Deposit money banks’ assets (% of GDP)Total financial system deposits (% of GDP)Bank capital to asset ratio (%)Bank nonperforming loans to total gross loans ratio (%)Domestic credit to the private sector (% of GDP)Real interest rate (%)Interest rate spread (percentage points) Infrastructure Paved roads (% of total roads)Electric power consumption (kWh per capita)Power outages in a typical month (number)Fixed line and mobile subscribers (per 100 people)Internet users (per 100 people)Cost of telephone call to U.S. ($ per 3 minutes)
15The Little Data Book on Private Sector Development 2008
306.1 316.7140.9 148.8
8.9 9.022,314 34,307
2.8 1.52.5 1.8
27.8 26.519.9 18.169.7 71.7
36.6 39.835.9 38.5
.. 22.. 7.. 34.0.. 1.4.. 50.9
8.4 8.4 .. ..
10.2 3.821.4 20.7
.. ..
0.1 –1.360.0 63.4
.. ..
.. ..6.4 5.22.6 1.6
97.7 115.9
4.2 3.9
99.0 100.06,410 6,926
115 153
23.0 47.90.81 0.73
Euro area
2000 2006

Economic and social contextPopulation (millions)Labor force (millions)Unemployment rate (% of labor force)GNI per capita, World Bank Atlas method ($)GDP growth, 1995–2000 and 2000–06 (average annual %)Agriculture value added (% of GDP)Industry value added (% of GDP)
Manufacturing value added (% of GDP)Services value added (% of GDP)Inflation (annual % change in consumer price index)Exchange rate (local currency units per $)Exports of goods and services (% of GDP)Imports of goods and services (% of GDP) Business environmentEase of doing business (ranking 1-178; 1=best)Time to start a business (days)Procedures to start a business (number)Firing cost (weeks of wages)Closing a business (years to resolve insolvency)Total tax rate (% of profit)Highest marginal tax rate, corporate (%)Business entry rate (new registrations as % of total)Enterprise surveys
Time dealing with gov’t officials (% of management time)Firms expected to give gifts in meetings w/tax officials (%)Firms using banks to finance investments (% of firms)Delay in obtaining an electrical connection (days)ISO certification ownership (% of firms)
Private sector investmentInvest. in infrastructure w/private participation ($ millions)Private foreign direct investment, net (% of GDP)Gross fixed capital formation (% of GDP)Gross fixed private capital formation (% of GDP) Finance and bankingGovernment cash surplus or deficit (% of GDP)Government debt (% of GDP)Deposit money banks’ assets (% of GDP)Total financial system deposits (% of GDP)Bank capital to asset ratio (%)Bank nonperforming loans to total gross loans ratio (%)Domestic credit to the private sector (% of GDP)Real interest rate (%)Interest rate spread (percentage points) Infrastructure Paved roads (% of total roads)Electric power consumption (kWh per capita)Power outages in a typical month (number)Fixed line and mobile subscribers (per 100 people)Internet users (per 100 people)Cost of telephone call to U.S. ($ per 3 minutes)
16 2008 The Little Data Book on Private Sector Development
987.9 1,030.7478.2 503.8
6.0 6.226,365 36,608
3.0 2.31.8 1.5
28.0 26.218.9 16.870.2 72.3
23.8 25.624.2 26.3
.. 22.. 7.. 34.9.. 2.0.. 41.5
9.6 10.1
1,792 8495.3 2.7
21.4 20.4.. ..
0.2 –1.352.3 47.6
110.8 99.792.0 ..6.8 6.23.4 1.1
149.9 162.0
4.2 4.4
92.9 90.99,265 9,760
109 14331.6 59.30.96 0.77
High income
2000 2006

17The Little Data Book on Private Sector Development 2008
China
Unless otherwise noted, data for China do not include data for Hong Kong,
China; Macao, China; or Taiwan, China.
Montenegro
Montenegro declared independence from Serbia and Montenegro on June 3,
2006. Where available, data for each country are shown separately.
Serbia
Some indicators for Serbia prior to 2006 include data for Montenegro.
Moreover, data for most indicators from 1999 onward for Serbia exclude
data for Kosovo, a territory within Serbia that is currently under international
administration pursuant to UN Security Council Resolution 1244 (1999).
Country tables

Economic and social contextPopulation (millions)Labor force (millions)Unemployment rate (% of labor force)GNI per capita, World Bank Atlas method ($)GDP growth, 1995–2000 and 2000–06 (average annual %)Agriculture value added (% of GDP)Industry value added (% of GDP)
Manufacturing value added (% of GDP)Services value added (% of GDP)Inflation (annual % change in consumer price index)Exchange rate (local currency units per $)Exports of goods and services (% of GDP)Imports of goods and services (% of GDP) Business environmentEase of doing business (ranking 1-178; 1=best)Time to start a business (days)Procedures to start a business (number)Firing cost (weeks of wages)Closing a business (years to resolve insolvency)Total tax rate (% of profit)Highest marginal tax rate, corporate (%)Business entry rate (new registrations as % of total)Enterprise surveys
Time dealing with gov’t officials (% of management time)Firms expected to give gifts in meetings w/tax officials (%)Firms using banks to finance investments (% of firms)Delay in obtaining an electrical connection (days)ISO certification ownership (% of firms)
Private sector investmentInvest. in infrastructure w/private participation ($ millions)Private foreign direct investment, net (% of GDP)Gross fixed capital formation (% of GDP)Gross fixed private capital formation (% of GDP) Finance and bankingGovernment cash surplus or deficit (% of GDP)Government debt (% of GDP)Deposit money banks’ assets (% of GDP)Total financial system deposits (% of GDP)Bank capital to asset ratio (%)Bank nonperforming loans to total gross loans ratio (%)Domestic credit to the private sector (% of GDP)Real interest rate (%)Interest rate spread (percentage points) Infrastructure Paved roads (% of total roads)Electric power consumption (kWh per capita)Power outages in a typical month (number)Fixed line and mobile subscribers (per 100 people)Internet users (per 100 people)Cost of telephone call to U.S. ($ per 3 minutes)
18 2008 The Little Data Book on Private Sector Development
.. .. 2,420.. .. 995.. 8.5 .... .. 649.. 10.7 6.5
49.8 36.1 20.420.1 24.5 27.715.1 14.9 15.830.1 39.4 51.9
.. ..61.6 49.532.9 12.4 26.766.2 55.7 30.1
.. 159.. 9 54.. 4 10.. 4.3 62.6.. .. 3.8.. 35.5 67.4.. .... .. 6.4 .. .... .... .... .... ..
70 463 29,785.. .. 2.6
28.3 24.3 26.71.2 8.1 19.6
.. –1.7 –2.6.. 9.3 .... .. 50.5.. .. 44.6.. .. .... .. .... .. 38.3.. .... .. 11.3
13.3 23.7 .... .. 391.. ..0 10 17
0.0 2.1 4.2.. 0.39 1.99
Country dataLow-
income group
2000 2006 2006
AfghanistanSouth Asia Low income

Economic and social contextPopulation (millions)Labor force (millions)Unemployment rate (% of labor force)GNI per capita, World Bank Atlas method ($)GDP growth, 1995–2000 and 2000–06 (average annual %)Agriculture value added (% of GDP)Industry value added (% of GDP)
Manufacturing value added (% of GDP)Services value added (% of GDP)Inflation (annual % change in consumer price index)Exchange rate (local currency units per $)Exports of goods and services (% of GDP)Imports of goods and services (% of GDP) Business environmentEase of doing business (ranking 1-178; 1=best)Time to start a business (days)Procedures to start a business (number)Firing cost (weeks of wages)Closing a business (years to resolve insolvency)Total tax rate (% of profit)Highest marginal tax rate, corporate (%)Business entry rate (new registrations as % of total)Enterprise surveys
Time dealing with gov’t officials (% of management time)Firms expected to give gifts in meetings w/tax officials (%)Firms using banks to finance investments (% of firms)Delay in obtaining an electrical connection (days)ISO certification ownership (% of firms)
Private sector investmentInvest. in infrastructure w/private participation ($ millions)Private foreign direct investment, net (% of GDP)Gross fixed capital formation (% of GDP)Gross fixed private capital formation (% of GDP) Finance and bankingGovernment cash surplus or deficit (% of GDP)Government debt (% of GDP)Deposit money banks’ assets (% of GDP)Total financial system deposits (% of GDP)Bank capital to asset ratio (%)Bank nonperforming loans to total gross loans ratio (%)Domestic credit to the private sector (% of GDP)Real interest rate (%)Interest rate spread (percentage points) Infrastructure Paved roads (% of total roads)Electric power consumption (kWh per capita)Power outages in a typical month (number)Fixed line and mobile subscribers (per 100 people)Internet users (per 100 people)Cost of telephone call to U.S. ($ per 3 minutes)
19The Little Data Book on Private Sector Development 2008
3.1 3.2 2,2761.3 1.4 1,209
22.7 14.4 5.71,170 2,930 2,038
5.2 5.3 7.629.1 22.8 11.919.0 21.5 43.511.4 12.3 26.751.9 55.7 44.6
0.1 2.4143.7 98.1
19.1 25.1 40.437.5 49.2 36.4
.. 136.. 36 53.. 10 10.. 56.0 50.2.. 4.0 3.3.. 46.8 45.8.. 20
7.5 14.5 7.6 .. 10.4
78.5 76.78.8 27.9
26.1 26.6.. 16.7
102 1,094 38,1543.9 3.6 3.0
24.7 25.0 33.518.1 19.4 10.9
–6.7 –3.0 –0.951.9 .. ..32.4 43.3 87.840.9 51.5 43.1
.. 6.2 10.7
.. 3.1 4.04.7 21.8 81.3
17.0 10.813.8 7.7 7.2
39.0 .. 65.81,191 1,167 1,502
.. ..6 60 60
0.1 14.9 11.44.59 1.34 2.08
Country data
Lower middle-income group
2000 2006 2006
Europe & Central Asia Lower middle income
Albania

Economic and social contextPopulation (millions)Labor force (millions)Unemployment rate (% of labor force)GNI per capita, World Bank Atlas method ($)GDP growth, 1995–2000 and 2000–06 (average annual %)Agriculture value added (% of GDP)Industry value added (% of GDP)
Manufacturing value added (% of GDP)Services value added (% of GDP)Inflation (annual % change in consumer price index)Exchange rate (local currency units per $)Exports of goods and services (% of GDP)Imports of goods and services (% of GDP) Business environmentEase of doing business (ranking 1-178; 1=best)Time to start a business (days)Procedures to start a business (number)Firing cost (weeks of wages)Closing a business (years to resolve insolvency)Total tax rate (% of profit)Highest marginal tax rate, corporate (%)Business entry rate (new registrations as % of total)Enterprise surveys
Time dealing with gov’t officials (% of management time)Firms expected to give gifts in meetings w/tax officials (%)Firms using banks to finance investments (% of firms)Delay in obtaining an electrical connection (days)ISO certification ownership (% of firms)
Private sector investmentInvest. in infrastructure w/private participation ($ millions)Private foreign direct investment, net (% of GDP)Gross fixed capital formation (% of GDP)Gross fixed private capital formation (% of GDP) Finance and bankingGovernment cash surplus or deficit (% of GDP)Government debt (% of GDP)Deposit money banks’ assets (% of GDP)Total financial system deposits (% of GDP)Bank capital to asset ratio (%)Bank nonperforming loans to total gross loans ratio (%)Domestic credit to the private sector (% of GDP)Real interest rate (%)Interest rate spread (percentage points) Infrastructure Paved roads (% of total roads)Electric power consumption (kWh per capita)Power outages in a typical month (number)Fixed line and mobile subscribers (per 100 people)Internet users (per 100 people)Cost of telephone call to U.S. ($ per 3 minutes)
20 2008 The Little Data Book on Private Sector Development
30.5 33.4 2,27611.1 13.9 1,20927.3 15.3 5.7
1,610 3,030 2,0383.2 5.0 7.68.9 8.5 11.9
58.6 61.5 43.57.5 5.6 26.7
32.5 30.1 44.60.3 2.5
75.3 72.641.2 47.8 40.421.4 23.6 36.4
.. 125.. 24 53.. 14 10.. 17.0 50.2.. 2.5 3.3.. 72.6 45.8.. ..
19.8 11.8 7.6 .. .... 15.0
16.9 8.9124.9 49.1
.. ..
472 3,022 38,1540.8 1.6 3.0
20.7 23.9 33.512.9 14.1 10.9
9.7 13.8 –0.962.1 .. ..33.1 33.6 87.824.0 37.3 43.1
.. .. 10.7
.. .. 4.06.0 12.5 81.3
–11.7 –1.02.5 6.3 7.2
68.9 70.2 65.8695 899 1,502
.. 5.16 71 60
0.5 7.4 11.43.67 2.08 2.08
Country data
Lower middle-income group
2000 2006 2006
Middle East & North Africa Lower middle income
Algeria

Economic and social contextPopulation (millions)Labor force (millions)Unemployment rate (% of labor force)GNI per capita, World Bank Atlas method ($)GDP growth, 1995–2000 and 2000–06 (average annual %)Agriculture value added (% of GDP)Industry value added (% of GDP)
Manufacturing value added (% of GDP)Services value added (% of GDP)Inflation (annual % change in consumer price index)Exchange rate (local currency units per $)Exports of goods and services (% of GDP)Imports of goods and services (% of GDP) Business environmentEase of doing business (ranking 1-178; 1=best)Time to start a business (days)Procedures to start a business (number)Firing cost (weeks of wages)Closing a business (years to resolve insolvency)Total tax rate (% of profit)Highest marginal tax rate, corporate (%)Business entry rate (new registrations as % of total)Enterprise surveys
Time dealing with gov’t officials (% of management time)Firms expected to give gifts in meetings w/tax officials (%)Firms using banks to finance investments (% of firms)Delay in obtaining an electrical connection (days)ISO certification ownership (% of firms)
Private sector investmentInvest. in infrastructure w/private participation ($ millions)Private foreign direct investment, net (% of GDP)Gross fixed capital formation (% of GDP)Gross fixed private capital formation (% of GDP) Finance and bankingGovernment cash surplus or deficit (% of GDP)Government debt (% of GDP)Deposit money banks’ assets (% of GDP)Total financial system deposits (% of GDP)Bank capital to asset ratio (%)Bank nonperforming loans to total gross loans ratio (%)Domestic credit to the private sector (% of GDP)Real interest rate (%)Interest rate spread (percentage points) Infrastructure Paved roads (% of total roads)Electric power consumption (kWh per capita)Power outages in a typical month (number)Fixed line and mobile subscribers (per 100 people)Internet users (per 100 people)Cost of telephone call to U.S. ($ per 3 minutes)
21The Little Data Book on Private Sector Development 2008
.. 0.06 811.. .. 374.. .. 9.8.. .. 5,913.. .. 3.9.. .. 5.7.. .. 32.4.. .. 19.4.. .. 62.0.. .... .... .. 32.7.. .. 30.3 .. .... .. 41.. .. 9.. .. 39.7.. .. 2.9.. .. 44.5.. .... .. 9.1 .. .... .... .... .... .. .. .. 45,869.. .. 3.5.. .. 19.9.. .. .. .. .. .... .. .... .. 52.9.. .. 41.4.. .. 9.8.. .. 3.2.. .. 41.4.. .... .. 5.9 .. .. .... .. 3,131.. .... 22 88.. .. 22.2.. .. 1.06
Country data
Upper middle-income group
2000 2006 2006
East Asia & Pacific Upper middle income
American Samoa

Economic and social contextPopulation (millions)Labor force (millions)Unemployment rate (% of labor force)GNI per capita, World Bank Atlas method ($)GDP growth, 1995–2000 and 2000–06 (average annual %)Agriculture value added (% of GDP)Industry value added (% of GDP)
Manufacturing value added (% of GDP)Services value added (% of GDP)Inflation (annual % change in consumer price index)Exchange rate (local currency units per $)Exports of goods and services (% of GDP)Imports of goods and services (% of GDP) Business environmentEase of doing business (ranking 1-178; 1=best)Time to start a business (days)Procedures to start a business (number)Firing cost (weeks of wages)Closing a business (years to resolve insolvency)Total tax rate (% of profit)Highest marginal tax rate, corporate (%)Business entry rate (new registrations as % of total)Enterprise surveys
Time dealing with gov’t officials (% of management time)Firms expected to give gifts in meetings w/tax officials (%)Firms using banks to finance investments (% of firms)Delay in obtaining an electrical connection (days)ISO certification ownership (% of firms)
Private sector investmentInvest. in infrastructure w/private participation ($ millions)Private foreign direct investment, net (% of GDP)Gross fixed capital formation (% of GDP)Gross fixed private capital formation (% of GDP) Finance and bankingGovernment cash surplus or deficit (% of GDP)Government debt (% of GDP)Deposit money banks’ assets (% of GDP)Total financial system deposits (% of GDP)Bank capital to asset ratio (%)Bank nonperforming loans to total gross loans ratio (%)Domestic credit to the private sector (% of GDP)Real interest rate (%)Interest rate spread (percentage points) Infrastructure Paved roads (% of total roads)Electric power consumption (kWh per capita)Power outages in a typical month (number)Fixed line and mobile subscribers (per 100 people)Internet users (per 100 people)Cost of telephone call to U.S. ($ per 3 minutes)
22 2008 The Little Data Book on Private Sector Development
.. 0.07 1,031.. .. 504.. .. 6.2.. .. 36,608.. .. 2.3.. .. 1.5.. .. 26.2.. .. 16.8.. .. 72.3.. .... .... .. 25.6.. .. 26.3 .. .... .. 22.. .. 7.. .. 34.9.. .. 2.0.. .. 41.5.. .... .. 10.1 .. .... .... .... .... .. .. .. 849.. .. 2.7.. .. 20.4.. .. .. .. .. –1.3.. .. 47.6.. .. 99.7.. .. .... .. 6.2.. .. 1.1.. .. 162.0.. .... .. 4.4 .. .. 90.9.. .. 9,760.. .... 151 143.. 33.1 59.3
2.30 .. 0.77
Country dataHigh-
income group
2000 2006 2006
High income
Andorra

Economic and social contextPopulation (millions)Labor force (millions)Unemployment rate (% of labor force)GNI per capita, World Bank Atlas method ($)GDP growth, 1995–2000 and 2000–06 (average annual %)Agriculture value added (% of GDP)Industry value added (% of GDP)
Manufacturing value added (% of GDP)Services value added (% of GDP)Inflation (annual % change in consumer price index)Exchange rate (local currency units per $)Exports of goods and services (% of GDP)Imports of goods and services (% of GDP) Business environmentEase of doing business (ranking 1-178; 1=best)Time to start a business (days)Procedures to start a business (number)Firing cost (weeks of wages)Closing a business (years to resolve insolvency)Total tax rate (% of profit)Highest marginal tax rate, corporate (%)Business entry rate (new registrations as % of total)Enterprise surveys
Time dealing with gov’t officials (% of management time)Firms expected to give gifts in meetings w/tax officials (%)Firms using banks to finance investments (% of firms)Delay in obtaining an electrical connection (days)ISO certification ownership (% of firms)
Private sector investmentInvest. in infrastructure w/private participation ($ millions)Private foreign direct investment, net (% of GDP)Gross fixed capital formation (% of GDP)Gross fixed private capital formation (% of GDP) Finance and bankingGovernment cash surplus or deficit (% of GDP)Government debt (% of GDP)Deposit money banks’ assets (% of GDP)Total financial system deposits (% of GDP)Bank capital to asset ratio (%)Bank nonperforming loans to total gross loans ratio (%)Domestic credit to the private sector (% of GDP)Real interest rate (%)Interest rate spread (percentage points) Infrastructure Paved roads (% of total roads)Electric power consumption (kWh per capita)Power outages in a typical month (number)Fixed line and mobile subscribers (per 100 people)Internet users (per 100 people)Cost of telephone call to U.S. ($ per 3 minutes)
23The Little Data Book on Private Sector Development 2008
Sub-Saharan Africa Lower middle income
Country data
Lower middle-income group
2000 2006 2006
13.9 16.6 2,276
6.1 7.3 1,209.. .. 5.7
420 1,970 2,0386.3 11.5 7.65.7 8.9 11.9
72.1 69.7 43.52.9 4.3 26.7
22.2 21.4 44.6325.0 11.7
10.0 80.489.6 73.8 40.462.8 37.9 36.4
.. 167.. 119 53.. 12 10.. 58.0 50.2.. 6.2 3.3.. 53.2 45.8.. .... .. 7.6 .. 7.1.. 14.8.. 2.1.. 60.2.. 5.1
68 259 38,1549.6 –0.1 3.0
15.1 13.7 33.58.9 2.4 10.9
.. .. –0.9.. .. ..
1.3 7.7 87.88.3 10.5 43.1
10.6 11.3 10.710.4 13.3 4.02.0 7.5 81.3
–60.8 4.263.6 15.0 7.2
10.4 .. 65.889 141 1,502
.. 7.81 14 60
0.1 0.5 11.49.32 3.23 2.08
Angola
Economic and social contextPopulation (millions)Labor force (millions)Unemployment rate (% of labor force)GNI per capita, World Bank Atlas method ($)GDP growth, 1995–2000 and 2000–06 (average annual %)Agriculture value added (% of GDP)Industry value added (% of GDP)
Manufacturing value added (% of GDP)Services value added (% of GDP)Inflation (annual % change in consumer price index)Exchange rate (local currency units per $)Exports of goods and services (% of GDP)Imports of goods and services (% of GDP) Business environmentEase of doing business (ranking 1-178; 1=best)Time to start a business (days)Procedures to start a business (number)Firing cost (weeks of wages)Closing a business (years to resolve insolvency)Total tax rate (% of profit)Highest marginal tax rate, corporate (%)Business entry rate (new registrations as % of total)Enterprise surveys
Time dealing with gov’t officials (% of management time)Firms expected to give gifts in meetings w/tax officials (%)Firms using banks to finance investments (% of firms)Delay in obtaining an electrical connection (days)ISO certification ownership (% of firms)
Private sector investmentInvest. in infrastructure w/private participation ($ millions)Private foreign direct investment, net (% of GDP)Gross fixed capital formation (% of GDP)Gross fixed private capital formation (% of GDP) Finance and bankingGovernment cash surplus or deficit (% of GDP)Government debt (% of GDP)Deposit money banks’ assets (% of GDP)Total financial system deposits (% of GDP)Bank capital to asset ratio (%)Bank nonperforming loans to total gross loans ratio (%)Domestic credit to the private sector (% of GDP)Real interest rate (%)Interest rate spread (percentage points) Infrastructure Paved roads (% of total roads)Electric power consumption (kWh per capita)Power outages in a typical month (number)Fixed line and mobile subscribers (per 100 people)Internet users (per 100 people)Cost of telephone call to U.S. ($ per 3 minutes)
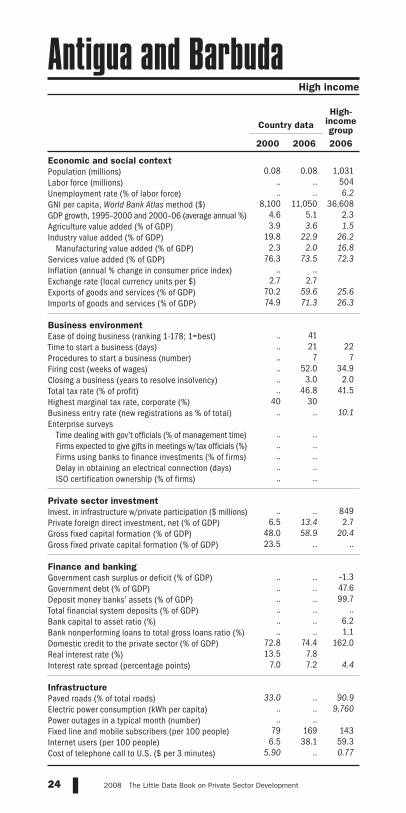
24 2008 The Little Data Book on Private Sector Development
0.08 0.08 1,031
.. .. 504
.. .. 6.28,100 11,050 36,608
4.6 5.1 2.33.9 3.6 1.5
19.8 22.9 26.22.3 2.0 16.8
76.3 73.5 72.3.. ..
2.7 2.770.2 59.6 25.674.9 71.3 26.3
.. 41.. 21 22.. 7 7.. 52.0 34.9.. 3.0 2.0.. 46.8 41.5
40 30.. .. 10.1 .. .... .... .... .... .. .. .. 849
6.5 13.4 2.748.0 58.9 20.423.5 .. ..
.. .. –1.3.. .. 47.6.. .. 99.7.. .. .... .. 6.2.. .. 1.1
72.8 74.4 162.013.5 7.8
7.0 7.2 4.4
33.0 .. 90.9.. .. 9,760.. ..
79 169 1436.5 38.1 59.3
5.90 .. 0.77
Country dataHigh-
income group
2000 2006 2006
High income
Antigua and Barbuda

Economic and social contextPopulation (millions)Labor force (millions)Unemployment rate (% of labor force)GNI per capita, World Bank Atlas method ($)GDP growth, 1995–2000 and 2000–06 (average annual %)Agriculture value added (% of GDP)Industry value added (% of GDP)
Manufacturing value added (% of GDP)Services value added (% of GDP)Inflation (annual % change in consumer price index)Exchange rate (local currency units per $)Exports of goods and services (% of GDP)Imports of goods and services (% of GDP) Business environmentEase of doing business (ranking 1-178; 1=best)Time to start a business (days)Procedures to start a business (number)Firing cost (weeks of wages)Closing a business (years to resolve insolvency)Total tax rate (% of profit)Highest marginal tax rate, corporate (%)Business entry rate (new registrations as % of total)Enterprise surveys
Time dealing with gov’t officials (% of management time)Firms expected to give gifts in meetings w/tax officials (%)Firms using banks to finance investments (% of firms)Delay in obtaining an electrical connection (days)ISO certification ownership (% of firms)
Private sector investmentInvest. in infrastructure w/private participation ($ millions)Private foreign direct investment, net (% of GDP)Gross fixed capital formation (% of GDP)Gross fixed private capital formation (% of GDP) Finance and bankingGovernment cash surplus or deficit (% of GDP)Government debt (% of GDP)Deposit money banks’ assets (% of GDP)Total financial system deposits (% of GDP)Bank capital to asset ratio (%)Bank nonperforming loans to total gross loans ratio (%)Domestic credit to the private sector (% of GDP)Real interest rate (%)Interest rate spread (percentage points) Infrastructure Paved roads (% of total roads)Electric power consumption (kWh per capita)Power outages in a typical month (number)Fixed line and mobile subscribers (per 100 people)Internet users (per 100 people)Cost of telephone call to U.S. ($ per 3 minutes)
25The Little Data Book on Private Sector Development 2008
36.9 39.1 81116.2 18.8 37414.7 10.2 9.8
7,470 5,150 5,9132.7 3.6 3.95.0 8.4 5.7
27.6 35.6 32.417.5 22.3 19.467.4 56.0 62.0–0.9 10.91.0 3.1
10.9 24.7 32.711.5 19.2 30.3
.. 109.. 31 41.. 14 9.. 139.0 39.7.. 2.8 2.9.. 112.9 44.5
35 356.1 11.8 9.1
.. 14.1.. 4.3.. 6.9.. 46.2.. 26.9
4,863 3,160 45,8693.7 2.3 3.5
16.2 23.5 19.915.2 20.9 ..
–5.7 –0.5 .... .. ..
33.7 25.5 52.927.2 20.7 41.4
.. 13.6 9.816.0 3.4 3.223.9 13.0 41.4
9.9 –4.32.7 2.2 5.9
29.4 30.0 ..2,087 2,418 3,131
.. 1.339 105 887.0 20.9 22.2
2.77 .. 1.06
Latin America & Caribbean Upper middle income
Country data
Upper middle-income group
2000 2006 2006
Argentina

Economic and social contextPopulation (millions)Labor force (millions)Unemployment rate (% of labor force)GNI per capita, World Bank Atlas method ($)GDP growth, 1995–2000 and 2000–06 (average annual %)Agriculture value added (% of GDP)Industry value added (% of GDP)
Manufacturing value added (% of GDP)Services value added (% of GDP)Inflation (annual % change in consumer price index)Exchange rate (local currency units per $)Exports of goods and services (% of GDP)Imports of goods and services (% of GDP) Business environmentEase of doing business (ranking 1-178; 1=best)Time to start a business (days)Procedures to start a business (number)Firing cost (weeks of wages)Closing a business (years to resolve insolvency)Total tax rate (% of profit)Highest marginal tax rate, corporate (%)Business entry rate (new registrations as % of total)Enterprise surveys
Time dealing with gov’t officials (% of management time)Firms expected to give gifts in meetings w/tax officials (%)Firms using banks to finance investments (% of firms)Delay in obtaining an electrical connection (days)ISO certification ownership (% of firms)
Private sector investmentInvest. in infrastructure w/private participation ($ millions)Private foreign direct investment, net (% of GDP)Gross fixed capital formation (% of GDP)Gross fixed private capital formation (% of GDP) Finance and bankingGovernment cash surplus or deficit (% of GDP)Government debt (% of GDP)Deposit money banks’ assets (% of GDP)Total financial system deposits (% of GDP)Bank capital to asset ratio (%)Bank nonperforming loans to total gross loans ratio (%)Domestic credit to the private sector (% of GDP)Real interest rate (%)Interest rate spread (percentage points) Infrastructure Paved roads (% of total roads)Electric power consumption (kWh per capita)Power outages in a typical month (number)Fixed line and mobile subscribers (per 100 people)Internet users (per 100 people)Cost of telephone call to U.S. ($ per 3 minutes)
26 2008 The Little Data Book on Private Sector Development
3.1 3.0 2,2761.3 1.3 1,209
36.4 .. 5.7660 1,920 2,0385.1 12.5 7.6
25.5 19.6 11.935.4 43.6 43.524.1 16.8 26.739.0 36.8 44.6–0.8 2.9
539.5 416.023.4 22.0 40.450.5 36.5 36.4
.. 39.. 18 53.. 9 10.. 13.0 50.2.. 1.9 3.3.. 36.6 45.8.. ..
7.6 7.8 7.6 .. 3.0
27.2 67.84.7 35.05.0 3.0
.. 5.7
33 20 38,1545.5 5.4 3.0
18.4 33.3 33.515.9 27.6 10.9
.. –0.3 –0.9.. .. ..
10.5 9.5 87.87.6 9.3 43.1
14.3 22.9 10.717.5 2.5 4.09.9 8.8 81.3
33.4 11.413.5 10.7 7.2
96.8 90.0 65.81,292 1,503 1,502
.. ..18 30 60
1.3 5.7 11.45.34 2.42 2.08
Country data
Lower middle-income group
2000 2006 2006
Europe & Central Asia Lower middle income
Armenia
Economic and social contextPopulation (millions)Labor force (millions)Unemployment rate (% of labor force)GNI per capita, World Bank Atlas method ($)GDP growth, 1995–2000 and 2000–06 (average annual %)Agriculture value added (% of GDP)Industry value added (% of GDP)
Manufacturing value added (% of GDP)Services value added (% of GDP)Inflation (annual % change in consumer price index)Exchange rate (local currency units per $)Exports of goods and services (% of GDP)Imports of goods and services (% of GDP) Business environmentEase of doing business (ranking 1-178; 1=best)Time to start a business (days)Procedures to start a business (number)Firing cost (weeks of wages)Closing a business (years to resolve insolvency)Total tax rate (% of profit)Highest marginal tax rate, corporate (%)Business entry rate (new registrations as % of total)Enterprise surveys
Time dealing with gov’t officials (% of management time)Firms expected to give gifts in meetings w/tax officials (%)Firms using banks to finance investments (% of firms)Delay in obtaining an electrical connection (days)ISO certification ownership (% of firms)
Private sector investmentInvest. in infrastructure w/private participation ($ millions)Private foreign direct investment, net (% of GDP)Gross fixed capital formation (% of GDP)Gross fixed private capital formation (% of GDP) Finance and bankingGovernment cash surplus or deficit (% of GDP)Government debt (% of GDP)Deposit money banks’ assets (% of GDP)Total financial system deposits (% of GDP)Bank capital to asset ratio (%)Bank nonperforming loans to total gross loans ratio (%)Domestic credit to the private sector (% of GDP)Real interest rate (%)Interest rate spread (percentage points) Infrastructure Paved roads (% of total roads)Electric power consumption (kWh per capita)Power outages in a typical month (number)Fixed line and mobile subscribers (per 100 people)Internet users (per 100 people)Cost of telephone call to U.S. ($ per 3 minutes)
27The Little Data Book on Private Sector Development 2008
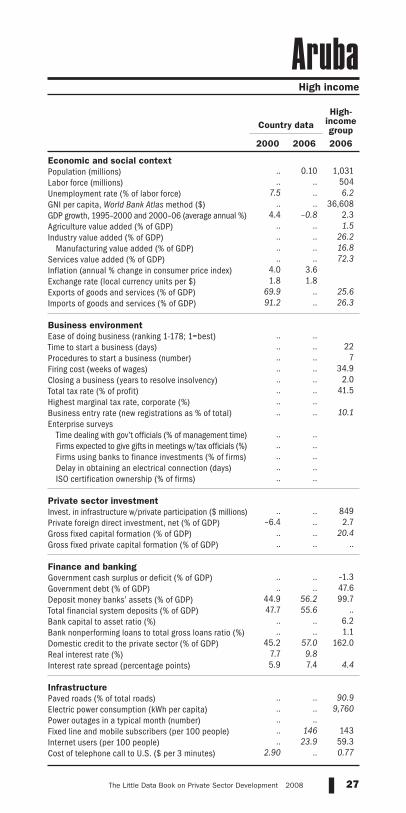
.. 0.10 1,031.. .. 504
7.5 .. 6.2.. .. 36,608
4.4 –0.8 2.3.. .. 1.5.. .. 26.2.. .. 16.8.. .. 72.3
4.0 3.61.8 1.8
69.9 .. 25.691.2 .. 26.3
.. .... .. 22.. .. 7.. .. 34.9.. .. 2.0.. .. 41.5.. .... .. 10.1 .. .... .... .... .... .. .. .. 849
–6.4 .. 2.7.. .. 20.4.. .. .. .. .. –1.3.. .. 47.6
44.9 56.2 99.747.7 55.6 ..
.. .. 6.2
.. .. 1.145.2 57.0 162.0
7.7 9.85.9 7.4 4.4
.. .. 90.9.. .. 9,760.. .... 146 143.. 23.9 59.3
2.90 .. 0.77
Country dataHigh-
income group
2000 2006 2006
High income
Aruba

Economic and social contextPopulation (millions)Labor force (millions)Unemployment rate (% of labor force)GNI per capita, World Bank Atlas method ($)GDP growth, 1995–2000 and 2000–06 (average annual %)Agriculture value added (% of GDP)Industry value added (% of GDP)
Manufacturing value added (% of GDP)Services value added (% of GDP)Inflation (annual % change in consumer price index)Exchange rate (local currency units per $)Exports of goods and services (% of GDP)Imports of goods and services (% of GDP) Business environmentEase of doing business (ranking 1-178; 1=best)Time to start a business (days)Procedures to start a business (number)Firing cost (weeks of wages)Closing a business (years to resolve insolvency)Total tax rate (% of profit)Highest marginal tax rate, corporate (%)Business entry rate (new registrations as % of total)Enterprise surveys
Time dealing with gov’t officials (% of management time)Firms expected to give gifts in meetings w/tax officials (%)Firms using banks to finance investments (% of firms)Delay in obtaining an electrical connection (days)ISO certification ownership (% of firms)
Private sector investmentInvest. in infrastructure w/private participation ($ millions)Private foreign direct investment, net (% of GDP)Gross fixed capital formation (% of GDP)Gross fixed private capital formation (% of GDP) Finance and bankingGovernment cash surplus or deficit (% of GDP)Government debt (% of GDP)Deposit money banks’ assets (% of GDP)Total financial system deposits (% of GDP)Bank capital to asset ratio (%)Bank nonperforming loans to total gross loans ratio (%)Domestic credit to the private sector (% of GDP)Real interest rate (%)Interest rate spread (percentage points) Infrastructure Paved roads (% of total roads)Electric power consumption (kWh per capita)Power outages in a typical month (number)Fixed line and mobile subscribers (per 100 people)Internet users (per 100 people)Cost of telephone call to U.S. ($ per 3 minutes)
28 2008 The Little Data Book on Private Sector Development
19.2 20.7 1,031
9.6 10.5 5046.3 5.1 6.2
20,720 35,860 36,6084.1 3.2 2.34.0 3.1 1.5
26.1 28.0 26.212.7 11.0 16.869.9 69.0 72.3
4.5 3.51.7 1.3
22.7 20.3 25.622.4 21.8 26.3
.. 9.. 2 22.. 2 7.. 4.0 34.9.. 1.0 2.0.. 50.6 41.5
34 309.6 8.7 10.1
.. .... .... .... .... .. .. .. 849
3.4 3.4 2.722.0 26.5 20.4
.. .. ..
1.9 1.7 –1.328.4 20.5 47.6
.. .. 99.7
.. .. ..6.9 4.9 6.20.5 0.2 1.1
84.2 109.6 162.04.2 4.65.1 5.5 4.4
38.7 .. 90.910,055 11,481 9,760
.. ..97 143 143
34.5 73.9 59.30.67 .. 0.77
Country dataHigh-
income group
2000 2006 2006
High income
Australia
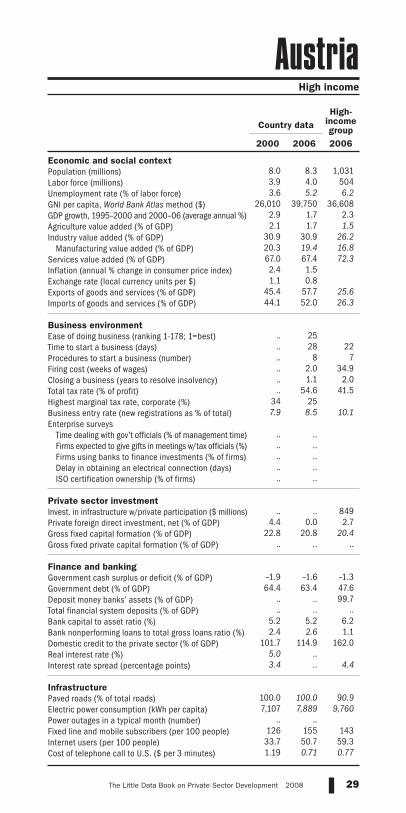
Economic and social contextPopulation (millions)Labor force (millions)Unemployment rate (% of labor force)GNI per capita, World Bank Atlas method ($)GDP growth, 1995–2000 and 2000–06 (average annual %)Agriculture value added (% of GDP)Industry value added (% of GDP)
Manufacturing value added (% of GDP)Services value added (% of GDP)Inflation (annual % change in consumer price index)Exchange rate (local currency units per $)Exports of goods and services (% of GDP)Imports of goods and services (% of GDP) Business environmentEase of doing business (ranking 1-178; 1=best)Time to start a business (days)Procedures to start a business (number)Firing cost (weeks of wages)Closing a business (years to resolve insolvency)Total tax rate (% of profit)Highest marginal tax rate, corporate (%)Business entry rate (new registrations as % of total)Enterprise surveys
Time dealing with gov’t officials (% of management time)Firms expected to give gifts in meetings w/tax officials (%)Firms using banks to finance investments (% of firms)Delay in obtaining an electrical connection (days)ISO certification ownership (% of firms)
Private sector investmentInvest. in infrastructure w/private participation ($ millions)Private foreign direct investment, net (% of GDP)Gross fixed capital formation (% of GDP)Gross fixed private capital formation (% of GDP) Finance and bankingGovernment cash surplus or deficit (% of GDP)Government debt (% of GDP)Deposit money banks’ assets (% of GDP)Total financial system deposits (% of GDP)Bank capital to asset ratio (%)Bank nonperforming loans to total gross loans ratio (%)Domestic credit to the private sector (% of GDP)Real interest rate (%)Interest rate spread (percentage points) Infrastructure Paved roads (% of total roads)Electric power consumption (kWh per capita)Power outages in a typical month (number)Fixed line and mobile subscribers (per 100 people)Internet users (per 100 people)Cost of telephone call to U.S. ($ per 3 minutes)
29The Little Data Book on Private Sector Development 2008
High income
Country dataHigh-
income group
2000 2006 2006
8.0 8.3 1,0313.9 4.0 5043.6 5.2 6.2
26,010 39,750 36,6082.9 1.7 2.32.1 1.7 1.5
30.9 30.9 26.220.3 19.4 16.867.0 67.4 72.32.4 1.51.1 0.8
45.4 57.7 25.644.1 52.0 26.3
.. 25.. 28 22.. 8 7.. 2.0 34.9.. 1.1 2.0.. 54.6 41.5
34 257.9 8.5 10.1
.. .... .... .... .... .. .. .. 849
4.4 0.0 2.722.8 20.8 20.4
.. .. ..
–1.9 –1.6 –1.364.4 63.4 47.6
.. .. 99.7
.. .. ..5.2 5.2 6.22.4 2.6 1.1
101.7 114.9 162.05.0 ..3.4 .. 4.4
100.0 100.0 90.97,107 7,889 9,760
.. ..126 155 14333.7 50.7 59.31.19 0.71 0.77
Austria

Economic and social contextPopulation (millions)Labor force (millions)Unemployment rate (% of labor force)GNI per capita, World Bank Atlas method ($)GDP growth, 1995–2000 and 2000–06 (average annual %)Agriculture value added (% of GDP)Industry value added (% of GDP)
Manufacturing value added (% of GDP)Services value added (% of GDP)Inflation (annual % change in consumer price index)Exchange rate (local currency units per $)Exports of goods and services (% of GDP)Imports of goods and services (% of GDP) Business environmentEase of doing business (ranking 1-178; 1=best)Time to start a business (days)Procedures to start a business (number)Firing cost (weeks of wages)Closing a business (years to resolve insolvency)Total tax rate (% of profit)Highest marginal tax rate, corporate (%)Business entry rate (new registrations as % of total)Enterprise surveys
Time dealing with gov’t officials (% of management time)Firms expected to give gifts in meetings w/tax officials (%)Firms using banks to finance investments (% of firms)Delay in obtaining an electrical connection (days)ISO certification ownership (% of firms)
Private sector investmentInvest. in infrastructure w/private participation ($ millions)Private foreign direct investment, net (% of GDP)Gross fixed capital formation (% of GDP)Gross fixed private capital formation (% of GDP) Finance and bankingGovernment cash surplus or deficit (% of GDP)Government debt (% of GDP)Deposit money banks’ assets (% of GDP)Total financial system deposits (% of GDP)Bank capital to asset ratio (%)Bank nonperforming loans to total gross loans ratio (%)Domestic credit to the private sector (% of GDP)Real interest rate (%)Interest rate spread (percentage points) Infrastructure Paved roads (% of total roads)Electric power consumption (kWh per capita)Power outages in a typical month (number)Fixed line and mobile subscribers (per 100 people)Internet users (per 100 people)Cost of telephone call to U.S. ($ per 3 minutes)
30 2008 The Little Data Book on Private Sector Development
8.0 8.5 2,2763.7 4.3 1,209
.. 8.6 5.7610 1,840 2,0387.3 15.6 7.6
17.1 7.4 11.945.3 70.1 43.5
5.6 5.6 26.737.5 22.5 44.61.9 8.30.9 0.9
39.0 70.3 40.438.4 41.0 36.4
.. 96.. 30 53.. 13 10.. 22.0 50.2.. 2.7 3.3.. 40.9 45.8
27 22.. .. 7.6 .. 5.2
53.2 66.72.9 0.6
18.0 2.0.. 10.3
61 414 38,1542.5 –2.9 3.0
23.1 31.4 33.520.1 22.8 10.9
–4.7 .. –0.9.. .. ..
10.3 11.0 87.87.5 9.2 43.1
.. 14.2 10.728.0 7.2 4.0
5.9 12.4 81.36.4 11.96.8 7.3 7.2
92.3 49.4 65.82,040 2,407 1,502
.. ..15 53 600.1 9.8 11.4
7.10 4.18 2.08
Country data
Lower middle-income group
2000 2006 2006
Europe & Central Asia Lower middle income
Azerbaijan

Economic and social contextPopulation (millions)Labor force (millions)Unemployment rate (% of labor force)GNI per capita, World Bank Atlas method ($)GDP growth, 1995–2000 and 2000–06 (average annual %)Agriculture value added (% of GDP)Industry value added (% of GDP)
Manufacturing value added (% of GDP)Services value added (% of GDP)Inflation (annual % change in consumer price index)Exchange rate (local currency units per $)Exports of goods and services (% of GDP)Imports of goods and services (% of GDP) Business environmentEase of doing business (ranking 1-178; 1=best)Time to start a business (days)Procedures to start a business (number)Firing cost (weeks of wages)Closing a business (years to resolve insolvency)Total tax rate (% of profit)Highest marginal tax rate, corporate (%)Business entry rate (new registrations as % of total)Enterprise surveys
Time dealing with gov’t officials (% of management time)Firms expected to give gifts in meetings w/tax officials (%)Firms using banks to finance investments (% of firms)Delay in obtaining an electrical connection (days)ISO certification ownership (% of firms)
Private sector investmentInvest. in infrastructure w/private participation ($ millions)Private foreign direct investment, net (% of GDP)Gross fixed capital formation (% of GDP)Gross fixed private capital formation (% of GDP) Finance and bankingGovernment cash surplus or deficit (% of GDP)Government debt (% of GDP)Deposit money banks’ assets (% of GDP)Total financial system deposits (% of GDP)Bank capital to asset ratio (%)Bank nonperforming loans to total gross loans ratio (%)Domestic credit to the private sector (% of GDP)Real interest rate (%)Interest rate spread (percentage points) Infrastructure Paved roads (% of total roads)Electric power consumption (kWh per capita)Power outages in a typical month (number)Fixed line and mobile subscribers (per 100 people)Internet users (per 100 people)Cost of telephone call to U.S. ($ per 3 minutes)
31The Little Data Book on Private Sector Development 2008
0.30 0.33 1,0310.15 0.16 5046.9 10.2 6.2
15,290 .. 36,6084.2 .. 2.3
.. .. 1.5
.. .. 26.2
.. .. 16.8
.. .. 72.31.0 2.41.0 1.0
.. .. 25.6
.. .. 26.3 .. .... .. 22.. .. 7.. .. 34.9.. .. 2.0.. .. 41.5.. .... .. 10.1 .. .... .... .... .... .. .. .. 849
5.0 3.5 2.7.. .. 20.4.. .. ..
0.4 –1.8 –1.330.3 .. 47.6
.. .. 99.7
.. .. ..
.. .. 6.2
.. .. 1.172.3 82.2 162.0
1.8 ..1.9 2.1 4.4
57.4 .. 90.9.. .. 9,760.. ..
48 112 1434.3 31.9 59.3
2.40 .. 0.77
Country dataHigh-
income group
2000 2006 2006
High income
Bahamas, The
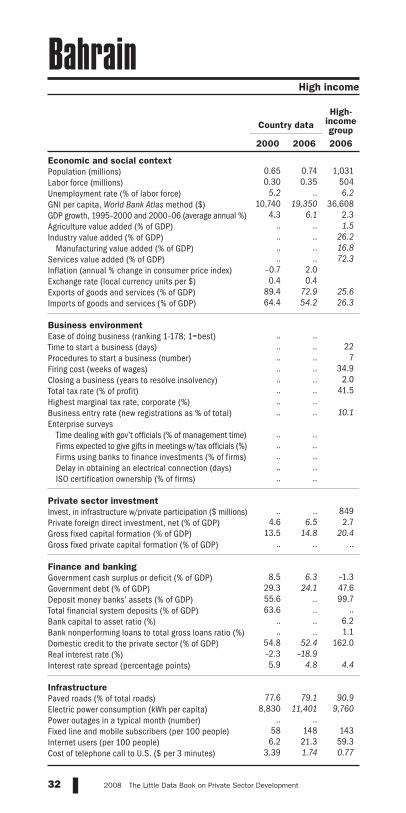
Economic and social contextPopulation (millions)Labor force (millions)Unemployment rate (% of labor force)GNI per capita, World Bank Atlas method ($)GDP growth, 1995–2000 and 2000–06 (average annual %)Agriculture value added (% of GDP)Industry value added (% of GDP)
Manufacturing value added (% of GDP)Services value added (% of GDP)Inflation (annual % change in consumer price index)Exchange rate (local currency units per $)Exports of goods and services (% of GDP)Imports of goods and services (% of GDP) Business environmentEase of doing business (ranking 1-178; 1=best)Time to start a business (days)Procedures to start a business (number)Firing cost (weeks of wages)Closing a business (years to resolve insolvency)Total tax rate (% of profit)Highest marginal tax rate, corporate (%)Business entry rate (new registrations as % of total)Enterprise surveys
Time dealing with gov’t officials (% of management time)Firms expected to give gifts in meetings w/tax officials (%)Firms using banks to finance investments (% of firms)Delay in obtaining an electrical connection (days)ISO certification ownership (% of firms)
Private sector investmentInvest. in infrastructure w/private participation ($ millions)Private foreign direct investment, net (% of GDP)Gross fixed capital formation (% of GDP)Gross fixed private capital formation (% of GDP) Finance and bankingGovernment cash surplus or deficit (% of GDP)Government debt (% of GDP)Deposit money banks’ assets (% of GDP)Total financial system deposits (% of GDP)Bank capital to asset ratio (%)Bank nonperforming loans to total gross loans ratio (%)Domestic credit to the private sector (% of GDP)Real interest rate (%)Interest rate spread (percentage points) Infrastructure Paved roads (% of total roads)Electric power consumption (kWh per capita)Power outages in a typical month (number)Fixed line and mobile subscribers (per 100 people)Internet users (per 100 people)Cost of telephone call to U.S. ($ per 3 minutes)
32 2008 The Little Data Book on Private Sector Development
0.65 0.74 1,0310.30 0.35 504
5.2 .. 6.210,740 19,350 36,608
4.3 6.1 2.3.. .. 1.5.. .. 26.2.. .. 16.8.. .. 72.3
–0.7 2.00.4 0.4
89.4 72.9 25.664.4 54.2 26.3
.. .... .. 22.. .. 7.. .. 34.9.. .. 2.0.. .. 41.5.. .... .. 10.1 .. .... .... .... .... .. .. .. 849
4.6 6.5 2.713.5 14.8 20.4
.. .. ..
8.5 6.3 –1.329.3 24.1 47.655.6 .. 99.763.6 .. ..
.. .. 6.2
.. .. 1.154.8 52.4 162.0–2.3 –18.95.9 4.8 4.4
77.6 79.1 90.98,830 11,401 9,760
.. ..58 148 143
6.2 21.3 59.33.39 1.74 0.77
Country dataHigh-
income group
2000 2006 2006
High income
Bahrain

Economic and social contextPopulation (millions)Labor force (millions)Unemployment rate (% of labor force)GNI per capita, World Bank Atlas method ($)GDP growth, 1995–2000 and 2000–06 (average annual %)Agriculture value added (% of GDP)Industry value added (% of GDP)
Manufacturing value added (% of GDP)Services value added (% of GDP)Inflation (annual % change in consumer price index)Exchange rate (local currency units per $)Exports of goods and services (% of GDP)Imports of goods and services (% of GDP) Business environmentEase of doing business (ranking 1-178; 1=best)Time to start a business (days)Procedures to start a business (number)Firing cost (weeks of wages)Closing a business (years to resolve insolvency)Total tax rate (% of profit)Highest marginal tax rate, corporate (%)Business entry rate (new registrations as % of total)Enterprise surveys
Time dealing with gov’t officials (% of management time)Firms expected to give gifts in meetings w/tax officials (%)Firms using banks to finance investments (% of firms)Delay in obtaining an electrical connection (days)ISO certification ownership (% of firms)
Private sector investmentInvest. in infrastructure w/private participation ($ millions)Private foreign direct investment, net (% of GDP)Gross fixed capital formation (% of GDP)Gross fixed private capital formation (% of GDP) Finance and bankingGovernment cash surplus or deficit (% of GDP)Government debt (% of GDP)Deposit money banks’ assets (% of GDP)Total financial system deposits (% of GDP)Bank capital to asset ratio (%)Bank nonperforming loans to total gross loans ratio (%)Domestic credit to the private sector (% of GDP)Real interest rate (%)Interest rate spread (percentage points) Infrastructure Paved roads (% of total roads)Electric power consumption (kWh per capita)Power outages in a typical month (number)Fixed line and mobile subscribers (per 100 people)Internet users (per 100 people)Cost of telephone call to U.S. ($ per 3 minutes)
33The Little Data Book on Private Sector Development 2008
139.4 156.0 2,42062.3 71.0 995
3.3 4.3 ..360 450 6495.2 5.6 6.5
25.5 19.6 20.425.3 27.9 27.715.2 17.2 15.849.2 52.5 51.9
2.2 6.852.1 68.914.0 19.0 26.719.2 25.2 30.1
.. 107.. 74 54.. 8 10.. 104.0 62.6.. 4.0 3.8.. 39.5 67.4.. ..
5.7 7.9 6.4 .. 3.2
85.8 54.450.5 24.779.6 50.3
.. 7.8
93 893 29,7850.6 1.1 2.6
23.0 24.7 26.715.6 18.7 19.6
–0.7 –0.7 –2.636.2 36.2 ..30.0 49.4 50.527.2 47.0 44.63.5 4.0 ..
34.9 13.2 ..24.7 36.2 38.313.4 9.76.9 6.2 11.3
9.5 9.5 ..96 136 391
.. 101.61 13 17
0.1 0.3 4.24.14 2.02 1.99
Country dataLow-
income group
2000 2006 2006
South Asia Low income
Bangladesh
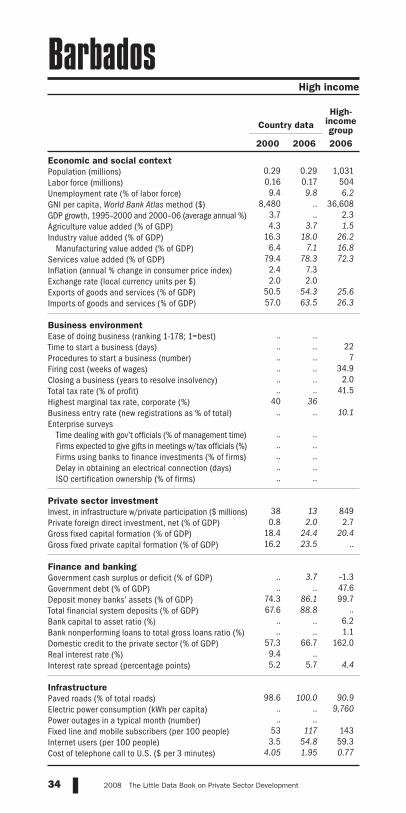
Economic and social contextPopulation (millions)Labor force (millions)Unemployment rate (% of labor force)GNI per capita, World Bank Atlas method ($)GDP growth, 1995–2000 and 2000–06 (average annual %)Agriculture value added (% of GDP)Industry value added (% of GDP)
Manufacturing value added (% of GDP)Services value added (% of GDP)Inflation (annual % change in consumer price index)Exchange rate (local currency units per $)Exports of goods and services (% of GDP)Imports of goods and services (% of GDP) Business environmentEase of doing business (ranking 1-178; 1=best)Time to start a business (days)Procedures to start a business (number)Firing cost (weeks of wages)Closing a business (years to resolve insolvency)Total tax rate (% of profit)Highest marginal tax rate, corporate (%)Business entry rate (new registrations as % of total)Enterprise surveys
Time dealing with gov’t officials (% of management time)Firms expected to give gifts in meetings w/tax officials (%)Firms using banks to finance investments (% of firms)Delay in obtaining an electrical connection (days)ISO certification ownership (% of firms)
Private sector investmentInvest. in infrastructure w/private participation ($ millions)Private foreign direct investment, net (% of GDP)Gross fixed capital formation (% of GDP)Gross fixed private capital formation (% of GDP) Finance and bankingGovernment cash surplus or deficit (% of GDP)Government debt (% of GDP)Deposit money banks’ assets (% of GDP)Total financial system deposits (% of GDP)Bank capital to asset ratio (%)Bank nonperforming loans to total gross loans ratio (%)Domestic credit to the private sector (% of GDP)Real interest rate (%)Interest rate spread (percentage points) Infrastructure Paved roads (% of total roads)Electric power consumption (kWh per capita)Power outages in a typical month (number)Fixed line and mobile subscribers (per 100 people)Internet users (per 100 people)Cost of telephone call to U.S. ($ per 3 minutes)
34 2008 The Little Data Book on Private Sector Development
0.29 0.29 1,0310.16 0.17 5049.4 9.8 6.2
8,480 .. 36,6083.7 .. 2.34.3 3.7 1.5
16.3 18.0 26.26.4 7.1 16.8
79.4 78.3 72.32.4 7.32.0 2.0
50.5 54.3 25.657.0 63.5 26.3
.. .... .. 22.. .. 7.. .. 34.9.. .. 2.0.. .. 41.5
40 36.. .. 10.1 .. .... .... .... .... ..
38 13 8490.8 2.0 2.7
18.4 24.4 20.416.2 23.5 ..
.. 3.7 –1.3.. .. 47.6
74.3 86.1 99.767.6 88.8 ..
.. .. 6.2
.. .. 1.157.3 66.7 162.09.4 ..5.2 5.7 4.4
98.6 100.0 90.9.. .. 9,760.. ..
53 117 1433.5 54.8 59.3
4.05 1.95 0.77
Country dataHigh-
income group
2000 2006 2006
High income
Barbados
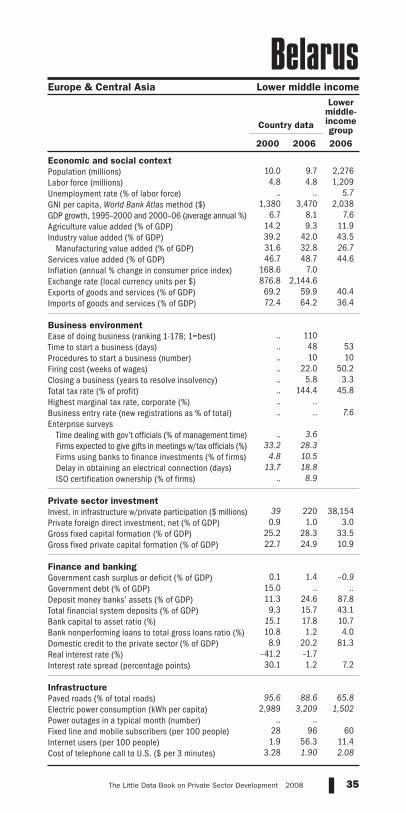
Economic and social contextPopulation (millions)Labor force (millions)Unemployment rate (% of labor force)GNI per capita, World Bank Atlas method ($)GDP growth, 1995–2000 and 2000–06 (average annual %)Agriculture value added (% of GDP)Industry value added (% of GDP)
Manufacturing value added (% of GDP)Services value added (% of GDP)Inflation (annual % change in consumer price index)Exchange rate (local currency units per $)Exports of goods and services (% of GDP)Imports of goods and services (% of GDP) Business environmentEase of doing business (ranking 1-178; 1=best)Time to start a business (days)Procedures to start a business (number)Firing cost (weeks of wages)Closing a business (years to resolve insolvency)Total tax rate (% of profit)Highest marginal tax rate, corporate (%)Business entry rate (new registrations as % of total)Enterprise surveys
Time dealing with gov’t officials (% of management time)Firms expected to give gifts in meetings w/tax officials (%)Firms using banks to finance investments (% of firms)Delay in obtaining an electrical connection (days)ISO certification ownership (% of firms)
Private sector investmentInvest. in infrastructure w/private participation ($ millions)Private foreign direct investment, net (% of GDP)Gross fixed capital formation (% of GDP)Gross fixed private capital formation (% of GDP) Finance and bankingGovernment cash surplus or deficit (% of GDP)Government debt (% of GDP)Deposit money banks’ assets (% of GDP)Total financial system deposits (% of GDP)Bank capital to asset ratio (%)Bank nonperforming loans to total gross loans ratio (%)Domestic credit to the private sector (% of GDP)Real interest rate (%)Interest rate spread (percentage points) Infrastructure Paved roads (% of total roads)Electric power consumption (kWh per capita)Power outages in a typical month (number)Fixed line and mobile subscribers (per 100 people)Internet users (per 100 people)Cost of telephone call to U.S. ($ per 3 minutes)
35The Little Data Book on Private Sector Development 2008
10.0 9.7 2,2764.8 4.8 1,209
.. .. 5.71,380 3,470 2,038
6.7 8.1 7.614.2 9.3 11.939.2 42.0 43.531.6 32.8 26.746.7 48.7 44.6
168.6 7.0876.8 2,144.669.2 59.9 40.472.4 64.2 36.4
.. 110.. 48 53.. 10 10.. 22.0 50.2.. 5.8 3.3.. 144.4 45.8.. .... .. 7.6 .. 3.6
33.2 28.34.8 10.5
13.7 18.8.. 8.9
39 220 38,1540.9 1.0 3.0
25.2 28.3 33.522.7 24.9 10.9
0.1 1.4 –0.915.0 .. ..11.3 24.6 87.89.3 15.7 43.1
15.1 17.8 10.710.8 1.2 4.08.9 20.2 81.3
–41.2 –1.730.1 1.2 7.2
95.6 88.6 65.82,989 3,209 1,502
.. ..28 96 601.9 56.3 11.4
3.28 1.90 2.08
Country data
Lower middle-income group
2000 2006 2006
Europe & Central Asia Lower middle income
Belarus

Economic and social contextPopulation (millions)Labor force (millions)Unemployment rate (% of labor force)GNI per capita, World Bank Atlas method ($)GDP growth, 1995–2000 and 2000–06 (average annual %)Agriculture value added (% of GDP)Industry value added (% of GDP)
Manufacturing value added (% of GDP)Services value added (% of GDP)Inflation (annual % change in consumer price index)Exchange rate (local currency units per $)Exports of goods and services (% of GDP)Imports of goods and services (% of GDP) Business environmentEase of doing business (ranking 1-178; 1=best)Time to start a business (days)Procedures to start a business (number)Firing cost (weeks of wages)Closing a business (years to resolve insolvency)Total tax rate (% of profit)Highest marginal tax rate, corporate (%)Business entry rate (new registrations as % of total)Enterprise surveys
Time dealing with gov’t officials (% of management time)Firms expected to give gifts in meetings w/tax officials (%)Firms using banks to finance investments (% of firms)Delay in obtaining an electrical connection (days)ISO certification ownership (% of firms)
Private sector investmentInvest. in infrastructure w/private participation ($ millions)Private foreign direct investment, net (% of GDP)Gross fixed capital formation (% of GDP)Gross fixed private capital formation (% of GDP) Finance and bankingGovernment cash surplus or deficit (% of GDP)Government debt (% of GDP)Deposit money banks’ assets (% of GDP)Total financial system deposits (% of GDP)Bank capital to asset ratio (%)Bank nonperforming loans to total gross loans ratio (%)Domestic credit to the private sector (% of GDP)Real interest rate (%)Interest rate spread (percentage points) Infrastructure Paved roads (% of total roads)Electric power consumption (kWh per capita)Power outages in a typical month (number)Fixed line and mobile subscribers (per 100 people)Internet users (per 100 people)Cost of telephone call to U.S. ($ per 3 minutes)
36 2008 The Little Data Book on Private Sector Development
10.3 10.5 1,031
4.4 4.5 5046.6 8.1 6.2
25,360 38,460 36,6082.7 1.7 2.31.4 1.0 1.5
27.0 24.3 26.219.3 17.1 16.871.6 74.7 72.32.5 1.81.1 0.8
84.6 87.7 25.681.7 85.1 26.3
.. 19.. 4 22.. 3 7.. 16.0 34.9.. 0.9 2.0.. 64.3 41.5
39 346.7 7.4 10.1
.. .... .... .... .... .. .. .. 849
92.7 15.7 2.720.8 20.4 20.4
.. .. ..
0.1 0.3 –1.3106.5 84.8 47.6
.. .. 99.7
.. .. ..2.8 3.7 6.22.8 1.8 1.1
78.1 83.3 162.06.0 5.44.4 5.2 4.4
78.2 78.0 90.98,247 8,510 9,760
.. ..104 136 143
29.3 45.8 59.31.67 0.75 0.77
Country dataHigh-
income group
2000 2006 2006
High income
Belgium
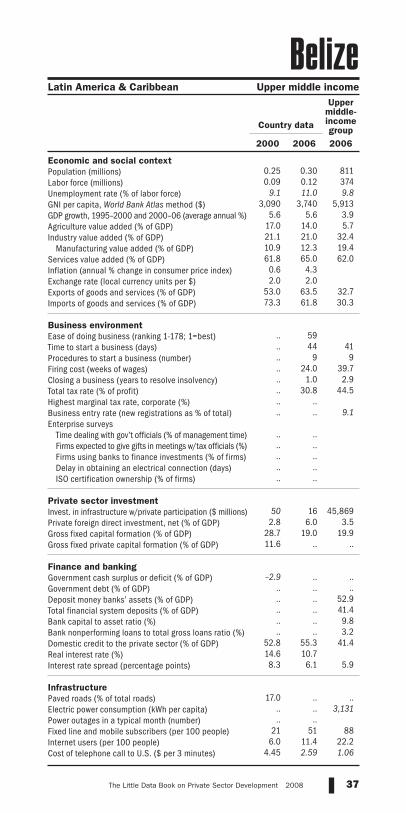
Economic and social contextPopulation (millions)Labor force (millions)Unemployment rate (% of labor force)GNI per capita, World Bank Atlas method ($)GDP growth, 1995–2000 and 2000–06 (average annual %)Agriculture value added (% of GDP)Industry value added (% of GDP)
Manufacturing value added (% of GDP)Services value added (% of GDP)Inflation (annual % change in consumer price index)Exchange rate (local currency units per $)Exports of goods and services (% of GDP)Imports of goods and services (% of GDP) Business environmentEase of doing business (ranking 1-178; 1=best)Time to start a business (days)Procedures to start a business (number)Firing cost (weeks of wages)Closing a business (years to resolve insolvency)Total tax rate (% of profit)Highest marginal tax rate, corporate (%)Business entry rate (new registrations as % of total)Enterprise surveys
Time dealing with gov’t officials (% of management time)Firms expected to give gifts in meetings w/tax officials (%)Firms using banks to finance investments (% of firms)Delay in obtaining an electrical connection (days)ISO certification ownership (% of firms)
Private sector investmentInvest. in infrastructure w/private participation ($ millions)Private foreign direct investment, net (% of GDP)Gross fixed capital formation (% of GDP)Gross fixed private capital formation (% of GDP) Finance and bankingGovernment cash surplus or deficit (% of GDP)Government debt (% of GDP)Deposit money banks’ assets (% of GDP)Total financial system deposits (% of GDP)Bank capital to asset ratio (%)Bank nonperforming loans to total gross loans ratio (%)Domestic credit to the private sector (% of GDP)Real interest rate (%)Interest rate spread (percentage points) Infrastructure Paved roads (% of total roads)Electric power consumption (kWh per capita)Power outages in a typical month (number)Fixed line and mobile subscribers (per 100 people)Internet users (per 100 people)Cost of telephone call to U.S. ($ per 3 minutes)
37The Little Data Book on Private Sector Development 2008
0.25 0.30 8110.09 0.12 374
9.1 11.0 9.83,090 3,740 5,913
5.6 5.6 3.917.0 14.0 5.721.1 21.0 32.410.9 12.3 19.461.8 65.0 62.0
0.6 4.32.0 2.0
53.0 63.5 32.773.3 61.8 30.3
.. 59.. 44 41.. 9 9.. 24.0 39.7.. 1.0 2.9.. 30.8 44.5.. .... .. 9.1 .. .... .... .... .... ..
50 16 45,8692.8 6.0 3.5
28.7 19.0 19.911.6 .. ..
–2.9 .. .... .. .... .. 52.9.. .. 41.4.. .. 9.8.. .. 3.2
52.8 55.3 41.414.6 10.78.3 6.1 5.9
17.0 .. .... .. 3,131.. ..
21 51 886.0 11.4 22.2
4.45 2.59 1.06
Country data
Upper middle-income group
2000 2006 2006
Latin America & Caribbean Upper middle income
Belize

Economic and social contextPopulation (millions)Labor force (millions)Unemployment rate (% of labor force)GNI per capita, World Bank Atlas method ($)GDP growth, 1995–2000 and 2000–06 (average annual %)Agriculture value added (% of GDP)Industry value added (% of GDP)
Manufacturing value added (% of GDP)Services value added (% of GDP)Inflation (annual % change in consumer price index)Exchange rate (local currency units per $)Exports of goods and services (% of GDP)Imports of goods and services (% of GDP) Business environmentEase of doing business (ranking 1-178; 1=best)Time to start a business (days)Procedures to start a business (number)Firing cost (weeks of wages)Closing a business (years to resolve insolvency)Total tax rate (% of profit)Highest marginal tax rate, corporate (%)Business entry rate (new registrations as % of total)Enterprise surveys
Time dealing with gov’t officials (% of management time)Firms expected to give gifts in meetings w/tax officials (%)Firms using banks to finance investments (% of firms)Delay in obtaining an electrical connection (days)ISO certification ownership (% of firms)
Private sector investmentInvest. in infrastructure w/private participation ($ millions)Private foreign direct investment, net (% of GDP)Gross fixed capital formation (% of GDP)Gross fixed private capital formation (% of GDP) Finance and bankingGovernment cash surplus or deficit (% of GDP)Government debt (% of GDP)Deposit money banks’ assets (% of GDP)Total financial system deposits (% of GDP)Bank capital to asset ratio (%)Bank nonperforming loans to total gross loans ratio (%)Domestic credit to the private sector (% of GDP)Real interest rate (%)Interest rate spread (percentage points) Infrastructure Paved roads (% of total roads)Electric power consumption (kWh per capita)Power outages in a typical month (number)Fixed line and mobile subscribers (per 100 people)Internet users (per 100 people)Cost of telephone call to U.S. ($ per 3 minutes)
38 2008 The Little Data Book on Private Sector Development
7.2 8.8 2,4202.8 3.4 995
.. .. ..340 530 6495.3 3.8 6.5
36.5 32.2 20.413.9 13.4 27.78.8 7.5 15.8
49.6 54.4 51.94.2 3.8
712.0 522.915.2 13.5 26.728.1 26.1 30.1
.. 151.. 31 54.. 7 10.. 36.0 62.6.. 4.0 3.8.. 73.3 67.4.. 38.. .. 6.4 .. 6.5.. 21.2.. 20.8.. 71.7.. 2.7
90 17 29,7852.6 1.3 2.6
18.9 18.9 26.711.3 12.2 19.6
0.7 0.2 –2.6.. .. ..
12.2 17.3 50.514.2 17.8 44.6
.. .. ..
.. .. ..12.1 16.7 38.3
.. ..
.. .. 11.3
20.0 9.5 ..55 69 391
.. ..1 13 17
0.2 8.0 4.25.93 4.80 1.99
Country dataLow-
income group
2000 2006 2006
Sub-Saharan Africa Low income
Benin

Economic and social contextPopulation (millions)Labor force (millions)Unemployment rate (% of labor force)GNI per capita, World Bank Atlas method ($)GDP growth, 1995–2000 and 2000–06 (average annual %)Agriculture value added (% of GDP)Industry value added (% of GDP)
Manufacturing value added (% of GDP)Services value added (% of GDP)Inflation (annual % change in consumer price index)Exchange rate (local currency units per $)Exports of goods and services (% of GDP)Imports of goods and services (% of GDP) Business environmentEase of doing business (ranking 1-178; 1=best)Time to start a business (days)Procedures to start a business (number)Firing cost (weeks of wages)Closing a business (years to resolve insolvency)Total tax rate (% of profit)Highest marginal tax rate, corporate (%)Business entry rate (new registrations as % of total)Enterprise surveys
Time dealing with gov’t officials (% of management time)Firms expected to give gifts in meetings w/tax officials (%)Firms using banks to finance investments (% of firms)Delay in obtaining an electrical connection (days)ISO certification ownership (% of firms)
Private sector investmentInvest. in infrastructure w/private participation ($ millions)Private foreign direct investment, net (% of GDP)Gross fixed capital formation (% of GDP)Gross fixed private capital formation (% of GDP) Finance and bankingGovernment cash surplus or deficit (% of GDP)Government debt (% of GDP)Deposit money banks’ assets (% of GDP)Total financial system deposits (% of GDP)Bank capital to asset ratio (%)Bank nonperforming loans to total gross loans ratio (%)Domestic credit to the private sector (% of GDP)Real interest rate (%)Interest rate spread (percentage points) Infrastructure Paved roads (% of total roads)Electric power consumption (kWh per capita)Power outages in a typical month (number)Fixed line and mobile subscribers (per 100 people)Internet users (per 100 people)Cost of telephone call to U.S. ($ per 3 minutes)
39The Little Data Book on Private Sector Development 2008
0.06 0.06 1,031
.. .. 504
.. .. 6.235,990 .. 36,608
.. .. 2.3
.. .. 1.5
.. .. 26.2
.. .. 16.8
.. .. 72.3
.. ..1.0 1.0
.. .. 25.6
.. .. 26.3 .. .... .. 22.. .. 7.. .. 34.9.. .. 2.0.. .. 41.5.. .... .. 10.1 .. .... .... .... .... .. .. .. 849.. .. 2.7.. .. 20.4.. .. .. .. .. –1.3.. .. 47.6.. .. 99.7.. .. .... .. 6.2.. .. 1.1.. .. 162.0.. .... .. 4.4 .. .. 90.9.. .. 9,760.. ..
111 185 14343.5 66.1 59.33.50 .. 0.77
Country dataHigh-
income group
2000 2006 2006
High income
Bermuda

Economic and social contextPopulation (millions)Labor force (millions)Unemployment rate (% of labor force)GNI per capita, World Bank Atlas method ($)GDP growth, 1995–2000 and 2000–06 (average annual %)Agriculture value added (% of GDP)Industry value added (% of GDP)
Manufacturing value added (% of GDP)Services value added (% of GDP)Inflation (annual % change in consumer price index)Exchange rate (local currency units per $)Exports of goods and services (% of GDP)Imports of goods and services (% of GDP) Business environmentEase of doing business (ranking 1-178; 1=best)Time to start a business (days)Procedures to start a business (number)Firing cost (weeks of wages)Closing a business (years to resolve insolvency)Total tax rate (% of profit)Highest marginal tax rate, corporate (%)Business entry rate (new registrations as % of total)Enterprise surveys
Time dealing with gov’t officials (% of management time)Firms expected to give gifts in meetings w/tax officials (%)Firms using banks to finance investments (% of firms)Delay in obtaining an electrical connection (days)ISO certification ownership (% of firms)
Private sector investmentInvest. in infrastructure w/private participation ($ millions)Private foreign direct investment, net (% of GDP)Gross fixed capital formation (% of GDP)Gross fixed private capital formation (% of GDP) Finance and bankingGovernment cash surplus or deficit (% of GDP)Government debt (% of GDP)Deposit money banks’ assets (% of GDP)Total financial system deposits (% of GDP)Bank capital to asset ratio (%)Bank nonperforming loans to total gross loans ratio (%)Domestic credit to the private sector (% of GDP)Real interest rate (%)Interest rate spread (percentage points) Infrastructure Paved roads (% of total roads)Electric power consumption (kWh per capita)Power outages in a typical month (number)Fixed line and mobile subscribers (per 100 people)Internet users (per 100 people)Cost of telephone call to U.S. ($ per 3 minutes)
40 2008 The Little Data Book on Private Sector Development
0.56 0.65 2,2760.20 0.29 1,209
.. .. 5.7720 1,430 2,0386.3 7.8 7.6
28.4 22.3 11.935.5 37.9 43.5
8.3 7.4 26.736.2 39.8 44.6
4.0 5.044.9 45.329.4 31.6 40.446.9 45.2 36.4
.. 119.. 48 53.. 8 10.. 10.0 50.2.. .. 3.3.. 39.8 45.8.. .... .. 7.6 .. .... .... .... .... .. .. 18 38,154
0.0 0.6 3.049.1 51.6 33.5
.. .. 10.9
–2.4 2.0 –0.938.4 74.1 ..
9.4 .. 87.837.5 .. 43.1
.. .. 10.7
.. .. 4.08.7 21.2 81.3
13.4 9.17.8 9.5 7.2
60.7 62.0 65.8.. .. 1,502.. ..3 18 60
0.4 4.6 11.41.19 0.66 2.08
Country data
Lower middle-income group
2000 2006 2006
South Asia Lower middle income
Bhutan

Economic and social contextPopulation (millions)Labor force (millions)Unemployment rate (% of labor force)GNI per capita, World Bank Atlas method ($)GDP growth, 1995–2000 and 2000–06 (average annual %)Agriculture value added (% of GDP)Industry value added (% of GDP)
Manufacturing value added (% of GDP)Services value added (% of GDP)Inflation (annual % change in consumer price index)Exchange rate (local currency units per $)Exports of goods and services (% of GDP)Imports of goods and services (% of GDP) Business environmentEase of doing business (ranking 1-178; 1=best)Time to start a business (days)Procedures to start a business (number)Firing cost (weeks of wages)Closing a business (years to resolve insolvency)Total tax rate (% of profit)Highest marginal tax rate, corporate (%)Business entry rate (new registrations as % of total)Enterprise surveys
Time dealing with gov’t officials (% of management time)Firms expected to give gifts in meetings w/tax officials (%)Firms using banks to finance investments (% of firms)Delay in obtaining an electrical connection (days)ISO certification ownership (% of firms)
Private sector investmentInvest. in infrastructure w/private participation ($ millions)Private foreign direct investment, net (% of GDP)Gross fixed capital formation (% of GDP)Gross fixed private capital formation (% of GDP) Finance and bankingGovernment cash surplus or deficit (% of GDP)Government debt (% of GDP)Deposit money banks’ assets (% of GDP)Total financial system deposits (% of GDP)Bank capital to asset ratio (%)Bank nonperforming loans to total gross loans ratio (%)Domestic credit to the private sector (% of GDP)Real interest rate (%)Interest rate spread (percentage points) Infrastructure Paved roads (% of total roads)Electric power consumption (kWh per capita)Power outages in a typical month (number)Fixed line and mobile subscribers (per 100 people)Internet users (per 100 people)Cost of telephone call to U.S. ($ per 3 minutes)
41The Little Data Book on Private Sector Development 2008
8.3 9.4 2,2763.6 4.3 1,2094.5 .. 5.7
1,000 1,100 2,0383.5 3.3 7.6
15.0 14.0 11.929.8 34.2 43.515.3 14.7 26.755.2 51.9 44.6
4.6 4.36.2 8.0
18.3 42.5 40.427.3 32.6 36.4
.. 140.. 50 53.. 15 10.. 99.5 50.2.. 1.8 3.3.. 78.1 45.8
25 259.1 6.6 7.6
.. 13.5.. 19.6.. 22.2.. 15.2.. 13.8
323 122 38,1548.8 2.2 3.0
17.9 12.9 33.512.8 6.1 10.9
–8.7 12.5 –0.9.. .. ..
61.8 38.0 87.845.9 34.2 43.1
9.8 10.0 10.710.3 8.7 4.058.7 36.1 81.327.9 –0.323.6 7.9 7.2
6.6 7.0 65.8421 479 1,502
.. 1.013 36 601.4 6.2 11.4
2.43 .. 2.08
Country data
Lower middle-income group
2000 2006 2006
Latin America & Caribbean Lower middle income
Bolivia

Economic and social contextPopulation (millions)Labor force (millions)Unemployment rate (% of labor force)GNI per capita, World Bank Atlas method ($)GDP growth, 1995–2000 and 2000–06 (average annual %)Agriculture value added (% of GDP)Industry value added (% of GDP)
Manufacturing value added (% of GDP)Services value added (% of GDP)Inflation (annual % change in consumer price index)Exchange rate (local currency units per $)Exports of goods and services (% of GDP)Imports of goods and services (% of GDP) Business environmentEase of doing business (ranking 1-178; 1=best)Time to start a business (days)Procedures to start a business (number)Firing cost (weeks of wages)Closing a business (years to resolve insolvency)Total tax rate (% of profit)Highest marginal tax rate, corporate (%)Business entry rate (new registrations as % of total)Enterprise surveys
Time dealing with gov’t officials (% of management time)Firms expected to give gifts in meetings w/tax officials (%)Firms using banks to finance investments (% of firms)Delay in obtaining an electrical connection (days)ISO certification ownership (% of firms)
Private sector investmentInvest. in infrastructure w/private participation ($ millions)Private foreign direct investment, net (% of GDP)Gross fixed capital formation (% of GDP)Gross fixed private capital formation (% of GDP) Finance and bankingGovernment cash surplus or deficit (% of GDP)Government debt (% of GDP)Deposit money banks’ assets (% of GDP)Total financial system deposits (% of GDP)Bank capital to asset ratio (%)Bank nonperforming loans to total gross loans ratio (%)Domestic credit to the private sector (% of GDP)Real interest rate (%)Interest rate spread (percentage points) Infrastructure Paved roads (% of total roads)Electric power consumption (kWh per capita)Power outages in a typical month (number)Fixed line and mobile subscribers (per 100 people)Internet users (per 100 people)Cost of telephone call to U.S. ($ per 3 minutes)
42 2008 The Little Data Book on Private Sector Development
3.8 3.9 2,2761.9 2.0 1,209
.. .. 5.71,520 3,230 2,038
24.9 5.1 7.611.0 10.4 11.923.9 24.7 43.510.5 11.9 26.765.1 64.9 44.6
.. ..2.1 1.6
29.6 25.3 40.477.9 47.0 36.4
.. 105.. 54 53.. 12 10.. 31.0 50.2.. 3.3 3.3.. 44.1 45.8.. 30.. 4.1 7.6 .. 4.3
60.5 69.714.3 17.5
6.6 7.3.. 14.5 .. 861 38,154
2.7 3.5 3.021.2 20.5 33.510.0 14.6 10.9
.. 2.9 –0.9.. .. .... .. 87.8.. .. 43.1
20.1 13.8 10.79.9 4.0 4.0
38.5 48.4 81.310.5 1.415.8 4.3 7.2
52.3 52.3 65.82,011 2,316 1,502
.. ..23 73 601.1 24.2 11.4
2.96 3.62 2.08
Country data
Lower middle-income group
2000 2006 2006
Europe & Central Asia Lower middle income
Bosnia and Herzegovina

Economic and social contextPopulation (millions)Labor force (millions)Unemployment rate (% of labor force)GNI per capita, World Bank Atlas method ($)GDP growth, 1995–2000 and 2000–06 (average annual %)Agriculture value added (% of GDP)Industry value added (% of GDP)
Manufacturing value added (% of GDP)Services value added (% of GDP)Inflation (annual % change in consumer price index)Exchange rate (local currency units per $)Exports of goods and services (% of GDP)Imports of goods and services (% of GDP) Business environmentEase of doing business (ranking 1-178; 1=best)Time to start a business (days)Procedures to start a business (number)Firing cost (weeks of wages)Closing a business (years to resolve insolvency)Total tax rate (% of profit)Highest marginal tax rate, corporate (%)Business entry rate (new registrations as % of total)Enterprise surveys
Time dealing with gov’t officials (% of management time)Firms expected to give gifts in meetings w/tax officials (%)Firms using banks to finance investments (% of firms)Delay in obtaining an electrical connection (days)ISO certification ownership (% of firms)
Private sector investmentInvest. in infrastructure w/private participation ($ millions)Private foreign direct investment, net (% of GDP)Gross fixed capital formation (% of GDP)Gross fixed private capital formation (% of GDP) Finance and bankingGovernment cash surplus or deficit (% of GDP)Government debt (% of GDP)Deposit money banks’ assets (% of GDP)Total financial system deposits (% of GDP)Bank capital to asset ratio (%)Bank nonperforming loans to total gross loans ratio (%)Domestic credit to the private sector (% of GDP)Real interest rate (%)Interest rate spread (percentage points) Infrastructure Paved roads (% of total roads)Electric power consumption (kWh per capita)Power outages in a typical month (number)Fixed line and mobile subscribers (per 100 people)Internet users (per 100 people)Cost of telephone call to U.S. ($ per 3 minutes)
43The Little Data Book on Private Sector Development 2008
Sub-Saharan Africa Upper middle income
Country data
Upper middle-income group
2000 2006 2006
1.7 1.9 811
0.63 0.69 37415.9 23.8 9.8
3,310 5,570 5,9138.7 5.1 3.92.4 2.0 5.7
58.9 53.1 32.44.4 3.6 19.4
38.6 44.9 62.08.6 11.65.1 5.8
52.6 55.2 32.733.7 28.6 30.3
.. 51.. 108 41.. 11 9.. 90.0 39.7.. 1.7 2.9.. 17.2 44.5
15 159.6 9.2 9.1
.. 5.0.. 4.5.. 11.3.. 25.5.. 12.7
17 18 45,8690.9 4.6 3.5
21.7 17.8 19.911.6 9.1 ..
.. .. .... .. ..
15.8 20.4 52.923.9 33.2 41.410.3 9.7 9.8
1.7 2.8 3.213.8 19.6 41.4
3.1 2.66.1 7.6 5.9
35.3 33.2 ..921 1,406 3,131
.. 1.721 60 88
2.9 3.3 22.23.64 2.88 1.06
Botswana

Economic and social contextPopulation (millions)Labor force (millions)Unemployment rate (% of labor force)GNI per capita, World Bank Atlas method ($)GDP growth, 1995–2000 and 2000–06 (average annual %)Agriculture value added (% of GDP)Industry value added (% of GDP)
Manufacturing value added (% of GDP)Services value added (% of GDP)Inflation (annual % change in consumer price index)Exchange rate (local currency units per $)Exports of goods and services (% of GDP)Imports of goods and services (% of GDP) Business environmentEase of doing business (ranking 1-178; 1=best)Time to start a business (days)Procedures to start a business (number)Firing cost (weeks of wages)Closing a business (years to resolve insolvency)Total tax rate (% of profit)Highest marginal tax rate, corporate (%)Business entry rate (new registrations as % of total)Enterprise surveys
Time dealing with gov’t officials (% of management time)Firms expected to give gifts in meetings w/tax officials (%)Firms using banks to finance investments (% of firms)Delay in obtaining an electrical connection (days)ISO certification ownership (% of firms)
Private sector investmentInvest. in infrastructure w/private participation ($ millions)Private foreign direct investment, net (% of GDP)Gross fixed capital formation (% of GDP)Gross fixed private capital formation (% of GDP) Finance and bankingGovernment cash surplus or deficit (% of GDP)Government debt (% of GDP)Deposit money banks’ assets (% of GDP)Total financial system deposits (% of GDP)Bank capital to asset ratio (%)Bank nonperforming loans to total gross loans ratio (%)Domestic credit to the private sector (% of GDP)Real interest rate (%)Interest rate spread (percentage points) Infrastructure Paved roads (% of total roads)Electric power consumption (kWh per capita)Power outages in a typical month (number)Fixed line and mobile subscribers (per 100 people)Internet users (per 100 people)Cost of telephone call to U.S. ($ per 3 minutes)
44 2008 The Little Data Book on Private Sector Development
174.2 189.3 81183.6 93.1 374
9.3 8.9 9.83,870 4,710 5,913
1.7 3.0 3.95.6 5.1 5.7
27.7 30.9 32.417.2 18.4 19.466.7 64.0 62.0
7.0 4.21.8 2.2
10.0 14.7 32.711.7 11.7 30.3
.. 122.. 152 41.. 18 9.. 37.0 39.7.. 4.0 2.9.. 69.2 44.5
15 15.. .. 9.1 .. 7.2.. 9.9.. 22.9.. 23.9.. 19.1
21,075 9,835 45,8695.1 1.8 3.5
16.8 16.8 19.9.. .. ..
–0.8 .. .... .. ..
62.9 71.8 52.940.5 51.7 41.412.1 9.9 9.88.3 4.1 3.2
33.0 36.5 41.447.7 44.639.6 36.9 5.9
5.5 .. ..1,894 2,008 3,131
.. ..31 73 88
2.9 22.5 22.21.15 0.71 1.06
Country data
Upper middle-income group
2000 2006 2006
Latin America & Caribbean Upper middle income
Brazil

Economic and social contextPopulation (millions)Labor force (millions)Unemployment rate (% of labor force)GNI per capita, World Bank Atlas method ($)GDP growth, 1995–2000 and 2000–06 (average annual %)Agriculture value added (% of GDP)Industry value added (% of GDP)
Manufacturing value added (% of GDP)Services value added (% of GDP)Inflation (annual % change in consumer price index)Exchange rate (local currency units per $)Exports of goods and services (% of GDP)Imports of goods and services (% of GDP) Business environmentEase of doing business (ranking 1-178; 1=best)Time to start a business (days)Procedures to start a business (number)Firing cost (weeks of wages)Closing a business (years to resolve insolvency)Total tax rate (% of profit)Highest marginal tax rate, corporate (%)Business entry rate (new registrations as % of total)Enterprise surveys
Time dealing with gov’t officials (% of management time)Firms expected to give gifts in meetings w/tax officials (%)Firms using banks to finance investments (% of firms)Delay in obtaining an electrical connection (days)ISO certification ownership (% of firms)
Private sector investmentInvest. in infrastructure w/private participation ($ millions)Private foreign direct investment, net (% of GDP)Gross fixed capital formation (% of GDP)Gross fixed private capital formation (% of GDP) Finance and bankingGovernment cash surplus or deficit (% of GDP)Government debt (% of GDP)Deposit money banks’ assets (% of GDP)Total financial system deposits (% of GDP)Bank capital to asset ratio (%)Bank nonperforming loans to total gross loans ratio (%)Domestic credit to the private sector (% of GDP)Real interest rate (%)Interest rate spread (percentage points) Infrastructure Paved roads (% of total roads)Electric power consumption (kWh per capita)Power outages in a typical month (number)Fixed line and mobile subscribers (per 100 people)Internet users (per 100 people)Cost of telephone call to U.S. ($ per 3 minutes)
45The Little Data Book on Private Sector Development 2008
0.33 0.38 1,0310.15 0.17 504
.. .. 6.214,670 26,930 36,608
1.0 2.3 2.31.0 0.7 1.5
63.7 73.4 26.215.4 10.5 16.835.3 25.9 72.3
1.6 0.11.7 1.6
67.4 71.2 25.635.8 25.0 26.3
.. 78.. 116 22.. 18 7.. 4.0 34.9.. 2.5 2.0.. 37.4 41.5
30 30.. .. 10.1 .. .... .... .... .... .. .. .. 849.. .. 2.7
13.0 10.4 20.4.. .. .. .. .. –1.3.. .. 47.6
73.4 60.2 99.7105.4 82.5 ..
.. .. 6.2
.. .. 1.150.3 34.5 162.0
–18.2 –4.2.. 4.5 4.4
34.7 77.2 90.97,539 7,498 9,760
.. ..53 87 1439.0 43.3 59.3
.. .. 0.77
Country dataHigh-
income group
2000 2006 2006
High income
Brunei Darussalam
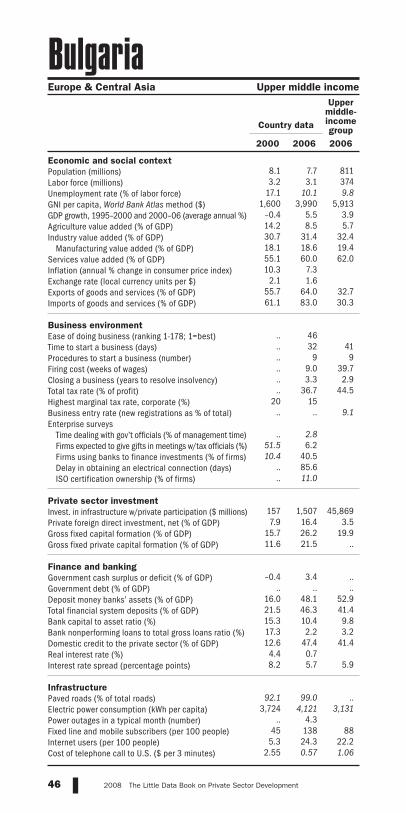
Economic and social contextPopulation (millions)Labor force (millions)Unemployment rate (% of labor force)GNI per capita, World Bank Atlas method ($)GDP growth, 1995–2000 and 2000–06 (average annual %)Agriculture value added (% of GDP)Industry value added (% of GDP)
Manufacturing value added (% of GDP)Services value added (% of GDP)Inflation (annual % change in consumer price index)Exchange rate (local currency units per $)Exports of goods and services (% of GDP)Imports of goods and services (% of GDP) Business environmentEase of doing business (ranking 1-178; 1=best)Time to start a business (days)Procedures to start a business (number)Firing cost (weeks of wages)Closing a business (years to resolve insolvency)Total tax rate (% of profit)Highest marginal tax rate, corporate (%)Business entry rate (new registrations as % of total)Enterprise surveys
Time dealing with gov’t officials (% of management time)Firms expected to give gifts in meetings w/tax officials (%)Firms using banks to finance investments (% of firms)Delay in obtaining an electrical connection (days)ISO certification ownership (% of firms)
Private sector investmentInvest. in infrastructure w/private participation ($ millions)Private foreign direct investment, net (% of GDP)Gross fixed capital formation (% of GDP)Gross fixed private capital formation (% of GDP) Finance and bankingGovernment cash surplus or deficit (% of GDP)Government debt (% of GDP)Deposit money banks’ assets (% of GDP)Total financial system deposits (% of GDP)Bank capital to asset ratio (%)Bank nonperforming loans to total gross loans ratio (%)Domestic credit to the private sector (% of GDP)Real interest rate (%)Interest rate spread (percentage points) Infrastructure Paved roads (% of total roads)Electric power consumption (kWh per capita)Power outages in a typical month (number)Fixed line and mobile subscribers (per 100 people)Internet users (per 100 people)Cost of telephone call to U.S. ($ per 3 minutes)
46 2008 The Little Data Book on Private Sector Development
8.1 7.7 8113.2 3.1 374
17.1 10.1 9.81,600 3,990 5,913
–0.4 5.5 3.914.2 8.5 5.730.7 31.4 32.418.1 18.6 19.455.1 60.0 62.010.3 7.3
2.1 1.655.7 64.0 32.761.1 83.0 30.3
.. 46.. 32 41.. 9 9.. 9.0 39.7.. 3.3 2.9.. 36.7 44.5
20 15.. .. 9.1 .. 2.8
51.5 6.210.4 40.5
.. 85.6
.. 11.0
157 1,507 45,8697.9 16.4 3.5
15.7 26.2 19.911.6 21.5 ..
–0.4 3.4 .... .. ..
16.0 48.1 52.921.5 46.3 41.415.3 10.4 9.817.3 2.2 3.212.6 47.4 41.44.4 0.78.2 5.7 5.9
92.1 99.0 ..3,724 4,121 3,131
.. 4.345 138 88
5.3 24.3 22.22.55 0.57 1.06
Country data
Upper middle-income group
2000 2006 2006
Europe & Central Asia Upper middle income
Bulgaria

Economic and social contextPopulation (millions)Labor force (millions)Unemployment rate (% of labor force)GNI per capita, World Bank Atlas method ($)GDP growth, 1995–2000 and 2000–06 (average annual %)Agriculture value added (% of GDP)Industry value added (% of GDP)
Manufacturing value added (% of GDP)Services value added (% of GDP)Inflation (annual % change in consumer price index)Exchange rate (local currency units per $)Exports of goods and services (% of GDP)Imports of goods and services (% of GDP) Business environmentEase of doing business (ranking 1-178; 1=best)Time to start a business (days)Procedures to start a business (number)Firing cost (weeks of wages)Closing a business (years to resolve insolvency)Total tax rate (% of profit)Highest marginal tax rate, corporate (%)Business entry rate (new registrations as % of total)Enterprise surveys
Time dealing with gov’t officials (% of management time)Firms expected to give gifts in meetings w/tax officials (%)Firms using banks to finance investments (% of firms)Delay in obtaining an electrical connection (days)ISO certification ownership (% of firms)
Private sector investmentInvest. in infrastructure w/private participation ($ millions)Private foreign direct investment, net (% of GDP)Gross fixed capital formation (% of GDP)Gross fixed private capital formation (% of GDP) Finance and bankingGovernment cash surplus or deficit (% of GDP)Government debt (% of GDP)Deposit money banks’ assets (% of GDP)Total financial system deposits (% of GDP)Bank capital to asset ratio (%)Bank nonperforming loans to total gross loans ratio (%)Domestic credit to the private sector (% of GDP)Real interest rate (%)Interest rate spread (percentage points) Infrastructure Paved roads (% of total roads)Electric power consumption (kWh per capita)Power outages in a typical month (number)Fixed line and mobile subscribers (per 100 people)Internet users (per 100 people)Cost of telephone call to U.S. ($ per 3 minutes)
47The Little Data Book on Private Sector Development 2008
11.9 14.4 2,4205.3 6.5 9952.4 .. ..
240 440 6496.8 6.2 6.5
27.5 30.7 20.423.1 20.6 27.715.3 12.6 15.844.1 40.9 51.9–0.3 2.3
712.0 522.99.1 10.8 26.7
25.2 25.1 30.1 .. 161.. 18 54.. 6 10.. 34.0 62.6.. 4.0 3.8.. 48.9 67.4.. .... .. 6.4 .. 9.5.. 19.5.. 23.1.. 19.6.. 7.4
27 290 29,7850.9 0.4 2.6
18.7 19.4 26.711.0 11.1 19.6
.. –5.7 –2.6.. .. ..
12.1 16.7 50.512.3 13.8 44.6
.. .. ..
.. .. ..11.7 16.7 38.3
.. ..
.. .. 11.3
16.0 4.2 .... .. 391.. 10.11 8 17
0.1 0.6 4.23.16 1.14 1.99
Country dataLow-
income group
2000 2006 2006
Sub-Saharan Africa Low income
Burkina Faso

Economic and social contextPopulation (millions)Labor force (millions)Unemployment rate (% of labor force)GNI per capita, World Bank Atlas method ($)GDP growth, 1995–2000 and 2000–06 (average annual %)Agriculture value added (% of GDP)Industry value added (% of GDP)
Manufacturing value added (% of GDP)Services value added (% of GDP)Inflation (annual % change in consumer price index)Exchange rate (local currency units per $)Exports of goods and services (% of GDP)Imports of goods and services (% of GDP) Business environmentEase of doing business (ranking 1-178; 1=best)Time to start a business (days)Procedures to start a business (number)Firing cost (weeks of wages)Closing a business (years to resolve insolvency)Total tax rate (% of profit)Highest marginal tax rate, corporate (%)Business entry rate (new registrations as % of total)Enterprise surveys
Time dealing with gov’t officials (% of management time)Firms expected to give gifts in meetings w/tax officials (%)Firms using banks to finance investments (% of firms)Delay in obtaining an electrical connection (days)ISO certification ownership (% of firms)
Private sector investmentInvest. in infrastructure w/private participation ($ millions)Private foreign direct investment, net (% of GDP)Gross fixed capital formation (% of GDP)Gross fixed private capital formation (% of GDP) Finance and bankingGovernment cash surplus or deficit (% of GDP)Government debt (% of GDP)Deposit money banks’ assets (% of GDP)Total financial system deposits (% of GDP)Bank capital to asset ratio (%)Bank nonperforming loans to total gross loans ratio (%)Domestic credit to the private sector (% of GDP)Real interest rate (%)Interest rate spread (percentage points) Infrastructure Paved roads (% of total roads)Electric power consumption (kWh per capita)Power outages in a typical month (number)Fixed line and mobile subscribers (per 100 people)Internet users (per 100 people)Cost of telephone call to U.S. ($ per 3 minutes)
48 2008 The Little Data Book on Private Sector Development
6.7 8.2 2,4203.2 4.2 995
.. .. ..120 100 649–0.7 2.5 6.540.4 34.8 20.418.8 20.0 27.7
8.7 8.8 15.840.8 45.1 51.924.3 2.8
720.7 1,028.47.8 10.9 26.7
19.9 47.8 30.1 .. 174.. 43 54.. 11 10.. 26.0 62.6.. 4.0 3.8.. 278.7 67.4.. .... .. 6.4 .. 5.7.. 22.6.. 12.3.. 24.1.. 7.1
36 6 29,7851.6 0.0 2.66.1 16.7 26.70.8 1.7 19.6
–2.4 .. –2.6162.6 .. ..18.7 21.2 50.512.6 20.5 44.6
.. .. ..
.. .. ..20.0 21.0 38.3
2.3 14.1.. .. 11.3
7.1 10.4 .... .. 391.. 12.01 2 17
0.1 0.7 4.27.35 2.45 1.99
Country dataLow-
income group
2000 2006 2006
Sub-Saharan Africa Low income
Burundi

Economic and social contextPopulation (millions)Labor force (millions)Unemployment rate (% of labor force)GNI per capita, World Bank Atlas method ($)GDP growth, 1995–2000 and 2000–06 (average annual %)Agriculture value added (% of GDP)Industry value added (% of GDP)
Manufacturing value added (% of GDP)Services value added (% of GDP)Inflation (annual % change in consumer price index)Exchange rate (local currency units per $)Exports of goods and services (% of GDP)Imports of goods and services (% of GDP) Business environmentEase of doing business (ranking 1-178; 1=best)Time to start a business (days)Procedures to start a business (number)Firing cost (weeks of wages)Closing a business (years to resolve insolvency)Total tax rate (% of profit)Highest marginal tax rate, corporate (%)Business entry rate (new registrations as % of total)Enterprise surveys
Time dealing with gov’t officials (% of management time)Firms expected to give gifts in meetings w/tax officials (%)Firms using banks to finance investments (% of firms)Delay in obtaining an electrical connection (days)ISO certification ownership (% of firms)
Private sector investmentInvest. in infrastructure w/private participation ($ millions)Private foreign direct investment, net (% of GDP)Gross fixed capital formation (% of GDP)Gross fixed private capital formation (% of GDP) Finance and bankingGovernment cash surplus or deficit (% of GDP)Government debt (% of GDP)Deposit money banks’ assets (% of GDP)Total financial system deposits (% of GDP)Bank capital to asset ratio (%)Bank nonperforming loans to total gross loans ratio (%)Domestic credit to the private sector (% of GDP)Real interest rate (%)Interest rate spread (percentage points) Infrastructure Paved roads (% of total roads)Electric power consumption (kWh per capita)Power outages in a typical month (number)Fixed line and mobile subscribers (per 100 people)Internet users (per 100 people)Cost of telephone call to U.S. ($ per 3 minutes)
49The Little Data Book on Private Sector Development 2008
East Asia & Pacific Low income
Country dataLow-
income group
2000 2006 2006
12.8 14.2 2,420
5.8 6.9 9952.5 .. ..
280 490 6497.3 9.5 6.5
35.9 30.1 20.421.9 26.2 27.716.0 18.6 15.842.2 43.7 51.9–0.8 4.7
3,840.8 4,103.349.8 68.8 26.761.8 75.8 30.1
.. 145.. 86 54.. 10 10.. 39.0 62.6.. .. 3.8.. 22.6 67.4
20 20.. .. 6.4 .. 8.6.. 42.0.. 6.8.. 7.6.. 2.8
28 250 29,7854.1 6.7 2.6
18.3 19.5 26.711.9 13.9 19.6
–3.4 –1.7 –2.6.. .. ..
5.9 10.0 50.58.1 15.2 44.6
.. .. ..
.. .. ..6.4 12.0 38.3
21.2 11.210.5 14.6 11.3
16.2 6.3 .... .. 391.. ..1 8 17
0.0 0.3 4.26.00 2.94 1.99
Cambodia
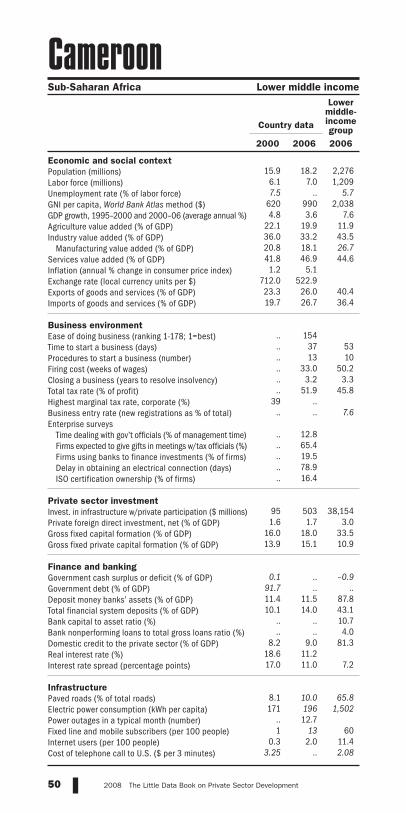
Economic and social contextPopulation (millions)Labor force (millions)Unemployment rate (% of labor force)GNI per capita, World Bank Atlas method ($)GDP growth, 1995–2000 and 2000–06 (average annual %)Agriculture value added (% of GDP)Industry value added (% of GDP)
Manufacturing value added (% of GDP)Services value added (% of GDP)Inflation (annual % change in consumer price index)Exchange rate (local currency units per $)Exports of goods and services (% of GDP)Imports of goods and services (% of GDP) Business environmentEase of doing business (ranking 1-178; 1=best)Time to start a business (days)Procedures to start a business (number)Firing cost (weeks of wages)Closing a business (years to resolve insolvency)Total tax rate (% of profit)Highest marginal tax rate, corporate (%)Business entry rate (new registrations as % of total)Enterprise surveys
Time dealing with gov’t officials (% of management time)Firms expected to give gifts in meetings w/tax officials (%)Firms using banks to finance investments (% of firms)Delay in obtaining an electrical connection (days)ISO certification ownership (% of firms)
Private sector investmentInvest. in infrastructure w/private participation ($ millions)Private foreign direct investment, net (% of GDP)Gross fixed capital formation (% of GDP)Gross fixed private capital formation (% of GDP) Finance and bankingGovernment cash surplus or deficit (% of GDP)Government debt (% of GDP)Deposit money banks’ assets (% of GDP)Total financial system deposits (% of GDP)Bank capital to asset ratio (%)Bank nonperforming loans to total gross loans ratio (%)Domestic credit to the private sector (% of GDP)Real interest rate (%)Interest rate spread (percentage points) Infrastructure Paved roads (% of total roads)Electric power consumption (kWh per capita)Power outages in a typical month (number)Fixed line and mobile subscribers (per 100 people)Internet users (per 100 people)Cost of telephone call to U.S. ($ per 3 minutes)
50 2008 The Little Data Book on Private Sector Development
15.9 18.2 2,276
6.1 7.0 1,2097.5 .. 5.7
620 990 2,0384.8 3.6 7.6
22.1 19.9 11.936.0 33.2 43.520.8 18.1 26.741.8 46.9 44.61.2 5.1
712.0 522.923.3 26.0 40.419.7 26.7 36.4
.. 154.. 37 53.. 13 10.. 33.0 50.2.. 3.2 3.3.. 51.9 45.8
39 .... .. 7.6 .. 12.8.. 65.4.. 19.5.. 78.9.. 16.4
95 503 38,1541.6 1.7 3.0
16.0 18.0 33.513.9 15.1 10.9
0.1 .. –0.991.7 .. ..11.4 11.5 87.810.1 14.0 43.1
.. .. 10.7
.. .. 4.08.2 9.0 81.3
18.6 11.217.0 11.0 7.2
8.1 10.0 65.8171 196 1,502
.. 12.71 13 60
0.3 2.0 11.43.25 .. 2.08
Country data
Lower middle-income group
2000 2006 2006
Sub-Saharan Africa Lower middle income
Cameroon
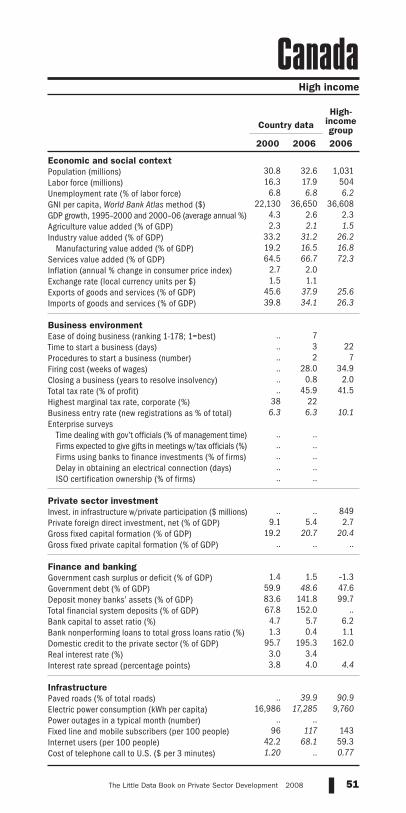
Economic and social contextPopulation (millions)Labor force (millions)Unemployment rate (% of labor force)GNI per capita, World Bank Atlas method ($)GDP growth, 1995–2000 and 2000–06 (average annual %)Agriculture value added (% of GDP)Industry value added (% of GDP)
Manufacturing value added (% of GDP)Services value added (% of GDP)Inflation (annual % change in consumer price index)Exchange rate (local currency units per $)Exports of goods and services (% of GDP)Imports of goods and services (% of GDP) Business environmentEase of doing business (ranking 1-178; 1=best)Time to start a business (days)Procedures to start a business (number)Firing cost (weeks of wages)Closing a business (years to resolve insolvency)Total tax rate (% of profit)Highest marginal tax rate, corporate (%)Business entry rate (new registrations as % of total)Enterprise surveys
Time dealing with gov’t officials (% of management time)Firms expected to give gifts in meetings w/tax officials (%)Firms using banks to finance investments (% of firms)Delay in obtaining an electrical connection (days)ISO certification ownership (% of firms)
Private sector investmentInvest. in infrastructure w/private participation ($ millions)Private foreign direct investment, net (% of GDP)Gross fixed capital formation (% of GDP)Gross fixed private capital formation (% of GDP) Finance and bankingGovernment cash surplus or deficit (% of GDP)Government debt (% of GDP)Deposit money banks’ assets (% of GDP)Total financial system deposits (% of GDP)Bank capital to asset ratio (%)Bank nonperforming loans to total gross loans ratio (%)Domestic credit to the private sector (% of GDP)Real interest rate (%)Interest rate spread (percentage points) Infrastructure Paved roads (% of total roads)Electric power consumption (kWh per capita)Power outages in a typical month (number)Fixed line and mobile subscribers (per 100 people)Internet users (per 100 people)Cost of telephone call to U.S. ($ per 3 minutes)
51The Little Data Book on Private Sector Development 2008
High income
Country dataHigh-
income group
2000 2006 2006
30.8 32.6 1,03116.3 17.9 5046.8 6.8 6.2
22,130 36,650 36,6084.3 2.6 2.32.3 2.1 1.5
33.2 31.2 26.219.2 16.5 16.864.5 66.7 72.3
2.7 2.01.5 1.1
45.6 37.9 25.639.8 34.1 26.3
.. 7.. 3 22.. 2 7.. 28.0 34.9.. 0.8 2.0.. 45.9 41.5
38 226.3 6.3 10.1
.. .... .... .... .... .. .. .. 849
9.1 5.4 2.719.2 20.7 20.4
.. .. ..
1.4 1.5 –1.359.9 48.6 47.683.6 141.8 99.767.8 152.0 ..4.7 5.7 6.21.3 0.4 1.1
95.7 195.3 162.03.0 3.43.8 4.0 4.4
.. 39.9 90.9
16,986 17,285 9,760.. ..
96 117 14342.2 68.1 59.31.20 .. 0.77
Canada
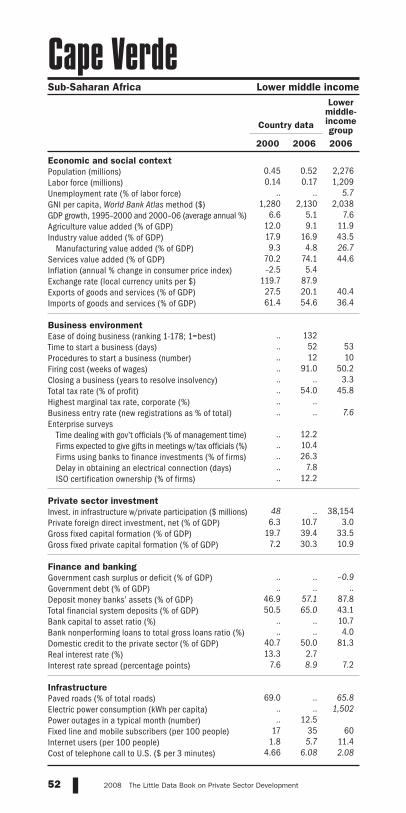
Economic and social contextPopulation (millions)Labor force (millions)Unemployment rate (% of labor force)GNI per capita, World Bank Atlas method ($)GDP growth, 1995–2000 and 2000–06 (average annual %)Agriculture value added (% of GDP)Industry value added (% of GDP)
Manufacturing value added (% of GDP)Services value added (% of GDP)Inflation (annual % change in consumer price index)Exchange rate (local currency units per $)Exports of goods and services (% of GDP)Imports of goods and services (% of GDP) Business environmentEase of doing business (ranking 1-178; 1=best)Time to start a business (days)Procedures to start a business (number)Firing cost (weeks of wages)Closing a business (years to resolve insolvency)Total tax rate (% of profit)Highest marginal tax rate, corporate (%)Business entry rate (new registrations as % of total)Enterprise surveys
Time dealing with gov’t officials (% of management time)Firms expected to give gifts in meetings w/tax officials (%)Firms using banks to finance investments (% of firms)Delay in obtaining an electrical connection (days)ISO certification ownership (% of firms)
Private sector investmentInvest. in infrastructure w/private participation ($ millions)Private foreign direct investment, net (% of GDP)Gross fixed capital formation (% of GDP)Gross fixed private capital formation (% of GDP) Finance and bankingGovernment cash surplus or deficit (% of GDP)Government debt (% of GDP)Deposit money banks’ assets (% of GDP)Total financial system deposits (% of GDP)Bank capital to asset ratio (%)Bank nonperforming loans to total gross loans ratio (%)Domestic credit to the private sector (% of GDP)Real interest rate (%)Interest rate spread (percentage points) Infrastructure Paved roads (% of total roads)Electric power consumption (kWh per capita)Power outages in a typical month (number)Fixed line and mobile subscribers (per 100 people)Internet users (per 100 people)Cost of telephone call to U.S. ($ per 3 minutes)
52 2008 The Little Data Book on Private Sector Development
0.45 0.52 2,2760.14 0.17 1,209
.. .. 5.71,280 2,130 2,038
6.6 5.1 7.612.0 9.1 11.917.9 16.9 43.59.3 4.8 26.7
70.2 74.1 44.6–2.5 5.4
119.7 87.927.5 20.1 40.461.4 54.6 36.4
.. 132.. 52 53.. 12 10.. 91.0 50.2.. .. 3.3.. 54.0 45.8.. .... .. 7.6 .. 12.2.. 10.4.. 26.3.. 7.8.. 12.2
48 .. 38,1546.3 10.7 3.0
19.7 39.4 33.57.2 30.3 10.9
.. .. –0.9.. .. ..
46.9 57.1 87.850.5 65.0 43.1
.. .. 10.7
.. .. 4.040.7 50.0 81.313.3 2.7
7.6 8.9 7.2
69.0 .. 65.8.. .. 1,502.. 12.5
17 35 601.8 5.7 11.4
4.66 6.08 2.08
Country data
Lower middle-income group
2000 2006 2006
Sub-Saharan Africa Lower middle income
Cape Verde

Economic and social contextPopulation (millions)Labor force (millions)Unemployment rate (% of labor force)GNI per capita, World Bank Atlas method ($)GDP growth, 1995–2000 and 2000–06 (average annual %)Agriculture value added (% of GDP)Industry value added (% of GDP)
Manufacturing value added (% of GDP)Services value added (% of GDP)Inflation (annual % change in consumer price index)Exchange rate (local currency units per $)Exports of goods and services (% of GDP)Imports of goods and services (% of GDP) Business environmentEase of doing business (ranking 1-178; 1=best)Time to start a business (days)Procedures to start a business (number)Firing cost (weeks of wages)Closing a business (years to resolve insolvency)Total tax rate (% of profit)Highest marginal tax rate, corporate (%)Business entry rate (new registrations as % of total)Enterprise surveys
Time dealing with gov’t officials (% of management time)Firms expected to give gifts in meetings w/tax officials (%)Firms using banks to finance investments (% of firms)Delay in obtaining an electrical connection (days)ISO certification ownership (% of firms)
Private sector investmentInvest. in infrastructure w/private participation ($ millions)Private foreign direct investment, net (% of GDP)Gross fixed capital formation (% of GDP)Gross fixed private capital formation (% of GDP) Finance and bankingGovernment cash surplus or deficit (% of GDP)Government debt (% of GDP)Deposit money banks’ assets (% of GDP)Total financial system deposits (% of GDP)Bank capital to asset ratio (%)Bank nonperforming loans to total gross loans ratio (%)Domestic credit to the private sector (% of GDP)Real interest rate (%)Interest rate spread (percentage points) Infrastructure Paved roads (% of total roads)Electric power consumption (kWh per capita)Power outages in a typical month (number)Fixed line and mobile subscribers (per 100 people)Internet users (per 100 people)Cost of telephone call to U.S. ($ per 3 minutes)
53The Little Data Book on Private Sector Development 2008
High income
Country dataHigh-
income group
2000 2006 2006
.. 0.05 1,031.. .. 504
4.1 .. 6.2.. .. 36,608.. .. 2.3.. .. 1.5.. .. 26.2.. .. 16.8.. .. 72.3.. ..
0.8 0.8.. .. 25.6.. .. 26.3 .. .... .. 22.. .. 7.. .. 34.9.. .. 2.0.. .. 41.5.. .... .. 10.1 .. .... .... .... .... .. .. .. 849.. .. 2.7.. .. 20.4.. .. .. .. .. –1.3.. .. 47.6.. .. 99.7.. .. .... .. 6.2.. .. 1.1.. .. 162.0.. .... .. 4.4 .. .. 90.9.. .. 9,760.. .... .. 143.. 45.7 59.3.. .. 0.77
Cayman Islands
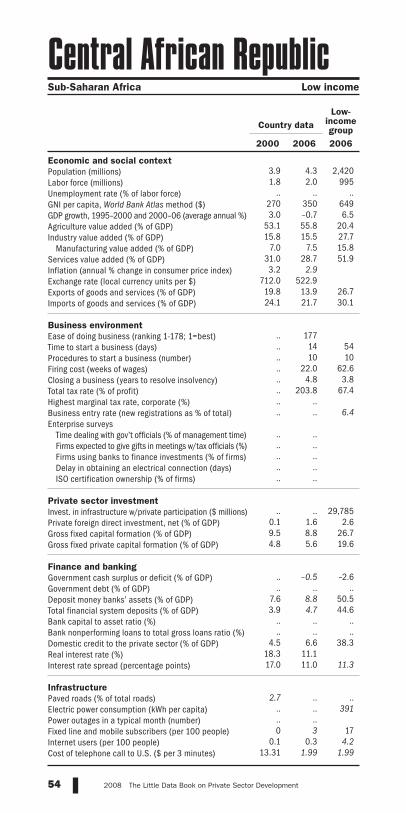
Economic and social contextPopulation (millions)Labor force (millions)Unemployment rate (% of labor force)GNI per capita, World Bank Atlas method ($)GDP growth, 1995–2000 and 2000–06 (average annual %)Agriculture value added (% of GDP)Industry value added (% of GDP)
Manufacturing value added (% of GDP)Services value added (% of GDP)Inflation (annual % change in consumer price index)Exchange rate (local currency units per $)Exports of goods and services (% of GDP)Imports of goods and services (% of GDP) Business environmentEase of doing business (ranking 1-178; 1=best)Time to start a business (days)Procedures to start a business (number)Firing cost (weeks of wages)Closing a business (years to resolve insolvency)Total tax rate (% of profit)Highest marginal tax rate, corporate (%)Business entry rate (new registrations as % of total)Enterprise surveys
Time dealing with gov’t officials (% of management time)Firms expected to give gifts in meetings w/tax officials (%)Firms using banks to finance investments (% of firms)Delay in obtaining an electrical connection (days)ISO certification ownership (% of firms)
Private sector investmentInvest. in infrastructure w/private participation ($ millions)Private foreign direct investment, net (% of GDP)Gross fixed capital formation (% of GDP)Gross fixed private capital formation (% of GDP) Finance and bankingGovernment cash surplus or deficit (% of GDP)Government debt (% of GDP)Deposit money banks’ assets (% of GDP)Total financial system deposits (% of GDP)Bank capital to asset ratio (%)Bank nonperforming loans to total gross loans ratio (%)Domestic credit to the private sector (% of GDP)Real interest rate (%)Interest rate spread (percentage points) Infrastructure Paved roads (% of total roads)Electric power consumption (kWh per capita)Power outages in a typical month (number)Fixed line and mobile subscribers (per 100 people)Internet users (per 100 people)Cost of telephone call to U.S. ($ per 3 minutes)
54 2008 The Little Data Book on Private Sector Development
3.9 4.3 2,4201.8 2.0 995
.. .. ..270 350 6493.0 –0.7 6.5
53.1 55.8 20.415.8 15.5 27.7
7.0 7.5 15.831.0 28.7 51.93.2 2.9
712.0 522.919.8 13.9 26.724.1 21.7 30.1
.. 177.. 14 54.. 10 10.. 22.0 62.6.. 4.8 3.8.. 203.8 67.4.. .... .. 6.4 .. .... .... .... .... .. .. .. 29,785
0.1 1.6 2.69.5 8.8 26.74.8 5.6 19.6
.. –0.5 –2.6.. .. ..
7.6 8.8 50.53.9 4.7 44.6
.. .. ..
.. .. ..4.5 6.6 38.3
18.3 11.117.0 11.0 11.3
2.7 .. .... .. 391.. ..0 3 17
0.1 0.3 4.213.31 1.99 1.99
Country dataLow-
income group
2000 2006 2006
Sub-Saharan Africa Low income
Central African Republic
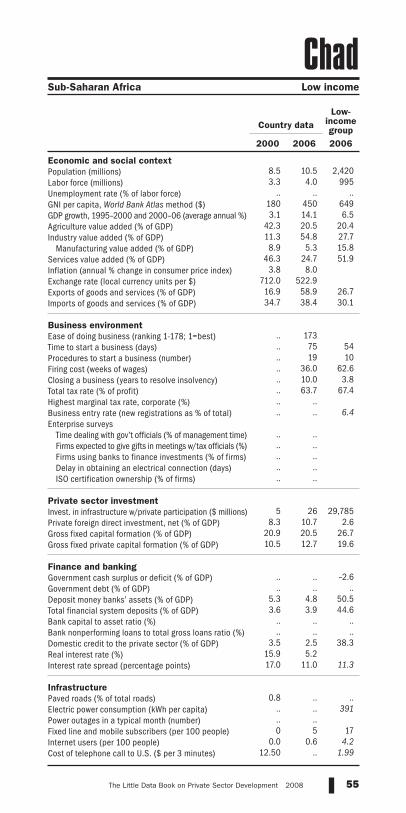
Economic and social contextPopulation (millions)Labor force (millions)Unemployment rate (% of labor force)GNI per capita, World Bank Atlas method ($)GDP growth, 1995–2000 and 2000–06 (average annual %)Agriculture value added (% of GDP)Industry value added (% of GDP)
Manufacturing value added (% of GDP)Services value added (% of GDP)Inflation (annual % change in consumer price index)Exchange rate (local currency units per $)Exports of goods and services (% of GDP)Imports of goods and services (% of GDP) Business environmentEase of doing business (ranking 1-178; 1=best)Time to start a business (days)Procedures to start a business (number)Firing cost (weeks of wages)Closing a business (years to resolve insolvency)Total tax rate (% of profit)Highest marginal tax rate, corporate (%)Business entry rate (new registrations as % of total)Enterprise surveys
Time dealing with gov’t officials (% of management time)Firms expected to give gifts in meetings w/tax officials (%)Firms using banks to finance investments (% of firms)Delay in obtaining an electrical connection (days)ISO certification ownership (% of firms)
Private sector investmentInvest. in infrastructure w/private participation ($ millions)Private foreign direct investment, net (% of GDP)Gross fixed capital formation (% of GDP)Gross fixed private capital formation (% of GDP) Finance and bankingGovernment cash surplus or deficit (% of GDP)Government debt (% of GDP)Deposit money banks’ assets (% of GDP)Total financial system deposits (% of GDP)Bank capital to asset ratio (%)Bank nonperforming loans to total gross loans ratio (%)Domestic credit to the private sector (% of GDP)Real interest rate (%)Interest rate spread (percentage points) Infrastructure Paved roads (% of total roads)Electric power consumption (kWh per capita)Power outages in a typical month (number)Fixed line and mobile subscribers (per 100 people)Internet users (per 100 people)Cost of telephone call to U.S. ($ per 3 minutes)
55The Little Data Book on Private Sector Development 2008
8.5 10.5 2,4203.3 4.0 995
.. .. ..180 450 6493.1 14.1 6.5
42.3 20.5 20.411.3 54.8 27.78.9 5.3 15.8
46.3 24.7 51.93.8 8.0
712.0 522.916.9 58.9 26.734.7 38.4 30.1
.. 173.. 75 54.. 19 10.. 36.0 62.6.. 10.0 3.8.. 63.7 67.4.. .... .. 6.4 .. .... .... .... .... .. 5 26 29,785
8.3 10.7 2.620.9 20.5 26.710.5 12.7 19.6
.. .. –2.6.. .. ..
5.3 4.8 50.53.6 3.9 44.6
.. .. ..
.. .. ..3.5 2.5 38.3
15.9 5.217.0 11.0 11.3
0.8 .. .... .. 391.. ..0 5 17
0.0 0.6 4.212.50 .. 1.99
Country dataLow-
income group
2000 2006 2006
Sub-Saharan Africa Low income
Chad
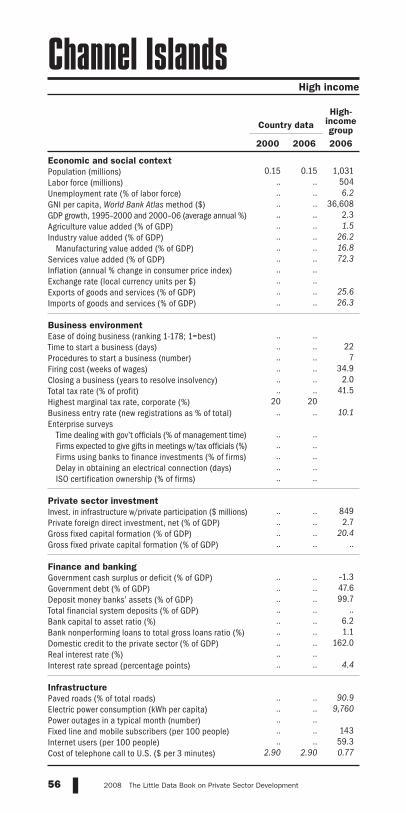
Economic and social contextPopulation (millions)Labor force (millions)Unemployment rate (% of labor force)GNI per capita, World Bank Atlas method ($)GDP growth, 1995–2000 and 2000–06 (average annual %)Agriculture value added (% of GDP)Industry value added (% of GDP)
Manufacturing value added (% of GDP)Services value added (% of GDP)Inflation (annual % change in consumer price index)Exchange rate (local currency units per $)Exports of goods and services (% of GDP)Imports of goods and services (% of GDP) Business environmentEase of doing business (ranking 1-178; 1=best)Time to start a business (days)Procedures to start a business (number)Firing cost (weeks of wages)Closing a business (years to resolve insolvency)Total tax rate (% of profit)Highest marginal tax rate, corporate (%)Business entry rate (new registrations as % of total)Enterprise surveys
Time dealing with gov’t officials (% of management time)Firms expected to give gifts in meetings w/tax officials (%)Firms using banks to finance investments (% of firms)Delay in obtaining an electrical connection (days)ISO certification ownership (% of firms)
Private sector investmentInvest. in infrastructure w/private participation ($ millions)Private foreign direct investment, net (% of GDP)Gross fixed capital formation (% of GDP)Gross fixed private capital formation (% of GDP) Finance and bankingGovernment cash surplus or deficit (% of GDP)Government debt (% of GDP)Deposit money banks’ assets (% of GDP)Total financial system deposits (% of GDP)Bank capital to asset ratio (%)Bank nonperforming loans to total gross loans ratio (%)Domestic credit to the private sector (% of GDP)Real interest rate (%)Interest rate spread (percentage points) Infrastructure Paved roads (% of total roads)Electric power consumption (kWh per capita)Power outages in a typical month (number)Fixed line and mobile subscribers (per 100 people)Internet users (per 100 people)Cost of telephone call to U.S. ($ per 3 minutes)
56 2008 The Little Data Book on Private Sector Development
0.15 0.15 1,031
.. .. 504
.. .. 6.2
.. .. 36,608
.. .. 2.3
.. .. 1.5
.. .. 26.2
.. .. 16.8
.. .. 72.3
.. ..
.. ..
.. .. 25.6
.. .. 26.3 .. .... .. 22.. .. 7.. .. 34.9.. .. 2.0.. .. 41.5
20 20.. .. 10.1 .. .... .... .... .... .. .. .. 849.. .. 2.7.. .. 20.4.. .. .. .. .. –1.3.. .. 47.6.. .. 99.7.. .. .... .. 6.2.. .. 1.1.. .. 162.0.. .... .. 4.4 .. .. 90.9.. .. 9,760.. .... .. 143.. .. 59.3
2.90 2.90 0.77
Country dataHigh-
income group
2000 2006 2006
High income
Channel Islands

Economic and social contextPopulation (millions)Labor force (millions)Unemployment rate (% of labor force)GNI per capita, World Bank Atlas method ($)GDP growth, 1995–2000 and 2000–06 (average annual %)Agriculture value added (% of GDP)Industry value added (% of GDP)
Manufacturing value added (% of GDP)Services value added (% of GDP)Inflation (annual % change in consumer price index)Exchange rate (local currency units per $)Exports of goods and services (% of GDP)Imports of goods and services (% of GDP) Business environmentEase of doing business (ranking 1-178; 1=best)Time to start a business (days)Procedures to start a business (number)Firing cost (weeks of wages)Closing a business (years to resolve insolvency)Total tax rate (% of profit)Highest marginal tax rate, corporate (%)Business entry rate (new registrations as % of total)Enterprise surveys
Time dealing with gov’t officials (% of management time)Firms expected to give gifts in meetings w/tax officials (%)Firms using banks to finance investments (% of firms)Delay in obtaining an electrical connection (days)ISO certification ownership (% of firms)
Private sector investmentInvest. in infrastructure w/private participation ($ millions)Private foreign direct investment, net (% of GDP)Gross fixed capital formation (% of GDP)Gross fixed private capital formation (% of GDP) Finance and bankingGovernment cash surplus or deficit (% of GDP)Government debt (% of GDP)Deposit money banks’ assets (% of GDP)Total financial system deposits (% of GDP)Bank capital to asset ratio (%)Bank nonperforming loans to total gross loans ratio (%)Domestic credit to the private sector (% of GDP)Real interest rate (%)Interest rate spread (percentage points) Infrastructure Paved roads (% of total roads)Electric power consumption (kWh per capita)Power outages in a typical month (number)Fixed line and mobile subscribers (per 100 people)Internet users (per 100 people)Cost of telephone call to U.S. ($ per 3 minutes)
57The Little Data Book on Private Sector Development 2008
Latin America & Caribbean Upper middle income
Country data
Upper middle-income group
2000 2006 2006
15.4 16.4 811
6.1 6.6 3748.3 6.9 9.8
4,850 6,810 5,9133.8 4.3 3.96.1 4.1 5.7
38.4 47.7 32.419.5 13.5 19.455.5 48.2 62.0
3.8 3.4539.6 530.3
31.6 45.4 32.729.7 30.9 30.3
.. 33.. 27 41.. 9 9.. 52.0 39.7.. 4.5 2.9.. 25.9 44.5
15 1716.6 18.2 9.1
.. 9.0.. 7.6.. 29.1.. 22.9.. 22.0
1,605 484 45,8696.4 5.5 3.5
20.7 19.3 19.9.. .. ..
–0.7 7.7 .... .. ..
60.5 63.0 52.948.7 46.6 41.4
7.5 6.8 9.81.7 0.8 3.2
73.6 82.4 41.49.8 –3.35.6 2.9 5.9
18.4 .. ..2,488 3,074 3,131
.. 2.143 96 88
16.5 25.3 22.22.45 .. 1.06
Chile

Economic and social contextPopulation (millions)Labor force (millions)Unemployment rate (% of labor force)GNI per capita, World Bank Atlas method ($)GDP growth, 1995–2000 and 2000–06 (average annual %)Agriculture value added (% of GDP)Industry value added (% of GDP)
Manufacturing value added (% of GDP)Services value added (% of GDP)Inflation (annual % change in consumer price index)Exchange rate (local currency units per $)Exports of goods and services (% of GDP)Imports of goods and services (% of GDP) Business environmentEase of doing business (ranking 1-178; 1=best)Time to start a business (days)Procedures to start a business (number)Firing cost (weeks of wages)Closing a business (years to resolve insolvency)Total tax rate (% of profit)Highest marginal tax rate, corporate (%)Business entry rate (new registrations as % of total)Enterprise surveys
Time dealing with gov’t officials (% of management time)Firms expected to give gifts in meetings w/tax officials (%)Firms using banks to finance investments (% of firms)Delay in obtaining an electrical connection (days)ISO certification ownership (% of firms)
Private sector investmentInvest. in infrastructure w/private participation ($ millions)Private foreign direct investment, net (% of GDP)Gross fixed capital formation (% of GDP)Gross fixed private capital formation (% of GDP) Finance and bankingGovernment cash surplus or deficit (% of GDP)Government debt (% of GDP)Deposit money banks’ assets (% of GDP)Total financial system deposits (% of GDP)Bank capital to asset ratio (%)Bank nonperforming loans to total gross loans ratio (%)Domestic credit to the private sector (% of GDP)Real interest rate (%)Interest rate spread (percentage points) Infrastructure Paved roads (% of total roads)Electric power consumption (kWh per capita)Power outages in a typical month (number)Fixed line and mobile subscribers (per 100 people)Internet users (per 100 people)Cost of telephone call to U.S. ($ per 3 minutes)
58 2008 The Little Data Book on Private Sector Development
1,262.6 1,311.8 2,276
738.3 780.5 1,2093.1 4.2 5.7
930 2,000 2,0388.5 9.8 7.6
14.8 11.7 11.945.9 48.4 43.532.1 33.5 26.739.3 39.9 44.6
0.3 1.58.3 8.0
23.3 40.1 40.420.9 32.2 36.4
.. 83.. 35 53.. 13 10.. 91.0 50.2.. 1.7 3.3.. 73.9 45.8
30 .... .. 7.6 .. 18.3.. 38.7.. 9.8.. 27.8.. 35.9
8,131 8,287 38,1543.2 3.0 3.0
34.1 42.8 33.510.5 6.7 10.9
–2.6 –1.6 –0.911.6 .. ..
114.7 111.9 87.836.2 41.4 43.1
4.1 6.1 10.722.4 7.5 4.0
112.3 113.6 81.33.7 2.43.6 3.6 7.2
78.3 81.6 65.8993 1,781 1,502
.. ..18 63 60
1.8 10.4 11.46.67 2.90 2.08
Country data
Lower middle-income group
2000 2006 2006
East Asia & Pacific Lower middle income
China

Economic and social contextPopulation (millions)Labor force (millions)Unemployment rate (% of labor force)GNI per capita, World Bank Atlas method ($)GDP growth, 1995–2000 and 2000–06 (average annual %)Agriculture value added (% of GDP)Industry value added (% of GDP)
Manufacturing value added (% of GDP)Services value added (% of GDP)Inflation (annual % change in consumer price index)Exchange rate (local currency units per $)Exports of goods and services (% of GDP)Imports of goods and services (% of GDP) Business environmentEase of doing business (ranking 1-178; 1=best)Time to start a business (days)Procedures to start a business (number)Firing cost (weeks of wages)Closing a business (years to resolve insolvency)Total tax rate (% of profit)Highest marginal tax rate, corporate (%)Business entry rate (new registrations as % of total)Enterprise surveys
Time dealing with gov’t officials (% of management time)Firms expected to give gifts in meetings w/tax officials (%)Firms using banks to finance investments (% of firms)Delay in obtaining an electrical connection (days)ISO certification ownership (% of firms)
Private sector investmentInvest. in infrastructure w/private participation ($ millions)Private foreign direct investment, net (% of GDP)Gross fixed capital formation (% of GDP)Gross fixed private capital formation (% of GDP) Finance and bankingGovernment cash surplus or deficit (% of GDP)Government debt (% of GDP)Deposit money banks’ assets (% of GDP)Total financial system deposits (% of GDP)Bank capital to asset ratio (%)Bank nonperforming loans to total gross loans ratio (%)Domestic credit to the private sector (% of GDP)Real interest rate (%)Interest rate spread (percentage points) Infrastructure Paved roads (% of total roads)Electric power consumption (kWh per capita)Power outages in a typical month (number)Fixed line and mobile subscribers (per 100 people)Internet users (per 100 people)Cost of telephone call to U.S. ($ per 3 minutes)
59The Little Data Book on Private Sector Development 2008
41.7 45.6 2,27619.3 22.8 1,20920.5 9.5 5.7
2,080 3,120 2,0380.6 3.9 7.6
12.9 12.0 11.930.3 35.6 43.515.8 16.7 26.756.7 52.4 44.69.2 4.3
2,087.9 2,361.121.5 22.4 40.419.4 24.9 36.4
.. 66.. 42 53.. 11 10.. 59.0 50.2.. 3.0 3.3.. 82.4 45.8
35 396.0 4.9 7.6
.. 14.3.. 1.1.. 30.6.. 27.2.. 5.9
1,032 2,808 38,1542.9 4.2 3.0
12.6 23.3 33.5.. .. 10.9
–7.0 –3.9 –0.9.. 68.0 ..
33.3 41.0 87.827.1 19.3 43.111.2 10.8 10.711.0 2.6 4.026.7 35.7 81.36.0 7.16.6 6.6 7.2
14.4 .. 65.8838 890 1,502
.. 1.023 83 602.1 14.7 11.4
2.00 .. 2.08
Country data
Lower middle-income group
2000 2006 2006
Latin America & Caribbean Lower middle income
Colombia

Economic and social contextPopulation (millions)Labor force (millions)Unemployment rate (% of labor force)GNI per capita, World Bank Atlas method ($)GDP growth, 1995–2000 and 2000–06 (average annual %)Agriculture value added (% of GDP)Industry value added (% of GDP)
Manufacturing value added (% of GDP)Services value added (% of GDP)Inflation (annual % change in consumer price index)Exchange rate (local currency units per $)Exports of goods and services (% of GDP)Imports of goods and services (% of GDP) Business environmentEase of doing business (ranking 1-178; 1=best)Time to start a business (days)Procedures to start a business (number)Firing cost (weeks of wages)Closing a business (years to resolve insolvency)Total tax rate (% of profit)Highest marginal tax rate, corporate (%)Business entry rate (new registrations as % of total)Enterprise surveys
Time dealing with gov’t officials (% of management time)Firms expected to give gifts in meetings w/tax officials (%)Firms using banks to finance investments (% of firms)Delay in obtaining an electrical connection (days)ISO certification ownership (% of firms)
Private sector investmentInvest. in infrastructure w/private participation ($ millions)Private foreign direct investment, net (% of GDP)Gross fixed capital formation (% of GDP)Gross fixed private capital formation (% of GDP) Finance and bankingGovernment cash surplus or deficit (% of GDP)Government debt (% of GDP)Deposit money banks’ assets (% of GDP)Total financial system deposits (% of GDP)Bank capital to asset ratio (%)Bank nonperforming loans to total gross loans ratio (%)Domestic credit to the private sector (% of GDP)Real interest rate (%)Interest rate spread (percentage points) Infrastructure Paved roads (% of total roads)Electric power consumption (kWh per capita)Power outages in a typical month (number)Fixed line and mobile subscribers (per 100 people)Internet users (per 100 people)Cost of telephone call to U.S. ($ per 3 minutes)
60 2008 The Little Data Book on Private Sector Development
0.54 0.61 2,4200.22 0.26 995
.. .. ..400 660 6491.7 2.4 6.5
48.6 45.2 20.411.5 11.8 27.74.5 4.2 15.8
39.9 38.0 51.9.. ..
534.0 392.216.7 11.7 26.732.5 35.5 30.1
.. 147.. 23 54.. 11 10.. 100.0 62.6.. .. 3.8.. 48.8 67.4.. .... .. 6.4 .. .... .... .... .... .. .. 0.5 29,785
0.0 0.2 2.610.1 9.8 26.76.2 4.9 19.6
.. .. –2.6.. .. .... .. 50.5.. .. 44.6.. .. .... .. ..
11.9 7.9 38.37.9 7.59.0 8.0 11.3
76.5 .. .... .. 391.. ..1 5 17
0.3 3.4 4.2.. .. 1.99
Sub-Saharan Africa Low income
Country dataLow-
income group
2000 2006 2006
Comoros

Economic and social contextPopulation (millions)Labor force (millions)Unemployment rate (% of labor force)GNI per capita, World Bank Atlas method ($)GDP growth, 1995–2000 and 2000–06 (average annual %)Agriculture value added (% of GDP)Industry value added (% of GDP)
Manufacturing value added (% of GDP)Services value added (% of GDP)Inflation (annual % change in consumer price index)Exchange rate (local currency units per $)Exports of goods and services (% of GDP)Imports of goods and services (% of GDP) Business environmentEase of doing business (ranking 1-178; 1=best)Time to start a business (days)Procedures to start a business (number)Firing cost (weeks of wages)Closing a business (years to resolve insolvency)Total tax rate (% of profit)Highest marginal tax rate, corporate (%)Business entry rate (new registrations as % of total)Enterprise surveys
Time dealing with gov’t officials (% of management time)Firms expected to give gifts in meetings w/tax officials (%)Firms using banks to finance investments (% of firms)Delay in obtaining an electrical connection (days)ISO certification ownership (% of firms)
Private sector investmentInvest. in infrastructure w/private participation ($ millions)Private foreign direct investment, net (% of GDP)Gross fixed capital formation (% of GDP)Gross fixed private capital formation (% of GDP) Finance and bankingGovernment cash surplus or deficit (% of GDP)Government debt (% of GDP)Deposit money banks’ assets (% of GDP)Total financial system deposits (% of GDP)Bank capital to asset ratio (%)Bank nonperforming loans to total gross loans ratio (%)Domestic credit to the private sector (% of GDP)Real interest rate (%)Interest rate spread (percentage points) Infrastructure Paved roads (% of total roads)Electric power consumption (kWh per capita)Power outages in a typical month (number)Fixed line and mobile subscribers (per 100 people)Internet users (per 100 people)Cost of telephone call to U.S. ($ per 3 minutes)
61The Little Data Book on Private Sector Development 2008
50.7 60.6 2,42020.2 24.2 995
.. .. ..80 130 649
–3.8 4.7 6.550.0 45.7 20.420.3 27.7 27.7
4.8 6.5 15.829.7 26.6 51.9
550.0 21.321.8 468.322.4 29.5 26.721.4 41.0 30.1
.. 178.. 155 54.. 13 10.. 31.0 62.6.. 5.2 3.8.. 229.8 67.4
40 40.. .. 6.4 .. 6.3.. 64.4.. 3.3.. 20.5.. 4.3
41 74 29,7853.9 2.1 2.63.5 12.8 26.73.0 10.0 19.6
–4.0 .. –2.6152.2 .. ..
0.6 1.7 50.51.7 3.1 44.6
.. .. ..
.. .. ..0.7 2.9 38.3
–57.0 .... .. 11.3 .. 1.8 ..
89 91 391.. 17.80 7 17
0.0 0.3 4.2.. .. 1.99
Country dataLow-
income group
2000 2006 2006
Sub-Saharan Africa Low income
Congo, Dem. Rep.

Economic and social contextPopulation (millions)Labor force (millions)Unemployment rate (% of labor force)GNI per capita, World Bank Atlas method ($)GDP growth, 1995–2000 and 2000–06 (average annual %)Agriculture value added (% of GDP)Industry value added (% of GDP)
Manufacturing value added (% of GDP)Services value added (% of GDP)Inflation (annual % change in consumer price index)Exchange rate (local currency units per $)Exports of goods and services (% of GDP)Imports of goods and services (% of GDP) Business environmentEase of doing business (ranking 1-178; 1=best)Time to start a business (days)Procedures to start a business (number)Firing cost (weeks of wages)Closing a business (years to resolve insolvency)Total tax rate (% of profit)Highest marginal tax rate, corporate (%)Business entry rate (new registrations as % of total)Enterprise surveys
Time dealing with gov’t officials (% of management time)Firms expected to give gifts in meetings w/tax officials (%)Firms using banks to finance investments (% of firms)Delay in obtaining an electrical connection (days)ISO certification ownership (% of firms)
Private sector investmentInvest. in infrastructure w/private participation ($ millions)Private foreign direct investment, net (% of GDP)Gross fixed capital formation (% of GDP)Gross fixed private capital formation (% of GDP) Finance and bankingGovernment cash surplus or deficit (% of GDP)Government debt (% of GDP)Deposit money banks’ assets (% of GDP)Total financial system deposits (% of GDP)Bank capital to asset ratio (%)Bank nonperforming loans to total gross loans ratio (%)Domestic credit to the private sector (% of GDP)Real interest rate (%)Interest rate spread (percentage points) Infrastructure Paved roads (% of total roads)Electric power consumption (kWh per capita)Power outages in a typical month (number)Fixed line and mobile subscribers (per 100 people)Internet users (per 100 people)Cost of telephone call to U.S. ($ per 3 minutes)
62 2008 The Little Data Book on Private Sector Development
3.2 3.7 2,2761.4 1.5 1,209
.. .. 5.7550 1,050 2,0381.9 4.4 7.65.3 4.2 11.9
72.2 73.5 43.53.5 4.9 26.7
22.5 22.3 44.6–0.8 3.4
712.0 522.980.3 91.0 40.443.6 46.0 36.4
.. 175.. 37 53.. 10 10.. 33.0 50.2.. 3.0 3.3.. 65.4 45.8
45 ..8.7 6.3 7.6
.. .... .... .... .... ..
35 10 38,1545.2 4.7 3.0
20.9 23.5 33.514.0 14.5 10.9
–1.3 6.4 –0.9.. 0.2 ..
7.2 3.4 87.86.4 6.5 43.1
.. .. 10.7
.. .. 4.04.8 2.2 81.3
–17.0 0.117.0 11.0 7.2
9.7 5.0 65.8119 160 1,502
.. ..3 14 60
0.0 1.9 11.4.. 5.39 2.08
Country data
Lower middle-income group
2000 2006 2006
Sub-Saharan Africa Lower middle income
Congo, Rep.

Economic and social contextPopulation (millions)Labor force (millions)Unemployment rate (% of labor force)GNI per capita, World Bank Atlas method ($)GDP growth, 1995–2000 and 2000–06 (average annual %)Agriculture value added (% of GDP)Industry value added (% of GDP)
Manufacturing value added (% of GDP)Services value added (% of GDP)Inflation (annual % change in consumer price index)Exchange rate (local currency units per $)Exports of goods and services (% of GDP)Imports of goods and services (% of GDP) Business environmentEase of doing business (ranking 1-178; 1=best)Time to start a business (days)Procedures to start a business (number)Firing cost (weeks of wages)Closing a business (years to resolve insolvency)Total tax rate (% of profit)Highest marginal tax rate, corporate (%)Business entry rate (new registrations as % of total)Enterprise surveys
Time dealing with gov’t officials (% of management time)Firms expected to give gifts in meetings w/tax officials (%)Firms using banks to finance investments (% of firms)Delay in obtaining an electrical connection (days)ISO certification ownership (% of firms)
Private sector investmentInvest. in infrastructure w/private participation ($ millions)Private foreign direct investment, net (% of GDP)Gross fixed capital formation (% of GDP)Gross fixed private capital formation (% of GDP) Finance and bankingGovernment cash surplus or deficit (% of GDP)Government debt (% of GDP)Deposit money banks’ assets (% of GDP)Total financial system deposits (% of GDP)Bank capital to asset ratio (%)Bank nonperforming loans to total gross loans ratio (%)Domestic credit to the private sector (% of GDP)Real interest rate (%)Interest rate spread (percentage points) Infrastructure Paved roads (% of total roads)Electric power consumption (kWh per capita)Power outages in a typical month (number)Fixed line and mobile subscribers (per 100 people)Internet users (per 100 people)Cost of telephone call to U.S. ($ per 3 minutes)
63The Little Data Book on Private Sector Development 2008
Latin America & Caribbean Upper middle income
Country data
Upper middle-income group
2000 2006 2006
3.9 4.4 8111.6 2.0 3745.1 6.6 9.8
3,710 4,980 5,9135.7 4.8 3.99.5 8.8 5.7
32.1 29.4 32.425.3 21.8 19.458.5 61.8 62.011.0 11.5
308.2 511.348.6 49.6 32.745.8 55.9 30.3
.. 115.. 77 41.. 12 9.. 35.0 39.7.. 3.5 2.9.. 55.7 44.5
30 30.. 11.3 9.1 .. 9.6.. .... 9.3.. 48.6.. 10.5
161 123 45,8692.6 6.6 3.5
17.8 20.3 19.916.3 19.3 ..
.. 1.2 ..
36.2 .. ..24.7 40.3 52.912.1 20.9 41.410.8 10.2 9.83.5 1.5 3.2
24.0 39.1 41.416.7 11.011.5 12.4 5.9
22.0 24.4 ..1,518 1,719 3,131
.. ..28 64 88
5.8 27.6 22.21.93 .. 1.06
Costa Rica

Economic and social contextPopulation (millions)Labor force (millions)Unemployment rate (% of labor force)GNI per capita, World Bank Atlas method ($)GDP growth, 1995–2000 and 2000–06 (average annual %)Agriculture value added (% of GDP)Industry value added (% of GDP)
Manufacturing value added (% of GDP)Services value added (% of GDP)Inflation (annual % change in consumer price index)Exchange rate (local currency units per $)Exports of goods and services (% of GDP)Imports of goods and services (% of GDP) Business environmentEase of doing business (ranking 1-178; 1=best)Time to start a business (days)Procedures to start a business (number)Firing cost (weeks of wages)Closing a business (years to resolve insolvency)Total tax rate (% of profit)Highest marginal tax rate, corporate (%)Business entry rate (new registrations as % of total)Enterprise surveys
Time dealing with gov’t officials (% of management time)Firms expected to give gifts in meetings w/tax officials (%)Firms using banks to finance investments (% of firms)Delay in obtaining an electrical connection (days)ISO certification ownership (% of firms)
Private sector investmentInvest. in infrastructure w/private participation ($ millions)Private foreign direct investment, net (% of GDP)Gross fixed capital formation (% of GDP)Gross fixed private capital formation (% of GDP) Finance and bankingGovernment cash surplus or deficit (% of GDP)Government debt (% of GDP)Deposit money banks’ assets (% of GDP)Total financial system deposits (% of GDP)Bank capital to asset ratio (%)Bank nonperforming loans to total gross loans ratio (%)Domestic credit to the private sector (% of GDP)Real interest rate (%)Interest rate spread (percentage points) Infrastructure Paved roads (% of total roads)Electric power consumption (kWh per capita)Power outages in a typical month (number)Fixed line and mobile subscribers (per 100 people)Internet users (per 100 people)Cost of telephone call to U.S. ($ per 3 minutes)
64 2008 The Little Data Book on Private Sector Development
17.0 18.9 2,4206.3 7.1 9954.1 .. ..
630 880 6493.4 0.1 6.5
24.2 22.7 20.424.9 26.3 27.721.7 18.3 15.850.9 51.0 51.9
2.5 2.5712.0 522.940.4 51.3 26.733.3 41.0 30.1
.. 155.. 40 54.. 10 10.. 49.0 62.6.. 2.2 3.8.. 45.4 67.4
35 35.. .. 6.4 .. .... .... .... .... ..
215 13 29,7852.3 1.8 2.6
11.2 9.7 26.78.4 6.7 19.6
2.8 –1.4 –2.6105.2 107.9 ..
19.7 16.8 50.513.9 15.2 44.6
.. .. ..
.. .. ..15.5 14.1 38.3
.. ..
.. .. 11.3
9.7 8.1 ..168 170 391
.. ..4 23 17
0.2 1.6 4.26.07 2.25 1.99
Country dataLow-
income group
2000 2006 2006
Sub-Saharan Africa Low income
Côte d’Ivoire

Economic and social contextPopulation (millions)Labor force (millions)Unemployment rate (% of labor force)GNI per capita, World Bank Atlas method ($)GDP growth, 1995–2000 and 2000–06 (average annual %)Agriculture value added (% of GDP)Industry value added (% of GDP)
Manufacturing value added (% of GDP)Services value added (% of GDP)Inflation (annual % change in consumer price index)Exchange rate (local currency units per $)Exports of goods and services (% of GDP)Imports of goods and services (% of GDP) Business environmentEase of doing business (ranking 1-178; 1=best)Time to start a business (days)Procedures to start a business (number)Firing cost (weeks of wages)Closing a business (years to resolve insolvency)Total tax rate (% of profit)Highest marginal tax rate, corporate (%)Business entry rate (new registrations as % of total)Enterprise surveys
Time dealing with gov’t officials (% of management time)Firms expected to give gifts in meetings w/tax officials (%)Firms using banks to finance investments (% of firms)Delay in obtaining an electrical connection (days)ISO certification ownership (% of firms)
Private sector investmentInvest. in infrastructure w/private participation ($ millions)Private foreign direct investment, net (% of GDP)Gross fixed capital formation (% of GDP)Gross fixed private capital formation (% of GDP) Finance and bankingGovernment cash surplus or deficit (% of GDP)Government debt (% of GDP)Deposit money banks’ assets (% of GDP)Total financial system deposits (% of GDP)Bank capital to asset ratio (%)Bank nonperforming loans to total gross loans ratio (%)Domestic credit to the private sector (% of GDP)Real interest rate (%)Interest rate spread (percentage points) Infrastructure Paved roads (% of total roads)Electric power consumption (kWh per capita)Power outages in a typical month (number)Fixed line and mobile subscribers (per 100 people)Internet users (per 100 people)Cost of telephone call to U.S. ($ per 3 minutes)
65The Little Data Book on Private Sector Development 2008
4.5 4.4 8112.0 1.9 374
16.1 11.2 9.84,360 9,310 5,913
3.2 4.8 3.99.1 7.4 5.7
30.3 31.6 32.421.7 20.6 19.460.7 60.9 62.0
4.6 3.28.3 5.8
47.1 47.9 32.752.3 56.8 30.3
.. 97.. 40 41.. 8 9.. 39.0 39.7.. 3.1 2.9.. 32.5 44.5
35 205.5 7.7 9.1
.. 2.7
41.6 6.019.8 60.0
.. 42.6
.. 16.1
746 396 45,8695.9 7.9 3.5
21.8 29.8 19.918.6 23.8 ..
–6.2 –1.8 .... .. ..
47.4 77.8 52.936.4 62.6 41.411.9 10.3 9.89.5 5.2 3.2
37.4 68.7 41.47.0 6.38.3 8.2 5.9
85.4 89.0 ..2,792 3,475 3,131
.. 2.261 142 88
6.6 35.5 22.2.. .. 1.06
Country data
Upper middle-income group
2000 2006 2006
Europe & Central Asia Upper middle income
Croatia

Economic and social contextPopulation (millions)Labor force (millions)Unemployment rate (% of labor force)GNI per capita, World Bank Atlas method ($)GDP growth, 1995–2000 and 2000–06 (average annual %)Agriculture value added (% of GDP)Industry value added (% of GDP)
Manufacturing value added (% of GDP)Services value added (% of GDP)Inflation (annual % change in consumer price index)Exchange rate (local currency units per $)Exports of goods and services (% of GDP)Imports of goods and services (% of GDP) Business environmentEase of doing business (ranking 1-178; 1=best)Time to start a business (days)Procedures to start a business (number)Firing cost (weeks of wages)Closing a business (years to resolve insolvency)Total tax rate (% of profit)Highest marginal tax rate, corporate (%)Business entry rate (new registrations as % of total)Enterprise surveys
Time dealing with gov’t officials (% of management time)Firms expected to give gifts in meetings w/tax officials (%)Firms using banks to finance investments (% of firms)Delay in obtaining an electrical connection (days)ISO certification ownership (% of firms)
Private sector investmentInvest. in infrastructure w/private participation ($ millions)Private foreign direct investment, net (% of GDP)Gross fixed capital formation (% of GDP)Gross fixed private capital formation (% of GDP) Finance and bankingGovernment cash surplus or deficit (% of GDP)Government debt (% of GDP)Deposit money banks’ assets (% of GDP)Total financial system deposits (% of GDP)Bank capital to asset ratio (%)Bank nonperforming loans to total gross loans ratio (%)Domestic credit to the private sector (% of GDP)Real interest rate (%)Interest rate spread (percentage points) Infrastructure Paved roads (% of total roads)Electric power consumption (kWh per capita)Power outages in a typical month (number)Fixed line and mobile subscribers (per 100 people)Internet users (per 100 people)Cost of telephone call to U.S. ($ per 3 minutes)
66 2008 The Little Data Book on Private Sector Development
11.1 11.3 2,2765.2 5.3 1,2095.4 1.9 5.7
.. .. 2,0384.2 3.4 7.66.4 .. 11.9
47.5 .. 43.538.7 .. 26.746.1 .. 44.6
.. ..
.. ..16.0 .. 40.418.7 .. 36.4
.. .... .. 53.. .. 10.. .. 50.2.. .. 3.3.. .. 45.8.. .... .. 7.6 .. .... .... .... .... ..
600 .. 38,154.. .. 3.0
10.4 .. 33.5.. .. 10.9 .. .. –0.9.. .. .... .. 87.8.. .. 43.1.. .. 10.7.. .. 4.0.. .. 81.3.. .... .. 7.2
49.0 .. 65.81,136 1,152 1,502
.. ..4 10 60
0.5 2.1 11.47.35 7.49 2.08
Country data
Lower middle-income group
2000 2006 2006
Latin America & Caribbean Lower middle income
Cuba

Economic and social contextPopulation (millions)Labor force (millions)Unemployment rate (% of labor force)GNI per capita, World Bank Atlas method ($)GDP growth, 1995–2000 and 2000–06 (average annual %)Agriculture value added (% of GDP)Industry value added (% of GDP)
Manufacturing value added (% of GDP)Services value added (% of GDP)Inflation (annual % change in consumer price index)Exchange rate (local currency units per $)Exports of goods and services (% of GDP)Imports of goods and services (% of GDP) Business environmentEase of doing business (ranking 1-178; 1=best)Time to start a business (days)Procedures to start a business (number)Firing cost (weeks of wages)Closing a business (years to resolve insolvency)Total tax rate (% of profit)Highest marginal tax rate, corporate (%)Business entry rate (new registrations as % of total)Enterprise surveys
Time dealing with gov’t officials (% of management time)Firms expected to give gifts in meetings w/tax officials (%)Firms using banks to finance investments (% of firms)Delay in obtaining an electrical connection (days)ISO certification ownership (% of firms)
Private sector investmentInvest. in infrastructure w/private participation ($ millions)Private foreign direct investment, net (% of GDP)Gross fixed capital formation (% of GDP)Gross fixed private capital formation (% of GDP) Finance and bankingGovernment cash surplus or deficit (% of GDP)Government debt (% of GDP)Deposit money banks’ assets (% of GDP)Total financial system deposits (% of GDP)Bank capital to asset ratio (%)Bank nonperforming loans to total gross loans ratio (%)Domestic credit to the private sector (% of GDP)Real interest rate (%)Interest rate spread (percentage points) Infrastructure Paved roads (% of total roads)Electric power consumption (kWh per capita)Power outages in a typical month (number)Fixed line and mobile subscribers (per 100 people)Internet users (per 100 people)Cost of telephone call to U.S. ($ per 3 minutes)
67The Little Data Book on Private Sector Development 2008
0.69 0.77 1,0310.33 0.38 504
4.8 5.3 6.213,440 23,270 36,608
3.9 3.2 2.3.. .. 1.5.. .. 26.2.. .. 16.8.. .. 72.3
4.1 2.50.6 0.5
42.1 .. 25.645.7 .. 26.3
.. .... .. 22.. .. 7.. .. 34.9.. .. 2.0.. .. 41.5
25 107.8 10.5 10.1
.. .... .... .... .... .. .. .. 849
9.2 8.3 2.717.2 .. 20.4
.. .. ..
–2.2 –1.1 –1.391.4 100.4 47.6
170.3 188.2 99.7153.3 176.7 ..
.. .. 6.2
.. .. 1.1208.8 221.2 162.0
4.0 3.81.5 3.3 4.4
60.6 63.0 90.94,585 5,560 9,760
.. ..95 154 143
17.3 46.2 59.31.02 0.33 0.77
Country dataHigh-
income group
2000 2006 2006
High income
Cyprus

Economic and social contextPopulation (millions)Labor force (millions)Unemployment rate (% of labor force)GNI per capita, World Bank Atlas method ($)GDP growth, 1995–2000 and 2000–06 (average annual %)Agriculture value added (% of GDP)Industry value added (% of GDP)
Manufacturing value added (% of GDP)Services value added (% of GDP)Inflation (annual % change in consumer price index)Exchange rate (local currency units per $)Exports of goods and services (% of GDP)Imports of goods and services (% of GDP) Business environmentEase of doing business (ranking 1-178; 1=best)Time to start a business (days)Procedures to start a business (number)Firing cost (weeks of wages)Closing a business (years to resolve insolvency)Total tax rate (% of profit)Highest marginal tax rate, corporate (%)Business entry rate (new registrations as % of total)Enterprise surveys
Time dealing with gov’t officials (% of management time)Firms expected to give gifts in meetings w/tax officials (%)Firms using banks to finance investments (% of firms)Delay in obtaining an electrical connection (days)ISO certification ownership (% of firms)
Private sector investmentInvest. in infrastructure w/private participation ($ millions)Private foreign direct investment, net (% of GDP)Gross fixed capital formation (% of GDP)Gross fixed private capital formation (% of GDP) Finance and bankingGovernment cash surplus or deficit (% of GDP)Government debt (% of GDP)Deposit money banks’ assets (% of GDP)Total financial system deposits (% of GDP)Bank capital to asset ratio (%)Bank nonperforming loans to total gross loans ratio (%)Domestic credit to the private sector (% of GDP)Real interest rate (%)Interest rate spread (percentage points) Infrastructure Paved roads (% of total roads)Electric power consumption (kWh per capita)Power outages in a typical month (number)Fixed line and mobile subscribers (per 100 people)Internet users (per 100 people)Cost of telephone call to U.S. ($ per 3 minutes)
68 2008 The Little Data Book on Private Sector Development
10.3 10.3 1,0315.2 5.2 5048.8 7.9 6.2
5,800 12,790 36,6081.0 4.1 2.33.9 2.7 1.5
38.1 39.0 26.226.8 27.1 16.858.0 58.3 72.3
3.9 2.538.6 22.663.4 75.8 25.666.4 72.6 26.3
.. 56.. 17 22.. 10 7.. 22.0 34.9.. 6.5 2.0.. 48.6 41.5
31 24.. 11.3 10.1 .. 2.1
32.9 37.314.2 11.4
.. 5.0
.. 12.5
1,462 488 8498.8 4.2 2.7
28.0 25.2 20.4.. .. ..
–3.6 –4.3 –1.313.7 24.6 47.653.9 51.3 99.754.2 59.7 ..
5.4 6.2 6.229.3 4.1 1.149.0 40.9 162.0
5.6 3.53.7 4.4 4.4
100.0 100.0 90.95,694 6,343 9,760
.. ..80 147 1439.7 34.5 59.3
0.97 1.06 0.77
Country dataHigh-
income group
2000 2006 2006
High income
Czech Republic

Economic and social contextPopulation (millions)Labor force (millions)Unemployment rate (% of labor force)GNI per capita, World Bank Atlas method ($)GDP growth, 1995–2000 and 2000–06 (average annual %)Agriculture value added (% of GDP)Industry value added (% of GDP)
Manufacturing value added (% of GDP)Services value added (% of GDP)Inflation (annual % change in consumer price index)Exchange rate (local currency units per $)Exports of goods and services (% of GDP)Imports of goods and services (% of GDP) Business environmentEase of doing business (ranking 1-178; 1=best)Time to start a business (days)Procedures to start a business (number)Firing cost (weeks of wages)Closing a business (years to resolve insolvency)Total tax rate (% of profit)Highest marginal tax rate, corporate (%)Business entry rate (new registrations as % of total)Enterprise surveys
Time dealing with gov’t officials (% of management time)Firms expected to give gifts in meetings w/tax officials (%)Firms using banks to finance investments (% of firms)Delay in obtaining an electrical connection (days)ISO certification ownership (% of firms)
Private sector investmentInvest. in infrastructure w/private participation ($ millions)Private foreign direct investment, net (% of GDP)Gross fixed capital formation (% of GDP)Gross fixed private capital formation (% of GDP) Finance and bankingGovernment cash surplus or deficit (% of GDP)Government debt (% of GDP)Deposit money banks’ assets (% of GDP)Total financial system deposits (% of GDP)Bank capital to asset ratio (%)Bank nonperforming loans to total gross loans ratio (%)Domestic credit to the private sector (% of GDP)Real interest rate (%)Interest rate spread (percentage points) Infrastructure Paved roads (% of total roads)Electric power consumption (kWh per capita)Power outages in a typical month (number)Fixed line and mobile subscribers (per 100 people)Internet users (per 100 people)Cost of telephone call to U.S. ($ per 3 minutes)
69The Little Data Book on Private Sector Development 2008
High income
Country dataHigh-
income group
2000 2006 2006
5.3 5.4 1,0312.9 2.8 5044.5 4.8 6.2
31,850 52,110 36,6082.8 1.6 2.32.6 1.6 1.5
26.8 26.0 26.216.2 14.2 16.870.6 72.4 72.32.9 1.98.1 5.9
46.6 51.9 25.640.6 49.0 26.3
.. 5.. 6 22.. 4 7.. 10.0 34.9.. 1.1 2.0.. 33.3 41.5
30 288.1 14.1 10.1
.. .... .... .... .... .. .. .. 849
22.5 1.2 2.720.2 22.1 20.4
.. .. ..
1.7 5.1 –1.350.1 29.0 47.691.8 183.0 99.748.1 58.0 ..
6.2 6.2 6.20.7 0.4 1.1
135.3 185.1 162.04.9 ..4.9 .. 4.4
100.0 100.0 90.96,484 6,663 9,760
.. ..135 164 143
39.2 58.3 59.31.30 0.89 0.77
Denmark
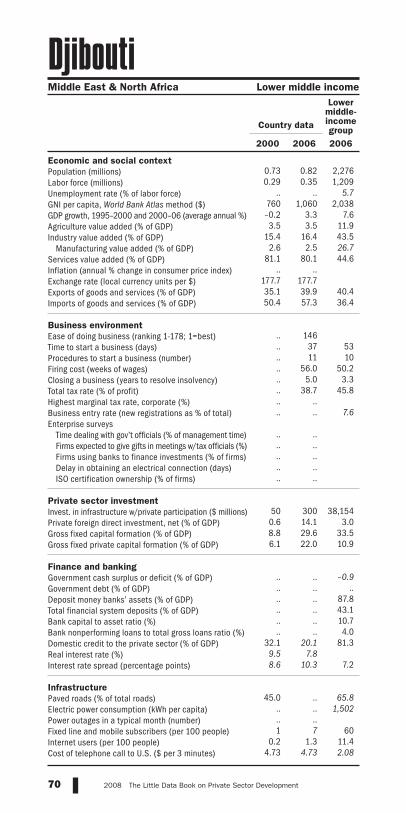
Economic and social contextPopulation (millions)Labor force (millions)Unemployment rate (% of labor force)GNI per capita, World Bank Atlas method ($)GDP growth, 1995–2000 and 2000–06 (average annual %)Agriculture value added (% of GDP)Industry value added (% of GDP)
Manufacturing value added (% of GDP)Services value added (% of GDP)Inflation (annual % change in consumer price index)Exchange rate (local currency units per $)Exports of goods and services (% of GDP)Imports of goods and services (% of GDP) Business environmentEase of doing business (ranking 1-178; 1=best)Time to start a business (days)Procedures to start a business (number)Firing cost (weeks of wages)Closing a business (years to resolve insolvency)Total tax rate (% of profit)Highest marginal tax rate, corporate (%)Business entry rate (new registrations as % of total)Enterprise surveys
Time dealing with gov’t officials (% of management time)Firms expected to give gifts in meetings w/tax officials (%)Firms using banks to finance investments (% of firms)Delay in obtaining an electrical connection (days)ISO certification ownership (% of firms)
Private sector investmentInvest. in infrastructure w/private participation ($ millions)Private foreign direct investment, net (% of GDP)Gross fixed capital formation (% of GDP)Gross fixed private capital formation (% of GDP) Finance and bankingGovernment cash surplus or deficit (% of GDP)Government debt (% of GDP)Deposit money banks’ assets (% of GDP)Total financial system deposits (% of GDP)Bank capital to asset ratio (%)Bank nonperforming loans to total gross loans ratio (%)Domestic credit to the private sector (% of GDP)Real interest rate (%)Interest rate spread (percentage points) Infrastructure Paved roads (% of total roads)Electric power consumption (kWh per capita)Power outages in a typical month (number)Fixed line and mobile subscribers (per 100 people)Internet users (per 100 people)Cost of telephone call to U.S. ($ per 3 minutes)
70 2008 The Little Data Book on Private Sector Development
0.73 0.82 2,2760.29 0.35 1,209
.. .. 5.7760 1,060 2,038–0.2 3.3 7.63.5 3.5 11.9
15.4 16.4 43.52.6 2.5 26.7
81.1 80.1 44.6.. ..
177.7 177.735.1 39.9 40.450.4 57.3 36.4
.. 146.. 37 53.. 11 10.. 56.0 50.2.. 5.0 3.3.. 38.7 45.8.. .... .. 7.6 .. .... .... .... .... ..
50 300 38,1540.6 14.1 3.08.8 29.6 33.56.1 22.0 10.9
.. .. –0.9.. .. .... .. 87.8.. .. 43.1.. .. 10.7.. .. 4.0
32.1 20.1 81.39.5 7.88.6 10.3 7.2
45.0 .. 65.8.. .. 1,502.. ..1 7 60
0.2 1.3 11.44.73 4.73 2.08
Country data
Lower middle-income group
2000 2006 2006
Middle East & North Africa Lower middle income
Djibouti

Economic and social contextPopulation (millions)Labor force (millions)Unemployment rate (% of labor force)GNI per capita, World Bank Atlas method ($)GDP growth, 1995–2000 and 2000–06 (average annual %)Agriculture value added (% of GDP)Industry value added (% of GDP)
Manufacturing value added (% of GDP)Services value added (% of GDP)Inflation (annual % change in consumer price index)Exchange rate (local currency units per $)Exports of goods and services (% of GDP)Imports of goods and services (% of GDP) Business environmentEase of doing business (ranking 1-178; 1=best)Time to start a business (days)Procedures to start a business (number)Firing cost (weeks of wages)Closing a business (years to resolve insolvency)Total tax rate (% of profit)Highest marginal tax rate, corporate (%)Business entry rate (new registrations as % of total)Enterprise surveys
Time dealing with gov’t officials (% of management time)Firms expected to give gifts in meetings w/tax officials (%)Firms using banks to finance investments (% of firms)Delay in obtaining an electrical connection (days)ISO certification ownership (% of firms)
Private sector investmentInvest. in infrastructure w/private participation ($ millions)Private foreign direct investment, net (% of GDP)Gross fixed capital formation (% of GDP)Gross fixed private capital formation (% of GDP) Finance and bankingGovernment cash surplus or deficit (% of GDP)Government debt (% of GDP)Deposit money banks’ assets (% of GDP)Total financial system deposits (% of GDP)Bank capital to asset ratio (%)Bank nonperforming loans to total gross loans ratio (%)Domestic credit to the private sector (% of GDP)Real interest rate (%)Interest rate spread (percentage points) Infrastructure Paved roads (% of total roads)Electric power consumption (kWh per capita)Power outages in a typical month (number)Fixed line and mobile subscribers (per 100 people)Internet users (per 100 people)Cost of telephone call to U.S. ($ per 3 minutes)
71The Little Data Book on Private Sector Development 2008
Latin America & Caribbean Upper middle income
Country data
Upper middle-income group
2000 2006 2006
0.07 0.07 811
.. .. 37410.9 .. 9.8
3,200 4,160 5,9132.2 5.3 3.9
18.1 18.5 5.723.4 23.8 32.48.8 8.1 19.4
58.4 57.7 62.00.9 2.42.7 2.7
53.3 41.9 32.767.5 65.2 30.3
.. 77.. 19 41.. 5 9.. 58.0 39.7.. .. 2.9.. 37.1 44.5.. .... .. 9.1 .. .... .... .... .... ..
19 2 45,8696.5 10.5 3.5
28.1 28.5 19.98.1 6.9 ..
.. .. .... .. ..
76.6 67.9 52.969.8 86.2 41.4
.. .. 9.8
.. .. 3.262.0 61.8 41.411.0 7.3
7.8 6.2 5.9
50.4 .. .... .. 3,131.. ..
34 88 888.4 36.1 22.2
.. .. 1.06
Dominica

Economic and social contextPopulation (millions)Labor force (millions)Unemployment rate (% of labor force)GNI per capita, World Bank Atlas method ($)GDP growth, 1995–2000 and 2000–06 (average annual %)Agriculture value added (% of GDP)Industry value added (% of GDP)
Manufacturing value added (% of GDP)Services value added (% of GDP)Inflation (annual % change in consumer price index)Exchange rate (local currency units per $)Exports of goods and services (% of GDP)Imports of goods and services (% of GDP) Business environmentEase of doing business (ranking 1-178; 1=best)Time to start a business (days)Procedures to start a business (number)Firing cost (weeks of wages)Closing a business (years to resolve insolvency)Total tax rate (% of profit)Highest marginal tax rate, corporate (%)Business entry rate (new registrations as % of total)Enterprise surveys
Time dealing with gov’t officials (% of management time)Firms expected to give gifts in meetings w/tax officials (%)Firms using banks to finance investments (% of firms)Delay in obtaining an electrical connection (days)ISO certification ownership (% of firms)
Private sector investmentInvest. in infrastructure w/private participation ($ millions)Private foreign direct investment, net (% of GDP)Gross fixed capital formation (% of GDP)Gross fixed private capital formation (% of GDP) Finance and bankingGovernment cash surplus or deficit (% of GDP)Government debt (% of GDP)Deposit money banks’ assets (% of GDP)Total financial system deposits (% of GDP)Bank capital to asset ratio (%)Bank nonperforming loans to total gross loans ratio (%)Domestic credit to the private sector (% of GDP)Real interest rate (%)Interest rate spread (percentage points) Infrastructure Paved roads (% of total roads)Electric power consumption (kWh per capita)Power outages in a typical month (number)Fixed line and mobile subscribers (per 100 people)Internet users (per 100 people)Cost of telephone call to U.S. ($ per 3 minutes)
72 2008 The Little Data Book on Private Sector Development
8.7 9.6 2,2763.6 4.1 1,209
13.9 17.9 5.72,050 2,910 2,038
7.8 3.9 7.611.1 12.1 11.933.9 26.2 43.516.8 14.0 26.754.6 61.8 44.6
7.7 7.616.4 33.444.9 33.5 40.454.9 40.0 36.4
.. 99.. 22 53.. 9 10.. 88.0 50.2.. 3.5 3.3.. 40.2 45.8
25 30.. .. 7.6 .. 8.8.. 17.3.. 3.6.. 30.2.. 9.6
1,076 281 38,1544.8 3.7 3.0
23.5 20.1 33.519.2 15.0 10.9
.. –1.2 –0.9
20.7 .. ..21.0 18.9 87.823.1 24.4 43.1
9.4 10.0 10.72.6 4.5 4.0
34.7 25.8 81.317.7 11.19.1 9.6 7.2
49.4 .. 65.8716 1,000 1,502
.. ..18 57 603.7 20.8 11.4
3.90 0.22 2.08
Country data
Lower middle-income group
2000 2006 2006
Latin America & Caribbean Lower middle income
Dominican Republic
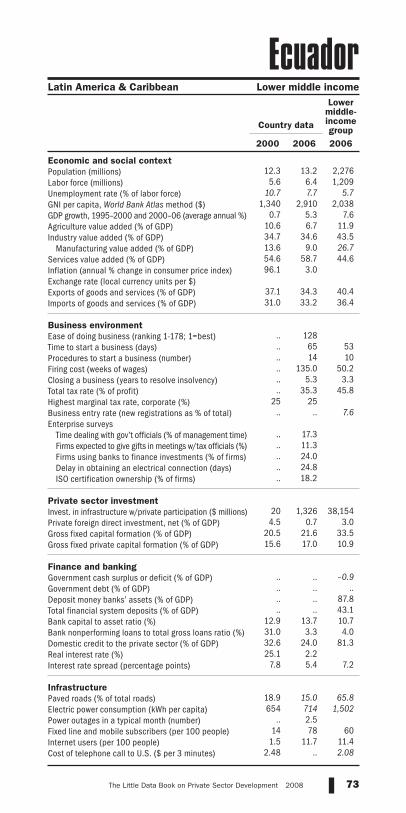
Economic and social contextPopulation (millions)Labor force (millions)Unemployment rate (% of labor force)GNI per capita, World Bank Atlas method ($)GDP growth, 1995–2000 and 2000–06 (average annual %)Agriculture value added (% of GDP)Industry value added (% of GDP)
Manufacturing value added (% of GDP)Services value added (% of GDP)Inflation (annual % change in consumer price index)Exchange rate (local currency units per $)Exports of goods and services (% of GDP)Imports of goods and services (% of GDP) Business environmentEase of doing business (ranking 1-178; 1=best)Time to start a business (days)Procedures to start a business (number)Firing cost (weeks of wages)Closing a business (years to resolve insolvency)Total tax rate (% of profit)Highest marginal tax rate, corporate (%)Business entry rate (new registrations as % of total)Enterprise surveys
Time dealing with gov’t officials (% of management time)Firms expected to give gifts in meetings w/tax officials (%)Firms using banks to finance investments (% of firms)Delay in obtaining an electrical connection (days)ISO certification ownership (% of firms)
Private sector investmentInvest. in infrastructure w/private participation ($ millions)Private foreign direct investment, net (% of GDP)Gross fixed capital formation (% of GDP)Gross fixed private capital formation (% of GDP) Finance and bankingGovernment cash surplus or deficit (% of GDP)Government debt (% of GDP)Deposit money banks’ assets (% of GDP)Total financial system deposits (% of GDP)Bank capital to asset ratio (%)Bank nonperforming loans to total gross loans ratio (%)Domestic credit to the private sector (% of GDP)Real interest rate (%)Interest rate spread (percentage points) Infrastructure Paved roads (% of total roads)Electric power consumption (kWh per capita)Power outages in a typical month (number)Fixed line and mobile subscribers (per 100 people)Internet users (per 100 people)Cost of telephone call to U.S. ($ per 3 minutes)
73The Little Data Book on Private Sector Development 2008
12.3 13.2 2,276
5.6 6.4 1,20910.7 7.7 5.7
1,340 2,910 2,0380.7 5.3 7.6
10.6 6.7 11.934.7 34.6 43.513.6 9.0 26.754.6 58.7 44.696.1 3.0
37.1 34.3 40.431.0 33.2 36.4
.. 128.. 65 53.. 14 10.. 135.0 50.2.. 5.3 3.3.. 35.3 45.8
25 25.. .. 7.6 .. 17.3.. 11.3.. 24.0.. 24.8.. 18.2
20 1,326 38,1544.5 0.7 3.0
20.5 21.6 33.515.6 17.0 10.9
.. .. –0.9.. .. .... .. 87.8.. .. 43.1
12.9 13.7 10.731.0 3.3 4.032.6 24.0 81.325.1 2.2
7.8 5.4 7.2
18.9 15.0 65.8654 714 1,502
.. 2.514 78 60
1.5 11.7 11.42.48 .. 2.08
Country data
Lower middle-income group
2000 2006 2006
Latin America & Caribbean Lower middle income
Ecuador

Economic and social contextPopulation (millions)Labor force (millions)Unemployment rate (% of labor force)GNI per capita, World Bank Atlas method ($)GDP growth, 1995–2000 and 2000–06 (average annual %)Agriculture value added (% of GDP)Industry value added (% of GDP)
Manufacturing value added (% of GDP)Services value added (% of GDP)Inflation (annual % change in consumer price index)Exchange rate (local currency units per $)Exports of goods and services (% of GDP)Imports of goods and services (% of GDP) Business environmentEase of doing business (ranking 1-178; 1=best)Time to start a business (days)Procedures to start a business (number)Firing cost (weeks of wages)Closing a business (years to resolve insolvency)Total tax rate (% of profit)Highest marginal tax rate, corporate (%)Business entry rate (new registrations as % of total)Enterprise surveys
Time dealing with gov’t officials (% of management time)Firms expected to give gifts in meetings w/tax officials (%)Firms using banks to finance investments (% of firms)Delay in obtaining an electrical connection (days)ISO certification ownership (% of firms)
Private sector investmentInvest. in infrastructure w/private participation ($ millions)Private foreign direct investment, net (% of GDP)Gross fixed capital formation (% of GDP)Gross fixed private capital formation (% of GDP) Finance and bankingGovernment cash surplus or deficit (% of GDP)Government debt (% of GDP)Deposit money banks’ assets (% of GDP)Total financial system deposits (% of GDP)Bank capital to asset ratio (%)Bank nonperforming loans to total gross loans ratio (%)Domestic credit to the private sector (% of GDP)Real interest rate (%)Interest rate spread (percentage points) Infrastructure Paved roads (% of total roads)Electric power consumption (kWh per capita)Power outages in a typical month (number)Fixed line and mobile subscribers (per 100 people)Internet users (per 100 people)Cost of telephone call to U.S. ($ per 3 minutes)
74 2008 The Little Data Book on Private Sector Development
66.5 74.2 2,27619.8 23.1 1,209
9.0 10.7 5.71,460 1,360 2,038
5.2 4.0 7.616.7 14.1 11.933.1 38.4 43.519.4 16.6 26.750.1 47.5 44.6
2.7 7.63.5 5.7
16.2 29.9 40.422.8 31.6 36.4
.. 126.. 9 53.. 7 10.. 132.0 50.2.. 4.2 3.3.. 47.9 45.8
40 40.. 2.6 7.6 .. .... 23.0.. 7.9.. 167.4.. 12.0
864 3,751 38,1541.2 9.3 3.0
18.9 18.7 33.59.1 11.4 10.9
–3.3 –5.8 –0.937.4 .. ..74.3 75.4 87.863.9 82.4 43.1
5.6 5.5 10.713.6 24.7 4.058.7 55.3 81.3
7.9 4.93.8 6.6 7.2
78.1 81.0 65.81,011 1,245 1,502
.. ..10 39 600.7 8.1 11.4
3.33 1.45 2.08
Country data
Lower middle-income group
2000 2006 2006
Middle East & North Africa Lower middle income
Egypt, Arab Rep.

Economic and social contextPopulation (millions)Labor force (millions)Unemployment rate (% of labor force)GNI per capita, World Bank Atlas method ($)GDP growth, 1995–2000 and 2000–06 (average annual %)Agriculture value added (% of GDP)Industry value added (% of GDP)
Manufacturing value added (% of GDP)Services value added (% of GDP)Inflation (annual % change in consumer price index)Exchange rate (local currency units per $)Exports of goods and services (% of GDP)Imports of goods and services (% of GDP) Business environmentEase of doing business (ranking 1-178; 1=best)Time to start a business (days)Procedures to start a business (number)Firing cost (weeks of wages)Closing a business (years to resolve insolvency)Total tax rate (% of profit)Highest marginal tax rate, corporate (%)Business entry rate (new registrations as % of total)Enterprise surveys
Time dealing with gov’t officials (% of management time)Firms expected to give gifts in meetings w/tax officials (%)Firms using banks to finance investments (% of firms)Delay in obtaining an electrical connection (days)ISO certification ownership (% of firms)
Private sector investmentInvest. in infrastructure w/private participation ($ millions)Private foreign direct investment, net (% of GDP)Gross fixed capital formation (% of GDP)Gross fixed private capital formation (% of GDP) Finance and bankingGovernment cash surplus or deficit (% of GDP)Government debt (% of GDP)Deposit money banks’ assets (% of GDP)Total financial system deposits (% of GDP)Bank capital to asset ratio (%)Bank nonperforming loans to total gross loans ratio (%)Domestic credit to the private sector (% of GDP)Real interest rate (%)Interest rate spread (percentage points) Infrastructure Paved roads (% of total roads)Electric power consumption (kWh per capita)Power outages in a typical month (number)Fixed line and mobile subscribers (per 100 people)Internet users (per 100 people)Cost of telephone call to U.S. ($ per 3 minutes)
75The Little Data Book on Private Sector Development 2008
6.2 6.8 2,2762.5 2.7 1,2096.8 6.6 5.7
2,030 2,680 2,0383.3 2.5 7.6
10.5 10.9 11.931.6 29.4 43.524.7 22.4 26.757.9 59.7 44.62.3 4.08.8 8.8
27.4 27.2 40.442.4 46.9 36.4
.. 69.. 26 53.. 9 10.. 86.0 50.2.. 4.0 3.3.. 33.8 45.8
25 .... 3.8 7.6 .. 9.2.. 2.6.. 17.3.. 22.1.. 11.0
277 172 38,1541.3 1.1 3.0
16.9 16.1 33.514.2 14.0 10.9
–4.7 –3.2 –0.955.3 43.3 ..
5.2 5.0 87.84.8 4.1 43.18.8 11.8 10.74.3 1.9 4.0
45.2 42.9 81.310.5 ..
4.6 .. 7.2
19.8 .. 65.8653 666 1,502
.. 2.822 72 601.1 9.6 11.4
2.40 2.40 2.08
Country data
Lower middle-income group
2000 2006 2006
Latin America & Caribbean Lower middle income
El Salvador

Economic and social contextPopulation (millions)Labor force (millions)Unemployment rate (% of labor force)GNI per capita, World Bank Atlas method ($)GDP growth, 1995–2000 and 2000–06 (average annual %)Agriculture value added (% of GDP)Industry value added (% of GDP)
Manufacturing value added (% of GDP)Services value added (% of GDP)Inflation (annual % change in consumer price index)Exchange rate (local currency units per $)Exports of goods and services (% of GDP)Imports of goods and services (% of GDP) Business environmentEase of doing business (ranking 1-178; 1=best)Time to start a business (days)Procedures to start a business (number)Firing cost (weeks of wages)Closing a business (years to resolve insolvency)Total tax rate (% of profit)Highest marginal tax rate, corporate (%)Business entry rate (new registrations as % of total)Enterprise surveys
Time dealing with gov’t officials (% of management time)Firms expected to give gifts in meetings w/tax officials (%)Firms using banks to finance investments (% of firms)Delay in obtaining an electrical connection (days)ISO certification ownership (% of firms)
Private sector investmentInvest. in infrastructure w/private participation ($ millions)Private foreign direct investment, net (% of GDP)Gross fixed capital formation (% of GDP)Gross fixed private capital formation (% of GDP) Finance and bankingGovernment cash surplus or deficit (% of GDP)Government debt (% of GDP)Deposit money banks’ assets (% of GDP)Total financial system deposits (% of GDP)Bank capital to asset ratio (%)Bank nonperforming loans to total gross loans ratio (%)Domestic credit to the private sector (% of GDP)Real interest rate (%)Interest rate spread (percentage points) Infrastructure Paved roads (% of total roads)Electric power consumption (kWh per capita)Power outages in a typical month (number)Fixed line and mobile subscribers (per 100 people)Internet users (per 100 people)Cost of telephone call to U.S. ($ per 3 minutes)
76 2008 The Little Data Book on Private Sector Development
0.43 0.50 8110.17 0.20 374
.. .. 9.81,540 8,510 5,913
36.0 19.4 3.99.8 2.7 5.7
85.9 94.3 32.41.4 8.6 19.44.2 3.0 62.04.8 4.2
712.0 522.998.6 94.5 32.785.4 50.1 30.3
.. 165.. 136 41.. 20 9.. 133.0 39.7.. .. 2.9.. 62.2 44.5.. .... .. 9.1 .. .... .... .... .... ..
23 72 45,8698.6 19.3 3.5
61.3 41.6 19.956.2 26.6 ..
.. .. .... .. ..
2.9 2.6 52.93.2 5.9 41.4
.. .. 9.8
.. .. 3.23.0 2.8 41.4
–16.8 –3.417.0 11.0 5.9
.. .. .... .. 3,131.. ..3 22 88
0.2 1.6 22.2.. .. 1.06
Country data
Upper middle-income group
2000 2006 2006
Sub-Saharan Africa Upper middle income
Equatorial Guinea

Economic and social contextPopulation (millions)Labor force (millions)Unemployment rate (% of labor force)GNI per capita, World Bank Atlas method ($)GDP growth, 1995–2000 and 2000–06 (average annual %)Agriculture value added (% of GDP)Industry value added (% of GDP)
Manufacturing value added (% of GDP)Services value added (% of GDP)Inflation (annual % change in consumer price index)Exchange rate (local currency units per $)Exports of goods and services (% of GDP)Imports of goods and services (% of GDP) Business environmentEase of doing business (ranking 1-178; 1=best)Time to start a business (days)Procedures to start a business (number)Firing cost (weeks of wages)Closing a business (years to resolve insolvency)Total tax rate (% of profit)Highest marginal tax rate, corporate (%)Business entry rate (new registrations as % of total)Enterprise surveys
Time dealing with gov’t officials (% of management time)Firms expected to give gifts in meetings w/tax officials (%)Firms using banks to finance investments (% of firms)Delay in obtaining an electrical connection (days)ISO certification ownership (% of firms)
Private sector investmentInvest. in infrastructure w/private participation ($ millions)Private foreign direct investment, net (% of GDP)Gross fixed capital formation (% of GDP)Gross fixed private capital formation (% of GDP) Finance and bankingGovernment cash surplus or deficit (% of GDP)Government debt (% of GDP)Deposit money banks’ assets (% of GDP)Total financial system deposits (% of GDP)Bank capital to asset ratio (%)Bank nonperforming loans to total gross loans ratio (%)Domestic credit to the private sector (% of GDP)Real interest rate (%)Interest rate spread (percentage points) Infrastructure Paved roads (% of total roads)Electric power consumption (kWh per capita)Power outages in a typical month (number)Fixed line and mobile subscribers (per 100 people)Internet users (per 100 people)Cost of telephone call to U.S. ($ per 3 minutes)
77The Little Data Book on Private Sector Development 2008
3.7 4.7 2,4201.5 2.0 995
.. .. ..170 190 6491.5 2.7 6.5
15.1 17.5 20.423.0 23.0 27.711.2 8.7 15.861.9 59.5 51.9
.. ..9.6 15.4
15.1 8.0 26.781.8 50.0 30.1
.. 171.. 84 54.. 13 10.. 69.0 62.6.. 1.7 3.8.. 84.5 67.4.. .... .. 6.4
3.8 .... ..
30.5 .... ..
6.6 ..
40 .. 29,7854.4 0.3 2.6
31.9 18.7 26.75.1 4.2 19.6
.. .. –2.6.. .. .... .. 50.5.. .. 44.6.. .. .... .. ..
32.5 29.0 38.3.. .... .. 11.3
21.8 .. .... .. 391.. ..1 2 17
0.1 2.1 4.25.83 3.59 1.99
Country dataLow-
income group
2000 2006 2006
Sub-Saharan Africa Low income
Eritrea

Economic and social contextPopulation (millions)Labor force (millions)Unemployment rate (% of labor force)GNI per capita, World Bank Atlas method ($)GDP growth, 1995–2000 and 2000–06 (average annual %)Agriculture value added (% of GDP)Industry value added (% of GDP)
Manufacturing value added (% of GDP)Services value added (% of GDP)Inflation (annual % change in consumer price index)Exchange rate (local currency units per $)Exports of goods and services (% of GDP)Imports of goods and services (% of GDP) Business environmentEase of doing business (ranking 1-178; 1=best)Time to start a business (days)Procedures to start a business (number)Firing cost (weeks of wages)Closing a business (years to resolve insolvency)Total tax rate (% of profit)Highest marginal tax rate, corporate (%)Business entry rate (new registrations as % of total)Enterprise surveys
Time dealing with gov’t officials (% of management time)Firms expected to give gifts in meetings w/tax officials (%)Firms using banks to finance investments (% of firms)Delay in obtaining an electrical connection (days)ISO certification ownership (% of firms)
Private sector investmentInvest. in infrastructure w/private participation ($ millions)Private foreign direct investment, net (% of GDP)Gross fixed capital formation (% of GDP)Gross fixed private capital formation (% of GDP) Finance and bankingGovernment cash surplus or deficit (% of GDP)Government debt (% of GDP)Deposit money banks’ assets (% of GDP)Total financial system deposits (% of GDP)Bank capital to asset ratio (%)Bank nonperforming loans to total gross loans ratio (%)Domestic credit to the private sector (% of GDP)Real interest rate (%)Interest rate spread (percentage points) Infrastructure Paved roads (% of total roads)Electric power consumption (kWh per capita)Power outages in a typical month (number)Fixed line and mobile subscribers (per 100 people)Internet users (per 100 people)Cost of telephone call to U.S. ($ per 3 minutes)
78 2008 The Little Data Book on Private Sector Development
1.4 1.3 1,031
0.67 0.66 50412.7 7.9 6.2
4,120 11,400 36,6085.4 8.6 2.34.9 3.2 1.5
27.8 29.1 26.217.8 16.8 16.867.3 67.8 72.34.0 4.4
17.0 12.585.4 79.8 25.689.0 89.5 26.3
.. 17.. 7 22.. 5 7.. 35.0 34.9.. 3.0 2.0.. 49.2 41.5
35 2311.1 13.4 10.1
.. 2.3
19.6 12.916.5 17.8
7.6 8.4.. 13.2
172 132 8496.9 9.7 2.7
26.0 33.8 20.420.6 .. ..
0.2 3.6 –1.36.9 7.0 47.6
23.6 64.3 99.724.7 41.1 ..12.6 8.4 6.2
1.0 0.2 1.123.3 78.4 162.0–0.8 –1.03.7 2.2 4.4
20.1 22.7 90.94,632 5,567 9,760
.. ..79 164 143
28.6 56.6 59.31.62 0.90 0.77
Country dataHigh-
income group
2000 2006 2006
High income
Estonia

Economic and social contextPopulation (millions)Labor force (millions)Unemployment rate (% of labor force)GNI per capita, World Bank Atlas method ($)GDP growth, 1995–2000 and 2000–06 (average annual %)Agriculture value added (% of GDP)Industry value added (% of GDP)
Manufacturing value added (% of GDP)Services value added (% of GDP)Inflation (annual % change in consumer price index)Exchange rate (local currency units per $)Exports of goods and services (% of GDP)Imports of goods and services (% of GDP) Business environmentEase of doing business (ranking 1-178; 1=best)Time to start a business (days)Procedures to start a business (number)Firing cost (weeks of wages)Closing a business (years to resolve insolvency)Total tax rate (% of profit)Highest marginal tax rate, corporate (%)Business entry rate (new registrations as % of total)Enterprise surveys
Time dealing with gov’t officials (% of management time)Firms expected to give gifts in meetings w/tax officials (%)Firms using banks to finance investments (% of firms)Delay in obtaining an electrical connection (days)ISO certification ownership (% of firms)
Private sector investmentInvest. in infrastructure w/private participation ($ millions)Private foreign direct investment, net (% of GDP)Gross fixed capital formation (% of GDP)Gross fixed private capital formation (% of GDP) Finance and bankingGovernment cash surplus or deficit (% of GDP)Government debt (% of GDP)Deposit money banks’ assets (% of GDP)Total financial system deposits (% of GDP)Bank capital to asset ratio (%)Bank nonperforming loans to total gross loans ratio (%)Domestic credit to the private sector (% of GDP)Real interest rate (%)Interest rate spread (percentage points) Infrastructure Paved roads (% of total roads)Electric power consumption (kWh per capita)Power outages in a typical month (number)Fixed line and mobile subscribers (per 100 people)Internet users (per 100 people)Cost of telephone call to U.S. ($ per 3 minutes)
79The Little Data Book on Private Sector Development 2008
Sub-Saharan Africa Low income
Country dataLow-
income group
2000 2006 2006
65.8 77.2 2,42029.0 34.4 995
.. 5.4 ..120 170 6493.7 5.7 6.5
47.4 47.3 20.412.8 13.5 27.7
5.7 5.3 15.839.8 39.2 51.9
0.7 13.68.2 8.7
12.5 15.8 26.724.8 41.7 30.1
.. 102.. 16 54.. 7 10.. 40.0 62.6.. 3.0 3.8.. 31.1 67.4
30 30.. .. 6.4 .. 3.8.. 4.4
13.6 11.0115.8 44.2
.. 4.2 .. .. 29,785
1.7 2.7 2.619.2 19.8 26.711.8 11.4 19.6
–7.9 .. –2.6.. .. ..
35.9 28.8 50.535.6 37.3 44.6
.. .. ..
.. .. ..23.9 27.2 38.3
4.6 –0.74.9 3.4 11.3
12.0 12.7 ..23 34 391
.. 5.10 2 17
0.0 0.2 4.27.35 4.01 1.99
Ethiopia
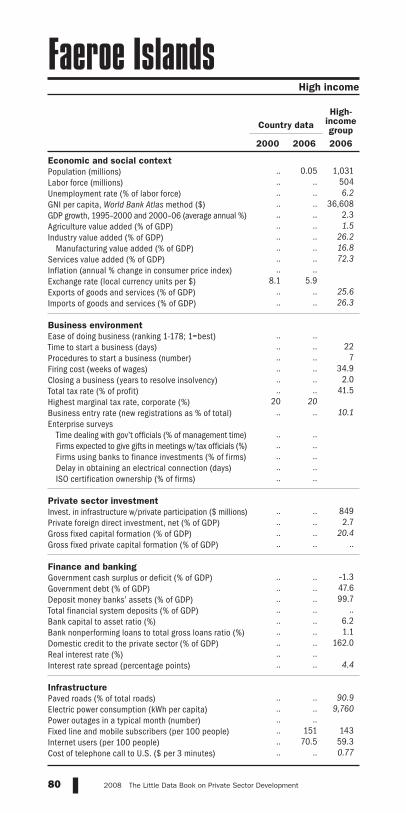
Economic and social contextPopulation (millions)Labor force (millions)Unemployment rate (% of labor force)GNI per capita, World Bank Atlas method ($)GDP growth, 1995–2000 and 2000–06 (average annual %)Agriculture value added (% of GDP)Industry value added (% of GDP)
Manufacturing value added (% of GDP)Services value added (% of GDP)Inflation (annual % change in consumer price index)Exchange rate (local currency units per $)Exports of goods and services (% of GDP)Imports of goods and services (% of GDP) Business environmentEase of doing business (ranking 1-178; 1=best)Time to start a business (days)Procedures to start a business (number)Firing cost (weeks of wages)Closing a business (years to resolve insolvency)Total tax rate (% of profit)Highest marginal tax rate, corporate (%)Business entry rate (new registrations as % of total)Enterprise surveys
Time dealing with gov’t officials (% of management time)Firms expected to give gifts in meetings w/tax officials (%)Firms using banks to finance investments (% of firms)Delay in obtaining an electrical connection (days)ISO certification ownership (% of firms)
Private sector investmentInvest. in infrastructure w/private participation ($ millions)Private foreign direct investment, net (% of GDP)Gross fixed capital formation (% of GDP)Gross fixed private capital formation (% of GDP) Finance and bankingGovernment cash surplus or deficit (% of GDP)Government debt (% of GDP)Deposit money banks’ assets (% of GDP)Total financial system deposits (% of GDP)Bank capital to asset ratio (%)Bank nonperforming loans to total gross loans ratio (%)Domestic credit to the private sector (% of GDP)Real interest rate (%)Interest rate spread (percentage points) Infrastructure Paved roads (% of total roads)Electric power consumption (kWh per capita)Power outages in a typical month (number)Fixed line and mobile subscribers (per 100 people)Internet users (per 100 people)Cost of telephone call to U.S. ($ per 3 minutes)
80 2008 The Little Data Book on Private Sector Development
.. 0.05 1,031.. .. 504.. .. 6.2.. .. 36,608.. .. 2.3.. .. 1.5.. .. 26.2.. .. 16.8.. .. 72.3.. ..
8.1 5.9.. .. 25.6.. .. 26.3 .. .... .. 22.. .. 7.. .. 34.9.. .. 2.0.. .. 41.5
20 20.. .. 10.1 .. .... .... .... .... .. .. .. 849.. .. 2.7.. .. 20.4.. .. .. .. .. –1.3.. .. 47.6.. .. 99.7.. .. .... .. 6.2.. .. 1.1.. .. 162.0.. .... .. 4.4 .. .. 90.9.. .. 9,760.. .... 151 143.. 70.5 59.3.. .. 0.77
Country dataHigh-
income group
2000 2006 2006
High income
Faeroe Islands

Economic and social contextPopulation (millions)Labor force (millions)Unemployment rate (% of labor force)GNI per capita, World Bank Atlas method ($)GDP growth, 1995–2000 and 2000–06 (average annual %)Agriculture value added (% of GDP)Industry value added (% of GDP)
Manufacturing value added (% of GDP)Services value added (% of GDP)Inflation (annual % change in consumer price index)Exchange rate (local currency units per $)Exports of goods and services (% of GDP)Imports of goods and services (% of GDP) Business environmentEase of doing business (ranking 1-178; 1=best)Time to start a business (days)Procedures to start a business (number)Firing cost (weeks of wages)Closing a business (years to resolve insolvency)Total tax rate (% of profit)Highest marginal tax rate, corporate (%)Business entry rate (new registrations as % of total)Enterprise surveys
Time dealing with gov’t officials (% of management time)Firms expected to give gifts in meetings w/tax officials (%)Firms using banks to finance investments (% of firms)Delay in obtaining an electrical connection (days)ISO certification ownership (% of firms)
Private sector investmentInvest. in infrastructure w/private participation ($ millions)Private foreign direct investment, net (% of GDP)Gross fixed capital formation (% of GDP)Gross fixed private capital formation (% of GDP) Finance and bankingGovernment cash surplus or deficit (% of GDP)Government debt (% of GDP)Deposit money banks’ assets (% of GDP)Total financial system deposits (% of GDP)Bank capital to asset ratio (%)Bank nonperforming loans to total gross loans ratio (%)Domestic credit to the private sector (% of GDP)Real interest rate (%)Interest rate spread (percentage points) Infrastructure Paved roads (% of total roads)Electric power consumption (kWh per capita)Power outages in a typical month (number)Fixed line and mobile subscribers (per 100 people)Internet users (per 100 people)Cost of telephone call to U.S. ($ per 3 minutes)
81The Little Data Book on Private Sector Development 2008
East Asia & Pacific Lower middle income
Country data
Lower middle-income group
2000 2006 2006
0.80 0.83 2,2760.34 0.37 1,209
.. .. 5.72,250 3,720 2,038
2.2 2.6 7.617.0 15.0 11.922.3 25.8 43.514.0 14.9 26.760.7 59.2 44.6
1.1 2.52.1 1.7
65.1 55.0 40.470.2 72.6 36.4
.. 36.. 46 53.. 8 10.. 2.0 50.2.. 1.8 3.3.. 38.5 45.8
32 31.. .. 7.6 .. .... .... .... .... .. 3 50 38,154
–0.1 5.0 3.015.4 18.3 33.510.2 11.9 10.9
.. –2.9 –0.9.. .. ..
36.4 41.0 87.836.7 40.2 43.1
.. .. 10.7
.. .. 4.031.9 44.4 81.313.6 3.8
7.5 6.6 7.2
49.2 .. 65.8.. .. 1,502.. ..
18 38 601.5 9.6 11.4
3.76 2.84 2.08
Fiji

Economic and social contextPopulation (millions)Labor force (millions)Unemployment rate (% of labor force)GNI per capita, World Bank Atlas method ($)GDP growth, 1995–2000 and 2000–06 (average annual %)Agriculture value added (% of GDP)Industry value added (% of GDP)
Manufacturing value added (% of GDP)Services value added (% of GDP)Inflation (annual % change in consumer price index)Exchange rate (local currency units per $)Exports of goods and services (% of GDP)Imports of goods and services (% of GDP) Business environmentEase of doing business (ranking 1-178; 1=best)Time to start a business (days)Procedures to start a business (number)Firing cost (weeks of wages)Closing a business (years to resolve insolvency)Total tax rate (% of profit)Highest marginal tax rate, corporate (%)Business entry rate (new registrations as % of total)Enterprise surveys
Time dealing with gov’t officials (% of management time)Firms expected to give gifts in meetings w/tax officials (%)Firms using banks to finance investments (% of firms)Delay in obtaining an electrical connection (days)ISO certification ownership (% of firms)
Private sector investmentInvest. in infrastructure w/private participation ($ millions)Private foreign direct investment, net (% of GDP)Gross fixed capital formation (% of GDP)Gross fixed private capital formation (% of GDP) Finance and bankingGovernment cash surplus or deficit (% of GDP)Government debt (% of GDP)Deposit money banks’ assets (% of GDP)Total financial system deposits (% of GDP)Bank capital to asset ratio (%)Bank nonperforming loans to total gross loans ratio (%)Domestic credit to the private sector (% of GDP)Real interest rate (%)Interest rate spread (percentage points) Infrastructure Paved roads (% of total roads)Electric power consumption (kWh per capita)Power outages in a typical month (number)Fixed line and mobile subscribers (per 100 people)Internet users (per 100 people)Cost of telephone call to U.S. ($ per 3 minutes)
82 2008 The Little Data Book on Private Sector Development
5.2 5.3 1,0312.6 2.7 5049.8 8.4 6.2
25,400 41,360 36,6084.9 2.9 2.33.5 2.6 1.5
33.7 32.4 26.226.2 23.1 16.862.8 64.9 72.3
3.4 1.61.1 0.8
43.5 44.4 25.633.4 37.9 26.3
.. 13.. 14 22.. 3 7.. 26.0 34.9.. 0.9 2.0.. 47.8 41.5
29 266.4 6.8 10.1
.. .... .... .... .... .. .. .. 849
7.5 2.5 2.719.4 19.2 20.4
.. .. ..
6.8 3.9 –1.346.9 39.7 47.655.8 .. 99.722.1 .. ..6.3 9.2 6.20.6 0.3 1.1
53.1 77.8 162.02.9 3.04.0 2.7 4.4
62.0 65.0 90.915,286 16,120 9,760
.. ..127 144 14337.2 55.5 59.31.07 1.80 0.77
Country dataHigh-
income group
2000 2006 2006
High income
Finland

Economic and social contextPopulation (millions)Labor force (millions)Unemployment rate (% of labor force)GNI per capita, World Bank Atlas method ($)GDP growth, 1995–2000 and 2000–06 (average annual %)Agriculture value added (% of GDP)Industry value added (% of GDP)
Manufacturing value added (% of GDP)Services value added (% of GDP)Inflation (annual % change in consumer price index)Exchange rate (local currency units per $)Exports of goods and services (% of GDP)Imports of goods and services (% of GDP) Business environmentEase of doing business (ranking 1-178; 1=best)Time to start a business (days)Procedures to start a business (number)Firing cost (weeks of wages)Closing a business (years to resolve insolvency)Total tax rate (% of profit)Highest marginal tax rate, corporate (%)Business entry rate (new registrations as % of total)Enterprise surveys
Time dealing with gov’t officials (% of management time)Firms expected to give gifts in meetings w/tax officials (%)Firms using banks to finance investments (% of firms)Delay in obtaining an electrical connection (days)ISO certification ownership (% of firms)
Private sector investmentInvest. in infrastructure w/private participation ($ millions)Private foreign direct investment, net (% of GDP)Gross fixed capital formation (% of GDP)Gross fixed private capital formation (% of GDP) Finance and bankingGovernment cash surplus or deficit (% of GDP)Government debt (% of GDP)Deposit money banks’ assets (% of GDP)Total financial system deposits (% of GDP)Bank capital to asset ratio (%)Bank nonperforming loans to total gross loans ratio (%)Domestic credit to the private sector (% of GDP)Real interest rate (%)Interest rate spread (percentage points) Infrastructure Paved roads (% of total roads)Electric power consumption (kWh per capita)Power outages in a typical month (number)Fixed line and mobile subscribers (per 100 people)Internet users (per 100 people)Cost of telephone call to U.S. ($ per 3 minutes)
83The Little Data Book on Private Sector Development 2008
58.9 61.3 1,03126.2 27.3 50410.0 9.8 6.2
24,450 36,560 36,6082.9 1.7 2.32.8 2.0 1.5
22.9 20.8 26.216.0 12.4 16.874.3 77.2 72.3
1.7 1.61.1 0.8
28.6 26.9 25.627.7 28.3 26.3
.. 31.. 7 22.. 5 7.. 32.0 34.9.. 1.9 2.0.. 66.3 41.5
33 3310.0 11.8 10.1
.. .... .... .... .... .. .. .. 849
3.2 3.6 2.719.5 20.4 20.4
.. .. ..
–1.7 –2.3 –1.360.0 67.4 47.6
.. .. 99.7
.. .. ..6.7 5.8 6.25.0 3.2 1.1
85.0 98.7 162.05.2 4.94.1 4.3 4.4
100.0 100.0 90.97,486 7,938 9,760
.. ..107 140 143
14.4 49.1 59.30.82 0.84 0.77
Country dataHigh-
income group
2000 2006 2006
High income
France

Economic and social contextPopulation (millions)Labor force (millions)Unemployment rate (% of labor force)GNI per capita, World Bank Atlas method ($)GDP growth, 1995–2000 and 2000–06 (average annual %)Agriculture value added (% of GDP)Industry value added (% of GDP)
Manufacturing value added (% of GDP)Services value added (% of GDP)Inflation (annual % change in consumer price index)Exchange rate (local currency units per $)Exports of goods and services (% of GDP)Imports of goods and services (% of GDP) Business environmentEase of doing business (ranking 1-178; 1=best)Time to start a business (days)Procedures to start a business (number)Firing cost (weeks of wages)Closing a business (years to resolve insolvency)Total tax rate (% of profit)Highest marginal tax rate, corporate (%)Business entry rate (new registrations as % of total)Enterprise surveys
Time dealing with gov’t officials (% of management time)Firms expected to give gifts in meetings w/tax officials (%)Firms using banks to finance investments (% of firms)Delay in obtaining an electrical connection (days)ISO certification ownership (% of firms)
Private sector investmentInvest. in infrastructure w/private participation ($ millions)Private foreign direct investment, net (% of GDP)Gross fixed capital formation (% of GDP)Gross fixed private capital formation (% of GDP) Finance and bankingGovernment cash surplus or deficit (% of GDP)Government debt (% of GDP)Deposit money banks’ assets (% of GDP)Total financial system deposits (% of GDP)Bank capital to asset ratio (%)Bank nonperforming loans to total gross loans ratio (%)Domestic credit to the private sector (% of GDP)Real interest rate (%)Interest rate spread (percentage points) Infrastructure Paved roads (% of total roads)Electric power consumption (kWh per capita)Power outages in a typical month (number)Fixed line and mobile subscribers (per 100 people)Internet users (per 100 people)Cost of telephone call to U.S. ($ per 3 minutes)
84 2008 The Little Data Book on Private Sector Development
0.24 0.26 1,0310.10 0.11 504
.. .. 6.216,070 .. 36,608
3.5 .. 2.34.7 .. 1.5
.. .. 26.2
.. .. 16.8
.. .. 72.3
.. ..129.5 95.1
4.9 .. 25.624.2 .. 26.3
.. .... .. 22.. .. 7.. .. 34.9.. .. 2.0.. .. 41.5.. .... .. 10.1 .. .... .... .... .... .. .. .. 849.. .. 2.7.. .. 20.4.. .. .. .. .. –1.3.. .. 47.6.. .. 99.7.. .. .... .. 6.2.. .. 1.1.. .. 162.0.. .... .. 4.4 .. .. 90.9.. .. 9,760.. ..
40 79 1436.4 25.1 59.3
3.67 .. 0.77
Country dataHigh-
income group
2000 2006 2006
High income
French Polynesia

Economic and social contextPopulation (millions)Labor force (millions)Unemployment rate (% of labor force)GNI per capita, World Bank Atlas method ($)GDP growth, 1995–2000 and 2000–06 (average annual %)Agriculture value added (% of GDP)Industry value added (% of GDP)
Manufacturing value added (% of GDP)Services value added (% of GDP)Inflation (annual % change in consumer price index)Exchange rate (local currency units per $)Exports of goods and services (% of GDP)Imports of goods and services (% of GDP) Business environmentEase of doing business (ranking 1-178; 1=best)Time to start a business (days)Procedures to start a business (number)Firing cost (weeks of wages)Closing a business (years to resolve insolvency)Total tax rate (% of profit)Highest marginal tax rate, corporate (%)Business entry rate (new registrations as % of total)Enterprise surveys
Time dealing with gov’t officials (% of management time)Firms expected to give gifts in meetings w/tax officials (%)Firms using banks to finance investments (% of firms)Delay in obtaining an electrical connection (days)ISO certification ownership (% of firms)
Private sector investmentInvest. in infrastructure w/private participation ($ millions)Private foreign direct investment, net (% of GDP)Gross fixed capital formation (% of GDP)Gross fixed private capital formation (% of GDP) Finance and bankingGovernment cash surplus or deficit (% of GDP)Government debt (% of GDP)Deposit money banks’ assets (% of GDP)Total financial system deposits (% of GDP)Bank capital to asset ratio (%)Bank nonperforming loans to total gross loans ratio (%)Domestic credit to the private sector (% of GDP)Real interest rate (%)Interest rate spread (percentage points) Infrastructure Paved roads (% of total roads)Electric power consumption (kWh per capita)Power outages in a typical month (number)Fixed line and mobile subscribers (per 100 people)Internet users (per 100 people)Cost of telephone call to U.S. ($ per 3 minutes)
85The Little Data Book on Private Sector Development 2008
1.2 1.3 811
0.53 0.61 374.. .. 9.8
3,220 5,360 5,9130.3 1.7 3.96.2 4.9 5.7
56.3 61.2 32.43.7 4.1 19.4
37.5 33.9 62.00.5 4.1
712.0 522.969.0 65.4 32.732.7 23.7 30.3
.. 144.. 58 41.. 9 9.. 43.0 39.7.. 5.0 2.9.. 44.2 44.5
35 .... .. 9.1 .. .... .... .... .... ..
12 92 45,869–0.8 2.8 3.521.9 23.1 19.919.0 18.3 ..
.. .. .... .. ..
12.1 9.8 52.910.4 13.2 41.4
.. .. 9.86.6 11.1 3.28.7 9.3 41.4
–4.8 6.917.0 11.0 5.9
9.9 10.2 ..914 999 3,131
.. ..13 61 88
1.3 6.2 22.214.12 2.77 1.06
Country data
Upper middle-income group
2000 2006 2006
Sub-Saharan Africa Upper middle income
Gabon

Economic and social contextPopulation (millions)Labor force (millions)Unemployment rate (% of labor force)GNI per capita, World Bank Atlas method ($)GDP growth, 1995–2000 and 2000–06 (average annual %)Agriculture value added (% of GDP)Industry value added (% of GDP)
Manufacturing value added (% of GDP)Services value added (% of GDP)Inflation (annual % change in consumer price index)Exchange rate (local currency units per $)Exports of goods and services (% of GDP)Imports of goods and services (% of GDP) Business environmentEase of doing business (ranking 1-178; 1=best)Time to start a business (days)Procedures to start a business (number)Firing cost (weeks of wages)Closing a business (years to resolve insolvency)Total tax rate (% of profit)Highest marginal tax rate, corporate (%)Business entry rate (new registrations as % of total)Enterprise surveys
Time dealing with gov’t officials (% of management time)Firms expected to give gifts in meetings w/tax officials (%)Firms using banks to finance investments (% of firms)Delay in obtaining an electrical connection (days)ISO certification ownership (% of firms)
Private sector investmentInvest. in infrastructure w/private participation ($ millions)Private foreign direct investment, net (% of GDP)Gross fixed capital formation (% of GDP)Gross fixed private capital formation (% of GDP) Finance and bankingGovernment cash surplus or deficit (% of GDP)Government debt (% of GDP)Deposit money banks’ assets (% of GDP)Total financial system deposits (% of GDP)Bank capital to asset ratio (%)Bank nonperforming loans to total gross loans ratio (%)Domestic credit to the private sector (% of GDP)Real interest rate (%)Interest rate spread (percentage points) Infrastructure Paved roads (% of total roads)Electric power consumption (kWh per capita)Power outages in a typical month (number)Fixed line and mobile subscribers (per 100 people)Internet users (per 100 people)Cost of telephone call to U.S. ($ per 3 minutes)
86 2008 The Little Data Book on Private Sector Development
1.4 1.7 2,420
0.59 0.71 995.. .. ..
310 290 6494.6 3.9 6.5
35.8 32.6 20.413.1 13.1 27.75.4 5.2 15.8
51.1 54.2 51.90.2 3.2
12.8 28.148.0 44.8 26.756.8 65.4 30.1
.. 131.. 32 54.. 9 10.. 9.0 62.6.. 3.0 3.8.. 286.7 67.4.. .... .. 6.4 .. 7.3.. 13.6.. 7.6.. 63.9.. 22.2 7 .. 29,785
10.3 16.1 2.617.4 24.8 26.712.8 14.9 19.6
.. .. –2.6.. .. ..
30.8 41.7 50.529.5 60.0 44.6
.. .. ..
.. .. ..12.5 15.6 38.319.6 24.711.5 17.1 11.3
35.4 19.3 .... .. 391.. 23.83 27 17
0.9 3.6 4.25.39 1.81 1.99
Country dataLow-
income group
2000 2006 2006
Sub-Saharan Africa Low income
Gambia, The
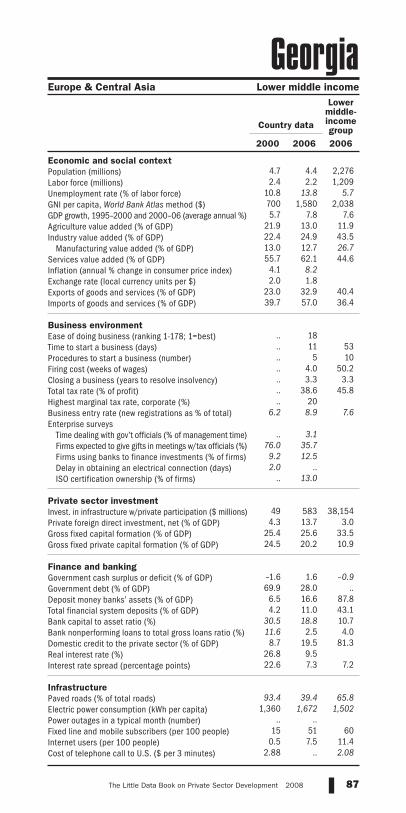
Economic and social contextPopulation (millions)Labor force (millions)Unemployment rate (% of labor force)GNI per capita, World Bank Atlas method ($)GDP growth, 1995–2000 and 2000–06 (average annual %)Agriculture value added (% of GDP)Industry value added (% of GDP)
Manufacturing value added (% of GDP)Services value added (% of GDP)Inflation (annual % change in consumer price index)Exchange rate (local currency units per $)Exports of goods and services (% of GDP)Imports of goods and services (% of GDP) Business environmentEase of doing business (ranking 1-178; 1=best)Time to start a business (days)Procedures to start a business (number)Firing cost (weeks of wages)Closing a business (years to resolve insolvency)Total tax rate (% of profit)Highest marginal tax rate, corporate (%)Business entry rate (new registrations as % of total)Enterprise surveys
Time dealing with gov’t officials (% of management time)Firms expected to give gifts in meetings w/tax officials (%)Firms using banks to finance investments (% of firms)Delay in obtaining an electrical connection (days)ISO certification ownership (% of firms)
Private sector investmentInvest. in infrastructure w/private participation ($ millions)Private foreign direct investment, net (% of GDP)Gross fixed capital formation (% of GDP)Gross fixed private capital formation (% of GDP) Finance and bankingGovernment cash surplus or deficit (% of GDP)Government debt (% of GDP)Deposit money banks’ assets (% of GDP)Total financial system deposits (% of GDP)Bank capital to asset ratio (%)Bank nonperforming loans to total gross loans ratio (%)Domestic credit to the private sector (% of GDP)Real interest rate (%)Interest rate spread (percentage points) Infrastructure Paved roads (% of total roads)Electric power consumption (kWh per capita)Power outages in a typical month (number)Fixed line and mobile subscribers (per 100 people)Internet users (per 100 people)Cost of telephone call to U.S. ($ per 3 minutes)
87The Little Data Book on Private Sector Development 2008
4.7 4.4 2,2762.4 2.2 1,209
10.8 13.8 5.7700 1,580 2,0385.7 7.8 7.6
21.9 13.0 11.922.4 24.9 43.513.0 12.7 26.755.7 62.1 44.6
4.1 8.22.0 1.8
23.0 32.9 40.439.7 57.0 36.4
.. 18.. 11 53.. 5 10.. 4.0 50.2.. 3.3 3.3.. 38.6 45.8.. 20
6.2 8.9 7.6 .. 3.1
76.0 35.79.2 12.52.0 ..
.. 13.0
49 583 38,1544.3 13.7 3.0
25.4 25.6 33.524.5 20.2 10.9
–1.6 1.6 –0.969.9 28.0 ..
6.5 16.6 87.84.2 11.0 43.1
30.5 18.8 10.711.6 2.5 4.08.7 19.5 81.3
26.8 9.522.6 7.3 7.2
93.4 39.4 65.81,360 1,672 1,502
.. ..15 51 60
0.5 7.5 11.42.88 .. 2.08
Country data
Lower middle-income group
2000 2006 2006
Europe & Central Asia Lower middle income
Georgia
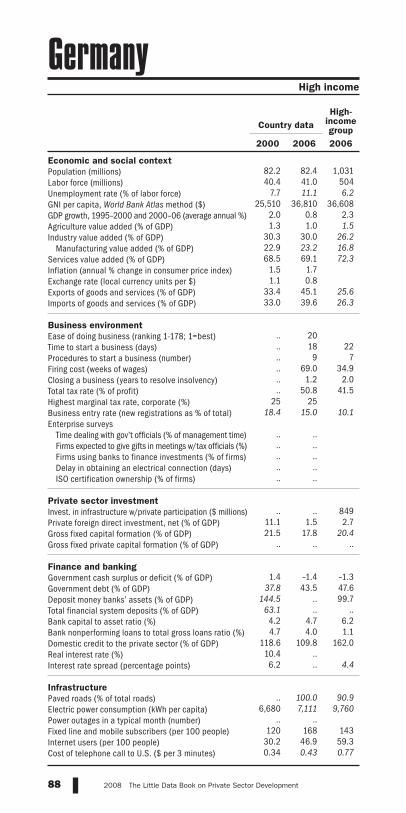
Economic and social contextPopulation (millions)Labor force (millions)Unemployment rate (% of labor force)GNI per capita, World Bank Atlas method ($)GDP growth, 1995–2000 and 2000–06 (average annual %)Agriculture value added (% of GDP)Industry value added (% of GDP)
Manufacturing value added (% of GDP)Services value added (% of GDP)Inflation (annual % change in consumer price index)Exchange rate (local currency units per $)Exports of goods and services (% of GDP)Imports of goods and services (% of GDP) Business environmentEase of doing business (ranking 1-178; 1=best)Time to start a business (days)Procedures to start a business (number)Firing cost (weeks of wages)Closing a business (years to resolve insolvency)Total tax rate (% of profit)Highest marginal tax rate, corporate (%)Business entry rate (new registrations as % of total)Enterprise surveys
Time dealing with gov’t officials (% of management time)Firms expected to give gifts in meetings w/tax officials (%)Firms using banks to finance investments (% of firms)Delay in obtaining an electrical connection (days)ISO certification ownership (% of firms)
Private sector investmentInvest. in infrastructure w/private participation ($ millions)Private foreign direct investment, net (% of GDP)Gross fixed capital formation (% of GDP)Gross fixed private capital formation (% of GDP) Finance and bankingGovernment cash surplus or deficit (% of GDP)Government debt (% of GDP)Deposit money banks’ assets (% of GDP)Total financial system deposits (% of GDP)Bank capital to asset ratio (%)Bank nonperforming loans to total gross loans ratio (%)Domestic credit to the private sector (% of GDP)Real interest rate (%)Interest rate spread (percentage points) Infrastructure Paved roads (% of total roads)Electric power consumption (kWh per capita)Power outages in a typical month (number)Fixed line and mobile subscribers (per 100 people)Internet users (per 100 people)Cost of telephone call to U.S. ($ per 3 minutes)
88 2008 The Little Data Book on Private Sector Development
82.2 82.4 1,03140.4 41.0 504
7.7 11.1 6.225,510 36,810 36,608
2.0 0.8 2.31.3 1.0 1.5
30.3 30.0 26.222.9 23.2 16.868.5 69.1 72.3
1.5 1.71.1 0.8
33.4 45.1 25.633.0 39.6 26.3
.. 20.. 18 22.. 9 7.. 69.0 34.9.. 1.2 2.0.. 50.8 41.5
25 2518.4 15.0 10.1
.. .... .... .... .... .. .. .. 849
11.1 1.5 2.721.5 17.8 20.4
.. .. ..
1.4 –1.4 –1.337.8 43.5 47.6
144.5 .. 99.763.1 .. ..4.2 4.7 6.24.7 4.0 1.1
118.6 109.8 162.010.4 ..6.2 .. 4.4
.. 100.0 90.9
6,680 7,111 9,760.. ..
120 168 14330.2 46.9 59.30.34 0.43 0.77
Country dataHigh-
income group
2000 2006 2006
High income
Germany
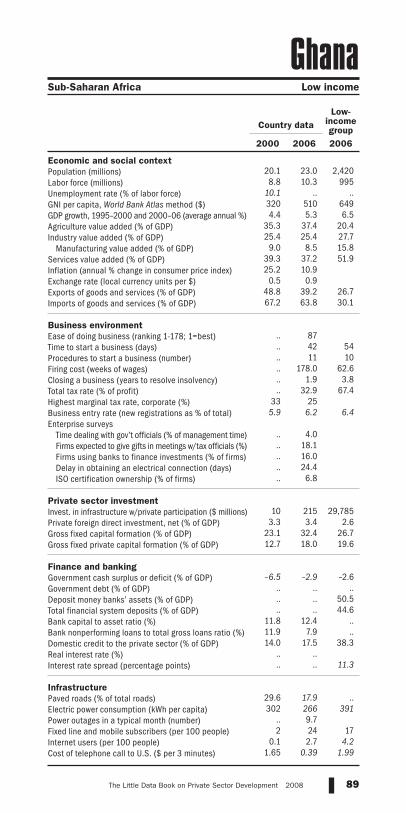
Economic and social contextPopulation (millions)Labor force (millions)Unemployment rate (% of labor force)GNI per capita, World Bank Atlas method ($)GDP growth, 1995–2000 and 2000–06 (average annual %)Agriculture value added (% of GDP)Industry value added (% of GDP)
Manufacturing value added (% of GDP)Services value added (% of GDP)Inflation (annual % change in consumer price index)Exchange rate (local currency units per $)Exports of goods and services (% of GDP)Imports of goods and services (% of GDP) Business environmentEase of doing business (ranking 1-178; 1=best)Time to start a business (days)Procedures to start a business (number)Firing cost (weeks of wages)Closing a business (years to resolve insolvency)Total tax rate (% of profit)Highest marginal tax rate, corporate (%)Business entry rate (new registrations as % of total)Enterprise surveys
Time dealing with gov’t officials (% of management time)Firms expected to give gifts in meetings w/tax officials (%)Firms using banks to finance investments (% of firms)Delay in obtaining an electrical connection (days)ISO certification ownership (% of firms)
Private sector investmentInvest. in infrastructure w/private participation ($ millions)Private foreign direct investment, net (% of GDP)Gross fixed capital formation (% of GDP)Gross fixed private capital formation (% of GDP) Finance and bankingGovernment cash surplus or deficit (% of GDP)Government debt (% of GDP)Deposit money banks’ assets (% of GDP)Total financial system deposits (% of GDP)Bank capital to asset ratio (%)Bank nonperforming loans to total gross loans ratio (%)Domestic credit to the private sector (% of GDP)Real interest rate (%)Interest rate spread (percentage points) Infrastructure Paved roads (% of total roads)Electric power consumption (kWh per capita)Power outages in a typical month (number)Fixed line and mobile subscribers (per 100 people)Internet users (per 100 people)Cost of telephone call to U.S. ($ per 3 minutes)
89The Little Data Book on Private Sector Development 2008
20.1 23.0 2,4208.8 10.3 995
10.1 .. ..320 510 6494.4 5.3 6.5
35.3 37.4 20.425.4 25.4 27.7
9.0 8.5 15.839.3 37.2 51.925.2 10.9
0.5 0.948.8 39.2 26.767.2 63.8 30.1
.. 87.. 42 54.. 11 10.. 178.0 62.6.. 1.9 3.8.. 32.9 67.4
33 255.9 6.2 6.4
.. 4.0.. 18.1.. 16.0.. 24.4.. 6.8
10 215 29,7853.3 3.4 2.6
23.1 32.4 26.712.7 18.0 19.6
–6.5 –2.9 –2.6.. .. .... .. 50.5.. .. 44.6
11.8 12.4 ..11.9 7.9 ..14.0 17.5 38.3
.. ..
.. .. 11.3
29.6 17.9 ..302 266 391
.. 9.72 24 17
0.1 2.7 4.21.65 0.39 1.99
Country dataLow-
income group
2000 2006 2006
Sub-Saharan Africa Low income
Ghana

Economic and social contextPopulation (millions)Labor force (millions)Unemployment rate (% of labor force)GNI per capita, World Bank Atlas method ($)GDP growth, 1995–2000 and 2000–06 (average annual %)Agriculture value added (% of GDP)Industry value added (% of GDP)
Manufacturing value added (% of GDP)Services value added (% of GDP)Inflation (annual % change in consumer price index)Exchange rate (local currency units per $)Exports of goods and services (% of GDP)Imports of goods and services (% of GDP) Business environmentEase of doing business (ranking 1-178; 1=best)Time to start a business (days)Procedures to start a business (number)Firing cost (weeks of wages)Closing a business (years to resolve insolvency)Total tax rate (% of profit)Highest marginal tax rate, corporate (%)Business entry rate (new registrations as % of total)Enterprise surveys
Time dealing with gov’t officials (% of management time)Firms expected to give gifts in meetings w/tax officials (%)Firms using banks to finance investments (% of firms)Delay in obtaining an electrical connection (days)ISO certification ownership (% of firms)
Private sector investmentInvest. in infrastructure w/private participation ($ millions)Private foreign direct investment, net (% of GDP)Gross fixed capital formation (% of GDP)Gross fixed private capital formation (% of GDP) Finance and bankingGovernment cash surplus or deficit (% of GDP)Government debt (% of GDP)Deposit money banks’ assets (% of GDP)Total financial system deposits (% of GDP)Bank capital to asset ratio (%)Bank nonperforming loans to total gross loans ratio (%)Domestic credit to the private sector (% of GDP)Real interest rate (%)Interest rate spread (percentage points) Infrastructure Paved roads (% of total roads)Electric power consumption (kWh per capita)Power outages in a typical month (number)Fixed line and mobile subscribers (per 100 people)Internet users (per 100 people)Cost of telephone call to U.S. ($ per 3 minutes)
90 2008 The Little Data Book on Private Sector Development
10.9 11.1 1,0314.9 5.2 504
11.1 9.6 6.214,430 27,390 36,608
3.5 4.4 2.35.7 3.3 1.5
21.2 20.8 26.210.3 9.5 16.873.1 75.9 72.33.2 3.2
365.4 0.821.6 18.6 25.632.7 27.0 26.3
.. 100.. 38 22.. 15 7.. 24.0 34.9.. 2.0 2.0.. 48.6 41.5
35 297.7 7.0 10.1
.. .... .... .... .... .. .. .. 849
0.8 1.8 2.723.2 25.7 20.4
.. .. ..
–3.2 –4.5 –1.3107.6 102.1 47.671.0 .. 99.749.0 .. ..8.9 5.2 6.2
12.3 5.5 1.140.9 72.3 162.0
8.7 3.16.2 4.3 4.4
91.8 .. 90.94,539 5,242 9,760
.. ..106 155 1439.2 18.4 59.3
0.69 1.09 0.77
Country dataHigh-
income group
2000 2006 2006
High income
Greece

Economic and social contextPopulation (millions)Labor force (millions)Unemployment rate (% of labor force)GNI per capita, World Bank Atlas method ($)GDP growth, 1995–2000 and 2000–06 (average annual %)Agriculture value added (% of GDP)Industry value added (% of GDP)
Manufacturing value added (% of GDP)Services value added (% of GDP)Inflation (annual % change in consumer price index)Exchange rate (local currency units per $)Exports of goods and services (% of GDP)Imports of goods and services (% of GDP) Business environmentEase of doing business (ranking 1-178; 1=best)Time to start a business (days)Procedures to start a business (number)Firing cost (weeks of wages)Closing a business (years to resolve insolvency)Total tax rate (% of profit)Highest marginal tax rate, corporate (%)Business entry rate (new registrations as % of total)Enterprise surveys
Time dealing with gov’t officials (% of management time)Firms expected to give gifts in meetings w/tax officials (%)Firms using banks to finance investments (% of firms)Delay in obtaining an electrical connection (days)ISO certification ownership (% of firms)
Private sector investmentInvest. in infrastructure w/private participation ($ millions)Private foreign direct investment, net (% of GDP)Gross fixed capital formation (% of GDP)Gross fixed private capital formation (% of GDP) Finance and bankingGovernment cash surplus or deficit (% of GDP)Government debt (% of GDP)Deposit money banks’ assets (% of GDP)Total financial system deposits (% of GDP)Bank capital to asset ratio (%)Bank nonperforming loans to total gross loans ratio (%)Domestic credit to the private sector (% of GDP)Real interest rate (%)Interest rate spread (percentage points) Infrastructure Paved roads (% of total roads)Electric power consumption (kWh per capita)Power outages in a typical month (number)Fixed line and mobile subscribers (per 100 people)Internet users (per 100 people)Cost of telephone call to U.S. ($ per 3 minutes)
91The Little Data Book on Private Sector Development 2008
0.06 0.06 1,031
.. .. 50411.0 9.3 6.2
.. .. 36,608
.. .. 2.3
.. .. 1.5
.. .. 26.2
.. .. 16.8
.. .. 72.3
.. ..8.1 5.9
.. .. 25.6
.. .. 26.3 .. .... .. 22.. .. 7.. .. 34.9.. .. 2.0.. .. 41.5.. .... .. 10.1 .. .... .... .... .... .. .. .. 849.. .. 2.7.. .. 20.4.. .. .. .. .. –1.3.. .. 47.6.. .. 99.7.. .. .... .. 6.2.. .. 1.1.. .. 162.0.. .... .. 4.4 .. .. 90.9.. .. 9,760.. ..
75 .. 14331.7 66.8 59.32.41 .. 0.77
Country dataHigh-
income group
2000 2006 2006
High income
Greenland

Economic and social contextPopulation (millions)Labor force (millions)Unemployment rate (% of labor force)GNI per capita, World Bank Atlas method ($)GDP growth, 1995–2000 and 2000–06 (average annual %)Agriculture value added (% of GDP)Industry value added (% of GDP)
Manufacturing value added (% of GDP)Services value added (% of GDP)Inflation (annual % change in consumer price index)Exchange rate (local currency units per $)Exports of goods and services (% of GDP)Imports of goods and services (% of GDP) Business environmentEase of doing business (ranking 1-178; 1=best)Time to start a business (days)Procedures to start a business (number)Firing cost (weeks of wages)Closing a business (years to resolve insolvency)Total tax rate (% of profit)Highest marginal tax rate, corporate (%)Business entry rate (new registrations as % of total)Enterprise surveys
Time dealing with gov’t officials (% of management time)Firms expected to give gifts in meetings w/tax officials (%)Firms using banks to finance investments (% of firms)Delay in obtaining an electrical connection (days)ISO certification ownership (% of firms)
Private sector investmentInvest. in infrastructure w/private participation ($ millions)Private foreign direct investment, net (% of GDP)Gross fixed capital formation (% of GDP)Gross fixed private capital formation (% of GDP) Finance and bankingGovernment cash surplus or deficit (% of GDP)Government debt (% of GDP)Deposit money banks’ assets (% of GDP)Total financial system deposits (% of GDP)Bank capital to asset ratio (%)Bank nonperforming loans to total gross loans ratio (%)Domestic credit to the private sector (% of GDP)Real interest rate (%)Interest rate spread (percentage points) Infrastructure Paved roads (% of total roads)Electric power consumption (kWh per capita)Power outages in a typical month (number)Fixed line and mobile subscribers (per 100 people)Internet users (per 100 people)Cost of telephone call to U.S. ($ per 3 minutes)
92 2008 The Little Data Book on Private Sector Development
0.10 0.11 811
.. .. 37415.2 .. 9.8
3,670 4,650 5,9136.7 2.1 3.97.7 6.7 5.7
24.3 29.0 32.47.6 5.9 19.4
68.0 64.3 62.02.1 3.82.7 2.7
57.6 32.9 32.775.7 76.1 30.3
.. 70.. 20 41.. 6 9.. 29.0 39.7.. .. 2.9.. 45.3 44.5.. .... .. 9.1 .. .... .... .... .... .. .. 10 45,869
9.1 22.7 3.543.8 63.2 19.936.8 28.4 ..
.. .. .... .. ..
83.7 86.5 52.986.2 114.3 41.4
.. .. 9.8
.. .. 3.279.4 86.4 41.411.3 7.1
7.4 6.9 5.9
61.0 .. .... .. 3,131.. ..
35 68 884.1 18.2 22.2
3.97 .. 1.06
Country data
Upper middle-income group
2000 2006 2006
Latin America & Caribbean Upper middle income
Grenada

Economic and social contextPopulation (millions)Labor force (millions)Unemployment rate (% of labor force)GNI per capita, World Bank Atlas method ($)GDP growth, 1995–2000 and 2000–06 (average annual %)Agriculture value added (% of GDP)Industry value added (% of GDP)
Manufacturing value added (% of GDP)Services value added (% of GDP)Inflation (annual % change in consumer price index)Exchange rate (local currency units per $)Exports of goods and services (% of GDP)Imports of goods and services (% of GDP) Business environmentEase of doing business (ranking 1-178; 1=best)Time to start a business (days)Procedures to start a business (number)Firing cost (weeks of wages)Closing a business (years to resolve insolvency)Total tax rate (% of profit)Highest marginal tax rate, corporate (%)Business entry rate (new registrations as % of total)Enterprise surveys
Time dealing with gov’t officials (% of management time)Firms expected to give gifts in meetings w/tax officials (%)Firms using banks to finance investments (% of firms)Delay in obtaining an electrical connection (days)ISO certification ownership (% of firms)
Private sector investmentInvest. in infrastructure w/private participation ($ millions)Private foreign direct investment, net (% of GDP)Gross fixed capital formation (% of GDP)Gross fixed private capital formation (% of GDP) Finance and bankingGovernment cash surplus or deficit (% of GDP)Government debt (% of GDP)Deposit money banks’ assets (% of GDP)Total financial system deposits (% of GDP)Bank capital to asset ratio (%)Bank nonperforming loans to total gross loans ratio (%)Domestic credit to the private sector (% of GDP)Real interest rate (%)Interest rate spread (percentage points) Infrastructure Paved roads (% of total roads)Electric power consumption (kWh per capita)Power outages in a typical month (number)Fixed line and mobile subscribers (per 100 people)Internet users (per 100 people)Cost of telephone call to U.S. ($ per 3 minutes)
93The Little Data Book on Private Sector Development 2008
0.16 0.17 1,0310.07 0.08 504
.. .. 6.2
.. .. 36,608
.. .. 2.3
.. .. 1.5
.. .. 26.2
.. .. 16.8
.. .. 72.3
.. ..
.. ..
.. .. 25.6
.. .. 26.3 .. .... .. 22.. .. 7.. .. 34.9.. .. 2.0.. .. 41.5.. .... .. 10.1 .. .... .... .... .... .. .. .. 849.. .. 2.7.. .. 20.4.. .. .. .. .. –1.3.. .. 47.6.. .. 99.7.. .. .... .. 6.2.. .. 1.1.. .. 162.0.. .... .. 4.4 .. .. 90.9.. .. 9,760.. ..
65 .. 14316.1 38.6 59.3
.. .. 0.77
Country dataHigh-
income group
2000 2006 2006
High income
Guam

Economic and social contextPopulation (millions)Labor force (millions)Unemployment rate (% of labor force)GNI per capita, World Bank Atlas method ($)GDP growth, 1995–2000 and 2000–06 (average annual %)Agriculture value added (% of GDP)Industry value added (% of GDP)
Manufacturing value added (% of GDP)Services value added (% of GDP)Inflation (annual % change in consumer price index)Exchange rate (local currency units per $)Exports of goods and services (% of GDP)Imports of goods and services (% of GDP) Business environmentEase of doing business (ranking 1-178; 1=best)Time to start a business (days)Procedures to start a business (number)Firing cost (weeks of wages)Closing a business (years to resolve insolvency)Total tax rate (% of profit)Highest marginal tax rate, corporate (%)Business entry rate (new registrations as % of total)Enterprise surveys
Time dealing with gov’t officials (% of management time)Firms expected to give gifts in meetings w/tax officials (%)Firms using banks to finance investments (% of firms)Delay in obtaining an electrical connection (days)ISO certification ownership (% of firms)
Private sector investmentInvest. in infrastructure w/private participation ($ millions)Private foreign direct investment, net (% of GDP)Gross fixed capital formation (% of GDP)Gross fixed private capital formation (% of GDP) Finance and bankingGovernment cash surplus or deficit (% of GDP)Government debt (% of GDP)Deposit money banks’ assets (% of GDP)Total financial system deposits (% of GDP)Bank capital to asset ratio (%)Bank nonperforming loans to total gross loans ratio (%)Domestic credit to the private sector (% of GDP)Real interest rate (%)Interest rate spread (percentage points) Infrastructure Paved roads (% of total roads)Electric power consumption (kWh per capita)Power outages in a typical month (number)Fixed line and mobile subscribers (per 100 people)Internet users (per 100 people)Cost of telephone call to U.S. ($ per 3 minutes)
94 2008 The Little Data Book on Private Sector Development
11.2 13.0 2,2763.6 4.2 1,2091.4 3.4 5.7
1,730 2,590 2,0384.1 2.7 7.6
22.8 22.2 11.919.8 19.1 43.513.2 12.5 26.757.4 58.7 44.66.0 6.57.8 7.6
20.2 15.7 40.429.0 30.6 36.4
.. 114.. 26 53.. 11 10.. 101.0 50.2.. 3.0 3.3.. 37.5 45.8
31 31.. 6.2 7.6 .. 9.2.. 3.8.. 12.8.. 35.3.. 8.0
147 276 38,1541.2 1.0 3.0
16.1 16.9 33.513.7 14.9 10.9
–1.8 –1.7 –0.917.0 19.0 ..21.3 27.6 87.816.1 30.6 43.18.9 8.2 10.77.9 4.6 4.0
19.8 26.8 81.313.2 6.110.7 8.3 7.2
34.5 .. 65.8343 522 1,502
.. 3.114 65 600.7 10.1 11.4
0.76 1.21 2.08
Country data
Lower middle-income group
2000 2006 2006
Latin America & Caribbean Lower middle income
Guatemala

Economic and social contextPopulation (millions)Labor force (millions)Unemployment rate (% of labor force)GNI per capita, World Bank Atlas method ($)GDP growth, 1995–2000 and 2000–06 (average annual %)Agriculture value added (% of GDP)Industry value added (% of GDP)
Manufacturing value added (% of GDP)Services value added (% of GDP)Inflation (annual % change in consumer price index)Exchange rate (local currency units per $)Exports of goods and services (% of GDP)Imports of goods and services (% of GDP) Business environmentEase of doing business (ranking 1-178; 1=best)Time to start a business (days)Procedures to start a business (number)Firing cost (weeks of wages)Closing a business (years to resolve insolvency)Total tax rate (% of profit)Highest marginal tax rate, corporate (%)Business entry rate (new registrations as % of total)Enterprise surveys
Time dealing with gov’t officials (% of management time)Firms expected to give gifts in meetings w/tax officials (%)Firms using banks to finance investments (% of firms)Delay in obtaining an electrical connection (days)ISO certification ownership (% of firms)
Private sector investmentInvest. in infrastructure w/private participation ($ millions)Private foreign direct investment, net (% of GDP)Gross fixed capital formation (% of GDP)Gross fixed private capital formation (% of GDP) Finance and bankingGovernment cash surplus or deficit (% of GDP)Government debt (% of GDP)Deposit money banks’ assets (% of GDP)Total financial system deposits (% of GDP)Bank capital to asset ratio (%)Bank nonperforming loans to total gross loans ratio (%)Domestic credit to the private sector (% of GDP)Real interest rate (%)Interest rate spread (percentage points) Infrastructure Paved roads (% of total roads)Electric power consumption (kWh per capita)Power outages in a typical month (number)Fixed line and mobile subscribers (per 100 people)Internet users (per 100 people)Cost of telephone call to U.S. ($ per 3 minutes)
95The Little Data Book on Private Sector Development 2008
8.2 9.2 2,4203.9 4.4 995
.. .. ..410 400 6494.4 2.9 6.5
20.3 12.9 20.432.5 37.5 27.7
4.0 3.7 15.847.2 49.6 51.9
.. ..1,746.9 3,644.3
23.6 32.4 26.727.9 35.1 30.1
.. 166.. 41 54.. 13 10.. 26.0 62.6.. 3.8 3.8.. 49.9 67.4.. .... .. 6.4 .. 2.7.. 57.3.. 0.9.. 16.1.. 5.2 6 48 29,785
0.3 3.3 2.618.9 12.9 26.714.0 9.8 19.6
–2.4 .. –2.6.. .. .... .. 50.5.. .. 44.6.. .. .... .. ..
3.8 5.0 38.37.4 ..
11.9 .. 11.3
16.5 9.8 .... .. 391.. 33.91 2 17
0.1 0.5 4.25.15 .. 1.99
Country dataLow-
income group
2000 2006 2006
Sub-Saharan Africa Low income
Guinea

Economic and social contextPopulation (millions)Labor force (millions)Unemployment rate (% of labor force)GNI per capita, World Bank Atlas method ($)GDP growth, 1995–2000 and 2000–06 (average annual %)Agriculture value added (% of GDP)Industry value added (% of GDP)
Manufacturing value added (% of GDP)Services value added (% of GDP)Inflation (annual % change in consumer price index)Exchange rate (local currency units per $)Exports of goods and services (% of GDP)Imports of goods and services (% of GDP) Business environmentEase of doing business (ranking 1-178; 1=best)Time to start a business (days)Procedures to start a business (number)Firing cost (weeks of wages)Closing a business (years to resolve insolvency)Total tax rate (% of profit)Highest marginal tax rate, corporate (%)Business entry rate (new registrations as % of total)Enterprise surveys
Time dealing with gov’t officials (% of management time)Firms expected to give gifts in meetings w/tax officials (%)Firms using banks to finance investments (% of firms)Delay in obtaining an electrical connection (days)ISO certification ownership (% of firms)
Private sector investmentInvest. in infrastructure w/private participation ($ millions)Private foreign direct investment, net (% of GDP)Gross fixed capital formation (% of GDP)Gross fixed private capital formation (% of GDP) Finance and bankingGovernment cash surplus or deficit (% of GDP)Government debt (% of GDP)Deposit money banks’ assets (% of GDP)Total financial system deposits (% of GDP)Bank capital to asset ratio (%)Bank nonperforming loans to total gross loans ratio (%)Domestic credit to the private sector (% of GDP)Real interest rate (%)Interest rate spread (percentage points) Infrastructure Paved roads (% of total roads)Electric power consumption (kWh per capita)Power outages in a typical month (number)Fixed line and mobile subscribers (per 100 people)Internet users (per 100 people)Cost of telephone call to U.S. ($ per 3 minutes)
96 2008 The Little Data Book on Private Sector Development
1.4 1.6 2,420
0.56 0.66 995.. .. ..
160 190 649–2.7 0.4 6.556.4 61.8 20.413.0 11.5 27.710.5 7.2 15.830.6 26.8 51.9
8.6 2.0712.0 522.931.8 42.2 26.751.6 53.2 30.1
.. 176.. 233 54.. 17 10.. 87.0 62.6.. .. 3.8.. 45.9 67.4.. .... .. 6.4 .. 2.9.. 22.7.. 0.7.. 20.5.. 8.4 .. 0.6 29,785
0.3 13.8 2.611.3 17.2 26.71.3 4.8 19.6
.. .. –2.6.. .. ..
7.6 4.2 50.512.7 8.0 44.6
.. .. ..
.. .. ..7.9 4.0 38.3
.. ..
.. .. 11.3
27.9 .. .... .. 391.. 9.21 7 17
0.2 2.2 4.2.. .. 1.99
Country dataLow-
income group
2000 2006 2006
Sub-Saharan Africa Low income
Guinea-Bissau

Economic and social contextPopulation (millions)Labor force (millions)Unemployment rate (% of labor force)GNI per capita, World Bank Atlas method ($)GDP growth, 1995–2000 and 2000–06 (average annual %)Agriculture value added (% of GDP)Industry value added (% of GDP)
Manufacturing value added (% of GDP)Services value added (% of GDP)Inflation (annual % change in consumer price index)Exchange rate (local currency units per $)Exports of goods and services (% of GDP)Imports of goods and services (% of GDP) Business environmentEase of doing business (ranking 1-178; 1=best)Time to start a business (days)Procedures to start a business (number)Firing cost (weeks of wages)Closing a business (years to resolve insolvency)Total tax rate (% of profit)Highest marginal tax rate, corporate (%)Business entry rate (new registrations as % of total)Enterprise surveys
Time dealing with gov’t officials (% of management time)Firms expected to give gifts in meetings w/tax officials (%)Firms using banks to finance investments (% of firms)Delay in obtaining an electrical connection (days)ISO certification ownership (% of firms)
Private sector investmentInvest. in infrastructure w/private participation ($ millions)Private foreign direct investment, net (% of GDP)Gross fixed capital formation (% of GDP)Gross fixed private capital formation (% of GDP) Finance and bankingGovernment cash surplus or deficit (% of GDP)Government debt (% of GDP)Deposit money banks’ assets (% of GDP)Total financial system deposits (% of GDP)Bank capital to asset ratio (%)Bank nonperforming loans to total gross loans ratio (%)Domestic credit to the private sector (% of GDP)Real interest rate (%)Interest rate spread (percentage points) Infrastructure Paved roads (% of total roads)Electric power consumption (kWh per capita)Power outages in a typical month (number)Fixed line and mobile subscribers (per 100 people)Internet users (per 100 people)Cost of telephone call to U.S. ($ per 3 minutes)
97The Little Data Book on Private Sector Development 2008
0.73 0.74 2,2760.31 0.32 1,209
9.1 .. 5.7890 1,150 2,0382.5 1.0 7.6
31.1 31.0 11.929.0 24.5 43.58.2 8.0 26.7
39.9 44.5 44.66.1 6.6
182.4 200.296.1 87.9 40.4
110.7 123.9 36.4 .. 104.. 44 53.. 8 10.. 56.0 50.2.. 3.0 3.3.. 39.0 45.8
45 45.. .. 7.6 .. 2.3.. 5.4.. 25.8.. 93.4.. 17.8
11 37 38,1549.4 11.4 3.0
23.8 25.8 33.510.0 1.4 10.9
.. .. –0.9.. .. ..
66.3 73.8 87.862.6 84.8 43.1
.. .. 10.7
.. .. 4.057.1 60.2 81.310.0 6.18.6 12.0 7.2
7.4 .. 65.8.. .. 1,502.. ..
15 53 606.8 21.6 11.4
3.89 .. 2.08
Country data
Lower middle-income group
2000 2006 2006
Latin America & Caribbean Lower middle income
Guyana
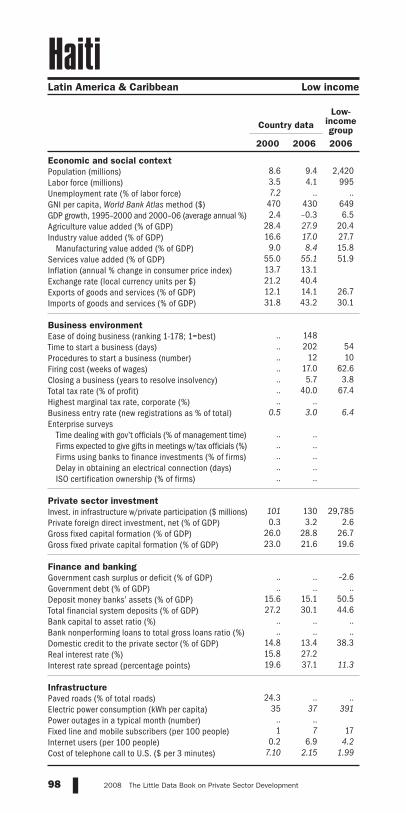
Economic and social contextPopulation (millions)Labor force (millions)Unemployment rate (% of labor force)GNI per capita, World Bank Atlas method ($)GDP growth, 1995–2000 and 2000–06 (average annual %)Agriculture value added (% of GDP)Industry value added (% of GDP)
Manufacturing value added (% of GDP)Services value added (% of GDP)Inflation (annual % change in consumer price index)Exchange rate (local currency units per $)Exports of goods and services (% of GDP)Imports of goods and services (% of GDP) Business environmentEase of doing business (ranking 1-178; 1=best)Time to start a business (days)Procedures to start a business (number)Firing cost (weeks of wages)Closing a business (years to resolve insolvency)Total tax rate (% of profit)Highest marginal tax rate, corporate (%)Business entry rate (new registrations as % of total)Enterprise surveys
Time dealing with gov’t officials (% of management time)Firms expected to give gifts in meetings w/tax officials (%)Firms using banks to finance investments (% of firms)Delay in obtaining an electrical connection (days)ISO certification ownership (% of firms)
Private sector investmentInvest. in infrastructure w/private participation ($ millions)Private foreign direct investment, net (% of GDP)Gross fixed capital formation (% of GDP)Gross fixed private capital formation (% of GDP) Finance and bankingGovernment cash surplus or deficit (% of GDP)Government debt (% of GDP)Deposit money banks’ assets (% of GDP)Total financial system deposits (% of GDP)Bank capital to asset ratio (%)Bank nonperforming loans to total gross loans ratio (%)Domestic credit to the private sector (% of GDP)Real interest rate (%)Interest rate spread (percentage points) Infrastructure Paved roads (% of total roads)Electric power consumption (kWh per capita)Power outages in a typical month (number)Fixed line and mobile subscribers (per 100 people)Internet users (per 100 people)Cost of telephone call to U.S. ($ per 3 minutes)
98 2008 The Little Data Book on Private Sector Development
8.6 9.4 2,4203.5 4.1 9957.2 .. ..
470 430 6492.4 –0.3 6.5
28.4 27.9 20.416.6 17.0 27.79.0 8.4 15.8
55.0 55.1 51.913.7 13.121.2 40.412.1 14.1 26.731.8 43.2 30.1
.. 148.. 202 54.. 12 10.. 17.0 62.6.. 5.7 3.8.. 40.0 67.4.. ..
0.5 3.0 6.4 .. .... .... .... .... ..
101 130 29,7850.3 3.2 2.6
26.0 28.8 26.723.0 21.6 19.6
.. .. –2.6.. .. ..
15.6 15.1 50.527.2 30.1 44.6
.. .. ..
.. .. ..14.8 13.4 38.315.8 27.219.6 37.1 11.3
24.3 .. ..35 37 391
.. ..1 7 17
0.2 6.9 4.27.10 2.15 1.99
Country dataLow-
income group
2000 2006 2006
Latin America & Caribbean Low income
Haiti

Economic and social contextPopulation (millions)Labor force (millions)Unemployment rate (% of labor force)GNI per capita, World Bank Atlas method ($)GDP growth, 1995–2000 and 2000–06 (average annual %)Agriculture value added (% of GDP)Industry value added (% of GDP)
Manufacturing value added (% of GDP)Services value added (% of GDP)Inflation (annual % change in consumer price index)Exchange rate (local currency units per $)Exports of goods and services (% of GDP)Imports of goods and services (% of GDP) Business environmentEase of doing business (ranking 1-178; 1=best)Time to start a business (days)Procedures to start a business (number)Firing cost (weeks of wages)Closing a business (years to resolve insolvency)Total tax rate (% of profit)Highest marginal tax rate, corporate (%)Business entry rate (new registrations as % of total)Enterprise surveys
Time dealing with gov’t officials (% of management time)Firms expected to give gifts in meetings w/tax officials (%)Firms using banks to finance investments (% of firms)Delay in obtaining an electrical connection (days)ISO certification ownership (% of firms)
Private sector investmentInvest. in infrastructure w/private participation ($ millions)Private foreign direct investment, net (% of GDP)Gross fixed capital formation (% of GDP)Gross fixed private capital formation (% of GDP) Finance and bankingGovernment cash surplus or deficit (% of GDP)Government debt (% of GDP)Deposit money banks’ assets (% of GDP)Total financial system deposits (% of GDP)Bank capital to asset ratio (%)Bank nonperforming loans to total gross loans ratio (%)Domestic credit to the private sector (% of GDP)Real interest rate (%)Interest rate spread (percentage points) Infrastructure Paved roads (% of total roads)Electric power consumption (kWh per capita)Power outages in a typical month (number)Fixed line and mobile subscribers (per 100 people)Internet users (per 100 people)Cost of telephone call to U.S. ($ per 3 minutes)
99The Little Data Book on Private Sector Development 2008
Latin America & Caribbean Lower middle income
Country data
Lower middle-income group
2000 2006 2006
6.2 7.0 2,2762.3 3.0 1,2093.9 4.2 5.7
890 1,270 2,0382.8 4.0 7.6
16.2 13.8 11.931.6 31.1 43.519.6 19.7 26.752.2 55.1 44.611.1 5.614.8 18.941.3 40.8 40.455.2 66.5 36.4
.. 121.. 21 53.. 13 10.. 74.0 50.2.. 3.8 3.3.. 51.4 45.8
15 25.. .. 7.6 .. 4.6.. 6.1.. 8.5.. 27.6.. 16.5
127 89 38,1544.7 4.2 3.0
26.1 24.9 33.520.3 20.1 10.9
.. –1.3 –0.9.. .. ..
39.1 47.9 87.838.8 49.2 43.1
8.8 8.4 10.710.6 6.6 4.040.7 49.0 81.315.7 11.710.9 8.1 7.2
20.4 .. 65.8519 626 1,502
.. 3.07 42 60
1.2 4.8 11.43.97 2.52 2.08
Honduras

Economic and social contextPopulation (millions)Labor force (millions)Unemployment rate (% of labor force)GNI per capita, World Bank Atlas method ($)GDP growth, 1995–2000 and 2000–06 (average annual %)Agriculture value added (% of GDP)Industry value added (% of GDP)
Manufacturing value added (% of GDP)Services value added (% of GDP)Inflation (annual % change in consumer price index)Exchange rate (local currency units per $)Exports of goods and services (% of GDP)Imports of goods and services (% of GDP) Business environmentEase of doing business (ranking 1-178; 1=best)Time to start a business (days)Procedures to start a business (number)Firing cost (weeks of wages)Closing a business (years to resolve insolvency)Total tax rate (% of profit)Highest marginal tax rate, corporate (%)Business entry rate (new registrations as % of total)Enterprise surveys
Time dealing with gov’t officials (% of management time)Firms expected to give gifts in meetings w/tax officials (%)Firms using banks to finance investments (% of firms)Delay in obtaining an electrical connection (days)ISO certification ownership (% of firms)
Private sector investmentInvest. in infrastructure w/private participation ($ millions)Private foreign direct investment, net (% of GDP)Gross fixed capital formation (% of GDP)Gross fixed private capital formation (% of GDP) Finance and bankingGovernment cash surplus or deficit (% of GDP)Government debt (% of GDP)Deposit money banks’ assets (% of GDP)Total financial system deposits (% of GDP)Bank capital to asset ratio (%)Bank nonperforming loans to total gross loans ratio (%)Domestic credit to the private sector (% of GDP)Real interest rate (%)Interest rate spread (percentage points) Infrastructure Paved roads (% of total roads)Electric power consumption (kWh per capita)Power outages in a typical month (number)Fixed line and mobile subscribers (per 100 people)Internet users (per 100 people)Cost of telephone call to U.S. ($ per 3 minutes)
100 2008 The Little Data Book on Private Sector Development
6.7 6.9 1,0313.4 3.6 5044.9 5.6 6.2
27,000 29,040 36,6082.6 4.8 2.30.1 0.1 1.5
13.4 9.3 26.25.4 3.4 16.8
86.5 90.6 72.3–3.8 2.07.8 7.8
143.3 205.4 25.6138.8 194.0 26.3
.. 4.. 11 22.. 5 7.. 62.0 34.9.. 1.1 2.0.. 24.4 41.5
16 189.3 13.3 10.1
.. .... .... .... .... .. .. .. 849
36.6 22.6 2.726.4 21.5 20.4
.. .. .. .. .. –1.3.. .. 47.6
164.2 155.5 99.7210.1 250.3 ..
9.0 11.8 6.27.3 1.1 1.1
152.6 139.5 162.016.0 7.9
4.7 5.1 4.4
100.0 100.0 90.95,447 5,878 9,760
.. ..141 193 143
27.8 55.0 59.32.62 0.77 0.77
Country dataHigh-
income group
2000 2006 2006
High income
Hong Kong, China
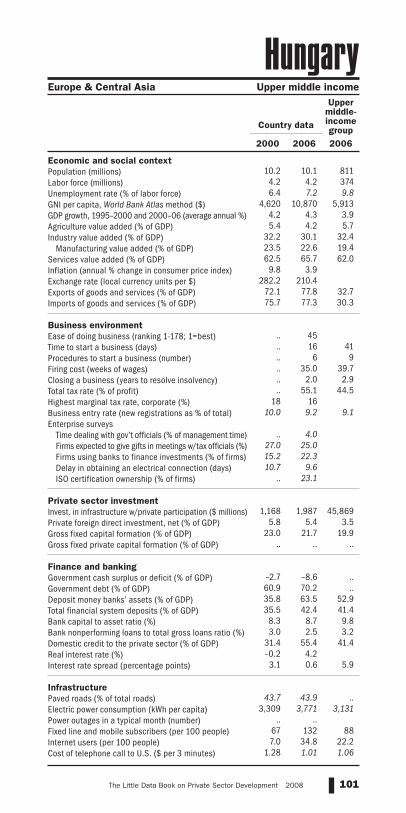
Economic and social contextPopulation (millions)Labor force (millions)Unemployment rate (% of labor force)GNI per capita, World Bank Atlas method ($)GDP growth, 1995–2000 and 2000–06 (average annual %)Agriculture value added (% of GDP)Industry value added (% of GDP)
Manufacturing value added (% of GDP)Services value added (% of GDP)Inflation (annual % change in consumer price index)Exchange rate (local currency units per $)Exports of goods and services (% of GDP)Imports of goods and services (% of GDP) Business environmentEase of doing business (ranking 1-178; 1=best)Time to start a business (days)Procedures to start a business (number)Firing cost (weeks of wages)Closing a business (years to resolve insolvency)Total tax rate (% of profit)Highest marginal tax rate, corporate (%)Business entry rate (new registrations as % of total)Enterprise surveys
Time dealing with gov’t officials (% of management time)Firms expected to give gifts in meetings w/tax officials (%)Firms using banks to finance investments (% of firms)Delay in obtaining an electrical connection (days)ISO certification ownership (% of firms)
Private sector investmentInvest. in infrastructure w/private participation ($ millions)Private foreign direct investment, net (% of GDP)Gross fixed capital formation (% of GDP)Gross fixed private capital formation (% of GDP) Finance and bankingGovernment cash surplus or deficit (% of GDP)Government debt (% of GDP)Deposit money banks’ assets (% of GDP)Total financial system deposits (% of GDP)Bank capital to asset ratio (%)Bank nonperforming loans to total gross loans ratio (%)Domestic credit to the private sector (% of GDP)Real interest rate (%)Interest rate spread (percentage points) Infrastructure Paved roads (% of total roads)Electric power consumption (kWh per capita)Power outages in a typical month (number)Fixed line and mobile subscribers (per 100 people)Internet users (per 100 people)Cost of telephone call to U.S. ($ per 3 minutes)
101The Little Data Book on Private Sector Development 2008
10.2 10.1 8114.2 4.2 3746.4 7.2 9.8
4,620 10,870 5,9134.2 4.3 3.95.4 4.2 5.7
32.2 30.1 32.423.5 22.6 19.462.5 65.7 62.0
9.8 3.9282.2 210.4
72.1 77.8 32.775.7 77.3 30.3
.. 45.. 16 41.. 6 9.. 35.0 39.7.. 2.0 2.9.. 55.1 44.5
18 1610.0 9.2 9.1
.. 4.0
27.0 25.015.2 22.310.7 9.6
.. 23.1
1,168 1,987 45,8695.8 5.4 3.5
23.0 21.7 19.9.. .. ..
–2.7 –8.6 ..60.9 70.2 ..35.8 63.5 52.935.5 42.4 41.4
8.3 8.7 9.83.0 2.5 3.2
31.4 55.4 41.4–0.2 4.23.1 0.6 5.9
43.7 43.9 ..3,309 3,771 3,131
.. ..67 132 887.0 34.8 22.2
1.28 1.01 1.06
Country data
Upper middle-income group
2000 2006 2006
Europe & Central Asia Upper middle income
Hungary
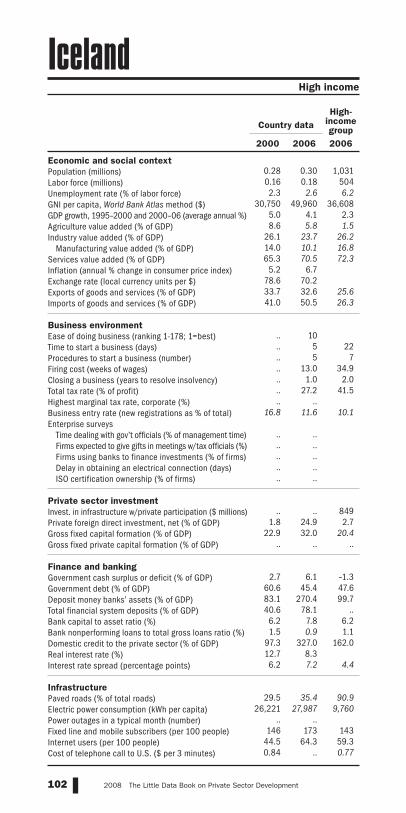
Economic and social contextPopulation (millions)Labor force (millions)Unemployment rate (% of labor force)GNI per capita, World Bank Atlas method ($)GDP growth, 1995–2000 and 2000–06 (average annual %)Agriculture value added (% of GDP)Industry value added (% of GDP)
Manufacturing value added (% of GDP)Services value added (% of GDP)Inflation (annual % change in consumer price index)Exchange rate (local currency units per $)Exports of goods and services (% of GDP)Imports of goods and services (% of GDP) Business environmentEase of doing business (ranking 1-178; 1=best)Time to start a business (days)Procedures to start a business (number)Firing cost (weeks of wages)Closing a business (years to resolve insolvency)Total tax rate (% of profit)Highest marginal tax rate, corporate (%)Business entry rate (new registrations as % of total)Enterprise surveys
Time dealing with gov’t officials (% of management time)Firms expected to give gifts in meetings w/tax officials (%)Firms using banks to finance investments (% of firms)Delay in obtaining an electrical connection (days)ISO certification ownership (% of firms)
Private sector investmentInvest. in infrastructure w/private participation ($ millions)Private foreign direct investment, net (% of GDP)Gross fixed capital formation (% of GDP)Gross fixed private capital formation (% of GDP) Finance and bankingGovernment cash surplus or deficit (% of GDP)Government debt (% of GDP)Deposit money banks’ assets (% of GDP)Total financial system deposits (% of GDP)Bank capital to asset ratio (%)Bank nonperforming loans to total gross loans ratio (%)Domestic credit to the private sector (% of GDP)Real interest rate (%)Interest rate spread (percentage points) Infrastructure Paved roads (% of total roads)Electric power consumption (kWh per capita)Power outages in a typical month (number)Fixed line and mobile subscribers (per 100 people)Internet users (per 100 people)Cost of telephone call to U.S. ($ per 3 minutes)
102 2008 The Little Data Book on Private Sector Development
0.28 0.30 1,0310.16 0.18 5042.3 2.6 6.2
30,750 49,960 36,6085.0 4.1 2.38.6 5.8 1.5
26.1 23.7 26.214.0 10.1 16.865.3 70.5 72.3
5.2 6.778.6 70.233.7 32.6 25.641.0 50.5 26.3
.. 10.. 5 22.. 5 7.. 13.0 34.9.. 1.0 2.0.. 27.2 41.5.. ..
16.8 11.6 10.1 .. .... .... .... .... .. .. .. 849
1.8 24.9 2.722.9 32.0 20.4
.. .. ..
2.7 6.1 –1.360.6 45.4 47.683.1 270.4 99.740.6 78.1 ..6.2 7.8 6.21.5 0.9 1.1
97.3 327.0 162.012.7 8.36.2 7.2 4.4
29.5 35.4 90.926,221 27,987 9,760
.. ..146 173 143
44.5 64.3 59.30.84 .. 0.77
Country dataHigh-
income group
2000 2006 2006
High income
Iceland

Economic and social contextPopulation (millions)Labor force (millions)Unemployment rate (% of labor force)GNI per capita, World Bank Atlas method ($)GDP growth, 1995–2000 and 2000–06 (average annual %)Agriculture value added (% of GDP)Industry value added (% of GDP)
Manufacturing value added (% of GDP)Services value added (% of GDP)Inflation (annual % change in consumer price index)Exchange rate (local currency units per $)Exports of goods and services (% of GDP)Imports of goods and services (% of GDP) Business environmentEase of doing business (ranking 1-178; 1=best)Time to start a business (days)Procedures to start a business (number)Firing cost (weeks of wages)Closing a business (years to resolve insolvency)Total tax rate (% of profit)Highest marginal tax rate, corporate (%)Business entry rate (new registrations as % of total)Enterprise surveys
Time dealing with gov’t officials (% of management time)Firms expected to give gifts in meetings w/tax officials (%)Firms using banks to finance investments (% of firms)Delay in obtaining an electrical connection (days)ISO certification ownership (% of firms)
Private sector investmentInvest. in infrastructure w/private participation ($ millions)Private foreign direct investment, net (% of GDP)Gross fixed capital formation (% of GDP)Gross fixed private capital formation (% of GDP) Finance and bankingGovernment cash surplus or deficit (% of GDP)Government debt (% of GDP)Deposit money banks’ assets (% of GDP)Total financial system deposits (% of GDP)Bank capital to asset ratio (%)Bank nonperforming loans to total gross loans ratio (%)Domestic credit to the private sector (% of GDP)Real interest rate (%)Interest rate spread (percentage points) Infrastructure Paved roads (% of total roads)Electric power consumption (kWh per capita)Power outages in a typical month (number)Fixed line and mobile subscribers (per 100 people)Internet users (per 100 people)Cost of telephone call to U.S. ($ per 3 minutes)
103The Little Data Book on Private Sector Development 2008
1,015.9 1,109.8 2,420
391.7 438.0 9954.3 5.0 ..
450 820 6495.9 7.4 6.5
23.4 17.5 20.426.2 27.9 27.715.6 16.3 15.850.5 54.6 51.9
4.0 5.844.9 45.313.2 23.0 26.714.2 25.8 30.1
.. 120.. 33 54.. 13 10.. 56.0 62.6.. 10.0 3.8.. 70.6 67.4
40 343.8 5.3 6.4
.. 6.7.. 52.3.. 19.4
72.6 29.5.. 22.5
3,068 17,183 29,7850.8 1.9 2.6
22.8 29.5 26.716.3 22.2 19.6
–3.9 –2.8 –2.656.0 60.0 ..41.1 57.1 50.542.6 53.0 44.6
5.7 6.6 ..12.8 3.5 ..28.8 45.0 38.3
8.5 5.0.. .. 11.3
47.5 .. ..402 480 391
.. ..4 19 17
0.5 5.5 4.23.36 1.19 1.99
Country dataLow-
income group
2000 2006 2006
South Asia Low income
India

Economic and social contextPopulation (millions)Labor force (millions)Unemployment rate (% of labor force)GNI per capita, World Bank Atlas method ($)GDP growth, 1995–2000 and 2000–06 (average annual %)Agriculture value added (% of GDP)Industry value added (% of GDP)
Manufacturing value added (% of GDP)Services value added (% of GDP)Inflation (annual % change in consumer price index)Exchange rate (local currency units per $)Exports of goods and services (% of GDP)Imports of goods and services (% of GDP) Business environmentEase of doing business (ranking 1-178; 1=best)Time to start a business (days)Procedures to start a business (number)Firing cost (weeks of wages)Closing a business (years to resolve insolvency)Total tax rate (% of profit)Highest marginal tax rate, corporate (%)Business entry rate (new registrations as % of total)Enterprise surveys
Time dealing with gov’t officials (% of management time)Firms expected to give gifts in meetings w/tax officials (%)Firms using banks to finance investments (% of firms)Delay in obtaining an electrical connection (days)ISO certification ownership (% of firms)
Private sector investmentInvest. in infrastructure w/private participation ($ millions)Private foreign direct investment, net (% of GDP)Gross fixed capital formation (% of GDP)Gross fixed private capital formation (% of GDP) Finance and bankingGovernment cash surplus or deficit (% of GDP)Government debt (% of GDP)Deposit money banks’ assets (% of GDP)Total financial system deposits (% of GDP)Bank capital to asset ratio (%)Bank nonperforming loans to total gross loans ratio (%)Domestic credit to the private sector (% of GDP)Real interest rate (%)Interest rate spread (percentage points) Infrastructure Paved roads (% of total roads)Electric power consumption (kWh per capita)Power outages in a typical month (number)Fixed line and mobile subscribers (per 100 people)Internet users (per 100 people)Cost of telephone call to U.S. ($ per 3 minutes)
104 2008 The Little Data Book on Private Sector Development
206.3 223.0 2,276
97.1 109.2 1,2096.1 10.3 5.7
590 1,420 2,038–0.6 4.9 7.615.6 12.9 11.945.9 47.0 43.527.7 28.0 26.738.5 40.1 44.6
3.7 13.18,421.8 9,159.3
41.0 30.9 40.430.5 26.1 36.4
.. 123.. 105 53.. 12 10.. 108.0 50.2.. 5.5 3.3.. 37.3 45.8
30 303.0 7.6 7.6
.. 4.0.. 11.2.. 13.9.. 14.6.. 22.1
642 4,622 38,154–2.8 1.5 3.019.9 24.0 33.5
.. .. 10.9
–2.5 –1.1 –0.945.2 28.8 ..43.7 32.7 87.844.7 34.5 43.16.0 10.7 10.7
34.4 13.1 4.019.9 24.6 81.3–1.7 2.16.0 4.6 7.2
57.1 55.3 65.8400 509 1,502
.. ..5 35 60
0.9 7.3 11.43.90 2.79 2.08
Country data
Lower middle-income group
2000 2006 2006
East Asia & Pacific Lower middle income
Indonesia

Economic and social contextPopulation (millions)Labor force (millions)Unemployment rate (% of labor force)GNI per capita, World Bank Atlas method ($)GDP growth, 1995–2000 and 2000–06 (average annual %)Agriculture value added (% of GDP)Industry value added (% of GDP)
Manufacturing value added (% of GDP)Services value added (% of GDP)Inflation (annual % change in consumer price index)Exchange rate (local currency units per $)Exports of goods and services (% of GDP)Imports of goods and services (% of GDP) Business environmentEase of doing business (ranking 1-178; 1=best)Time to start a business (days)Procedures to start a business (number)Firing cost (weeks of wages)Closing a business (years to resolve insolvency)Total tax rate (% of profit)Highest marginal tax rate, corporate (%)Business entry rate (new registrations as % of total)Enterprise surveys
Time dealing with gov’t officials (% of management time)Firms expected to give gifts in meetings w/tax officials (%)Firms using banks to finance investments (% of firms)Delay in obtaining an electrical connection (days)ISO certification ownership (% of firms)
Private sector investmentInvest. in infrastructure w/private participation ($ millions)Private foreign direct investment, net (% of GDP)Gross fixed capital formation (% of GDP)Gross fixed private capital formation (% of GDP) Finance and bankingGovernment cash surplus or deficit (% of GDP)Government debt (% of GDP)Deposit money banks’ assets (% of GDP)Total financial system deposits (% of GDP)Bank capital to asset ratio (%)Bank nonperforming loans to total gross loans ratio (%)Domestic credit to the private sector (% of GDP)Real interest rate (%)Interest rate spread (percentage points) Infrastructure Paved roads (% of total roads)Electric power consumption (kWh per capita)Power outages in a typical month (number)Fixed line and mobile subscribers (per 100 people)Internet users (per 100 people)Cost of telephone call to U.S. ($ per 3 minutes)
105The Little Data Book on Private Sector Development 2008
63.9 70.1 2,27622.0 29.1 1,20912.8 11.5 5.7
1,670 2,930 2,0383.7 5.6 7.6
13.7 10.4 11.936.7 44.6 43.513.2 11.8 26.749.5 45.0 44.614.5 11.9
1,764.4 9,170.922.7 41.6 40.417.4 33.6 36.4
.. 135.. 47 53.. 8 10.. 91.0 50.2.. 4.5 3.3.. 47.4 45.8
54 25.. .. 7.6 .. .... .... .... .... .. 5 350 38,154
0.0 0.4 3.026.4 27.3 33.517.6 18.1 10.9
1.8 3.3 –0.9.. .. ..
18.3 26.2 87.831.4 34.6 43.1
.. .. 10.7
.. .. 4.028.3 47.3 81.3
.. 2.7
.. 4.2 7.2
64.8 67.4 65.81,586 2,117 1,502
.. ..16 51 60
1.0 25.7 11.47.65 0.55 2.08
Country data
Lower middle-income group
2000 2006 2006
Middle East & North Africa Lower middle income
Iran, Islamic Rep.
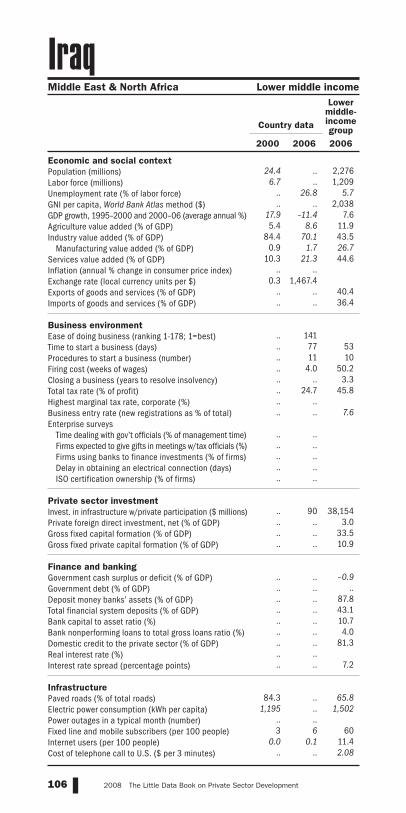
Economic and social contextPopulation (millions)Labor force (millions)Unemployment rate (% of labor force)GNI per capita, World Bank Atlas method ($)GDP growth, 1995–2000 and 2000–06 (average annual %)Agriculture value added (% of GDP)Industry value added (% of GDP)
Manufacturing value added (% of GDP)Services value added (% of GDP)Inflation (annual % change in consumer price index)Exchange rate (local currency units per $)Exports of goods and services (% of GDP)Imports of goods and services (% of GDP) Business environmentEase of doing business (ranking 1-178; 1=best)Time to start a business (days)Procedures to start a business (number)Firing cost (weeks of wages)Closing a business (years to resolve insolvency)Total tax rate (% of profit)Highest marginal tax rate, corporate (%)Business entry rate (new registrations as % of total)Enterprise surveys
Time dealing with gov’t officials (% of management time)Firms expected to give gifts in meetings w/tax officials (%)Firms using banks to finance investments (% of firms)Delay in obtaining an electrical connection (days)ISO certification ownership (% of firms)
Private sector investmentInvest. in infrastructure w/private participation ($ millions)Private foreign direct investment, net (% of GDP)Gross fixed capital formation (% of GDP)Gross fixed private capital formation (% of GDP) Finance and bankingGovernment cash surplus or deficit (% of GDP)Government debt (% of GDP)Deposit money banks’ assets (% of GDP)Total financial system deposits (% of GDP)Bank capital to asset ratio (%)Bank nonperforming loans to total gross loans ratio (%)Domestic credit to the private sector (% of GDP)Real interest rate (%)Interest rate spread (percentage points) Infrastructure Paved roads (% of total roads)Electric power consumption (kWh per capita)Power outages in a typical month (number)Fixed line and mobile subscribers (per 100 people)Internet users (per 100 people)Cost of telephone call to U.S. ($ per 3 minutes)
106 2008 The Little Data Book on Private Sector Development
24.4 .. 2,276
6.7 .. 1,209.. 26.8 5.7.. .. 2,038
17.9 –11.4 7.65.4 8.6 11.9
84.4 70.1 43.50.9 1.7 26.7
10.3 21.3 44.6.. ..
0.3 1,467.4.. .. 40.4.. .. 36.4 .. 141.. 77 53.. 11 10.. 4.0 50.2.. .. 3.3.. 24.7 45.8.. .... .. 7.6 .. .... .... .... .... .. .. 90 38,154.. .. 3.0.. .. 33.5.. .. 10.9 .. .. –0.9.. .. .... .. 87.8.. .. 43.1.. .. 10.7.. .. 4.0.. .. 81.3.. .... .. 7.2
84.3 .. 65.81,195 .. 1,502
.. ..3 6 60
0.0 0.1 11.4.. .. 2.08
Country data
Lower middle-income group
2000 2006 2006
Middle East & North Africa Lower middle income
Iraq

Economic and social contextPopulation (millions)Labor force (millions)Unemployment rate (% of labor force)GNI per capita, World Bank Atlas method ($)GDP growth, 1995–2000 and 2000–06 (average annual %)Agriculture value added (% of GDP)Industry value added (% of GDP)
Manufacturing value added (% of GDP)Services value added (% of GDP)Inflation (annual % change in consumer price index)Exchange rate (local currency units per $)Exports of goods and services (% of GDP)Imports of goods and services (% of GDP) Business environmentEase of doing business (ranking 1-178; 1=best)Time to start a business (days)Procedures to start a business (number)Firing cost (weeks of wages)Closing a business (years to resolve insolvency)Total tax rate (% of profit)Highest marginal tax rate, corporate (%)Business entry rate (new registrations as % of total)Enterprise surveys
Time dealing with gov’t officials (% of management time)Firms expected to give gifts in meetings w/tax officials (%)Firms using banks to finance investments (% of firms)Delay in obtaining an electrical connection (days)ISO certification ownership (% of firms)
Private sector investmentInvest. in infrastructure w/private participation ($ millions)Private foreign direct investment, net (% of GDP)Gross fixed capital formation (% of GDP)Gross fixed private capital formation (% of GDP) Finance and bankingGovernment cash surplus or deficit (% of GDP)Government debt (% of GDP)Deposit money banks’ assets (% of GDP)Total financial system deposits (% of GDP)Bank capital to asset ratio (%)Bank nonperforming loans to total gross loans ratio (%)Domestic credit to the private sector (% of GDP)Real interest rate (%)Interest rate spread (percentage points) Infrastructure Paved roads (% of total roads)Electric power consumption (kWh per capita)Power outages in a typical month (number)Fixed line and mobile subscribers (per 100 people)Internet users (per 100 people)Cost of telephone call to U.S. ($ per 3 minutes)
107The Little Data Book on Private Sector Development 2008
High income
Country dataHigh-
income group
2000 2006 2006
3.8 4.3 1,0311.8 2.1 5044.3 4.3 6.2
23,160 44,830 36,6089.8 5.1 2.33.4 2.1 1.5
42.7 36.1 26.233.7 24.5 16.853.9 61.9 72.3
5.6 3.91.1 0.8
98.4 81.3 25.684.8 68.6 26.3
.. 8.. 13 22.. 4 7.. 24.0 34.9.. 0.4 2.0.. 28.9 41.5
32 139.0 10.7 10.1
.. .... .... .... .... .. .. .. 849
26.5 –0.4 2.724.3 27.0 20.4
.. .. ..
4.9 2.7 –1.340.2 28.2 47.688.6 .. 99.768.7 .. ..6.5 4.3 6.21.0 0.7 1.1
105.8 183.4 162.0–0.7 –0.84.7 2.6 4.4
100.0 100.0 90.95,796 6,234 9,760
.. ..113 159 14317.8 33.7 59.30.80 0.71 0.77
Ireland

Economic and social contextPopulation (millions)Labor force (millions)Unemployment rate (% of labor force)GNI per capita, World Bank Atlas method ($)GDP growth, 1995–2000 and 2000–06 (average annual %)Agriculture value added (% of GDP)Industry value added (% of GDP)
Manufacturing value added (% of GDP)Services value added (% of GDP)Inflation (annual % change in consumer price index)Exchange rate (local currency units per $)Exports of goods and services (% of GDP)Imports of goods and services (% of GDP) Business environmentEase of doing business (ranking 1-178; 1=best)Time to start a business (days)Procedures to start a business (number)Firing cost (weeks of wages)Closing a business (years to resolve insolvency)Total tax rate (% of profit)Highest marginal tax rate, corporate (%)Business entry rate (new registrations as % of total)Enterprise surveys
Time dealing with gov’t officials (% of management time)Firms expected to give gifts in meetings w/tax officials (%)Firms using banks to finance investments (% of firms)Delay in obtaining an electrical connection (days)ISO certification ownership (% of firms)
Private sector investmentInvest. in infrastructure w/private participation ($ millions)Private foreign direct investment, net (% of GDP)Gross fixed capital formation (% of GDP)Gross fixed private capital formation (% of GDP) Finance and bankingGovernment cash surplus or deficit (% of GDP)Government debt (% of GDP)Deposit money banks’ assets (% of GDP)Total financial system deposits (% of GDP)Bank capital to asset ratio (%)Bank nonperforming loans to total gross loans ratio (%)Domestic credit to the private sector (% of GDP)Real interest rate (%)Interest rate spread (percentage points) Infrastructure Paved roads (% of total roads)Electric power consumption (kWh per capita)Power outages in a typical month (number)Fixed line and mobile subscribers (per 100 people)Internet users (per 100 people)Cost of telephone call to U.S. ($ per 3 minutes)
108 2008 The Little Data Book on Private Sector Development
0.07 0.08 1,031
.. .. 5041.6 .. 6.2
23,170 40,600 36,60810.4 5.8 2.3
.. .. 1.5
.. .. 26.2
.. .. 16.8
.. .. 72.3
.. ..0.7 0.5
.. .. 25.6
.. .. 26.3 .. .... .. 22.. .. 7.. .. 34.9.. .. 2.0.. .. 41.5.. .... .. 10.1 .. .... .... .... .... .. .. .. 849.. .. 2.7.. .. 20.4.. .. .. .. .. –1.3.. .. 47.6.. .. 99.7.. .. .... .. 6.2.. .. 1.1.. .. 162.0.. .... .. 4.4 .. .. 90.9.. .. 9,760.. .... .. 143.. .. 59.3.. .. 0.77
Country dataHigh-
income group
2000 2006 2006
High income
Isle of Man

Economic and social contextPopulation (millions)Labor force (millions)Unemployment rate (% of labor force)GNI per capita, World Bank Atlas method ($)GDP growth, 1995–2000 and 2000–06 (average annual %)Agriculture value added (% of GDP)Industry value added (% of GDP)
Manufacturing value added (% of GDP)Services value added (% of GDP)Inflation (annual % change in consumer price index)Exchange rate (local currency units per $)Exports of goods and services (% of GDP)Imports of goods and services (% of GDP) Business environmentEase of doing business (ranking 1-178; 1=best)Time to start a business (days)Procedures to start a business (number)Firing cost (weeks of wages)Closing a business (years to resolve insolvency)Total tax rate (% of profit)Highest marginal tax rate, corporate (%)Business entry rate (new registrations as % of total)Enterprise surveys
Time dealing with gov’t officials (% of management time)Firms expected to give gifts in meetings w/tax officials (%)Firms using banks to finance investments (% of firms)Delay in obtaining an electrical connection (days)ISO certification ownership (% of firms)
Private sector investmentInvest. in infrastructure w/private participation ($ millions)Private foreign direct investment, net (% of GDP)Gross fixed capital formation (% of GDP)Gross fixed private capital formation (% of GDP) Finance and bankingGovernment cash surplus or deficit (% of GDP)Government debt (% of GDP)Deposit money banks’ assets (% of GDP)Total financial system deposits (% of GDP)Bank capital to asset ratio (%)Bank nonperforming loans to total gross loans ratio (%)Domestic credit to the private sector (% of GDP)Real interest rate (%)Interest rate spread (percentage points) Infrastructure Paved roads (% of total roads)Electric power consumption (kWh per capita)Power outages in a typical month (number)Fixed line and mobile subscribers (per 100 people)Internet users (per 100 people)Cost of telephone call to U.S. ($ per 3 minutes)
109The Little Data Book on Private Sector Development 2008
High income
Country dataHigh-
income group
2000 2006 2006
6.3 7.0 1,0312.5 2.8 5048.8 9.0 6.2
17,890 20,170 36,6084.4 2.6 2.3
.. .. 1.5
.. .. 26.2
.. .. 16.8
.. .. 72.31.1 2.14.1 4.5
38.2 44.5 25.638.5 43.8 26.3
.. 29.. 34 22.. 5 7.. 91.0 34.9.. 4.0 2.0.. 36.0 41.5
36 315.0 3.9 10.1
.. .... .... .... .... .. .. .. 849
4.2 10.2 2.719.1 17.3 20.4
.. .. ..
–2.1 –1.6 –1.3.. .. 47.6
85.5 97.5 99.778.0 87.2 ..
7.3 5.9 6.26.9 1.9 1.1
79.2 89.6 162.011.5 5.04.2 3.2 4.4
100.0 100.0 90.96,372 6,759 9,760
.. ..117 162 143
20.2 26.9 59.33.30 0.59 0.77
Israel

Economic and social contextPopulation (millions)Labor force (millions)Unemployment rate (% of labor force)GNI per capita, World Bank Atlas method ($)GDP growth, 1995–2000 and 2000–06 (average annual %)Agriculture value added (% of GDP)Industry value added (% of GDP)
Manufacturing value added (% of GDP)Services value added (% of GDP)Inflation (annual % change in consumer price index)Exchange rate (local currency units per $)Exports of goods and services (% of GDP)Imports of goods and services (% of GDP) Business environmentEase of doing business (ranking 1-178; 1=best)Time to start a business (days)Procedures to start a business (number)Firing cost (weeks of wages)Closing a business (years to resolve insolvency)Total tax rate (% of profit)Highest marginal tax rate, corporate (%)Business entry rate (new registrations as % of total)Enterprise surveys
Time dealing with gov’t officials (% of management time)Firms expected to give gifts in meetings w/tax officials (%)Firms using banks to finance investments (% of firms)Delay in obtaining an electrical connection (days)ISO certification ownership (% of firms)
Private sector investmentInvest. in infrastructure w/private participation ($ millions)Private foreign direct investment, net (% of GDP)Gross fixed capital formation (% of GDP)Gross fixed private capital formation (% of GDP) Finance and bankingGovernment cash surplus or deficit (% of GDP)Government debt (% of GDP)Deposit money banks’ assets (% of GDP)Total financial system deposits (% of GDP)Bank capital to asset ratio (%)Bank nonperforming loans to total gross loans ratio (%)Domestic credit to the private sector (% of GDP)Real interest rate (%)Interest rate spread (percentage points) Infrastructure Paved roads (% of total roads)Electric power consumption (kWh per capita)Power outages in a typical month (number)Fixed line and mobile subscribers (per 100 people)Internet users (per 100 people)Cost of telephone call to U.S. ($ per 3 minutes)
110 2008 The Little Data Book on Private Sector Development
56.9 58.8 1,03123.5 24.8 50410.5 7.7 6.2
20,900 31,990 36,6081.9 0.7 2.32.8 2.1 1.5
28.4 26.6 26.221.0 18.1 16.868.8 71.4 72.3
2.5 2.11.1 0.8
27.1 27.8 25.626.1 28.7 26.3
.. 53.. 13 22.. 9 7.. 2.0 34.9.. 1.8 2.0.. 76.2 41.5
36 336.8 6.2 10.1
.. .... .... .... .... .. .. .. 849
1.2 2.1 2.720.3 20.8 20.4
.. .. ..
–0.7 –3.3 –1.3119.4 109.8 47.6
74.8 .. 99.742.2 .. ..
7.0 7.1 6.27.8 5.3 1.1
76.0 95.6 162.04.9 3.85.2 4.9 4.4
100.0 100.0 90.95,299 5,669 9,760
.. ..122 165 143
23.2 49.0 59.30.81 0.79 0.77
Country dataHigh-
income group
2000 2006 2006
High income
Italy

Economic and social contextPopulation (millions)Labor force (millions)Unemployment rate (% of labor force)GNI per capita, World Bank Atlas method ($)GDP growth, 1995–2000 and 2000–06 (average annual %)Agriculture value added (% of GDP)Industry value added (% of GDP)
Manufacturing value added (% of GDP)Services value added (% of GDP)Inflation (annual % change in consumer price index)Exchange rate (local currency units per $)Exports of goods and services (% of GDP)Imports of goods and services (% of GDP) Business environmentEase of doing business (ranking 1-178; 1=best)Time to start a business (days)Procedures to start a business (number)Firing cost (weeks of wages)Closing a business (years to resolve insolvency)Total tax rate (% of profit)Highest marginal tax rate, corporate (%)Business entry rate (new registrations as % of total)Enterprise surveys
Time dealing with gov’t officials (% of management time)Firms expected to give gifts in meetings w/tax officials (%)Firms using banks to finance investments (% of firms)Delay in obtaining an electrical connection (days)ISO certification ownership (% of firms)
Private sector investmentInvest. in infrastructure w/private participation ($ millions)Private foreign direct investment, net (% of GDP)Gross fixed capital formation (% of GDP)Gross fixed private capital formation (% of GDP) Finance and bankingGovernment cash surplus or deficit (% of GDP)Government debt (% of GDP)Deposit money banks’ assets (% of GDP)Total financial system deposits (% of GDP)Bank capital to asset ratio (%)Bank nonperforming loans to total gross loans ratio (%)Domestic credit to the private sector (% of GDP)Real interest rate (%)Interest rate spread (percentage points) Infrastructure Paved roads (% of total roads)Electric power consumption (kWh per capita)Power outages in a typical month (number)Fixed line and mobile subscribers (per 100 people)Internet users (per 100 people)Cost of telephone call to U.S. ($ per 3 minutes)
111The Little Data Book on Private Sector Development 2008
Latin America & Caribbean Lower middle income
Country data
Lower middle-income group
2000 2006 2006
2.6 2.7 2,2761.2 1.2 1,209
15.5 10.9 5.72,930 3,560 2,038
–0.1 1.8 7.66.7 5.9 11.9
31.3 32.8 43.513.7 12.7 26.762.0 61.3 44.68.2 8.6
43.0 65.742.6 45.8 40.453.9 63.0 36.4
.. 63.. 8 53.. 6 10.. 61.0 50.2.. 1.1 3.3.. 51.3 45.8
33 33.. .. 7.6 .. 6.3.. 4.9.. 10.6.. 6.9.. 16.4
546 180 38,1545.8 8.8 3.0
26.4 33.0 33.523.6 29.3 10.9
–2.6 0.3 –0.9111.0 140.1 ..40.9 46.7 87.837.2 45.7 43.19.2 8.7 10.7
11.0 2.6 4.028.9 27.9 81.310.7 10.711.7 10.6 7.2
70.1 73.9 65.82,321 2,474 1,502
.. ..33 118 603.1 46.4 11.4
5.20 0.87 2.08
Jamaica
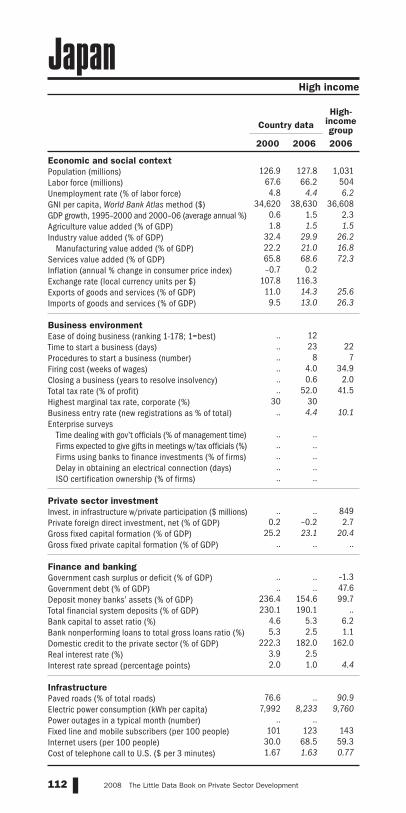
Economic and social contextPopulation (millions)Labor force (millions)Unemployment rate (% of labor force)GNI per capita, World Bank Atlas method ($)GDP growth, 1995–2000 and 2000–06 (average annual %)Agriculture value added (% of GDP)Industry value added (% of GDP)
Manufacturing value added (% of GDP)Services value added (% of GDP)Inflation (annual % change in consumer price index)Exchange rate (local currency units per $)Exports of goods and services (% of GDP)Imports of goods and services (% of GDP) Business environmentEase of doing business (ranking 1-178; 1=best)Time to start a business (days)Procedures to start a business (number)Firing cost (weeks of wages)Closing a business (years to resolve insolvency)Total tax rate (% of profit)Highest marginal tax rate, corporate (%)Business entry rate (new registrations as % of total)Enterprise surveys
Time dealing with gov’t officials (% of management time)Firms expected to give gifts in meetings w/tax officials (%)Firms using banks to finance investments (% of firms)Delay in obtaining an electrical connection (days)ISO certification ownership (% of firms)
Private sector investmentInvest. in infrastructure w/private participation ($ millions)Private foreign direct investment, net (% of GDP)Gross fixed capital formation (% of GDP)Gross fixed private capital formation (% of GDP) Finance and bankingGovernment cash surplus or deficit (% of GDP)Government debt (% of GDP)Deposit money banks’ assets (% of GDP)Total financial system deposits (% of GDP)Bank capital to asset ratio (%)Bank nonperforming loans to total gross loans ratio (%)Domestic credit to the private sector (% of GDP)Real interest rate (%)Interest rate spread (percentage points) Infrastructure Paved roads (% of total roads)Electric power consumption (kWh per capita)Power outages in a typical month (number)Fixed line and mobile subscribers (per 100 people)Internet users (per 100 people)Cost of telephone call to U.S. ($ per 3 minutes)
112 2008 The Little Data Book on Private Sector Development
126.9 127.8 1,031
67.6 66.2 5044.8 4.4 6.2
34,620 38,630 36,6080.6 1.5 2.31.8 1.5 1.5
32.4 29.9 26.222.2 21.0 16.865.8 68.6 72.3–0.7 0.2
107.8 116.311.0 14.3 25.69.5 13.0 26.3
.. 12.. 23 22.. 8 7.. 4.0 34.9.. 0.6 2.0.. 52.0 41.5
30 30.. 4.4 10.1 .. .... .... .... .... .. .. .. 849
0.2 –0.2 2.725.2 23.1 20.4
.. .. .. .. .. –1.3.. .. 47.6
236.4 154.6 99.7230.1 190.1 ..
4.6 5.3 6.25.3 2.5 1.1
222.3 182.0 162.03.9 2.52.0 1.0 4.4
76.6 .. 90.97,992 8,233 9,760
.. ..101 123 143
30.0 68.5 59.31.67 1.63 0.77
Country dataHigh-
income group
2000 2006 2006
High income
Japan

Economic and social contextPopulation (millions)Labor force (millions)Unemployment rate (% of labor force)GNI per capita, World Bank Atlas method ($)GDP growth, 1995–2000 and 2000–06 (average annual %)Agriculture value added (% of GDP)Industry value added (% of GDP)
Manufacturing value added (% of GDP)Services value added (% of GDP)Inflation (annual % change in consumer price index)Exchange rate (local currency units per $)Exports of goods and services (% of GDP)Imports of goods and services (% of GDP) Business environmentEase of doing business (ranking 1-178; 1=best)Time to start a business (days)Procedures to start a business (number)Firing cost (weeks of wages)Closing a business (years to resolve insolvency)Total tax rate (% of profit)Highest marginal tax rate, corporate (%)Business entry rate (new registrations as % of total)Enterprise surveys
Time dealing with gov’t officials (% of management time)Firms expected to give gifts in meetings w/tax officials (%)Firms using banks to finance investments (% of firms)Delay in obtaining an electrical connection (days)ISO certification ownership (% of firms)
Private sector investmentInvest. in infrastructure w/private participation ($ millions)Private foreign direct investment, net (% of GDP)Gross fixed capital formation (% of GDP)Gross fixed private capital formation (% of GDP) Finance and bankingGovernment cash surplus or deficit (% of GDP)Government debt (% of GDP)Deposit money banks’ assets (% of GDP)Total financial system deposits (% of GDP)Bank capital to asset ratio (%)Bank nonperforming loans to total gross loans ratio (%)Domestic credit to the private sector (% of GDP)Real interest rate (%)Interest rate spread (percentage points) Infrastructure Paved roads (% of total roads)Electric power consumption (kWh per capita)Power outages in a typical month (number)Fixed line and mobile subscribers (per 100 people)Internet users (per 100 people)Cost of telephone call to U.S. ($ per 3 minutes)
113The Little Data Book on Private Sector Development 2008
4.8 5.5 2,2761.5 1.9 1,209
15.8 12.4 5.71,790 2,650 2,038
3.2 6.1 7.62.3 3.1 11.9
25.5 29.5 43.515.7 19.2 26.772.1 67.4 44.6
0.7 6.30.7 0.7
41.8 54.6 40.468.5 92.0 36.4
.. 80.. 14 53.. 10 10.. 4.0 50.2.. 4.3 3.3.. 31.1 45.8.. ..
5.7 7.5 7.6 .. 6.7.. 0.9.. 8.6.. 47.1.. 15.5
584 364 38,1549.6 22.8 3.0
21.1 26.8 33.511.9 18.6 10.9
–2.0 –3.9 –0.993.7 77.5 ..86.4 108.7 87.885.7 111.3 43.1
7.0 10.7 10.718.4 4.3 4.077.8 98.0 81.312.2 2.3
4.8 3.6 7.2
100.0 100.0 65.81,377 1,676 1,502
.. 2.621 90 602.7 14.4 11.4
2.86 1.44 2.08
Country data
Lower middle-income group
2000 2006 2006
Middle East & North Africa Lower middle income
Jordan

Economic and social contextPopulation (millions)Labor force (millions)Unemployment rate (% of labor force)GNI per capita, World Bank Atlas method ($)GDP growth, 1995–2000 and 2000–06 (average annual %)Agriculture value added (% of GDP)Industry value added (% of GDP)
Manufacturing value added (% of GDP)Services value added (% of GDP)Inflation (annual % change in consumer price index)Exchange rate (local currency units per $)Exports of goods and services (% of GDP)Imports of goods and services (% of GDP) Business environmentEase of doing business (ranking 1-178; 1=best)Time to start a business (days)Procedures to start a business (number)Firing cost (weeks of wages)Closing a business (years to resolve insolvency)Total tax rate (% of profit)Highest marginal tax rate, corporate (%)Business entry rate (new registrations as % of total)Enterprise surveys
Time dealing with gov’t officials (% of management time)Firms expected to give gifts in meetings w/tax officials (%)Firms using banks to finance investments (% of firms)Delay in obtaining an electrical connection (days)ISO certification ownership (% of firms)
Private sector investmentInvest. in infrastructure w/private participation ($ millions)Private foreign direct investment, net (% of GDP)Gross fixed capital formation (% of GDP)Gross fixed private capital formation (% of GDP) Finance and bankingGovernment cash surplus or deficit (% of GDP)Government debt (% of GDP)Deposit money banks’ assets (% of GDP)Total financial system deposits (% of GDP)Bank capital to asset ratio (%)Bank nonperforming loans to total gross loans ratio (%)Domestic credit to the private sector (% of GDP)Real interest rate (%)Interest rate spread (percentage points) Infrastructure Paved roads (% of total roads)Electric power consumption (kWh per capita)Power outages in a typical month (number)Fixed line and mobile subscribers (per 100 people)Internet users (per 100 people)Cost of telephone call to U.S. ($ per 3 minutes)
114 2008 The Little Data Book on Private Sector Development
14.9 15.3 811
7.5 8.1 37412.8 7.8 9.8
1,270 3,870 5,9131.9 10.1 3.98.7 5.9 5.7
40.5 42.1 32.417.7 12.4 19.450.8 52.0 62.013.2 8.6
142.1 126.156.6 51.1 32.749.1 40.4 30.3
.. 71.. 21 41.. 8 9.. 9.0 39.7.. 3.3 2.9.. 36.7 44.5
30 30.. 10.3 9.1 .. 3.1
55.0 55.76.4 15.47.2 13.9
.. 9.9
475 635 45,8697.0 7.6 3.5
17.3 29.1 19.916.5 24.6 ..
0.1 1.6 ..21.6 7.1 ..10.2 39.0 52.9
8.7 23.1 41.413.6 8.9 9.8
.. 4.8 3.211.2 47.8 41.4
.. ..
.. .. 5.9
86.5 84.0 ..2,650 3,206 3,131
.. ..14 70 880.7 8.1 22.2
2.76 .. 1.06
Country data
Upper middle-income group
2000 2006 2006
Europe & Central Asia Upper middle income
Kazakhstan

Economic and social contextPopulation (millions)Labor force (millions)Unemployment rate (% of labor force)GNI per capita, World Bank Atlas method ($)GDP growth, 1995–2000 and 2000–06 (average annual %)Agriculture value added (% of GDP)Industry value added (% of GDP)
Manufacturing value added (% of GDP)Services value added (% of GDP)Inflation (annual % change in consumer price index)Exchange rate (local currency units per $)Exports of goods and services (% of GDP)Imports of goods and services (% of GDP) Business environmentEase of doing business (ranking 1-178; 1=best)Time to start a business (days)Procedures to start a business (number)Firing cost (weeks of wages)Closing a business (years to resolve insolvency)Total tax rate (% of profit)Highest marginal tax rate, corporate (%)Business entry rate (new registrations as % of total)Enterprise surveys
Time dealing with gov’t officials (% of management time)Firms expected to give gifts in meetings w/tax officials (%)Firms using banks to finance investments (% of firms)Delay in obtaining an electrical connection (days)ISO certification ownership (% of firms)
Private sector investmentInvest. in infrastructure w/private participation ($ millions)Private foreign direct investment, net (% of GDP)Gross fixed capital formation (% of GDP)Gross fixed private capital formation (% of GDP) Finance and bankingGovernment cash surplus or deficit (% of GDP)Government debt (% of GDP)Deposit money banks’ assets (% of GDP)Total financial system deposits (% of GDP)Bank capital to asset ratio (%)Bank nonperforming loans to total gross loans ratio (%)Domestic credit to the private sector (% of GDP)Real interest rate (%)Interest rate spread (percentage points) Infrastructure Paved roads (% of total roads)Electric power consumption (kWh per capita)Power outages in a typical month (number)Fixed line and mobile subscribers (per 100 people)Internet users (per 100 people)Cost of telephone call to U.S. ($ per 3 minutes)
115The Little Data Book on Private Sector Development 2008
Sub-Saharan Africa Low income
Country dataLow-
income group
2000 2006 2006
31.3 36.6 2,42014.0 16.7 9959.8 .. ..
420 580 6492.1 3.9 6.5
32.4 27.1 20.416.9 18.8 27.711.6 11.5 15.850.7 54.1 51.910.0 14.576.2 72.121.6 26.2 26.729.6 36.0 30.1
.. 72.. 44 54.. 12 10.. 47.0 62.6.. 4.5 3.8.. 50.9 67.4
30 304.7 5.9 6.4
.. 11.7.. 37.3.. 25.7.. 51.3.. ..
130 1,140 29,7850.9 0.2 2.6
16.7 18.8 26.712.2 14.0 19.6
2.0 1.5 –2.652.6 .. ..33.7 33.9 50.531.8 34.0 44.612.9 .. ..33.3 5.2 ..28.4 25.8 38.315.3 6.114.2 8.5 11.3
12.1 14.1 ..110 138 391
.. ..1 19 17
0.3 7.6 4.27.35 3.00 1.99
Kenya

Economic and social contextPopulation (millions)Labor force (millions)Unemployment rate (% of labor force)GNI per capita, World Bank Atlas method ($)GDP growth, 1995–2000 and 2000–06 (average annual %)Agriculture value added (% of GDP)Industry value added (% of GDP)
Manufacturing value added (% of GDP)Services value added (% of GDP)Inflation (annual % change in consumer price index)Exchange rate (local currency units per $)Exports of goods and services (% of GDP)Imports of goods and services (% of GDP) Business environmentEase of doing business (ranking 1-178; 1=best)Time to start a business (days)Procedures to start a business (number)Firing cost (weeks of wages)Closing a business (years to resolve insolvency)Total tax rate (% of profit)Highest marginal tax rate, corporate (%)Business entry rate (new registrations as % of total)Enterprise surveys
Time dealing with gov’t officials (% of management time)Firms expected to give gifts in meetings w/tax officials (%)Firms using banks to finance investments (% of firms)Delay in obtaining an electrical connection (days)ISO certification ownership (% of firms)
Private sector investmentInvest. in infrastructure w/private participation ($ millions)Private foreign direct investment, net (% of GDP)Gross fixed capital formation (% of GDP)Gross fixed private capital formation (% of GDP) Finance and bankingGovernment cash surplus or deficit (% of GDP)Government debt (% of GDP)Deposit money banks’ assets (% of GDP)Total financial system deposits (% of GDP)Bank capital to asset ratio (%)Bank nonperforming loans to total gross loans ratio (%)Domestic credit to the private sector (% of GDP)Real interest rate (%)Interest rate spread (percentage points) Infrastructure Paved roads (% of total roads)Electric power consumption (kWh per capita)Power outages in a typical month (number)Fixed line and mobile subscribers (per 100 people)Internet users (per 100 people)Cost of telephone call to U.S. ($ per 3 minutes)
116 2008 The Little Data Book on Private Sector Development
0.09 0.10 2,276
.. .. 1,209
.. .. 5.71,030 1,240 2,038
6.4 1.4 7.67.0 7.1 11.99.7 6.6 43.50.9 0.9 26.7
83.3 86.4 44.6.. ..
1.7 1.39.6 14.6 40.4
65.2 118.7 36.4 .. 73.. 21 53.. 6 10.. 4.0 50.2.. .. 3.3.. 31.8 45.8.. .... .. 7.6 .. .... .... .... .... .. .. .. 38,154.. .. 3.0.. .. 33.5.. .. 10.9 .. .. –0.9.. .. .... .. 87.8.. .. 43.1.. .. 10.7.. .. 4.0.. .. 81.3.. .... .. 7.2 .. .. 65.8.. .. 1,502.. ..4 .. 60
1.7 2.0 11.46.98 8.82 2.08
Country data
Lower middle-income group
2000 2006 2006
East Asia & Pacific Lower middle income
Kiribati
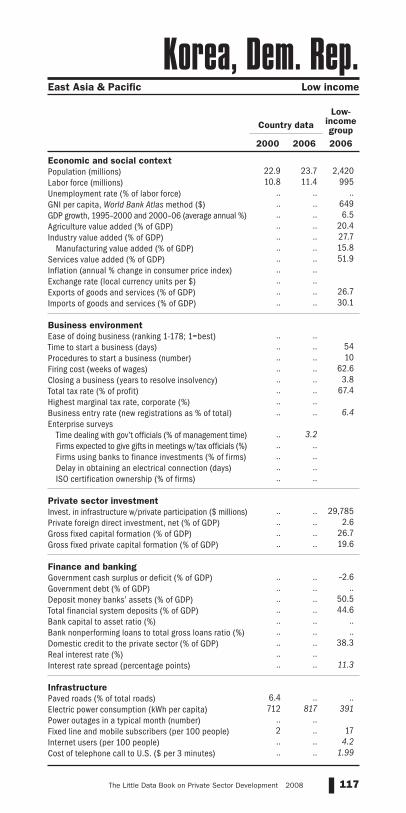
Economic and social contextPopulation (millions)Labor force (millions)Unemployment rate (% of labor force)GNI per capita, World Bank Atlas method ($)GDP growth, 1995–2000 and 2000–06 (average annual %)Agriculture value added (% of GDP)Industry value added (% of GDP)
Manufacturing value added (% of GDP)Services value added (% of GDP)Inflation (annual % change in consumer price index)Exchange rate (local currency units per $)Exports of goods and services (% of GDP)Imports of goods and services (% of GDP) Business environmentEase of doing business (ranking 1-178; 1=best)Time to start a business (days)Procedures to start a business (number)Firing cost (weeks of wages)Closing a business (years to resolve insolvency)Total tax rate (% of profit)Highest marginal tax rate, corporate (%)Business entry rate (new registrations as % of total)Enterprise surveys
Time dealing with gov’t officials (% of management time)Firms expected to give gifts in meetings w/tax officials (%)Firms using banks to finance investments (% of firms)Delay in obtaining an electrical connection (days)ISO certification ownership (% of firms)
Private sector investmentInvest. in infrastructure w/private participation ($ millions)Private foreign direct investment, net (% of GDP)Gross fixed capital formation (% of GDP)Gross fixed private capital formation (% of GDP) Finance and bankingGovernment cash surplus or deficit (% of GDP)Government debt (% of GDP)Deposit money banks’ assets (% of GDP)Total financial system deposits (% of GDP)Bank capital to asset ratio (%)Bank nonperforming loans to total gross loans ratio (%)Domestic credit to the private sector (% of GDP)Real interest rate (%)Interest rate spread (percentage points) Infrastructure Paved roads (% of total roads)Electric power consumption (kWh per capita)Power outages in a typical month (number)Fixed line and mobile subscribers (per 100 people)Internet users (per 100 people)Cost of telephone call to U.S. ($ per 3 minutes)
117The Little Data Book on Private Sector Development 2008
East Asia & Pacific Low income
Country dataLow-
income group
2000 2006 2006
22.9 23.7 2,42010.8 11.4 995
.. .. ..
.. .. 649
.. .. 6.5
.. .. 20.4
.. .. 27.7
.. .. 15.8
.. .. 51.9
.. ..
.. ..
.. .. 26.7
.. .. 30.1 .. .... .. 54.. .. 10.. .. 62.6.. .. 3.8.. .. 67.4.. .... .. 6.4 .. 3.2.. .... .... .... .. .. .. 29,785.. .. 2.6.. .. 26.7.. .. 19.6 .. .. –2.6.. .. .... .. 50.5.. .. 44.6.. .. .... .. .... .. 38.3.. .... .. 11.3
6.4 .. ..712 817 391
.. ..2 .. 17.. .. 4.2.. .. 1.99
Korea, Dem. Rep.

Economic and social contextPopulation (millions)Labor force (millions)Unemployment rate (% of labor force)GNI per capita, World Bank Atlas method ($)GDP growth, 1995–2000 and 2000–06 (average annual %)Agriculture value added (% of GDP)Industry value added (% of GDP)
Manufacturing value added (% of GDP)Services value added (% of GDP)Inflation (annual % change in consumer price index)Exchange rate (local currency units per $)Exports of goods and services (% of GDP)Imports of goods and services (% of GDP) Business environmentEase of doing business (ranking 1-178; 1=best)Time to start a business (days)Procedures to start a business (number)Firing cost (weeks of wages)Closing a business (years to resolve insolvency)Total tax rate (% of profit)Highest marginal tax rate, corporate (%)Business entry rate (new registrations as % of total)Enterprise surveys
Time dealing with gov’t officials (% of management time)Firms expected to give gifts in meetings w/tax officials (%)Firms using banks to finance investments (% of firms)Delay in obtaining an electrical connection (days)ISO certification ownership (% of firms)
Private sector investmentInvest. in infrastructure w/private participation ($ millions)Private foreign direct investment, net (% of GDP)Gross fixed capital formation (% of GDP)Gross fixed private capital formation (% of GDP) Finance and bankingGovernment cash surplus or deficit (% of GDP)Government debt (% of GDP)Deposit money banks’ assets (% of GDP)Total financial system deposits (% of GDP)Bank capital to asset ratio (%)Bank nonperforming loans to total gross loans ratio (%)Domestic credit to the private sector (% of GDP)Real interest rate (%)Interest rate spread (percentage points) Infrastructure Paved roads (% of total roads)Electric power consumption (kWh per capita)Power outages in a typical month (number)Fixed line and mobile subscribers (per 100 people)Internet users (per 100 people)Cost of telephone call to U.S. ($ per 3 minutes)
118 2008 The Little Data Book on Private Sector Development
47.0 48.4 1,03122.6 24.5 504
4.4 3.7 6.29,800 17,690 36,608
3.5 4.6 2.34.9 3.2 1.5
40.7 39.6 26.229.4 27.8 16.854.4 57.2 72.3
2.3 2.21,131.0 954.8
40.8 43.2 25.637.7 42.1 26.3
.. 30.. 17 22.. 10 7.. 91.0 34.9.. 1.5 2.0.. 34.9 41.5
28 25.. .. 10.1 .. 3.2.. 21.3.. 11.5.. 3.9.. 17.6 .. .. 849
1.8 0.4 2.731.1 29.0 20.4
.. .. ..
4.6 0.7 –1.39.6 .. 47.6
76.5 101.5 99.760.8 66.1 ..
4.6 9.2 6.28.9 0.8 1.1
91.1 102.0 162.07.8 6.40.6 1.5 4.4
74.5 76.8 90.95,264 7,779 9,760
.. ..112 139 143
40.5 70.5 59.31.93 0.76 0.77
Country dataHigh-
income group
2000 2006 2006
High income
Korea, Rep.

Economic and social contextPopulation (millions)Labor force (millions)Unemployment rate (% of labor force)GNI per capita, World Bank Atlas method ($)GDP growth, 1995–2000 and 2000–06 (average annual %)Agriculture value added (% of GDP)Industry value added (% of GDP)
Manufacturing value added (% of GDP)Services value added (% of GDP)Inflation (annual % change in consumer price index)Exchange rate (local currency units per $)Exports of goods and services (% of GDP)Imports of goods and services (% of GDP) Business environmentEase of doing business (ranking 1-178; 1=best)Time to start a business (days)Procedures to start a business (number)Firing cost (weeks of wages)Closing a business (years to resolve insolvency)Total tax rate (% of profit)Highest marginal tax rate, corporate (%)Business entry rate (new registrations as % of total)Enterprise surveys
Time dealing with gov’t officials (% of management time)Firms expected to give gifts in meetings w/tax officials (%)Firms using banks to finance investments (% of firms)Delay in obtaining an electrical connection (days)ISO certification ownership (% of firms)
Private sector investmentInvest. in infrastructure w/private participation ($ millions)Private foreign direct investment, net (% of GDP)Gross fixed capital formation (% of GDP)Gross fixed private capital formation (% of GDP) Finance and bankingGovernment cash surplus or deficit (% of GDP)Government debt (% of GDP)Deposit money banks’ assets (% of GDP)Total financial system deposits (% of GDP)Bank capital to asset ratio (%)Bank nonperforming loans to total gross loans ratio (%)Domestic credit to the private sector (% of GDP)Real interest rate (%)Interest rate spread (percentage points) Infrastructure Paved roads (% of total roads)Electric power consumption (kWh per capita)Power outages in a typical month (number)Fixed line and mobile subscribers (per 100 people)Internet users (per 100 people)Cost of telephone call to U.S. ($ per 3 minutes)
119The Little Data Book on Private Sector Development 2008
High income
Country dataHigh-
income group
2000 2006 2006
2.2 2.6 1,0311.1 1.4 5040.8 1.7 6.2
16,790 30,630 36,6081.8 7.3 2.30.4 0.5 1.5
59.2 51.1 26.22.6 2.3 16.8
40.5 48.5 72.32.5 3.10.3 0.3
56.5 67.7 25.630.1 30.4 26.3
.. 40.. 35 22.. 13 7.. 78.0 34.9.. 4.2 2.0.. 14.4 41.56 .... .. 10.1 .. .... .... .... .... .. .. .. 849
0.0 0.3 2.710.7 19.7 20.4
.. .. ..
–9.4 8.2 –1.3.. .. 47.6
77.5 52.9 99.764.6 46.3 ..11.5 12.0 6.219.2 3.9 1.152.0 63.1 162.0–9.7 –13.63.0 3.7 4.4
80.6 85.0 90.913,378 15,345 9,760
.. ..43 114 1436.8 31.4 59.3
1.94 1.51 0.77
Kuwait

Economic and social contextPopulation (millions)Labor force (millions)Unemployment rate (% of labor force)GNI per capita, World Bank Atlas method ($)GDP growth, 1995–2000 and 2000–06 (average annual %)Agriculture value added (% of GDP)Industry value added (% of GDP)
Manufacturing value added (% of GDP)Services value added (% of GDP)Inflation (annual % change in consumer price index)Exchange rate (local currency units per $)Exports of goods and services (% of GDP)Imports of goods and services (% of GDP) Business environmentEase of doing business (ranking 1-178; 1=best)Time to start a business (days)Procedures to start a business (number)Firing cost (weeks of wages)Closing a business (years to resolve insolvency)Total tax rate (% of profit)Highest marginal tax rate, corporate (%)Business entry rate (new registrations as % of total)Enterprise surveys
Time dealing with gov’t officials (% of management time)Firms expected to give gifts in meetings w/tax officials (%)Firms using banks to finance investments (% of firms)Delay in obtaining an electrical connection (days)ISO certification ownership (% of firms)
Private sector investmentInvest. in infrastructure w/private participation ($ millions)Private foreign direct investment, net (% of GDP)Gross fixed capital formation (% of GDP)Gross fixed private capital formation (% of GDP) Finance and bankingGovernment cash surplus or deficit (% of GDP)Government debt (% of GDP)Deposit money banks’ assets (% of GDP)Total financial system deposits (% of GDP)Bank capital to asset ratio (%)Bank nonperforming loans to total gross loans ratio (%)Domestic credit to the private sector (% of GDP)Real interest rate (%)Interest rate spread (percentage points) Infrastructure Paved roads (% of total roads)Electric power consumption (kWh per capita)Power outages in a typical month (number)Fixed line and mobile subscribers (per 100 people)Internet users (per 100 people)Cost of telephone call to U.S. ($ per 3 minutes)
120 2008 The Little Data Book on Private Sector Development
4.9 5.2 2,4202.1 2.3 995
12.5 8.5 ..280 500 6495.4 3.8 6.5
36.7 33.0 20.431.4 20.1 27.719.5 12.9 15.831.9 46.9 51.918.7 5.647.7 40.241.8 39.3 26.747.6 76.5 30.1
.. 94.. 21 54.. 8 10.. 17.0 62.6.. 4.0 3.8.. 61.4 67.4
30 .... .. 6.4 .. 6.1
75.8 85.06.4 7.9
10.5 13.8.. 11.9 5 36 29,785
–0.2 6.5 2.618.3 16.9 26.710.5 12.3 19.6
.. –0.6 –2.6
114.5 .. ..4.2 9.8 50.54.9 9.4 44.6
.. .. ..
.. .. ..4.2 10.5 38.3
19.5 12.833.5 17.6 11.3
91.1 .. ..1,904 1,842 391
.. ..8 19 17
1.0 5.7 4.29.84 5.40 1.99
Country dataLow-
income group
2000 2006 2006
Europe & Central Asia Low income
Kyrgyz Republic

Economic and social contextPopulation (millions)Labor force (millions)Unemployment rate (% of labor force)GNI per capita, World Bank Atlas method ($)GDP growth, 1995–2000 and 2000–06 (average annual %)Agriculture value added (% of GDP)Industry value added (% of GDP)
Manufacturing value added (% of GDP)Services value added (% of GDP)Inflation (annual % change in consumer price index)Exchange rate (local currency units per $)Exports of goods and services (% of GDP)Imports of goods and services (% of GDP) Business environmentEase of doing business (ranking 1-178; 1=best)Time to start a business (days)Procedures to start a business (number)Firing cost (weeks of wages)Closing a business (years to resolve insolvency)Total tax rate (% of profit)Highest marginal tax rate, corporate (%)Business entry rate (new registrations as % of total)Enterprise surveys
Time dealing with gov’t officials (% of management time)Firms expected to give gifts in meetings w/tax officials (%)Firms using banks to finance investments (% of firms)Delay in obtaining an electrical connection (days)ISO certification ownership (% of firms)
Private sector investmentInvest. in infrastructure w/private participation ($ millions)Private foreign direct investment, net (% of GDP)Gross fixed capital formation (% of GDP)Gross fixed private capital formation (% of GDP) Finance and bankingGovernment cash surplus or deficit (% of GDP)Government debt (% of GDP)Deposit money banks’ assets (% of GDP)Total financial system deposits (% of GDP)Bank capital to asset ratio (%)Bank nonperforming loans to total gross loans ratio (%)Domestic credit to the private sector (% of GDP)Real interest rate (%)Interest rate spread (percentage points) Infrastructure Paved roads (% of total roads)Electric power consumption (kWh per capita)Power outages in a typical month (number)Fixed line and mobile subscribers (per 100 people)Internet users (per 100 people)Cost of telephone call to U.S. ($ per 3 minutes)
121The Little Data Book on Private Sector Development 2008
East Asia & Pacific Low income
Country dataLow-
income group
2000 2006 2006
5.2 5.8 2,4202.0 2.4 995
.. 1.4 ..290 500 6496.1 6.4 6.5
52.5 42.0 20.422.9 32.5 27.717.0 20.9 15.824.6 25.5 51.925.1 6.8
7,887.630.1 36.0 26.734.4 42.3 30.1
.. 164.. 103 54.. 8 10.. 19.0 62.6.. 5.0 3.8.. 35.5 67.4.. .... .. 6.4 .. 4.5.. 34.7.. 13.8.. 58.8.. 3.3 5 810 29,785
2.0 5.5 2.620.9 32.5 26.7
6.9 25.7 19.6 .. .. –2.6.. .. ..
8.8 8.4 50.513.6 14.9 44.6
.. .. ..
.. .. ..8.9 6.0 38.35.5 24.2
20.0 25.0 11.3
44.5 14.4 .... .. 391.. ..1 13 17
0.1 0.4 4.29.20 1.11 1.99
Lao PDR

Economic and social contextPopulation (millions)Labor force (millions)Unemployment rate (% of labor force)GNI per capita, World Bank Atlas method ($)GDP growth, 1995–2000 and 2000–06 (average annual %)Agriculture value added (% of GDP)Industry value added (% of GDP)
Manufacturing value added (% of GDP)Services value added (% of GDP)Inflation (annual % change in consumer price index)Exchange rate (local currency units per $)Exports of goods and services (% of GDP)Imports of goods and services (% of GDP) Business environmentEase of doing business (ranking 1-178; 1=best)Time to start a business (days)Procedures to start a business (number)Firing cost (weeks of wages)Closing a business (years to resolve insolvency)Total tax rate (% of profit)Highest marginal tax rate, corporate (%)Business entry rate (new registrations as % of total)Enterprise surveys
Time dealing with gov’t officials (% of management time)Firms expected to give gifts in meetings w/tax officials (%)Firms using banks to finance investments (% of firms)Delay in obtaining an electrical connection (days)ISO certification ownership (% of firms)
Private sector investmentInvest. in infrastructure w/private participation ($ millions)Private foreign direct investment, net (% of GDP)Gross fixed capital formation (% of GDP)Gross fixed private capital formation (% of GDP) Finance and bankingGovernment cash surplus or deficit (% of GDP)Government debt (% of GDP)Deposit money banks’ assets (% of GDP)Total financial system deposits (% of GDP)Bank capital to asset ratio (%)Bank nonperforming loans to total gross loans ratio (%)Domestic credit to the private sector (% of GDP)Real interest rate (%)Interest rate spread (percentage points) Infrastructure Paved roads (% of total roads)Electric power consumption (kWh per capita)Power outages in a typical month (number)Fixed line and mobile subscribers (per 100 people)Internet users (per 100 people)Cost of telephone call to U.S. ($ per 3 minutes)
122 2008 The Little Data Book on Private Sector Development
2.4 2.3 8111.1 1.1 374
14.0 8.7 9.83,220 8,100 5,913
5.7 8.6 3.94.6 3.7 5.7
23.6 21.5 32.413.7 11.8 19.471.8 74.8 62.0
2.7 6.60.6 0.6
41.6 44.2 32.748.7 64.4 30.3
.. 22.. 16 41.. 5 9.. 17.0 39.7.. 3.0 2.9.. 32.6 44.5
25 153.7 5.6 9.1
.. 2.9
33.3 24.310.2 15.1
8.6 31.0.. 9.3
229 252 45,8695.3 8.3 3.5
24.2 34.4 19.920.5 24.1 ..
–2.2 –0.5 ..12.0 .. ..20.8 74.6 52.916.3 35.1 41.48.5 7.6 9.84.6 0.4 3.2
19.2 86.8 41.47.4 –3.47.5 3.8 5.9
100.0 100.0 ..2,078 2,702 3,131
.. ..48 124 886.3 46.8 22.2
2.05 1.63 1.06
Country data
Upper middle-income group
2000 2006 2006
Europe & Central Asia Upper middle income
Latvia

Economic and social contextPopulation (millions)Labor force (millions)Unemployment rate (% of labor force)GNI per capita, World Bank Atlas method ($)GDP growth, 1995–2000 and 2000–06 (average annual %)Agriculture value added (% of GDP)Industry value added (% of GDP)
Manufacturing value added (% of GDP)Services value added (% of GDP)Inflation (annual % change in consumer price index)Exchange rate (local currency units per $)Exports of goods and services (% of GDP)Imports of goods and services (% of GDP) Business environmentEase of doing business (ranking 1-178; 1=best)Time to start a business (days)Procedures to start a business (number)Firing cost (weeks of wages)Closing a business (years to resolve insolvency)Total tax rate (% of profit)Highest marginal tax rate, corporate (%)Business entry rate (new registrations as % of total)Enterprise surveys
Time dealing with gov’t officials (% of management time)Firms expected to give gifts in meetings w/tax officials (%)Firms using banks to finance investments (% of firms)Delay in obtaining an electrical connection (days)ISO certification ownership (% of firms)
Private sector investmentInvest. in infrastructure w/private participation ($ millions)Private foreign direct investment, net (% of GDP)Gross fixed capital formation (% of GDP)Gross fixed private capital formation (% of GDP) Finance and bankingGovernment cash surplus or deficit (% of GDP)Government debt (% of GDP)Deposit money banks’ assets (% of GDP)Total financial system deposits (% of GDP)Bank capital to asset ratio (%)Bank nonperforming loans to total gross loans ratio (%)Domestic credit to the private sector (% of GDP)Real interest rate (%)Interest rate spread (percentage points) Infrastructure Paved roads (% of total roads)Electric power consumption (kWh per capita)Power outages in a typical month (number)Fixed line and mobile subscribers (per 100 people)Internet users (per 100 people)Cost of telephone call to U.S. ($ per 3 minutes)
123The Little Data Book on Private Sector Development 2008
Middle East & North Africa Upper middle income
Country data
Upper middle-income group
2000 2006 2006
3.8 4.1 8111.4 1.6 374
.. .. 9.84,580 5,580 5,913
2.5 3.7 3.97.3 6.7 5.7
23.7 23.7 32.413.7 11.4 19.469.0 69.6 62.0
.. ..1,507.5 1,507.5
13.8 23.7 32.736.8 39.9 30.3
.. 85.. 46 41.. 6 9.. 17.0 39.7.. 4.0 2.9.. 35.4 44.5.. ..
5.0 4.9 9.1 .. 12.0.. 23.7.. 26.8.. 71.6.. 20.9
196 3 45,8695.7 12.3 3.5
20.8 12.2 19.915.9 9.7 ..
–18.9 –8.5 .... .. .... .. 52.9.. .. 41.4
6.4 8.4 9.87.8 13.5 3.2
90.2 77.9 41.421.3 4.46.9 2.3 5.9
84.9 .. ..2,081 2,242 3,131
.. ..35 44 888.0 23.4 22.2
4.48 2.19 1.06
Lebanon

Economic and social contextPopulation (millions)Labor force (millions)Unemployment rate (% of labor force)GNI per capita, World Bank Atlas method ($)GDP growth, 1995–2000 and 2000–06 (average annual %)Agriculture value added (% of GDP)Industry value added (% of GDP)
Manufacturing value added (% of GDP)Services value added (% of GDP)Inflation (annual % change in consumer price index)Exchange rate (local currency units per $)Exports of goods and services (% of GDP)Imports of goods and services (% of GDP) Business environmentEase of doing business (ranking 1-178; 1=best)Time to start a business (days)Procedures to start a business (number)Firing cost (weeks of wages)Closing a business (years to resolve insolvency)Total tax rate (% of profit)Highest marginal tax rate, corporate (%)Business entry rate (new registrations as % of total)Enterprise surveys
Time dealing with gov’t officials (% of management time)Firms expected to give gifts in meetings w/tax officials (%)Firms using banks to finance investments (% of firms)Delay in obtaining an electrical connection (days)ISO certification ownership (% of firms)
Private sector investmentInvest. in infrastructure w/private participation ($ millions)Private foreign direct investment, net (% of GDP)Gross fixed capital formation (% of GDP)Gross fixed private capital formation (% of GDP) Finance and bankingGovernment cash surplus or deficit (% of GDP)Government debt (% of GDP)Deposit money banks’ assets (% of GDP)Total financial system deposits (% of GDP)Bank capital to asset ratio (%)Bank nonperforming loans to total gross loans ratio (%)Domestic credit to the private sector (% of GDP)Real interest rate (%)Interest rate spread (percentage points) Infrastructure Paved roads (% of total roads)Electric power consumption (kWh per capita)Power outages in a typical month (number)Fixed line and mobile subscribers (per 100 people)Internet users (per 100 people)Cost of telephone call to U.S. ($ per 3 minutes)
124 2008 The Little Data Book on Private Sector Development
1.9 2.0 2,276
0.67 0.70 1,20939.3 .. 5.7590 980 2,0382.4 3.4 7.6
17.9 16.3 11.941.4 43.2 43.517.0 17.9 26.740.7 40.5 44.6
6.1 6.06.9 6.8
30.0 50.5 40.493.1 98.5 36.4
.. 124.. 73 53.. 8 10.. 44.0 50.2.. 2.6 3.3.. 20.8 45.8.. .... .. 7.6 .. 19.8.. 5.3.. 6.7.. 51.4.. 8.6 3 6 38,154
13.8 5.2 3.044.9 33.3 33.536.9 26.1 10.9
–2.6 4.1 –0.968.3 .. ..
.. 14.1 87.8
.. 26.6 43.1
.. .. 10.7
.. 1.0 4.014.3 8.9 81.312.1 7.712.2 7.6 7.2
18.3 .. 65.8.. .. 1,502.. ..2 15 60
0.2 2.6 11.42.31 3.28 2.08
Country data
Lower middle-income group
2000 2006 2006
Sub-Saharan Africa Lower middle income
Lesotho

Economic and social contextPopulation (millions)Labor force (millions)Unemployment rate (% of labor force)GNI per capita, World Bank Atlas method ($)GDP growth, 1995–2000 and 2000–06 (average annual %)Agriculture value added (% of GDP)Industry value added (% of GDP)
Manufacturing value added (% of GDP)Services value added (% of GDP)Inflation (annual % change in consumer price index)Exchange rate (local currency units per $)Exports of goods and services (% of GDP)Imports of goods and services (% of GDP) Business environmentEase of doing business (ranking 1-178; 1=best)Time to start a business (days)Procedures to start a business (number)Firing cost (weeks of wages)Closing a business (years to resolve insolvency)Total tax rate (% of profit)Highest marginal tax rate, corporate (%)Business entry rate (new registrations as % of total)Enterprise surveys
Time dealing with gov’t officials (% of management time)Firms expected to give gifts in meetings w/tax officials (%)Firms using banks to finance investments (% of firms)Delay in obtaining an electrical connection (days)ISO certification ownership (% of firms)
Private sector investmentInvest. in infrastructure w/private participation ($ millions)Private foreign direct investment, net (% of GDP)Gross fixed capital formation (% of GDP)Gross fixed private capital formation (% of GDP) Finance and bankingGovernment cash surplus or deficit (% of GDP)Government debt (% of GDP)Deposit money banks’ assets (% of GDP)Total financial system deposits (% of GDP)Bank capital to asset ratio (%)Bank nonperforming loans to total gross loans ratio (%)Domestic credit to the private sector (% of GDP)Real interest rate (%)Interest rate spread (percentage points) Infrastructure Paved roads (% of total roads)Electric power consumption (kWh per capita)Power outages in a typical month (number)Fixed line and mobile subscribers (per 100 people)Internet users (per 100 people)Cost of telephone call to U.S. ($ per 3 minutes)
125The Little Data Book on Private Sector Development 2008
Sub-Saharan Africa Low income
Country dataLow-
income group
2000 2006 2006
3.1 3.6 2,4201.1 1.3 995
.. .. ..130 130 649
38.9 –4.7 6.572.0 66.0 20.411.6 15.8 27.79.4 12.4 15.8
16.4 18.2 51.9.. ..
41.0 58.021.5 27.8 26.726.0 71.9 30.1
.. 170.. 99 54.. 12 10.. 84.0 62.6.. 3.0 3.8.. 81.6 67.4.. .... .. 6.4 .. .... .... .... .... .. .. 11 29,785
3.7 –13.0 2.64.9 16.5 26.72.0 4.3 19.6
.. .. –2.6.. .. .... .. 50.5.. .. 44.6.. .. .... .. ..
3.1 8.4 38.322.1 2.714.3 13.6 11.3
6.2 .. .... .. 391.. ..0 .. 17
0.0 .. 4.2.. .. 1.99
Liberia

Economic and social contextPopulation (millions)Labor force (millions)Unemployment rate (% of labor force)GNI per capita, World Bank Atlas method ($)GDP growth, 1995–2000 and 2000–06 (average annual %)Agriculture value added (% of GDP)Industry value added (% of GDP)
Manufacturing value added (% of GDP)Services value added (% of GDP)Inflation (annual % change in consumer price index)Exchange rate (local currency units per $)Exports of goods and services (% of GDP)Imports of goods and services (% of GDP) Business environmentEase of doing business (ranking 1-178; 1=best)Time to start a business (days)Procedures to start a business (number)Firing cost (weeks of wages)Closing a business (years to resolve insolvency)Total tax rate (% of profit)Highest marginal tax rate, corporate (%)Business entry rate (new registrations as % of total)Enterprise surveys
Time dealing with gov’t officials (% of management time)Firms expected to give gifts in meetings w/tax officials (%)Firms using banks to finance investments (% of firms)Delay in obtaining an electrical connection (days)ISO certification ownership (% of firms)
Private sector investmentInvest. in infrastructure w/private participation ($ millions)Private foreign direct investment, net (% of GDP)Gross fixed capital formation (% of GDP)Gross fixed private capital formation (% of GDP) Finance and bankingGovernment cash surplus or deficit (% of GDP)Government debt (% of GDP)Deposit money banks’ assets (% of GDP)Total financial system deposits (% of GDP)Bank capital to asset ratio (%)Bank nonperforming loans to total gross loans ratio (%)Domestic credit to the private sector (% of GDP)Real interest rate (%)Interest rate spread (percentage points) Infrastructure Paved roads (% of total roads)Electric power consumption (kWh per capita)Power outages in a typical month (number)Fixed line and mobile subscribers (per 100 people)Internet users (per 100 people)Cost of telephone call to U.S. ($ per 3 minutes)
126 2008 The Little Data Book on Private Sector Development
5.3 6.0 8112.0 2.5 374
.. .. 9.8
.. 7,290 5,913
.. 3.2 3.9
.. .. 5.7
.. .. 32.4
.. .. 19.4
.. .. 62.0–2.9 3.40.5 1.3
35.0 .. 32.715.2 .. 30.3
.. .... .. 41.. .. 9.. .. 39.7.. .. 2.9.. .. 44.5.. .... .. 9.1 .. .... .... .... .... .. .. .. 45,869.. .. 3.5
12.9 .. 19.9.. .. .. .. .. .... .. ..
32.1 .. 52.926.5 .. 41.4
.. .. 9.8
.. .. 3.227.0 15.5 41.4
–13.4 –7.44.0 3.8 5.9
57.2 .. ..2,227 3,299 3,131
.. ..12 73 88
0.2 3.9 22.2.. .. 1.06
Country data
Upper middle-income group
2000 2006 2006
Middle East & North Africa Upper middle income
Libya

Economic and social contextPopulation (millions)Labor force (millions)Unemployment rate (% of labor force)GNI per capita, World Bank Atlas method ($)GDP growth, 1995–2000 and 2000–06 (average annual %)Agriculture value added (% of GDP)Industry value added (% of GDP)
Manufacturing value added (% of GDP)Services value added (% of GDP)Inflation (annual % change in consumer price index)Exchange rate (local currency units per $)Exports of goods and services (% of GDP)Imports of goods and services (% of GDP) Business environmentEase of doing business (ranking 1-178; 1=best)Time to start a business (days)Procedures to start a business (number)Firing cost (weeks of wages)Closing a business (years to resolve insolvency)Total tax rate (% of profit)Highest marginal tax rate, corporate (%)Business entry rate (new registrations as % of total)Enterprise surveys
Time dealing with gov’t officials (% of management time)Firms expected to give gifts in meetings w/tax officials (%)Firms using banks to finance investments (% of firms)Delay in obtaining an electrical connection (days)ISO certification ownership (% of firms)
Private sector investmentInvest. in infrastructure w/private participation ($ millions)Private foreign direct investment, net (% of GDP)Gross fixed capital formation (% of GDP)Gross fixed private capital formation (% of GDP) Finance and bankingGovernment cash surplus or deficit (% of GDP)Government debt (% of GDP)Deposit money banks’ assets (% of GDP)Total financial system deposits (% of GDP)Bank capital to asset ratio (%)Bank nonperforming loans to total gross loans ratio (%)Domestic credit to the private sector (% of GDP)Real interest rate (%)Interest rate spread (percentage points) Infrastructure Paved roads (% of total roads)Electric power consumption (kWh per capita)Power outages in a typical month (number)Fixed line and mobile subscribers (per 100 people)Internet users (per 100 people)Cost of telephone call to U.S. ($ per 3 minutes)
127The Little Data Book on Private Sector Development 2008
High income
Country dataHigh-
income group
2000 2006 2006
.. 0.03 1,031.. .. 504.. .. 6.2.. .. 36,608.. .. 2.3.. .. 1.5.. .. 26.2.. .. 16.8.. .. 72.3.. .... .... .. 25.6.. .. 26.3 .. .... .. 22.. .. 7.. .. 34.9.. .. 2.0.. .. 41.5
15 15.. .. 10.1 .. .... .... .... .... .. .. .. 849.. .. 2.7.. .. 20.4.. .. .. .. .. –1.3.. .. 47.6.. .. 99.7.. .. .... .. 6.2.. .. 1.1.. .. 162.0.. .... .. 4.4 .. .. 90.9.. .. 9,760.. .... 140 143.. 63.0 59.3.. .. 0.77
Liechtenstein

Economic and social contextPopulation (millions)Labor force (millions)Unemployment rate (% of labor force)GNI per capita, World Bank Atlas method ($)GDP growth, 1995–2000 and 2000–06 (average annual %)Agriculture value added (% of GDP)Industry value added (% of GDP)
Manufacturing value added (% of GDP)Services value added (% of GDP)Inflation (annual % change in consumer price index)Exchange rate (local currency units per $)Exports of goods and services (% of GDP)Imports of goods and services (% of GDP) Business environmentEase of doing business (ranking 1-178; 1=best)Time to start a business (days)Procedures to start a business (number)Firing cost (weeks of wages)Closing a business (years to resolve insolvency)Total tax rate (% of profit)Highest marginal tax rate, corporate (%)Business entry rate (new registrations as % of total)Enterprise surveys
Time dealing with gov’t officials (% of management time)Firms expected to give gifts in meetings w/tax officials (%)Firms using banks to finance investments (% of firms)Delay in obtaining an electrical connection (days)ISO certification ownership (% of firms)
Private sector investmentInvest. in infrastructure w/private participation ($ millions)Private foreign direct investment, net (% of GDP)Gross fixed capital formation (% of GDP)Gross fixed private capital formation (% of GDP) Finance and bankingGovernment cash surplus or deficit (% of GDP)Government debt (% of GDP)Deposit money banks’ assets (% of GDP)Total financial system deposits (% of GDP)Bank capital to asset ratio (%)Bank nonperforming loans to total gross loans ratio (%)Domestic credit to the private sector (% of GDP)Real interest rate (%)Interest rate spread (percentage points) Infrastructure Paved roads (% of total roads)Electric power consumption (kWh per capita)Power outages in a typical month (number)Fixed line and mobile subscribers (per 100 people)Internet users (per 100 people)Cost of telephone call to U.S. ($ per 3 minutes)
128 2008 The Little Data Book on Private Sector Development
3.5 3.4 8111.7 1.6 374
16.4 8.3 9.83,020 7,930 5,913
4.3 8.0 3.97.8 5.3 5.7
29.8 35.3 32.419.4 17.6 19.462.4 59.4 62.0
1.0 3.84.0 2.8
44.8 59.7 32.751.1 70.1 30.3
.. 26.. 26 41.. 7 9.. 30.0 39.7.. 1.7 2.9.. 48.3 44.5
24 155.5 6.3 9.1
.. 5.1
26.3 31.910.0 15.64.3 30.2
.. 15.1
388 119 45,8693.3 6.1 3.5
18.8 24.8 19.916.4 21.7 ..
–2.8 –0.2 .... 20.0 ..
18.2 47.4 52.915.4 32.1 41.410.2 7.1 9.811.3 1.0 3.213.2 50.6 41.411.4 –1.48.3 4.5 5.9
91.3 78.2 ..2,517 3,104 3,131
.. ..49 162 886.4 31.9 22.2
3.10 1.55 1.06
Country data
Upper middle-income group
2000 2006 2006
Europe & Central Asia Upper middle income
Lithuania

Economic and social contextPopulation (millions)Labor force (millions)Unemployment rate (% of labor force)GNI per capita, World Bank Atlas method ($)GDP growth, 1995–2000 and 2000–06 (average annual %)Agriculture value added (% of GDP)Industry value added (% of GDP)
Manufacturing value added (% of GDP)Services value added (% of GDP)Inflation (annual % change in consumer price index)Exchange rate (local currency units per $)Exports of goods and services (% of GDP)Imports of goods and services (% of GDP) Business environmentEase of doing business (ranking 1-178; 1=best)Time to start a business (days)Procedures to start a business (number)Firing cost (weeks of wages)Closing a business (years to resolve insolvency)Total tax rate (% of profit)Highest marginal tax rate, corporate (%)Business entry rate (new registrations as % of total)Enterprise surveys
Time dealing with gov’t officials (% of management time)Firms expected to give gifts in meetings w/tax officials (%)Firms using banks to finance investments (% of firms)Delay in obtaining an electrical connection (days)ISO certification ownership (% of firms)
Private sector investmentInvest. in infrastructure w/private participation ($ millions)Private foreign direct investment, net (% of GDP)Gross fixed capital formation (% of GDP)Gross fixed private capital formation (% of GDP) Finance and bankingGovernment cash surplus or deficit (% of GDP)Government debt (% of GDP)Deposit money banks’ assets (% of GDP)Total financial system deposits (% of GDP)Bank capital to asset ratio (%)Bank nonperforming loans to total gross loans ratio (%)Domestic credit to the private sector (% of GDP)Real interest rate (%)Interest rate spread (percentage points) Infrastructure Paved roads (% of total roads)Electric power consumption (kWh per capita)Power outages in a typical month (number)Fixed line and mobile subscribers (per 100 people)Internet users (per 100 people)Cost of telephone call to U.S. ($ per 3 minutes)
129The Little Data Book on Private Sector Development 2008
High income
Country dataHigh-
income group
2000 2006 2006
0.44 0.46 1,0310.19 0.20 5042.3 4.5 6.2
43,490 71,240 36,6086.3 3.4 2.30.7 0.4 1.5
18.4 14.6 26.211.3 8.8 16.881.0 85.0 72.3
3.1 2.71.1 0.8
150.0 177.2 25.6129.0 149.4 26.3
.. 42.. 26 22.. 6 7.. 39.0 34.9.. 2.0 2.0.. 35.3 41.5
30 2311.9 10.7 10.1
.. .... .... .... .... .. .. .. 849
522.2 304.9 2.720.8 18.3 20.4
.. .. ..
5.5 0.9 –1.34.9 4.6 47.6
.. .. 99.7
.. .. ..4.0 4.6 6.20.5 0.2 1.1
102.2 158.7 162.05.7 ..2.0 .. 4.4
100.0 100.0 90.915,425 15,971 9,760
.. ..126 208 143
22.8 73.4 59.315.96 .. 0.77
Luxembourg

Economic and social contextPopulation (millions)Labor force (millions)Unemployment rate (% of labor force)GNI per capita, World Bank Atlas method ($)GDP growth, 1995–2000 and 2000–06 (average annual %)Agriculture value added (% of GDP)Industry value added (% of GDP)
Manufacturing value added (% of GDP)Services value added (% of GDP)Inflation (annual % change in consumer price index)Exchange rate (local currency units per $)Exports of goods and services (% of GDP)Imports of goods and services (% of GDP) Business environmentEase of doing business (ranking 1-178; 1=best)Time to start a business (days)Procedures to start a business (number)Firing cost (weeks of wages)Closing a business (years to resolve insolvency)Total tax rate (% of profit)Highest marginal tax rate, corporate (%)Business entry rate (new registrations as % of total)Enterprise surveys
Time dealing with gov’t officials (% of management time)Firms expected to give gifts in meetings w/tax officials (%)Firms using banks to finance investments (% of firms)Delay in obtaining an electrical connection (days)ISO certification ownership (% of firms)
Private sector investmentInvest. in infrastructure w/private participation ($ millions)Private foreign direct investment, net (% of GDP)Gross fixed capital formation (% of GDP)Gross fixed private capital formation (% of GDP) Finance and bankingGovernment cash surplus or deficit (% of GDP)Government debt (% of GDP)Deposit money banks’ assets (% of GDP)Total financial system deposits (% of GDP)Bank capital to asset ratio (%)Bank nonperforming loans to total gross loans ratio (%)Domestic credit to the private sector (% of GDP)Real interest rate (%)Interest rate spread (percentage points) Infrastructure Paved roads (% of total roads)Electric power consumption (kWh per capita)Power outages in a typical month (number)Fixed line and mobile subscribers (per 100 people)Internet users (per 100 people)Cost of telephone call to U.S. ($ per 3 minutes)
130 2008 The Little Data Book on Private Sector Development
0.44 0.48 1,0310.22 0.28 504
6.6 4.1 6.214,250 .. 36,608
–1.1 13.9 2.3.. .. 1.5
15.7 18.7 26.210.1 3.9 16.890.3 85.1 72.3–1.6 5.18.0 8.0
104.3 92.2 25.667.1 58.3 26.3
.. .... .. 22.. .. 7.. .. 34.9.. .. 2.0.. .. 41.5
15 12.. .. 10.1 .. .... .... .... .... .. .. .. 849
6.2 18.7 2.711.9 33.8 20.4
.. .. ..
1.7 10.2 –1.3.. .. 47.6
82.8 41.4 99.7170.8 129.4 ..
.. .. 6.2
.. .. 1.183.0 42.8 162.011.0 2.64.6 5.9 4.4
100.0 100.0 90.9.. .. 9,760.. ..
72 170 14313.6 41.9 59.31.12 1.12 0.77
Country dataHigh-
income group
2000 2006 2006
High income
Macao, China
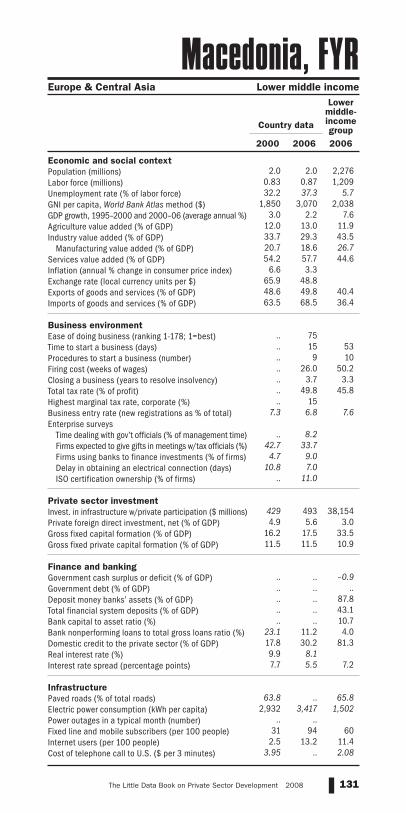
Economic and social contextPopulation (millions)Labor force (millions)Unemployment rate (% of labor force)GNI per capita, World Bank Atlas method ($)GDP growth, 1995–2000 and 2000–06 (average annual %)Agriculture value added (% of GDP)Industry value added (% of GDP)
Manufacturing value added (% of GDP)Services value added (% of GDP)Inflation (annual % change in consumer price index)Exchange rate (local currency units per $)Exports of goods and services (% of GDP)Imports of goods and services (% of GDP) Business environmentEase of doing business (ranking 1-178; 1=best)Time to start a business (days)Procedures to start a business (number)Firing cost (weeks of wages)Closing a business (years to resolve insolvency)Total tax rate (% of profit)Highest marginal tax rate, corporate (%)Business entry rate (new registrations as % of total)Enterprise surveys
Time dealing with gov’t officials (% of management time)Firms expected to give gifts in meetings w/tax officials (%)Firms using banks to finance investments (% of firms)Delay in obtaining an electrical connection (days)ISO certification ownership (% of firms)
Private sector investmentInvest. in infrastructure w/private participation ($ millions)Private foreign direct investment, net (% of GDP)Gross fixed capital formation (% of GDP)Gross fixed private capital formation (% of GDP) Finance and bankingGovernment cash surplus or deficit (% of GDP)Government debt (% of GDP)Deposit money banks’ assets (% of GDP)Total financial system deposits (% of GDP)Bank capital to asset ratio (%)Bank nonperforming loans to total gross loans ratio (%)Domestic credit to the private sector (% of GDP)Real interest rate (%)Interest rate spread (percentage points) Infrastructure Paved roads (% of total roads)Electric power consumption (kWh per capita)Power outages in a typical month (number)Fixed line and mobile subscribers (per 100 people)Internet users (per 100 people)Cost of telephone call to U.S. ($ per 3 minutes)
131The Little Data Book on Private Sector Development 2008
Europe & Central Asia Lower middle income
Country data
Lower middle-income group
2000 2006 2006
2.0 2.0 2,276
0.83 0.87 1,20932.2 37.3 5.7
1,850 3,070 2,0383.0 2.2 7.6
12.0 13.0 11.933.7 29.3 43.520.7 18.6 26.754.2 57.7 44.6
6.6 3.365.9 48.848.6 49.8 40.463.5 68.5 36.4
.. 75.. 15 53.. 9 10.. 26.0 50.2.. 3.7 3.3.. 49.8 45.8.. 15
7.3 6.8 7.6 .. 8.2
42.7 33.74.7 9.0
10.8 7.0.. 11.0
429 493 38,1544.9 5.6 3.0
16.2 17.5 33.511.5 11.5 10.9
.. .. –0.9.. .. .... .. 87.8.. .. 43.1.. .. 10.7
23.1 11.2 4.017.8 30.2 81.39.9 8.17.7 5.5 7.2
63.8 .. 65.82,932 3,417 1,502
.. ..31 94 60
2.5 13.2 11.43.95 .. 2.08
Macedonia, FYR

Economic and social contextPopulation (millions)Labor force (millions)Unemployment rate (% of labor force)GNI per capita, World Bank Atlas method ($)GDP growth, 1995–2000 and 2000–06 (average annual %)Agriculture value added (% of GDP)Industry value added (% of GDP)
Manufacturing value added (% of GDP)Services value added (% of GDP)Inflation (annual % change in consumer price index)Exchange rate (local currency units per $)Exports of goods and services (% of GDP)Imports of goods and services (% of GDP) Business environmentEase of doing business (ranking 1-178; 1=best)Time to start a business (days)Procedures to start a business (number)Firing cost (weeks of wages)Closing a business (years to resolve insolvency)Total tax rate (% of profit)Highest marginal tax rate, corporate (%)Business entry rate (new registrations as % of total)Enterprise surveys
Time dealing with gov’t officials (% of management time)Firms expected to give gifts in meetings w/tax officials (%)Firms using banks to finance investments (% of firms)Delay in obtaining an electrical connection (days)ISO certification ownership (% of firms)
Private sector investmentInvest. in infrastructure w/private participation ($ millions)Private foreign direct investment, net (% of GDP)Gross fixed capital formation (% of GDP)Gross fixed private capital formation (% of GDP) Finance and bankingGovernment cash surplus or deficit (% of GDP)Government debt (% of GDP)Deposit money banks’ assets (% of GDP)Total financial system deposits (% of GDP)Bank capital to asset ratio (%)Bank nonperforming loans to total gross loans ratio (%)Domestic credit to the private sector (% of GDP)Real interest rate (%)Interest rate spread (percentage points) Infrastructure Paved roads (% of total roads)Electric power consumption (kWh per capita)Power outages in a typical month (number)Fixed line and mobile subscribers (per 100 people)Internet users (per 100 people)Cost of telephone call to U.S. ($ per 3 minutes)
132 2008 The Little Data Book on Private Sector Development
16.2 19.2 2,420
7.3 8.9 995.. 5.0 ..
240 280 6493.9 2.7 6.5
29.2 27.5 20.414.2 15.3 27.712.2 13.4 15.856.6 57.2 51.912.0 10.8
1,353.5 2,142.330.7 29.7 26.738.0 40.9 30.1
.. 149.. 7 54.. 5 10.. 30.0 62.6.. .. 3.8.. 46.5 67.4.. ..
4.2 6.4 6.4 .. 20.8.. 12.7.. 13.0.. 58.0.. 6.6
10 13 29,7852.1 4.2 2.6
15.0 24.8 26.78.3 14.5 19.6
–2.0 9.9 –2.6111.9 .. ..10.1 11.0 50.513.0 13.7 44.6
7.1 6.2 ..8.6 10.1 ..9.2 10.2 38.3
18.0 16.411.5 7.2 11.3
11.6 .. .... .. 391.. ..1 6 17
0.2 0.6 4.28.98 0.59 1.99
Country dataLow-
income group
2000 2006 2006
Sub-Saharan Africa Low income
Madagascar

Economic and social contextPopulation (millions)Labor force (millions)Unemployment rate (% of labor force)GNI per capita, World Bank Atlas method ($)GDP growth, 1995–2000 and 2000–06 (average annual %)Agriculture value added (% of GDP)Industry value added (% of GDP)
Manufacturing value added (% of GDP)Services value added (% of GDP)Inflation (annual % change in consumer price index)Exchange rate (local currency units per $)Exports of goods and services (% of GDP)Imports of goods and services (% of GDP) Business environmentEase of doing business (ranking 1-178; 1=best)Time to start a business (days)Procedures to start a business (number)Firing cost (weeks of wages)Closing a business (years to resolve insolvency)Total tax rate (% of profit)Highest marginal tax rate, corporate (%)Business entry rate (new registrations as % of total)Enterprise surveys
Time dealing with gov’t officials (% of management time)Firms expected to give gifts in meetings w/tax officials (%)Firms using banks to finance investments (% of firms)Delay in obtaining an electrical connection (days)ISO certification ownership (% of firms)
Private sector investmentInvest. in infrastructure w/private participation ($ millions)Private foreign direct investment, net (% of GDP)Gross fixed capital formation (% of GDP)Gross fixed private capital formation (% of GDP) Finance and bankingGovernment cash surplus or deficit (% of GDP)Government debt (% of GDP)Deposit money banks’ assets (% of GDP)Total financial system deposits (% of GDP)Bank capital to asset ratio (%)Bank nonperforming loans to total gross loans ratio (%)Domestic credit to the private sector (% of GDP)Real interest rate (%)Interest rate spread (percentage points) Infrastructure Paved roads (% of total roads)Electric power consumption (kWh per capita)Power outages in a typical month (number)Fixed line and mobile subscribers (per 100 people)Internet users (per 100 people)Cost of telephone call to U.S. ($ per 3 minutes)
133The Little Data Book on Private Sector Development 2008
Sub-Saharan Africa Low income
Country dataLow-
income group
2000 2006 2006
11.6 13.6 2,4205.4 6.3 9950.9 .. ..
150 230 6493.8 2.4 6.5
39.5 34.2 20.417.9 19.7 27.712.9 13.6 15.842.5 46.1 51.929.6 14.059.5 136.025.6 17.0 26.735.3 29.4 30.1
.. 127.. 37 54.. 10 10.. 84.0 62.6.. 2.6 3.8.. 32.2 67.4
38 ..6.3 7.5 6.4
.. 5.8.. 15.3.. 20.6.. 98.5.. 17.2 5 31 29,785
1.5 0.9 2.612.3 21.8 26.7
2.3 14.4 19.6 .. .. –2.6.. .. ..
7.6 11.1 50.515.0 20.2 44.6
.. .. ..
.. .. ..9.1 8.7 38.3
17.3 11.619.9 21.3 11.3
19.0 45.0 .... .. 391.. 76.91 4 17
0.1 0.4 4.24.32 .. 1.99
Malawi

Economic and social contextPopulation (millions)Labor force (millions)Unemployment rate (% of labor force)GNI per capita, World Bank Atlas method ($)GDP growth, 1995–2000 and 2000–06 (average annual %)Agriculture value added (% of GDP)Industry value added (% of GDP)
Manufacturing value added (% of GDP)Services value added (% of GDP)Inflation (annual % change in consumer price index)Exchange rate (local currency units per $)Exports of goods and services (% of GDP)Imports of goods and services (% of GDP) Business environmentEase of doing business (ranking 1-178; 1=best)Time to start a business (days)Procedures to start a business (number)Firing cost (weeks of wages)Closing a business (years to resolve insolvency)Total tax rate (% of profit)Highest marginal tax rate, corporate (%)Business entry rate (new registrations as % of total)Enterprise surveys
Time dealing with gov’t officials (% of management time)Firms expected to give gifts in meetings w/tax officials (%)Firms using banks to finance investments (% of firms)Delay in obtaining an electrical connection (days)ISO certification ownership (% of firms)
Private sector investmentInvest. in infrastructure w/private participation ($ millions)Private foreign direct investment, net (% of GDP)Gross fixed capital formation (% of GDP)Gross fixed private capital formation (% of GDP) Finance and bankingGovernment cash surplus or deficit (% of GDP)Government debt (% of GDP)Deposit money banks’ assets (% of GDP)Total financial system deposits (% of GDP)Bank capital to asset ratio (%)Bank nonperforming loans to total gross loans ratio (%)Domestic credit to the private sector (% of GDP)Real interest rate (%)Interest rate spread (percentage points) Infrastructure Paved roads (% of total roads)Electric power consumption (kWh per capita)Power outages in a typical month (number)Fixed line and mobile subscribers (per 100 people)Internet users (per 100 people)Cost of telephone call to U.S. ($ per 3 minutes)
134 2008 The Little Data Book on Private Sector Development
23.3 26.1 811
9.9 11.6 3743.0 3.5 9.8
3,390 5,620 5,9133.7 5.0 3.98.8 8.7 5.7
50.7 49.9 32.432.6 29.8 19.440.5 41.3 62.0
1.5 3.63.8 3.7
124.4 117.0 32.7104.5 100.0 30.3
.. 24.. 24 41.. 9 9.. 75.0 39.7.. 2.3 2.9.. 36.0 44.5
28 28.. .. 9.1
7.3 .... ..
23.8 ..16.4 ..31.4 ..
5,519 1,230 45,8694.2 4.0 3.5
25.6 20.9 19.931.8 .. ..
–3.1 –4.3 .... .. ..
131.0 111.8 52.9107.6 110.4 41.4
8.5 7.6 9.815.4 8.5 3.2
177.9 108.1 41.42.7 2.34.3 3.3 5.9
75.3 81.3 ..2,743 3,262 3,131
.. ..42 91 88
21.4 43.2 22.22.37 0.71 1.06
Country data
Upper middle-income group
2000 2006 2006
East Asia & Pacific Upper middle income
Malaysia

Economic and social contextPopulation (millions)Labor force (millions)Unemployment rate (% of labor force)GNI per capita, World Bank Atlas method ($)GDP growth, 1995–2000 and 2000–06 (average annual %)Agriculture value added (% of GDP)Industry value added (% of GDP)
Manufacturing value added (% of GDP)Services value added (% of GDP)Inflation (annual % change in consumer price index)Exchange rate (local currency units per $)Exports of goods and services (% of GDP)Imports of goods and services (% of GDP) Business environmentEase of doing business (ranking 1-178; 1=best)Time to start a business (days)Procedures to start a business (number)Firing cost (weeks of wages)Closing a business (years to resolve insolvency)Total tax rate (% of profit)Highest marginal tax rate, corporate (%)Business entry rate (new registrations as % of total)Enterprise surveys
Time dealing with gov’t officials (% of management time)Firms expected to give gifts in meetings w/tax officials (%)Firms using banks to finance investments (% of firms)Delay in obtaining an electrical connection (days)ISO certification ownership (% of firms)
Private sector investmentInvest. in infrastructure w/private participation ($ millions)Private foreign direct investment, net (% of GDP)Gross fixed capital formation (% of GDP)Gross fixed private capital formation (% of GDP) Finance and bankingGovernment cash surplus or deficit (% of GDP)Government debt (% of GDP)Deposit money banks’ assets (% of GDP)Total financial system deposits (% of GDP)Bank capital to asset ratio (%)Bank nonperforming loans to total gross loans ratio (%)Domestic credit to the private sector (% of GDP)Real interest rate (%)Interest rate spread (percentage points) Infrastructure Paved roads (% of total roads)Electric power consumption (kWh per capita)Power outages in a typical month (number)Fixed line and mobile subscribers (per 100 people)Internet users (per 100 people)Cost of telephone call to U.S. ($ per 3 minutes)
135The Little Data Book on Private Sector Development 2008
South Asia Lower middle income
Country data
Lower middle-income group
2000 2006 2006
0.27 0.30 2,2760.09 0.12 1,209
2.0 .. 5.72,140 3,010 2,038
8.7 7.2 7.6.. .. 11.9.. .. 43.5.. .. 26.7.. .. 44.6.. 3.5
11.8 12.889.5 94.8 40.471.6 83.3 36.4
.. 60.. 9 53.. 5 10.. 9.0 50.2.. 6.7 3.3.. 9.1 45.8.. .... .. 7.6 .. .... .... .... .... .. .. 40 38,154
2.1 1.5 3.026.3 36.1 33.5
.. .. 10.9
–5.0 –7.7 –0.940.9 50.6 ..
.. 63.1 87.8
.. 53.2 43.1
.. .. 10.7
.. .. 4.019.1 69.0 81.311.3 12.9
6.1 6.5 7.2 .. .. 65.8.. .. 1,502.. ..
12 98 602.2 6.8 11.4
11.72 5.86 2.08
Maldives

Economic and social contextPopulation (millions)Labor force (millions)Unemployment rate (% of labor force)GNI per capita, World Bank Atlas method ($)GDP growth, 1995–2000 and 2000–06 (average annual %)Agriculture value added (% of GDP)Industry value added (% of GDP)
Manufacturing value added (% of GDP)Services value added (% of GDP)Inflation (annual % change in consumer price index)Exchange rate (local currency units per $)Exports of goods and services (% of GDP)Imports of goods and services (% of GDP) Business environmentEase of doing business (ranking 1-178; 1=best)Time to start a business (days)Procedures to start a business (number)Firing cost (weeks of wages)Closing a business (years to resolve insolvency)Total tax rate (% of profit)Highest marginal tax rate, corporate (%)Business entry rate (new registrations as % of total)Enterprise surveys
Time dealing with gov’t officials (% of management time)Firms expected to give gifts in meetings w/tax officials (%)Firms using banks to finance investments (% of firms)Delay in obtaining an electrical connection (days)ISO certification ownership (% of firms)
Private sector investmentInvest. in infrastructure w/private participation ($ millions)Private foreign direct investment, net (% of GDP)Gross fixed capital formation (% of GDP)Gross fixed private capital formation (% of GDP) Finance and bankingGovernment cash surplus or deficit (% of GDP)Government debt (% of GDP)Deposit money banks’ assets (% of GDP)Total financial system deposits (% of GDP)Bank capital to asset ratio (%)Bank nonperforming loans to total gross loans ratio (%)Domestic credit to the private sector (% of GDP)Real interest rate (%)Interest rate spread (percentage points) Infrastructure Paved roads (% of total roads)Electric power consumption (kWh per capita)Power outages in a typical month (number)Fixed line and mobile subscribers (per 100 people)Internet users (per 100 people)Cost of telephone call to U.S. ($ per 3 minutes)
136 2008 The Little Data Book on Private Sector Development
10.0 12.0 2,420
4.1 4.8 9953.3 8.8 ..
260 460 6495.5 5.7 6.5
41.6 36.9 20.420.6 24.0 27.73.8 3.1 15.8
37.9 39.1 51.9–0.7 1.5
712.0 522.926.8 32.1 26.739.4 40.2 30.1
.. 158.. 26 54.. 11 10.. 31.0 62.6.. 3.6 3.8.. 51.4 67.4.. .... .. 6.4 .. 7.5.. 30.2.. 16.8.. 35.6.. 6.5
366 55 29,7853.4 3.2 2.6
24.6 22.9 26.715.9 14.3 19.6
–3.4 32.1 –2.6.. .. ..
15.8 18.2 50.513.1 17.0 44.6
.. .. ..
.. .. ..16.6 17.2 38.3
.. ..
.. .. 11.3
12.1 18.0 .... .. 391.. ..0 13 17
0.1 0.6 4.212.64 .. 1.99
Country dataLow-
income group
2000 2006 2006
Sub-Saharan Africa Low income
Mali

Economic and social contextPopulation (millions)Labor force (millions)Unemployment rate (% of labor force)GNI per capita, World Bank Atlas method ($)GDP growth, 1995–2000 and 2000–06 (average annual %)Agriculture value added (% of GDP)Industry value added (% of GDP)
Manufacturing value added (% of GDP)Services value added (% of GDP)Inflation (annual % change in consumer price index)Exchange rate (local currency units per $)Exports of goods and services (% of GDP)Imports of goods and services (% of GDP) Business environmentEase of doing business (ranking 1-178; 1=best)Time to start a business (days)Procedures to start a business (number)Firing cost (weeks of wages)Closing a business (years to resolve insolvency)Total tax rate (% of profit)Highest marginal tax rate, corporate (%)Business entry rate (new registrations as % of total)Enterprise surveys
Time dealing with gov’t officials (% of management time)Firms expected to give gifts in meetings w/tax officials (%)Firms using banks to finance investments (% of firms)Delay in obtaining an electrical connection (days)ISO certification ownership (% of firms)
Private sector investmentInvest. in infrastructure w/private participation ($ millions)Private foreign direct investment, net (% of GDP)Gross fixed capital formation (% of GDP)Gross fixed private capital formation (% of GDP) Finance and bankingGovernment cash surplus or deficit (% of GDP)Government debt (% of GDP)Deposit money banks’ assets (% of GDP)Total financial system deposits (% of GDP)Bank capital to asset ratio (%)Bank nonperforming loans to total gross loans ratio (%)Domestic credit to the private sector (% of GDP)Real interest rate (%)Interest rate spread (percentage points) Infrastructure Paved roads (% of total roads)Electric power consumption (kWh per capita)Power outages in a typical month (number)Fixed line and mobile subscribers (per 100 people)Internet users (per 100 people)Cost of telephone call to U.S. ($ per 3 minutes)
137The Little Data Book on Private Sector Development 2008
High income
Country dataHigh-
income group
2000 2006 2006
0.39 0.41 1,0310.15 0.18 5046.7 7.5 6.2
9,670 15,310 36,6084.4 1.2 2.3
.. .. 1.5
.. .. 26.2
.. .. 16.8
.. .. 72.32.4 2.80.4 0.3
92.1 88.0 25.6102.7 91.6 26.3
.. .... .. 22.. .. 7.. .. 34.9.. .. 2.0.. .. 41.5
35 355.4 6.3 10.1
.. .... .... .... .... .. .. .. 849
15.4 28.1 2.723.1 19.5 20.4
.. .. .. .. –2.5 –1.3.. 76.3 47.6
129.0 134.9 99.7122.5 134.6 ..
.. 8.6 6.2
.. 2.8 1.1106.9 115.7 162.0
–2.7 2.82.4 2.6 4.4
88.0 87.5 90.94,313 4,917 9,760
.. ..82 135 143
13.1 31.5 59.33.41 0.77 0.77
Malta

Economic and social contextPopulation (millions)Labor force (millions)Unemployment rate (% of labor force)GNI per capita, World Bank Atlas method ($)GDP growth, 1995–2000 and 2000–06 (average annual %)Agriculture value added (% of GDP)Industry value added (% of GDP)
Manufacturing value added (% of GDP)Services value added (% of GDP)Inflation (annual % change in consumer price index)Exchange rate (local currency units per $)Exports of goods and services (% of GDP)Imports of goods and services (% of GDP) Business environmentEase of doing business (ranking 1-178; 1=best)Time to start a business (days)Procedures to start a business (number)Firing cost (weeks of wages)Closing a business (years to resolve insolvency)Total tax rate (% of profit)Highest marginal tax rate, corporate (%)Business entry rate (new registrations as % of total)Enterprise surveys
Time dealing with gov’t officials (% of management time)Firms expected to give gifts in meetings w/tax officials (%)Firms using banks to finance investments (% of firms)Delay in obtaining an electrical connection (days)ISO certification ownership (% of firms)
Private sector investmentInvest. in infrastructure w/private participation ($ millions)Private foreign direct investment, net (% of GDP)Gross fixed capital formation (% of GDP)Gross fixed private capital formation (% of GDP) Finance and bankingGovernment cash surplus or deficit (% of GDP)Government debt (% of GDP)Deposit money banks’ assets (% of GDP)Total financial system deposits (% of GDP)Bank capital to asset ratio (%)Bank nonperforming loans to total gross loans ratio (%)Domestic credit to the private sector (% of GDP)Real interest rate (%)Interest rate spread (percentage points) Infrastructure Paved roads (% of total roads)Electric power consumption (kWh per capita)Power outages in a typical month (number)Fixed line and mobile subscribers (per 100 people)Internet users (per 100 people)Cost of telephone call to U.S. ($ per 3 minutes)
138 2008 The Little Data Book on Private Sector Development
0.05 0.07 2,276
.. .. 1,20930.9 25.4 5.7
2,540 2,980 2,038–3.7 2.7 7.69.4 .. 11.9
18.6 .. 43.53.7 .. 26.7
72.1 .. 44.6.. .... .... .. 40.4.. .. 36.4 .. 89.. 17 53.. 5 10.. .. 50.2.. 2.0 3.3.. 64.9 45.8.. .... .. 7.6 .. .... .... .... .... .. .. .. 38,154.. .. 3.0.. .. 33.5.. .. 10.9 .. .. –0.9.. .. .... .. 87.8.. .. 43.1.. .. 10.7.. .. 4.0.. .. 81.3.. .... .. 7.2 .. .. 65.8.. .. 1,502.. ..8 9 60
1.5 3.4 11.4.. .. 2.08
Country data
Lower middle-income group
2000 2006 2006
East Asia & Pacific Lower middle income
Marshall Islands
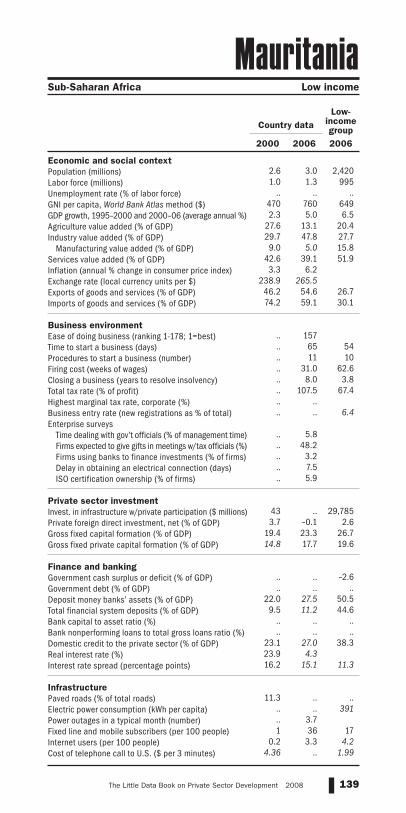
Economic and social contextPopulation (millions)Labor force (millions)Unemployment rate (% of labor force)GNI per capita, World Bank Atlas method ($)GDP growth, 1995–2000 and 2000–06 (average annual %)Agriculture value added (% of GDP)Industry value added (% of GDP)
Manufacturing value added (% of GDP)Services value added (% of GDP)Inflation (annual % change in consumer price index)Exchange rate (local currency units per $)Exports of goods and services (% of GDP)Imports of goods and services (% of GDP) Business environmentEase of doing business (ranking 1-178; 1=best)Time to start a business (days)Procedures to start a business (number)Firing cost (weeks of wages)Closing a business (years to resolve insolvency)Total tax rate (% of profit)Highest marginal tax rate, corporate (%)Business entry rate (new registrations as % of total)Enterprise surveys
Time dealing with gov’t officials (% of management time)Firms expected to give gifts in meetings w/tax officials (%)Firms using banks to finance investments (% of firms)Delay in obtaining an electrical connection (days)ISO certification ownership (% of firms)
Private sector investmentInvest. in infrastructure w/private participation ($ millions)Private foreign direct investment, net (% of GDP)Gross fixed capital formation (% of GDP)Gross fixed private capital formation (% of GDP) Finance and bankingGovernment cash surplus or deficit (% of GDP)Government debt (% of GDP)Deposit money banks’ assets (% of GDP)Total financial system deposits (% of GDP)Bank capital to asset ratio (%)Bank nonperforming loans to total gross loans ratio (%)Domestic credit to the private sector (% of GDP)Real interest rate (%)Interest rate spread (percentage points) Infrastructure Paved roads (% of total roads)Electric power consumption (kWh per capita)Power outages in a typical month (number)Fixed line and mobile subscribers (per 100 people)Internet users (per 100 people)Cost of telephone call to U.S. ($ per 3 minutes)
139The Little Data Book on Private Sector Development 2008
Sub-Saharan Africa Low income
Country dataLow-
income group
2000 2006 2006
2.6 3.0 2,4201.0 1.3 995
.. .. ..470 760 6492.3 5.0 6.5
27.6 13.1 20.429.7 47.8 27.79.0 5.0 15.8
42.6 39.1 51.93.3 6.2
238.9 265.546.2 54.6 26.774.2 59.1 30.1
.. 157.. 65 54.. 11 10.. 31.0 62.6.. 8.0 3.8.. 107.5 67.4.. .... .. 6.4 .. 5.8.. 48.2.. 3.2.. 7.5.. 5.9
43 .. 29,7853.7 –0.1 2.6
19.4 23.3 26.714.8 17.7 19.6
.. .. –2.6.. .. ..
22.0 27.5 50.59.5 11.2 44.6
.. .. ..
.. .. ..23.1 27.0 38.323.9 4.316.2 15.1 11.3
11.3 .. .... .. 391.. 3.71 36 17
0.2 3.3 4.24.36 .. 1.99
Mauritania

Economic and social contextPopulation (millions)Labor force (millions)Unemployment rate (% of labor force)GNI per capita, World Bank Atlas method ($)GDP growth, 1995–2000 and 2000–06 (average annual %)Agriculture value added (% of GDP)Industry value added (% of GDP)
Manufacturing value added (% of GDP)Services value added (% of GDP)Inflation (annual % change in consumer price index)Exchange rate (local currency units per $)Exports of goods and services (% of GDP)Imports of goods and services (% of GDP) Business environmentEase of doing business (ranking 1-178; 1=best)Time to start a business (days)Procedures to start a business (number)Firing cost (weeks of wages)Closing a business (years to resolve insolvency)Total tax rate (% of profit)Highest marginal tax rate, corporate (%)Business entry rate (new registrations as % of total)Enterprise surveys
Time dealing with gov’t officials (% of management time)Firms expected to give gifts in meetings w/tax officials (%)Firms using banks to finance investments (% of firms)Delay in obtaining an electrical connection (days)ISO certification ownership (% of firms)
Private sector investmentInvest. in infrastructure w/private participation ($ millions)Private foreign direct investment, net (% of GDP)Gross fixed capital formation (% of GDP)Gross fixed private capital formation (% of GDP) Finance and bankingGovernment cash surplus or deficit (% of GDP)Government debt (% of GDP)Deposit money banks’ assets (% of GDP)Total financial system deposits (% of GDP)Bank capital to asset ratio (%)Bank nonperforming loans to total gross loans ratio (%)Domestic credit to the private sector (% of GDP)Real interest rate (%)Interest rate spread (percentage points) Infrastructure Paved roads (% of total roads)Electric power consumption (kWh per capita)Power outages in a typical month (number)Fixed line and mobile subscribers (per 100 people)Internet users (per 100 people)Cost of telephone call to U.S. ($ per 3 minutes)
140 2008 The Little Data Book on Private Sector Development
1.2 1.3 811
0.53 0.58 3748.8 9.6 9.8
3,740 5,430 5,9135.5 4.0 3.95.9 5.6 5.7
31.2 26.9 32.423.7 19.1 19.462.9 67.6 62.0
4.2 8.926.2 31.762.7 60.0 32.764.6 67.1 30.3
.. 27.. 7 41.. 6 9.. 35.0 39.7.. 1.7 2.9.. 21.7 44.5
25 25.. .. 9.1 .. 9.6.. 1.4.. 36.3.. 23.2.. 28.4
338 26 45,8695.9 1.7 3.5
25.3 22.9 19.917.5 15.9 ..
–1.1 –3.0 ..34.5 43.2 ..68.4 98.4 52.970.4 90.4 41.4
.. .. 9.8
.. .. 3.260.7 78.0 41.416.5 16.311.2 11.5 5.9
97.0 100.0 .... .. 3,131.. ..
39 90 887.3 14.5 22.2
4.00 1.59 1.06
Country data
Upper middle-income group
2000 2006 2006
Sub-Saharan Africa Upper middle income
Mauritius

Economic and social contextPopulation (millions)Labor force (millions)Unemployment rate (% of labor force)GNI per capita, World Bank Atlas method ($)GDP growth, 1995–2000 and 2000–06 (average annual %)Agriculture value added (% of GDP)Industry value added (% of GDP)
Manufacturing value added (% of GDP)Services value added (% of GDP)Inflation (annual % change in consumer price index)Exchange rate (local currency units per $)Exports of goods and services (% of GDP)Imports of goods and services (% of GDP) Business environmentEase of doing business (ranking 1-178; 1=best)Time to start a business (days)Procedures to start a business (number)Firing cost (weeks of wages)Closing a business (years to resolve insolvency)Total tax rate (% of profit)Highest marginal tax rate, corporate (%)Business entry rate (new registrations as % of total)Enterprise surveys
Time dealing with gov’t officials (% of management time)Firms expected to give gifts in meetings w/tax officials (%)Firms using banks to finance investments (% of firms)Delay in obtaining an electrical connection (days)ISO certification ownership (% of firms)
Private sector investmentInvest. in infrastructure w/private participation ($ millions)Private foreign direct investment, net (% of GDP)Gross fixed capital formation (% of GDP)Gross fixed private capital formation (% of GDP) Finance and bankingGovernment cash surplus or deficit (% of GDP)Government debt (% of GDP)Deposit money banks’ assets (% of GDP)Total financial system deposits (% of GDP)Bank capital to asset ratio (%)Bank nonperforming loans to total gross loans ratio (%)Domestic credit to the private sector (% of GDP)Real interest rate (%)Interest rate spread (percentage points) Infrastructure Paved roads (% of total roads)Electric power consumption (kWh per capita)Power outages in a typical month (number)Fixed line and mobile subscribers (per 100 people)Internet users (per 100 people)Cost of telephone call to U.S. ($ per 3 minutes)
141The Little Data Book on Private Sector Development 2008
Sub-Saharan Africa Upper middle income
Country data
Upper middle-income group
2000 2006 2006
.. 0.19 811.. .. 374.. .. 9.8.. .. 5,913.. .. 3.9.. .. 5.7.. .. 32.4.. .. 19.4.. .. 62.0.. .... .... .. 32.7.. .. 30.3 .. .... .. 41.. .. 9.. .. 39.7.. .. 2.9.. .. 44.5.. .... .. 9.1 .. .... .... .... .... .. .. .. 45,869.. .. 3.5.. .. 19.9.. .. .. .. .. .... .. .... .. 52.9.. .. 41.4.. .. 9.8.. .. 3.2.. .. 41.4.. .... .. 5.9 .. .. .... .. 3,131.. .... .. 88.. .. 22.2.. .. 1.06
Mayotte

Economic and social contextPopulation (millions)Labor force (millions)Unemployment rate (% of labor force)GNI per capita, World Bank Atlas method ($)GDP growth, 1995–2000 and 2000–06 (average annual %)Agriculture value added (% of GDP)Industry value added (% of GDP)
Manufacturing value added (% of GDP)Services value added (% of GDP)Inflation (annual % change in consumer price index)Exchange rate (local currency units per $)Exports of goods and services (% of GDP)Imports of goods and services (% of GDP) Business environmentEase of doing business (ranking 1-178; 1=best)Time to start a business (days)Procedures to start a business (number)Firing cost (weeks of wages)Closing a business (years to resolve insolvency)Total tax rate (% of profit)Highest marginal tax rate, corporate (%)Business entry rate (new registrations as % of total)Enterprise surveys
Time dealing with gov’t officials (% of management time)Firms expected to give gifts in meetings w/tax officials (%)Firms using banks to finance investments (% of firms)Delay in obtaining an electrical connection (days)ISO certification ownership (% of firms)
Private sector investmentInvest. in infrastructure w/private participation ($ millions)Private foreign direct investment, net (% of GDP)Gross fixed capital formation (% of GDP)Gross fixed private capital formation (% of GDP) Finance and bankingGovernment cash surplus or deficit (% of GDP)Government debt (% of GDP)Deposit money banks’ assets (% of GDP)Total financial system deposits (% of GDP)Bank capital to asset ratio (%)Bank nonperforming loans to total gross loans ratio (%)Domestic credit to the private sector (% of GDP)Real interest rate (%)Interest rate spread (percentage points) Infrastructure Paved roads (% of total roads)Electric power consumption (kWh per capita)Power outages in a typical month (number)Fixed line and mobile subscribers (per 100 people)Internet users (per 100 people)Cost of telephone call to U.S. ($ per 3 minutes)
142 2008 The Little Data Book on Private Sector Development
98.0 104.2 81139.8 43.1 374
2.2 3.5 9.85,110 7,830 5,913
5.4 2.3 3.94.2 3.9 5.7
28.0 26.7 32.420.3 18.0 19.467.8 69.4 62.09.5 3.69.5 10.9
30.9 31.9 32.732.9 33.2 30.3
.. 44.. 27 41.. 8 9.. 52.0 39.7.. 1.8 2.9.. 51.2 44.5
35 29.. 7.1 9.1 .. 20.5.. 9.6.. 2.6.. 11.8.. 20.3
5,277 5,696 45,8693.1 2.3 3.5
21.4 20.4 19.917.8 16.0 ..
–1.2 .. ..23.2 .. ..32.7 29.7 52.924.6 22.9 41.49.6 13.2 9.85.8 2.1 3.2
18.3 22.1 41.44.3 2.98.7 4.2 5.9
32.8 37.0 ..1,795 1,899 3,131
.. 2.627 74 88
5.2 17.5 22.23.01 0.83 1.06
Country data
Upper middle-income group
2000 2006 2006
Latin America & Caribbean Upper middle income
Mexico
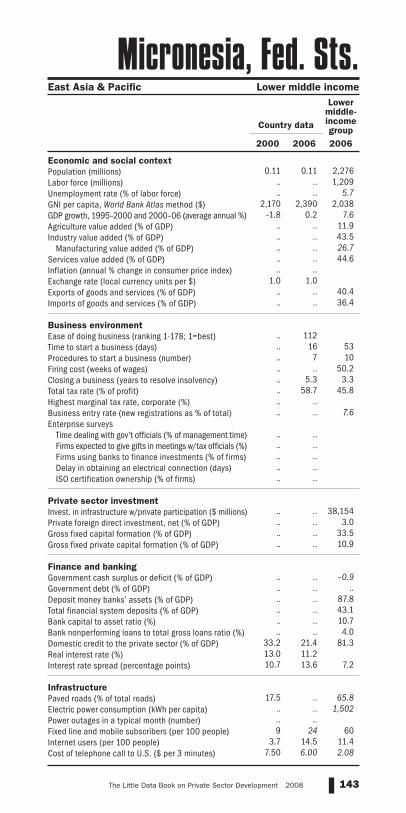
Economic and social contextPopulation (millions)Labor force (millions)Unemployment rate (% of labor force)GNI per capita, World Bank Atlas method ($)GDP growth, 1995–2000 and 2000–06 (average annual %)Agriculture value added (% of GDP)Industry value added (% of GDP)
Manufacturing value added (% of GDP)Services value added (% of GDP)Inflation (annual % change in consumer price index)Exchange rate (local currency units per $)Exports of goods and services (% of GDP)Imports of goods and services (% of GDP) Business environmentEase of doing business (ranking 1-178; 1=best)Time to start a business (days)Procedures to start a business (number)Firing cost (weeks of wages)Closing a business (years to resolve insolvency)Total tax rate (% of profit)Highest marginal tax rate, corporate (%)Business entry rate (new registrations as % of total)Enterprise surveys
Time dealing with gov’t officials (% of management time)Firms expected to give gifts in meetings w/tax officials (%)Firms using banks to finance investments (% of firms)Delay in obtaining an electrical connection (days)ISO certification ownership (% of firms)
Private sector investmentInvest. in infrastructure w/private participation ($ millions)Private foreign direct investment, net (% of GDP)Gross fixed capital formation (% of GDP)Gross fixed private capital formation (% of GDP) Finance and bankingGovernment cash surplus or deficit (% of GDP)Government debt (% of GDP)Deposit money banks’ assets (% of GDP)Total financial system deposits (% of GDP)Bank capital to asset ratio (%)Bank nonperforming loans to total gross loans ratio (%)Domestic credit to the private sector (% of GDP)Real interest rate (%)Interest rate spread (percentage points) Infrastructure Paved roads (% of total roads)Electric power consumption (kWh per capita)Power outages in a typical month (number)Fixed line and mobile subscribers (per 100 people)Internet users (per 100 people)Cost of telephone call to U.S. ($ per 3 minutes)
143The Little Data Book on Private Sector Development 2008
East Asia & Pacific Lower middle income
Country data
Lower middle-income group
2000 2006 2006
0.11 0.11 2,276
.. .. 1,209
.. .. 5.72,170 2,390 2,038
–1.8 0.2 7.6.. .. 11.9.. .. 43.5.. .. 26.7.. .. 44.6.. ..
1.0 1.0.. .. 40.4.. .. 36.4 .. 112.. 16 53.. 7 10.. .. 50.2.. 5.3 3.3.. 58.7 45.8.. .... .. 7.6 .. .... .... .... .... .. .. .. 38,154.. .. 3.0.. .. 33.5.. .. 10.9 .. .. –0.9.. .. .... .. 87.8.. .. 43.1.. .. 10.7.. .. 4.0
33.2 21.4 81.313.0 11.210.7 13.6 7.2
17.5 .. 65.8.. .. 1,502.. ..9 24 60
3.7 14.5 11.47.50 6.00 2.08
Micronesia, Fed. Sts.

Economic and social contextPopulation (millions)Labor force (millions)Unemployment rate (% of labor force)GNI per capita, World Bank Atlas method ($)GDP growth, 1995–2000 and 2000–06 (average annual %)Agriculture value added (% of GDP)Industry value added (% of GDP)
Manufacturing value added (% of GDP)Services value added (% of GDP)Inflation (annual % change in consumer price index)Exchange rate (local currency units per $)Exports of goods and services (% of GDP)Imports of goods and services (% of GDP) Business environmentEase of doing business (ranking 1-178; 1=best)Time to start a business (days)Procedures to start a business (number)Firing cost (weeks of wages)Closing a business (years to resolve insolvency)Total tax rate (% of profit)Highest marginal tax rate, corporate (%)Business entry rate (new registrations as % of total)Enterprise surveys
Time dealing with gov’t officials (% of management time)Firms expected to give gifts in meetings w/tax officials (%)Firms using banks to finance investments (% of firms)Delay in obtaining an electrical connection (days)ISO certification ownership (% of firms)
Private sector investmentInvest. in infrastructure w/private participation ($ millions)Private foreign direct investment, net (% of GDP)Gross fixed capital formation (% of GDP)Gross fixed private capital formation (% of GDP) Finance and bankingGovernment cash surplus or deficit (% of GDP)Government debt (% of GDP)Deposit money banks’ assets (% of GDP)Total financial system deposits (% of GDP)Bank capital to asset ratio (%)Bank nonperforming loans to total gross loans ratio (%)Domestic credit to the private sector (% of GDP)Real interest rate (%)Interest rate spread (percentage points) Infrastructure Paved roads (% of total roads)Electric power consumption (kWh per capita)Power outages in a typical month (number)Fixed line and mobile subscribers (per 100 people)Internet users (per 100 people)Cost of telephone call to U.S. ($ per 3 minutes)
144 2008 The Little Data Book on Private Sector Development
4.1 3.8 2,2761.9 1.9 1,2098.5 7.3 5.7370 1,080 2,038–2.6 6.8 7.629.0 18.1 11.921.7 15.1 43.516.3 14.5 26.749.2 66.8 44.631.3 11.612.4 13.149.8 45.9 40.475.4 93.2 36.4
.. 92.. 23 53.. 9 10.. 37.0 50.2.. 2.8 3.3.. 44.0 45.8.. 15
8.3 8.2 7.6 .. 3.6
68.0 43.217.8 17.718.0 28.8
.. 6.9
25 34 38,1549.9 7.2 3.0
15.4 27.9 33.513.8 25.8 10.9
–1.5 0.2 –0.973.0 29.6 ..14.1 28.2 87.811.0 29.2 43.130.6 17.0 10.720.6 4.3 4.012.7 27.9 81.35.1 4.98.9 6.2 7.2
86.1 86.3 65.8871 1,428 1,502
.. ..17 62 60
1.3 19.0 11.44.10 1.46 2.08
Country data
Lower middle-income group
2000 2006 2006
Europe & Central Asia Lower middle income
Moldova

Economic and social contextPopulation (millions)Labor force (millions)Unemployment rate (% of labor force)GNI per capita, World Bank Atlas method ($)GDP growth, 1995–2000 and 2000–06 (average annual %)Agriculture value added (% of GDP)Industry value added (% of GDP)
Manufacturing value added (% of GDP)Services value added (% of GDP)Inflation (annual % change in consumer price index)Exchange rate (local currency units per $)Exports of goods and services (% of GDP)Imports of goods and services (% of GDP) Business environmentEase of doing business (ranking 1-178; 1=best)Time to start a business (days)Procedures to start a business (number)Firing cost (weeks of wages)Closing a business (years to resolve insolvency)Total tax rate (% of profit)Highest marginal tax rate, corporate (%)Business entry rate (new registrations as % of total)Enterprise surveys
Time dealing with gov’t officials (% of management time)Firms expected to give gifts in meetings w/tax officials (%)Firms using banks to finance investments (% of firms)Delay in obtaining an electrical connection (days)ISO certification ownership (% of firms)
Private sector investmentInvest. in infrastructure w/private participation ($ millions)Private foreign direct investment, net (% of GDP)Gross fixed capital formation (% of GDP)Gross fixed private capital formation (% of GDP) Finance and bankingGovernment cash surplus or deficit (% of GDP)Government debt (% of GDP)Deposit money banks’ assets (% of GDP)Total financial system deposits (% of GDP)Bank capital to asset ratio (%)Bank nonperforming loans to total gross loans ratio (%)Domestic credit to the private sector (% of GDP)Real interest rate (%)Interest rate spread (percentage points) Infrastructure Paved roads (% of total roads)Electric power consumption (kWh per capita)Power outages in a typical month (number)Fixed line and mobile subscribers (per 100 people)Internet users (per 100 people)Cost of telephone call to U.S. ($ per 3 minutes)
145The Little Data Book on Private Sector Development 2008
High income
Country dataHigh-
income group
2000 2006 2006
.. 0.03 1,031.. .. 504.. .. 6.2.. .. 36,608.. .. 2.3.. .. 1.5.. .. 26.2.. .. 16.8.. .. 72.3.. .... .... .. 25.6.. .. 26.3 .. .... .. 22.. .. 7.. .. 34.9.. .. 2.0.. .. 41.5
33 .... .. 10.1 .. .... .... .... .... .. .. .. 849.. .. 2.7.. .. 20.4.. .. .. .. .. –1.3.. .. 47.6.. .. 99.7.. .. .... .. 6.2.. .. 1.1.. .. 162.0.. .... .. 4.4
100.0 .. 90.9.. .. 9,760.. .... .. 143.. .. 59.3.. .. 0.77
Monaco

Economic and social contextPopulation (millions)Labor force (millions)Unemployment rate (% of labor force)GNI per capita, World Bank Atlas method ($)GDP growth, 1995–2000 and 2000–06 (average annual %)Agriculture value added (% of GDP)Industry value added (% of GDP)
Manufacturing value added (% of GDP)Services value added (% of GDP)Inflation (annual % change in consumer price index)Exchange rate (local currency units per $)Exports of goods and services (% of GDP)Imports of goods and services (% of GDP) Business environmentEase of doing business (ranking 1-178; 1=best)Time to start a business (days)Procedures to start a business (number)Firing cost (weeks of wages)Closing a business (years to resolve insolvency)Total tax rate (% of profit)Highest marginal tax rate, corporate (%)Business entry rate (new registrations as % of total)Enterprise surveys
Time dealing with gov’t officials (% of management time)Firms expected to give gifts in meetings w/tax officials (%)Firms using banks to finance investments (% of firms)Delay in obtaining an electrical connection (days)ISO certification ownership (% of firms)
Private sector investmentInvest. in infrastructure w/private participation ($ millions)Private foreign direct investment, net (% of GDP)Gross fixed capital formation (% of GDP)Gross fixed private capital formation (% of GDP) Finance and bankingGovernment cash surplus or deficit (% of GDP)Government debt (% of GDP)Deposit money banks’ assets (% of GDP)Total financial system deposits (% of GDP)Bank capital to asset ratio (%)Bank nonperforming loans to total gross loans ratio (%)Domestic credit to the private sector (% of GDP)Real interest rate (%)Interest rate spread (percentage points) Infrastructure Paved roads (% of total roads)Electric power consumption (kWh per capita)Power outages in a typical month (number)Fixed line and mobile subscribers (per 100 people)Internet users (per 100 people)Cost of telephone call to U.S. ($ per 3 minutes)
146 2008 The Little Data Book on Private Sector Development
2.4 2.6 2,4201.1 1.3 995
17.5 14.2 ..410 1,000 6493.0 7.1 6.5
32.7 21.9 20.420.3 42.3 27.7
4.6 3.9 15.847.0 35.9 51.911.6 5.1
1,076.7 1,165.456.4 65.3 26.770.9 59.7 30.1
.. 52.. 20 54.. 8 10.. 9.0 62.6.. 4.0 3.8.. 38.4 67.4.. .... .. 6.4 .. 6.0.. .... 32.8.. 6.7.. 20.5
11 2 29,7854.9 11.0 2.6
25.1 32.3 26.722.0 27.9 19.6
.. –0.4 –2.6
83.3 105.5 ..11.9 34.5 50.513.7 38.2 44.6
.. .. ..
.. .. ..7.2 32.8 38.35.3 –1.4
15.9 8.4 11.3
3.5 .. .... .. 391.. ..
11 28 171.3 10.5 4.2
4.92 .. 1.99
Country dataLow-
income group
2000 2006 2006
East Asia & Pacific Low income
Mongolia
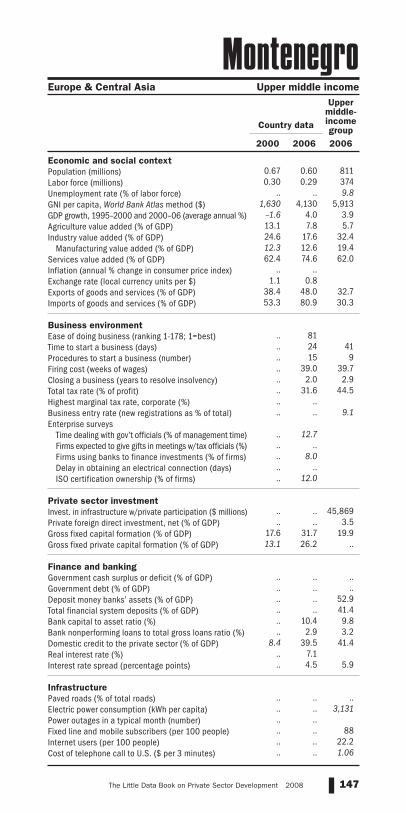
Economic and social contextPopulation (millions)Labor force (millions)Unemployment rate (% of labor force)GNI per capita, World Bank Atlas method ($)GDP growth, 1995–2000 and 2000–06 (average annual %)Agriculture value added (% of GDP)Industry value added (% of GDP)
Manufacturing value added (% of GDP)Services value added (% of GDP)Inflation (annual % change in consumer price index)Exchange rate (local currency units per $)Exports of goods and services (% of GDP)Imports of goods and services (% of GDP) Business environmentEase of doing business (ranking 1-178; 1=best)Time to start a business (days)Procedures to start a business (number)Firing cost (weeks of wages)Closing a business (years to resolve insolvency)Total tax rate (% of profit)Highest marginal tax rate, corporate (%)Business entry rate (new registrations as % of total)Enterprise surveys
Time dealing with gov’t officials (% of management time)Firms expected to give gifts in meetings w/tax officials (%)Firms using banks to finance investments (% of firms)Delay in obtaining an electrical connection (days)ISO certification ownership (% of firms)
Private sector investmentInvest. in infrastructure w/private participation ($ millions)Private foreign direct investment, net (% of GDP)Gross fixed capital formation (% of GDP)Gross fixed private capital formation (% of GDP) Finance and bankingGovernment cash surplus or deficit (% of GDP)Government debt (% of GDP)Deposit money banks’ assets (% of GDP)Total financial system deposits (% of GDP)Bank capital to asset ratio (%)Bank nonperforming loans to total gross loans ratio (%)Domestic credit to the private sector (% of GDP)Real interest rate (%)Interest rate spread (percentage points) Infrastructure Paved roads (% of total roads)Electric power consumption (kWh per capita)Power outages in a typical month (number)Fixed line and mobile subscribers (per 100 people)Internet users (per 100 people)Cost of telephone call to U.S. ($ per 3 minutes)
147The Little Data Book on Private Sector Development 2008
Europe & Central Asia Upper middle income
Country data
Upper middle-income group
2000 2006 2006
0.67 0.60 8110.30 0.29 374
.. .. 9.81,630 4,130 5,913
–1.6 4.0 3.913.1 7.8 5.724.6 17.6 32.412.3 12.6 19.462.4 74.6 62.0
.. ..1.1 0.8
38.4 48.0 32.753.3 80.9 30.3
.. 81.. 24 41.. 15 9.. 39.0 39.7.. 2.0 2.9.. 31.6 44.5.. .... .. 9.1 .. 12.7.. .... 8.0.. .... 12.0 .. .. 45,869.. .. 3.5
17.6 31.7 19.913.1 26.2 ..
.. .. .... .. .... .. 52.9.. .. 41.4.. 10.4 9.8.. 2.9 3.2
8.4 39.5 41.4.. 7.1.. 4.5 5.9 .. .. .... .. 3,131.. .... .. 88.. .. 22.2.. .. 1.06
Montenegro

Economic and social contextPopulation (millions)Labor force (millions)Unemployment rate (% of labor force)GNI per capita, World Bank Atlas method ($)GDP growth, 1995–2000 and 2000–06 (average annual %)Agriculture value added (% of GDP)Industry value added (% of GDP)
Manufacturing value added (% of GDP)Services value added (% of GDP)Inflation (annual % change in consumer price index)Exchange rate (local currency units per $)Exports of goods and services (% of GDP)Imports of goods and services (% of GDP) Business environmentEase of doing business (ranking 1-178; 1=best)Time to start a business (days)Procedures to start a business (number)Firing cost (weeks of wages)Closing a business (years to resolve insolvency)Total tax rate (% of profit)Highest marginal tax rate, corporate (%)Business entry rate (new registrations as % of total)Enterprise surveys
Time dealing with gov’t officials (% of management time)Firms expected to give gifts in meetings w/tax officials (%)Firms using banks to finance investments (% of firms)Delay in obtaining an electrical connection (days)ISO certification ownership (% of firms)
Private sector investmentInvest. in infrastructure w/private participation ($ millions)Private foreign direct investment, net (% of GDP)Gross fixed capital formation (% of GDP)Gross fixed private capital formation (% of GDP) Finance and bankingGovernment cash surplus or deficit (% of GDP)Government debt (% of GDP)Deposit money banks’ assets (% of GDP)Total financial system deposits (% of GDP)Bank capital to asset ratio (%)Bank nonperforming loans to total gross loans ratio (%)Domestic credit to the private sector (% of GDP)Real interest rate (%)Interest rate spread (percentage points) Infrastructure Paved roads (% of total roads)Electric power consumption (kWh per capita)Power outages in a typical month (number)Fixed line and mobile subscribers (per 100 people)Internet users (per 100 people)Cost of telephone call to U.S. ($ per 3 minutes)
148 2008 The Little Data Book on Private Sector Development
28.5 30.5 2,27610.0 11.3 1,20913.6 9.7 5.7
1,340 2,160 2,0383.5 5.1 7.6
14.9 15.7 11.929.1 27.8 43.517.4 16.5 26.756.0 56.5 44.6
1.9 3.310.6 8.827.9 33.0 40.433.3 38.4 36.4
.. 129.. 12 53.. 6 10.. 85.0 50.2.. 1.8 3.3.. 53.1 45.8
35 357.8 8.6 7.6
.. 9.2.. 10.7.. 12.3.. 18.8.. 22.3
2,135 716 38,1540.6 4.1 3.0
26.0 28.7 33.521.3 24.9 10.9
–4.9 –1.8 –0.956.4 43.7 ..70.7 75.9 87.862.6 82.5 43.1
9.8 7.4 10.717.5 10.9 4.051.0 58.1 81.314.2 11.98.2 7.9 7.2
56.4 61.9 65.8489 644 1,502
.. 2.513 57 600.7 20.0 11.4
2.03 1.69 2.08
Country data
Lower middle-income group
2000 2006 2006
Middle East & North Africa Lower middle income
Morocco
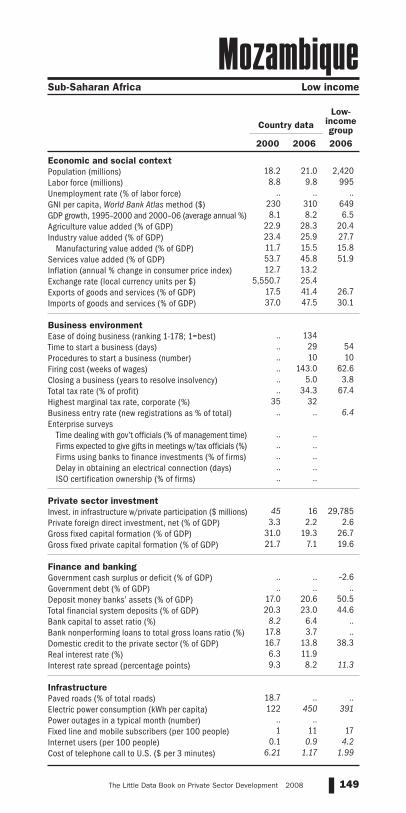
Economic and social contextPopulation (millions)Labor force (millions)Unemployment rate (% of labor force)GNI per capita, World Bank Atlas method ($)GDP growth, 1995–2000 and 2000–06 (average annual %)Agriculture value added (% of GDP)Industry value added (% of GDP)
Manufacturing value added (% of GDP)Services value added (% of GDP)Inflation (annual % change in consumer price index)Exchange rate (local currency units per $)Exports of goods and services (% of GDP)Imports of goods and services (% of GDP) Business environmentEase of doing business (ranking 1-178; 1=best)Time to start a business (days)Procedures to start a business (number)Firing cost (weeks of wages)Closing a business (years to resolve insolvency)Total tax rate (% of profit)Highest marginal tax rate, corporate (%)Business entry rate (new registrations as % of total)Enterprise surveys
Time dealing with gov’t officials (% of management time)Firms expected to give gifts in meetings w/tax officials (%)Firms using banks to finance investments (% of firms)Delay in obtaining an electrical connection (days)ISO certification ownership (% of firms)
Private sector investmentInvest. in infrastructure w/private participation ($ millions)Private foreign direct investment, net (% of GDP)Gross fixed capital formation (% of GDP)Gross fixed private capital formation (% of GDP) Finance and bankingGovernment cash surplus or deficit (% of GDP)Government debt (% of GDP)Deposit money banks’ assets (% of GDP)Total financial system deposits (% of GDP)Bank capital to asset ratio (%)Bank nonperforming loans to total gross loans ratio (%)Domestic credit to the private sector (% of GDP)Real interest rate (%)Interest rate spread (percentage points) Infrastructure Paved roads (% of total roads)Electric power consumption (kWh per capita)Power outages in a typical month (number)Fixed line and mobile subscribers (per 100 people)Internet users (per 100 people)Cost of telephone call to U.S. ($ per 3 minutes)
149The Little Data Book on Private Sector Development 2008
18.2 21.0 2,420
8.8 9.8 995.. .. ..
230 310 6498.1 8.2 6.5
22.9 28.3 20.423.4 25.9 27.711.7 15.5 15.853.7 45.8 51.912.7 13.2
5,550.7 25.417.5 41.4 26.737.0 47.5 30.1
.. 134.. 29 54.. 10 10.. 143.0 62.6.. 5.0 3.8.. 34.3 67.4
35 32.. .. 6.4 .. .... .... .... .... ..
45 16 29,7853.3 2.2 2.6
31.0 19.3 26.721.7 7.1 19.6
.. .. –2.6.. .. ..
17.0 20.6 50.520.3 23.0 44.6
8.2 6.4 ..17.8 3.7 ..16.7 13.8 38.36.3 11.99.3 8.2 11.3
18.7 .. ..122 450 391
.. ..1 11 17
0.1 0.9 4.26.21 1.17 1.99
Country dataLow-
income group
2000 2006 2006
Sub-Saharan Africa Low income
Mozambique

Economic and social contextPopulation (millions)Labor force (millions)Unemployment rate (% of labor force)GNI per capita, World Bank Atlas method ($)GDP growth, 1995–2000 and 2000–06 (average annual %)Agriculture value added (% of GDP)Industry value added (% of GDP)
Manufacturing value added (% of GDP)Services value added (% of GDP)Inflation (annual % change in consumer price index)Exchange rate (local currency units per $)Exports of goods and services (% of GDP)Imports of goods and services (% of GDP) Business environmentEase of doing business (ranking 1-178; 1=best)Time to start a business (days)Procedures to start a business (number)Firing cost (weeks of wages)Closing a business (years to resolve insolvency)Total tax rate (% of profit)Highest marginal tax rate, corporate (%)Business entry rate (new registrations as % of total)Enterprise surveys
Time dealing with gov’t officials (% of management time)Firms expected to give gifts in meetings w/tax officials (%)Firms using banks to finance investments (% of firms)Delay in obtaining an electrical connection (days)ISO certification ownership (% of firms)
Private sector investmentInvest. in infrastructure w/private participation ($ millions)Private foreign direct investment, net (% of GDP)Gross fixed capital formation (% of GDP)Gross fixed private capital formation (% of GDP) Finance and bankingGovernment cash surplus or deficit (% of GDP)Government debt (% of GDP)Deposit money banks’ assets (% of GDP)Total financial system deposits (% of GDP)Bank capital to asset ratio (%)Bank nonperforming loans to total gross loans ratio (%)Domestic credit to the private sector (% of GDP)Real interest rate (%)Interest rate spread (percentage points) Infrastructure Paved roads (% of total roads)Electric power consumption (kWh per capita)Power outages in a typical month (number)Fixed line and mobile subscribers (per 100 people)Internet users (per 100 people)Cost of telephone call to U.S. ($ per 3 minutes)
150 2008 The Little Data Book on Private Sector Development
45.9 48.4 2,42024.7 27.3 995
.. .. ..
.. .. 6497.6 9.2 6.5
57.2 .. 20.49.7 .. 27.77.2 .. 15.8
33.1 .. 51.9–0.1 20.06.4 5.80.4 .. 26.71.1 .. 30.1
.. .... .. 54.. .. 10.. .. 62.6.. .. 3.8.. .. 67.4
30 .... .. 6.4 .. .... .... .... .... ..
325 .. 29,785.. .. 2.6
12.0 .. 26.77.5 .. 19.6
.. –1.8 –2.6.. .. ..
11.3 4.8 50.514.6 6.5 44.6
.. .. ..
.. .. ..10.4 5.6 38.38.6 –2.25.5 5.5 11.3
11.4 .. ..77 82 391
.. ..1 1 17
0.0 0.2 4.20.44 0.17 1.99
Country dataLow-
income group
2000 2006 2006
East Asia & Pacific Low income
Myanmar

Economic and social contextPopulation (millions)Labor force (millions)Unemployment rate (% of labor force)GNI per capita, World Bank Atlas method ($)GDP growth, 1995–2000 and 2000–06 (average annual %)Agriculture value added (% of GDP)Industry value added (% of GDP)
Manufacturing value added (% of GDP)Services value added (% of GDP)Inflation (annual % change in consumer price index)Exchange rate (local currency units per $)Exports of goods and services (% of GDP)Imports of goods and services (% of GDP) Business environmentEase of doing business (ranking 1-178; 1=best)Time to start a business (days)Procedures to start a business (number)Firing cost (weeks of wages)Closing a business (years to resolve insolvency)Total tax rate (% of profit)Highest marginal tax rate, corporate (%)Business entry rate (new registrations as % of total)Enterprise surveys
Time dealing with gov’t officials (% of management time)Firms expected to give gifts in meetings w/tax officials (%)Firms using banks to finance investments (% of firms)Delay in obtaining an electrical connection (days)ISO certification ownership (% of firms)
Private sector investmentInvest. in infrastructure w/private participation ($ millions)Private foreign direct investment, net (% of GDP)Gross fixed capital formation (% of GDP)Gross fixed private capital formation (% of GDP) Finance and bankingGovernment cash surplus or deficit (% of GDP)Government debt (% of GDP)Deposit money banks’ assets (% of GDP)Total financial system deposits (% of GDP)Bank capital to asset ratio (%)Bank nonperforming loans to total gross loans ratio (%)Domestic credit to the private sector (% of GDP)Real interest rate (%)Interest rate spread (percentage points) Infrastructure Paved roads (% of total roads)Electric power consumption (kWh per capita)Power outages in a typical month (number)Fixed line and mobile subscribers (per 100 people)Internet users (per 100 people)Cost of telephone call to U.S. ($ per 3 minutes)
151The Little Data Book on Private Sector Development 2008
Sub-Saharan Africa Lower middle income
Country data
Lower middle-income group
2000 2006 2006
1.9 2.0 2,276
0.61 0.69 1,20920.3 .. 5.7
1,880 3,210 2,0383.5 4.8 7.6
11.0 10.9 11.928.4 30.6 43.511.1 13.9 26.760.7 58.5 44.6
.. 5.16.9 6.8
45.6 54.5 40.451.2 55.5 36.4
.. 43.. 99 53.. 10 10.. 24.0 50.2.. 1.5 3.3.. 26.5 45.8
35 35.. .. 7.6 .. 2.9.. 2.6.. 8.1.. 9.2.. 17.6
10 9 38,154.. .. 3.0
18.8 28.2 33.512.7 20.0 10.9
–3.0 –6.8 –0.9.. .. ..
46.5 56.3 87.835.2 38.8 43.1
8.7 8.3 10.73.4 2.9 4.0
45.6 61.7 81.34.2 1.97.9 4.9 7.2
13.6 .. 65.81,270 1,428 1,502
.. 1.710 31 60
1.6 4.0 11.44.28 .. 2.08
Namibia

Economic and social contextPopulation (millions)Labor force (millions)Unemployment rate (% of labor force)GNI per capita, World Bank Atlas method ($)GDP growth, 1995–2000 and 2000–06 (average annual %)Agriculture value added (% of GDP)Industry value added (% of GDP)
Manufacturing value added (% of GDP)Services value added (% of GDP)Inflation (annual % change in consumer price index)Exchange rate (local currency units per $)Exports of goods and services (% of GDP)Imports of goods and services (% of GDP) Business environmentEase of doing business (ranking 1-178; 1=best)Time to start a business (days)Procedures to start a business (number)Firing cost (weeks of wages)Closing a business (years to resolve insolvency)Total tax rate (% of profit)Highest marginal tax rate, corporate (%)Business entry rate (new registrations as % of total)Enterprise surveys
Time dealing with gov’t officials (% of management time)Firms expected to give gifts in meetings w/tax officials (%)Firms using banks to finance investments (% of firms)Delay in obtaining an electrical connection (days)ISO certification ownership (% of firms)
Private sector investmentInvest. in infrastructure w/private participation ($ millions)Private foreign direct investment, net (% of GDP)Gross fixed capital formation (% of GDP)Gross fixed private capital formation (% of GDP) Finance and bankingGovernment cash surplus or deficit (% of GDP)Government debt (% of GDP)Deposit money banks’ assets (% of GDP)Total financial system deposits (% of GDP)Bank capital to asset ratio (%)Bank nonperforming loans to total gross loans ratio (%)Domestic credit to the private sector (% of GDP)Real interest rate (%)Interest rate spread (percentage points) Infrastructure Paved roads (% of total roads)Electric power consumption (kWh per capita)Power outages in a typical month (number)Fixed line and mobile subscribers (per 100 people)Internet users (per 100 people)Cost of telephone call to U.S. ($ per 3 minutes)
152 2008 The Little Data Book on Private Sector Development
24.4 27.6 2,4209.2 10.8 9958.8 .. ..
220 320 6494.6 3.3 6.5
40.8 34.4 20.422.1 16.3 27.79.4 7.7 15.8
37.0 49.3 51.92.5 7.6
71.1 72.823.3 13.6 26.732.4 31.7 30.1
.. 111.. 31 54.. 7 10.. 90.0 62.6.. 5.0 3.8.. 32.5 67.4.. .... .. 6.4 .. .... .... .... .... ..
54 34 29,7850.0 –0.1 2.6
19.3 20.9 26.712.4 18.2 19.6
.. –1.6 –2.6
64.6 50.3 ..31.9 55.5 50.535.4 50.7 44.6
.. .. ..
.. .. ..30.7 37.7 38.3
4.7 1.23.5 5.9 11.3
30.8 56.9 ..58 70 391
.. ..1 6 17
0.2 0.9 4.25.28 2.04 1.99
Country dataLow-
income group
2000 2006 2006
South Asia Low income
Nepal

Economic and social contextPopulation (millions)Labor force (millions)Unemployment rate (% of labor force)GNI per capita, World Bank Atlas method ($)GDP growth, 1995–2000 and 2000–06 (average annual %)Agriculture value added (% of GDP)Industry value added (% of GDP)
Manufacturing value added (% of GDP)Services value added (% of GDP)Inflation (annual % change in consumer price index)Exchange rate (local currency units per $)Exports of goods and services (% of GDP)Imports of goods and services (% of GDP) Business environmentEase of doing business (ranking 1-178; 1=best)Time to start a business (days)Procedures to start a business (number)Firing cost (weeks of wages)Closing a business (years to resolve insolvency)Total tax rate (% of profit)Highest marginal tax rate, corporate (%)Business entry rate (new registrations as % of total)Enterprise surveys
Time dealing with gov’t officials (% of management time)Firms expected to give gifts in meetings w/tax officials (%)Firms using banks to finance investments (% of firms)Delay in obtaining an electrical connection (days)ISO certification ownership (% of firms)
Private sector investmentInvest. in infrastructure w/private participation ($ millions)Private foreign direct investment, net (% of GDP)Gross fixed capital formation (% of GDP)Gross fixed private capital formation (% of GDP) Finance and bankingGovernment cash surplus or deficit (% of GDP)Government debt (% of GDP)Deposit money banks’ assets (% of GDP)Total financial system deposits (% of GDP)Bank capital to asset ratio (%)Bank nonperforming loans to total gross loans ratio (%)Domestic credit to the private sector (% of GDP)Real interest rate (%)Interest rate spread (percentage points) Infrastructure Paved roads (% of total roads)Electric power consumption (kWh per capita)Power outages in a typical month (number)Fixed line and mobile subscribers (per 100 people)Internet users (per 100 people)Cost of telephone call to U.S. ($ per 3 minutes)
153The Little Data Book on Private Sector Development 2008
High income
Country dataHigh-
income group
2000 2006 2006
15.9 16.3 1,031
8.1 8.6 5042.9 5.2 6.2
26,580 43,050 36,6084.1 1.3 2.32.6 2.3 1.5
24.9 24.6 26.215.6 14.1 16.872.4 73.2 72.3
2.5 1.11.1 0.8
70.1 74.2 25.664.5 66.5 26.3
.. 21.. 10 22.. 6 7.. 17.0 34.9.. 1.1 2.0.. 43.4 41.5
35 309.4 11.3 10.1
.. .... .... .... .... .. .. .. 849
16.4 1.1 2.721.9 20.1 20.4
.. .. ..
2.0 0.5 –1.354.5 49.0 47.6
.. .. 99.7
.. .. ..5.1 4.0 6.21.8 1.0 1.1
134.2 176.2 162.00.6 2.01.9 0.6 4.4
90.0 .. 90.96,560 6,988 9,760
.. ..130 144 143
44.0 89.0 59.30.56 0.32 0.77
Netherlands

Economic and social contextPopulation (millions)Labor force (millions)Unemployment rate (% of labor force)GNI per capita, World Bank Atlas method ($)GDP growth, 1995–2000 and 2000–06 (average annual %)Agriculture value added (% of GDP)Industry value added (% of GDP)
Manufacturing value added (% of GDP)Services value added (% of GDP)Inflation (annual % change in consumer price index)Exchange rate (local currency units per $)Exports of goods and services (% of GDP)Imports of goods and services (% of GDP) Business environmentEase of doing business (ranking 1-178; 1=best)Time to start a business (days)Procedures to start a business (number)Firing cost (weeks of wages)Closing a business (years to resolve insolvency)Total tax rate (% of profit)Highest marginal tax rate, corporate (%)Business entry rate (new registrations as % of total)Enterprise surveys
Time dealing with gov’t officials (% of management time)Firms expected to give gifts in meetings w/tax officials (%)Firms using banks to finance investments (% of firms)Delay in obtaining an electrical connection (days)ISO certification ownership (% of firms)
Private sector investmentInvest. in infrastructure w/private participation ($ millions)Private foreign direct investment, net (% of GDP)Gross fixed capital formation (% of GDP)Gross fixed private capital formation (% of GDP) Finance and bankingGovernment cash surplus or deficit (% of GDP)Government debt (% of GDP)Deposit money banks’ assets (% of GDP)Total financial system deposits (% of GDP)Bank capital to asset ratio (%)Bank nonperforming loans to total gross loans ratio (%)Domestic credit to the private sector (% of GDP)Real interest rate (%)Interest rate spread (percentage points) Infrastructure Paved roads (% of total roads)Electric power consumption (kWh per capita)Power outages in a typical month (number)Fixed line and mobile subscribers (per 100 people)Internet users (per 100 people)Cost of telephone call to U.S. ($ per 3 minutes)
154 2008 The Little Data Book on Private Sector Development
0.18 0.19 1,0310.08 0.09 50414.0 15.1 6.2
.. .. 36,608
.. .. 2.3
.. .. 1.5
.. .. 26.2
.. .. 16.8
.. .. 72.35.8 3.11.8 1.8
.. .. 25.6
.. .. 26.3 .. .... .. 22.. .. 7.. .. 34.9.. .. 2.0.. .. 41.5
35 35.. .. 10.1 .. .... .... .... .... .. .. .. 849.. .. 2.7.. .. 20.4.. .. .. .. .. –1.3.. .. 47.6.. .. 99.7.. .. .... .. 6.2.. .. 1.1.. .. 162.0.. ..
6.2 6.5 4.4 .. .. 90.9
5,402 5,172 9,760.. ..
60 .. 1431.1 .. 59.3
.. .. 0.77
Country dataHigh-
income group
2000 2006 2006
High income
Netherlands Antilles

Economic and social contextPopulation (millions)Labor force (millions)Unemployment rate (% of labor force)GNI per capita, World Bank Atlas method ($)GDP growth, 1995–2000 and 2000–06 (average annual %)Agriculture value added (% of GDP)Industry value added (% of GDP)
Manufacturing value added (% of GDP)Services value added (% of GDP)Inflation (annual % change in consumer price index)Exchange rate (local currency units per $)Exports of goods and services (% of GDP)Imports of goods and services (% of GDP) Business environmentEase of doing business (ranking 1-178; 1=best)Time to start a business (days)Procedures to start a business (number)Firing cost (weeks of wages)Closing a business (years to resolve insolvency)Total tax rate (% of profit)Highest marginal tax rate, corporate (%)Business entry rate (new registrations as % of total)Enterprise surveys
Time dealing with gov’t officials (% of management time)Firms expected to give gifts in meetings w/tax officials (%)Firms using banks to finance investments (% of firms)Delay in obtaining an electrical connection (days)ISO certification ownership (% of firms)
Private sector investmentInvest. in infrastructure w/private participation ($ millions)Private foreign direct investment, net (% of GDP)Gross fixed capital formation (% of GDP)Gross fixed private capital formation (% of GDP) Finance and bankingGovernment cash surplus or deficit (% of GDP)Government debt (% of GDP)Deposit money banks’ assets (% of GDP)Total financial system deposits (% of GDP)Bank capital to asset ratio (%)Bank nonperforming loans to total gross loans ratio (%)Domestic credit to the private sector (% of GDP)Real interest rate (%)Interest rate spread (percentage points) Infrastructure Paved roads (% of total roads)Electric power consumption (kWh per capita)Power outages in a typical month (number)Fixed line and mobile subscribers (per 100 people)Internet users (per 100 people)Cost of telephone call to U.S. ($ per 3 minutes)
155The Little Data Book on Private Sector Development 2008
High income
Country dataHigh-
income group
2000 2006 2006
0.21 0.24 1,0310.09 0.10 504
.. .. 6.214,020 .. 36,608
0.2 .. 2.33.7 .. 1.5
19.6 .. 26.24.0 .. 16.8
76.7 .. 72.3.. ..
129.5 95.113.1 .. 25.633.0 .. 26.3
.. .... .. 22.. .. 7.. .. 34.9.. .. 2.0.. .. 41.5
30 30.. .. 10.1 .. .... .... .... .... .. .. .. 849.. .. 2.7.. .. 20.4.. .. .. .. .. –1.3.. .. 47.6.. .. 99.7.. .. .... .. 6.2.. .. 1.1.. .. 162.0.. .... .. 4.4 .. .. 90.9.. .. 9,760.. ..
47 81 14314.1 33.6 59.33.43 3.13 0.77
New Caledonia

Economic and social contextPopulation (millions)Labor force (millions)Unemployment rate (% of labor force)GNI per capita, World Bank Atlas method ($)GDP growth, 1995–2000 and 2000–06 (average annual %)Agriculture value added (% of GDP)Industry value added (% of GDP)
Manufacturing value added (% of GDP)Services value added (% of GDP)Inflation (annual % change in consumer price index)Exchange rate (local currency units per $)Exports of goods and services (% of GDP)Imports of goods and services (% of GDP) Business environmentEase of doing business (ranking 1-178; 1=best)Time to start a business (days)Procedures to start a business (number)Firing cost (weeks of wages)Closing a business (years to resolve insolvency)Total tax rate (% of profit)Highest marginal tax rate, corporate (%)Business entry rate (new registrations as % of total)Enterprise surveys
Time dealing with gov’t officials (% of management time)Firms expected to give gifts in meetings w/tax officials (%)Firms using banks to finance investments (% of firms)Delay in obtaining an electrical connection (days)ISO certification ownership (% of firms)
Private sector investmentInvest. in infrastructure w/private participation ($ millions)Private foreign direct investment, net (% of GDP)Gross fixed capital formation (% of GDP)Gross fixed private capital formation (% of GDP) Finance and bankingGovernment cash surplus or deficit (% of GDP)Government debt (% of GDP)Deposit money banks’ assets (% of GDP)Total financial system deposits (% of GDP)Bank capital to asset ratio (%)Bank nonperforming loans to total gross loans ratio (%)Domestic credit to the private sector (% of GDP)Real interest rate (%)Interest rate spread (percentage points) Infrastructure Paved roads (% of total roads)Electric power consumption (kWh per capita)Power outages in a typical month (number)Fixed line and mobile subscribers (per 100 people)Internet users (per 100 people)Cost of telephone call to U.S. ($ per 3 minutes)
156 2008 The Little Data Book on Private Sector Development
3.9 4.2 1,0311.9 2.2 5045.9 3.7 6.2
13,760 26,750 36,6082.5 3.3 2.38.9 .. 1.5
25.3 .. 26.216.9 .. 16.865.8 .. 72.3
2.6 3.42.2 1.5
35.5 27.8 25.633.8 30.5 26.3
.. 2.. 12 22.. 2 7.. .. 34.9.. 1.3 2.0.. 35.1 41.5
33 3315.6 16.1 10.1
.. .... .... .... .... .. .. .. 849
7.4 7.6 2.720.4 23.9 20.4
.. .. ..
1.7 4.7 –1.333.9 45.9 47.6
.. .. 99.7
.. .. ..
.. .. 6.2
.. .. 1.1111.5 144.2 162.0
6.5 10.83.9 5.3 4.4
62.8 64.9 90.99,076 9,656 9,760
.. ..87 127 143
39.3 76.5 59.30.80 1.30 0.77
Country dataHigh-
income group
2000 2006 2006
High income
New Zealand

Economic and social contextPopulation (millions)Labor force (millions)Unemployment rate (% of labor force)GNI per capita, World Bank Atlas method ($)GDP growth, 1995–2000 and 2000–06 (average annual %)Agriculture value added (% of GDP)Industry value added (% of GDP)
Manufacturing value added (% of GDP)Services value added (% of GDP)Inflation (annual % change in consumer price index)Exchange rate (local currency units per $)Exports of goods and services (% of GDP)Imports of goods and services (% of GDP) Business environmentEase of doing business (ranking 1-178; 1=best)Time to start a business (days)Procedures to start a business (number)Firing cost (weeks of wages)Closing a business (years to resolve insolvency)Total tax rate (% of profit)Highest marginal tax rate, corporate (%)Business entry rate (new registrations as % of total)Enterprise surveys
Time dealing with gov’t officials (% of management time)Firms expected to give gifts in meetings w/tax officials (%)Firms using banks to finance investments (% of firms)Delay in obtaining an electrical connection (days)ISO certification ownership (% of firms)
Private sector investmentInvest. in infrastructure w/private participation ($ millions)Private foreign direct investment, net (% of GDP)Gross fixed capital formation (% of GDP)Gross fixed private capital formation (% of GDP) Finance and bankingGovernment cash surplus or deficit (% of GDP)Government debt (% of GDP)Deposit money banks’ assets (% of GDP)Total financial system deposits (% of GDP)Bank capital to asset ratio (%)Bank nonperforming loans to total gross loans ratio (%)Domestic credit to the private sector (% of GDP)Real interest rate (%)Interest rate spread (percentage points) Infrastructure Paved roads (% of total roads)Electric power consumption (kWh per capita)Power outages in a typical month (number)Fixed line and mobile subscribers (per 100 people)Internet users (per 100 people)Cost of telephone call to U.S. ($ per 3 minutes)
157The Little Data Book on Private Sector Development 2008
Latin America & Caribbean Lower middle income
Country data
Lower middle-income group
2000 2006 2006
5.1 5.5 2,2761.8 2.1 1,2096.2 8.0 5.7730 930 2,0385.0 3.3 7.6
20.9 19.7 11.928.2 29.5 43.517.0 18.5 26.750.9 50.8 44.6
3.8 9.112.7 17.623.9 31.1 40.451.1 61.0 36.4
.. 93.. 39 53.. 6 10.. 24.0 50.2.. 2.2 3.3.. 63.2 45.8
25 30.. .. 7.6 .. 9.3.. 2.6.. 13.0.. 62.7.. 18.7
219 76 38,1546.8 5.3 3.0
26.5 27.9 33.519.8 22.1 10.9
–3.6 0.1 –0.9.. .. .... 36.1 87.8.. 33.3 43.1
6.3 8.8 10.75.2 8.0 4.0
33.2 33.8 81.38.8 0.97.3 6.7 7.2
11.1 .. 65.8337 414 1,502
.. 13.25 38 60
1.0 2.8 11.43.20 3.15 2.08
Nicaragua
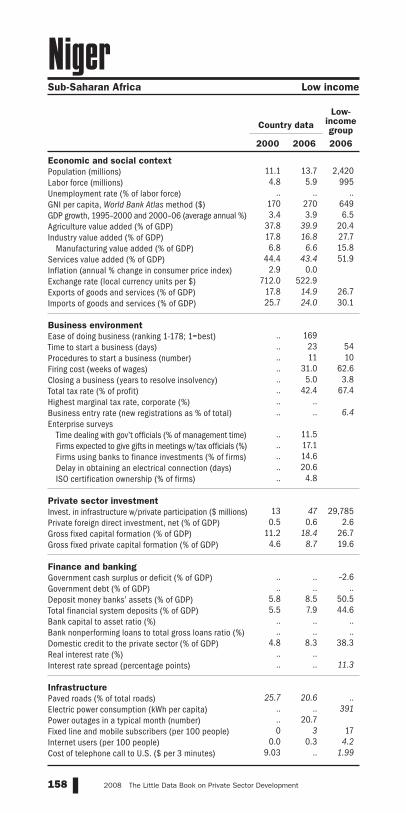
Economic and social contextPopulation (millions)Labor force (millions)Unemployment rate (% of labor force)GNI per capita, World Bank Atlas method ($)GDP growth, 1995–2000 and 2000–06 (average annual %)Agriculture value added (% of GDP)Industry value added (% of GDP)
Manufacturing value added (% of GDP)Services value added (% of GDP)Inflation (annual % change in consumer price index)Exchange rate (local currency units per $)Exports of goods and services (% of GDP)Imports of goods and services (% of GDP) Business environmentEase of doing business (ranking 1-178; 1=best)Time to start a business (days)Procedures to start a business (number)Firing cost (weeks of wages)Closing a business (years to resolve insolvency)Total tax rate (% of profit)Highest marginal tax rate, corporate (%)Business entry rate (new registrations as % of total)Enterprise surveys
Time dealing with gov’t officials (% of management time)Firms expected to give gifts in meetings w/tax officials (%)Firms using banks to finance investments (% of firms)Delay in obtaining an electrical connection (days)ISO certification ownership (% of firms)
Private sector investmentInvest. in infrastructure w/private participation ($ millions)Private foreign direct investment, net (% of GDP)Gross fixed capital formation (% of GDP)Gross fixed private capital formation (% of GDP) Finance and bankingGovernment cash surplus or deficit (% of GDP)Government debt (% of GDP)Deposit money banks’ assets (% of GDP)Total financial system deposits (% of GDP)Bank capital to asset ratio (%)Bank nonperforming loans to total gross loans ratio (%)Domestic credit to the private sector (% of GDP)Real interest rate (%)Interest rate spread (percentage points) Infrastructure Paved roads (% of total roads)Electric power consumption (kWh per capita)Power outages in a typical month (number)Fixed line and mobile subscribers (per 100 people)Internet users (per 100 people)Cost of telephone call to U.S. ($ per 3 minutes)
158 2008 The Little Data Book on Private Sector Development
11.1 13.7 2,4204.8 5.9 995
.. .. ..170 270 6493.4 3.9 6.5
37.8 39.9 20.417.8 16.8 27.76.8 6.6 15.8
44.4 43.4 51.92.9 0.0
712.0 522.917.8 14.9 26.725.7 24.0 30.1
.. 169.. 23 54.. 11 10.. 31.0 62.6.. 5.0 3.8.. 42.4 67.4.. .... .. 6.4 .. 11.5.. 17.1.. 14.6.. 20.6.. 4.8
13 47 29,7850.5 0.6 2.6
11.2 18.4 26.74.6 8.7 19.6
.. .. –2.6.. .. ..
5.8 8.5 50.55.5 7.9 44.6
.. .. ..
.. .. ..4.8 8.3 38.3
.. ..
.. .. 11.3
25.7 20.6 .... .. 391.. 20.70 3 17
0.0 0.3 4.29.03 .. 1.99
Country dataLow-
income group
2000 2006 2006
Sub-Saharan Africa Low income
Niger

Economic and social contextPopulation (millions)Labor force (millions)Unemployment rate (% of labor force)GNI per capita, World Bank Atlas method ($)GDP growth, 1995–2000 and 2000–06 (average annual %)Agriculture value added (% of GDP)Industry value added (% of GDP)
Manufacturing value added (% of GDP)Services value added (% of GDP)Inflation (annual % change in consumer price index)Exchange rate (local currency units per $)Exports of goods and services (% of GDP)Imports of goods and services (% of GDP) Business environmentEase of doing business (ranking 1-178; 1=best)Time to start a business (days)Procedures to start a business (number)Firing cost (weeks of wages)Closing a business (years to resolve insolvency)Total tax rate (% of profit)Highest marginal tax rate, corporate (%)Business entry rate (new registrations as % of total)Enterprise surveys
Time dealing with gov’t officials (% of management time)Firms expected to give gifts in meetings w/tax officials (%)Firms using banks to finance investments (% of firms)Delay in obtaining an electrical connection (days)ISO certification ownership (% of firms)
Private sector investmentInvest. in infrastructure w/private participation ($ millions)Private foreign direct investment, net (% of GDP)Gross fixed capital formation (% of GDP)Gross fixed private capital formation (% of GDP) Finance and bankingGovernment cash surplus or deficit (% of GDP)Government debt (% of GDP)Deposit money banks’ assets (% of GDP)Total financial system deposits (% of GDP)Bank capital to asset ratio (%)Bank nonperforming loans to total gross loans ratio (%)Domestic credit to the private sector (% of GDP)Real interest rate (%)Interest rate spread (percentage points) Infrastructure Paved roads (% of total roads)Electric power consumption (kWh per capita)Power outages in a typical month (number)Fixed line and mobile subscribers (per 100 people)Internet users (per 100 people)Cost of telephone call to U.S. ($ per 3 minutes)
159The Little Data Book on Private Sector Development 2008
Sub-Saharan Africa Low income
Country dataLow-
income group
2000 2006 2006
124.8 144.7 2,42045.0 52.7 995
.. .. ..270 620 6492.7 6.0 6.5
26.3 23.3 20.452.7 56.8 27.7
3.7 4.0 15.821.0 19.9 51.96.9 8.2
101.7 128.754.3 56.3 26.732.2 34.7 30.1
.. 108.. 34 54.. 9 10.. 50.0 62.6.. 2.0 3.8.. 29.9 67.4
30 .... .. 6.4 .. .... .... .... .... ..
76 2,797 29,7852.5 4.7 2.6
20.3 22.0 26.710.7 11.7 19.6
.. .. –2.6.. .. ..
15.5 17.0 50.512.6 13.2 44.6
7.4 14.7 ..22.6 21.9 ..12.5 15.0 38.3
–12.2 8.39.6 7.2 11.3
30.9 15.0 ..73 127 391
.. ..0 24 17
0.1 5.5 4.27.15 1.49 1.99
Nigeria

Economic and social contextPopulation (millions)Labor force (millions)Unemployment rate (% of labor force)GNI per capita, World Bank Atlas method ($)GDP growth, 1995–2000 and 2000–06 (average annual %)Agriculture value added (% of GDP)Industry value added (% of GDP)
Manufacturing value added (% of GDP)Services value added (% of GDP)Inflation (annual % change in consumer price index)Exchange rate (local currency units per $)Exports of goods and services (% of GDP)Imports of goods and services (% of GDP) Business environmentEase of doing business (ranking 1-178; 1=best)Time to start a business (days)Procedures to start a business (number)Firing cost (weeks of wages)Closing a business (years to resolve insolvency)Total tax rate (% of profit)Highest marginal tax rate, corporate (%)Business entry rate (new registrations as % of total)Enterprise surveys
Time dealing with gov’t officials (% of management time)Firms expected to give gifts in meetings w/tax officials (%)Firms using banks to finance investments (% of firms)Delay in obtaining an electrical connection (days)ISO certification ownership (% of firms)
Private sector investmentInvest. in infrastructure w/private participation ($ millions)Private foreign direct investment, net (% of GDP)Gross fixed capital formation (% of GDP)Gross fixed private capital formation (% of GDP) Finance and bankingGovernment cash surplus or deficit (% of GDP)Government debt (% of GDP)Deposit money banks’ assets (% of GDP)Total financial system deposits (% of GDP)Bank capital to asset ratio (%)Bank nonperforming loans to total gross loans ratio (%)Domestic credit to the private sector (% of GDP)Real interest rate (%)Interest rate spread (percentage points) Infrastructure Paved roads (% of total roads)Electric power consumption (kWh per capita)Power outages in a typical month (number)Fixed line and mobile subscribers (per 100 people)Internet users (per 100 people)Cost of telephone call to U.S. ($ per 3 minutes)
160 2008 The Little Data Book on Private Sector Development
.. 0.08 811.. .. 374.. .. 9.8.. .. 5,913.. .. 3.9.. .. 5.7.. .. 32.4.. .. 19.4.. .. 62.0.. .... .... .. 32.7.. .. 30.3 .. .... .. 41.. .. 9.. .. 39.7.. .. 2.9.. .. 44.5.. .... .. 9.1 .. .... .... .... .... .. .. .. 45,869.. .. 3.5.. .. 19.9.. .. .. .. .. .... .. .... .. 52.9.. .. 41.4.. .. 9.8.. .. 3.2.. .. 41.4.. .... .. 5.9 .. .. .... .. 3,131.. .... .. 88.. .. 22.2.. .. 1.06
Country data
Upper middle-income group
2000 2006 2006
East Asia & Pacific Upper middle income
Northern Mariana Islands

Economic and social contextPopulation (millions)Labor force (millions)Unemployment rate (% of labor force)GNI per capita, World Bank Atlas method ($)GDP growth, 1995–2000 and 2000–06 (average annual %)Agriculture value added (% of GDP)Industry value added (% of GDP)
Manufacturing value added (% of GDP)Services value added (% of GDP)Inflation (annual % change in consumer price index)Exchange rate (local currency units per $)Exports of goods and services (% of GDP)Imports of goods and services (% of GDP) Business environmentEase of doing business (ranking 1-178; 1=best)Time to start a business (days)Procedures to start a business (number)Firing cost (weeks of wages)Closing a business (years to resolve insolvency)Total tax rate (% of profit)Highest marginal tax rate, corporate (%)Business entry rate (new registrations as % of total)Enterprise surveys
Time dealing with gov’t officials (% of management time)Firms expected to give gifts in meetings w/tax officials (%)Firms using banks to finance investments (% of firms)Delay in obtaining an electrical connection (days)ISO certification ownership (% of firms)
Private sector investmentInvest. in infrastructure w/private participation ($ millions)Private foreign direct investment, net (% of GDP)Gross fixed capital formation (% of GDP)Gross fixed private capital formation (% of GDP) Finance and bankingGovernment cash surplus or deficit (% of GDP)Government debt (% of GDP)Deposit money banks’ assets (% of GDP)Total financial system deposits (% of GDP)Bank capital to asset ratio (%)Bank nonperforming loans to total gross loans ratio (%)Domestic credit to the private sector (% of GDP)Real interest rate (%)Interest rate spread (percentage points) Infrastructure Paved roads (% of total roads)Electric power consumption (kWh per capita)Power outages in a typical month (number)Fixed line and mobile subscribers (per 100 people)Internet users (per 100 people)Cost of telephone call to U.S. ($ per 3 minutes)
161The Little Data Book on Private Sector Development 2008
High income
Country dataHigh-
income group
2000 2006 2006
4.5 4.7 1,0312.4 2.6 5043.4 4.6 6.2
35,870 68,440 36,6083.6 2.3 2.32.1 1.6 1.5
42.0 44.9 26.210.6 9.4 16.856.0 53.6 72.3
3.1 2.38.8 6.4
46.5 46.4 25.629.4 28.6 26.3
.. 11.. 10 22.. 6 7.. 13.0 34.9.. 0.9 2.0.. 42.0 41.5
28 2814.5 15.9 10.1
.. .... .... .... .... .. .. .. 849
4.1 1.4 2.718.4 18.8 20.4
.. .. ..
15.7 17.9 –1.323.5 48.4 47.666.3 83.1 99.744.0 50.5 ..
7.0 5.0 6.21.2 0.6 1.1
75.8 87.9 162.0–5.8 –4.22.2 2.2 4.4
76.0 .. 90.924,994 25,137 9,760
.. ..125 152 14326.7 87.4 59.30.40 .. 0.77
Norway

Economic and social contextPopulation (millions)Labor force (millions)Unemployment rate (% of labor force)GNI per capita, World Bank Atlas method ($)GDP growth, 1995–2000 and 2000–06 (average annual %)Agriculture value added (% of GDP)Industry value added (% of GDP)
Manufacturing value added (% of GDP)Services value added (% of GDP)Inflation (annual % change in consumer price index)Exchange rate (local currency units per $)Exports of goods and services (% of GDP)Imports of goods and services (% of GDP) Business environmentEase of doing business (ranking 1-178; 1=best)Time to start a business (days)Procedures to start a business (number)Firing cost (weeks of wages)Closing a business (years to resolve insolvency)Total tax rate (% of profit)Highest marginal tax rate, corporate (%)Business entry rate (new registrations as % of total)Enterprise surveys
Time dealing with gov’t officials (% of management time)Firms expected to give gifts in meetings w/tax officials (%)Firms using banks to finance investments (% of firms)Delay in obtaining an electrical connection (days)ISO certification ownership (% of firms)
Private sector investmentInvest. in infrastructure w/private participation ($ millions)Private foreign direct investment, net (% of GDP)Gross fixed capital formation (% of GDP)Gross fixed private capital formation (% of GDP) Finance and bankingGovernment cash surplus or deficit (% of GDP)Government debt (% of GDP)Deposit money banks’ assets (% of GDP)Total financial system deposits (% of GDP)Bank capital to asset ratio (%)Bank nonperforming loans to total gross loans ratio (%)Domestic credit to the private sector (% of GDP)Real interest rate (%)Interest rate spread (percentage points) Infrastructure Paved roads (% of total roads)Electric power consumption (kWh per capita)Power outages in a typical month (number)Fixed line and mobile subscribers (per 100 people)Internet users (per 100 people)Cost of telephone call to U.S. ($ per 3 minutes)
162 2008 The Little Data Book on Private Sector Development
2.4 2.5 811
0.88 0.97 374.. .. 9.8
6,720 11,120 5,9133.2 4.2 3.92.0 1.9 5.7
57.2 54.9 32.45.4 8.3 19.4
40.8 43.2 62.0–0.8 3.20.4 0.4
59.2 63.3 32.731.4 35.9 30.3
.. 49.. 34 41.. 9 9.. 4.0 39.7.. 4.0 2.9.. 21.6 44.5
12 12.. .. 9.1 .. .... .... 6.5.. 14.7.. 10.8
29 1,047 45,8690.4 2.9 3.5
11.9 18.1 19.94.4 .. ..
–4.4 .. ..19.1 .. ..43.8 32.8 52.930.7 24.4 41.412.8 13.2 9.811.3 7.8 3.236.8 30.9 41.4–8.3 –9.22.4 3.4 5.9
30.0 .. ..3,140 3,757 3,131
.. ..16 82 883.7 12.5 22.2
7.89 1.87 1.06
Country data
Upper middle-income group
2000 2006 2006
Middle East & North Africa Upper middle income
Oman

Economic and social contextPopulation (millions)Labor force (millions)Unemployment rate (% of labor force)GNI per capita, World Bank Atlas method ($)GDP growth, 1995–2000 and 2000–06 (average annual %)Agriculture value added (% of GDP)Industry value added (% of GDP)
Manufacturing value added (% of GDP)Services value added (% of GDP)Inflation (annual % change in consumer price index)Exchange rate (local currency units per $)Exports of goods and services (% of GDP)Imports of goods and services (% of GDP) Business environmentEase of doing business (ranking 1-178; 1=best)Time to start a business (days)Procedures to start a business (number)Firing cost (weeks of wages)Closing a business (years to resolve insolvency)Total tax rate (% of profit)Highest marginal tax rate, corporate (%)Business entry rate (new registrations as % of total)Enterprise surveys
Time dealing with gov’t officials (% of management time)Firms expected to give gifts in meetings w/tax officials (%)Firms using banks to finance investments (% of firms)Delay in obtaining an electrical connection (days)ISO certification ownership (% of firms)
Private sector investmentInvest. in infrastructure w/private participation ($ millions)Private foreign direct investment, net (% of GDP)Gross fixed capital formation (% of GDP)Gross fixed private capital formation (% of GDP) Finance and bankingGovernment cash surplus or deficit (% of GDP)Government debt (% of GDP)Deposit money banks’ assets (% of GDP)Total financial system deposits (% of GDP)Bank capital to asset ratio (%)Bank nonperforming loans to total gross loans ratio (%)Domestic credit to the private sector (% of GDP)Real interest rate (%)Interest rate spread (percentage points) Infrastructure Paved roads (% of total roads)Electric power consumption (kWh per capita)Power outages in a typical month (number)Fixed line and mobile subscribers (per 100 people)Internet users (per 100 people)Cost of telephone call to U.S. ($ per 3 minutes)
163The Little Data Book on Private Sector Development 2008
South Asia Low income
Country dataLow-
income group
2000 2006 2006
138.1 159.0 2,42046.3 59.6 995
7.2 7.7 ..490 800 6493.0 5.5 6.5
25.9 19.4 20.423.3 27.2 27.714.7 19.5 15.850.7 53.4 51.94.4 7.9
53.6 60.313.4 15.3 26.714.7 23.3 30.1
.. 76.. 24 54.. 11 10.. 90.0 62.6.. 2.8 3.8.. 40.7 67.4.. 37
3.5 9.4 6.4
8.7 .... ..
3.6 ..32.9 ..17.0 ..
77 2,926 29,7850.4 3.4 2.6
15.9 20.1 26.710.3 15.4 19.6
–4.1 –4.2 –2.674.0 .. ..30.2 37.0 50.526.5 34.5 44.6
4.9 8.8 ..19.5 7.7 ..22.3 29.0 38.3
.. 1.6
.. 6.8 11.3
56.0 64.7 ..374 456 391
.. ..2 25 17
0.2 7.5 4.23.60 1.03 1.99
Pakistan
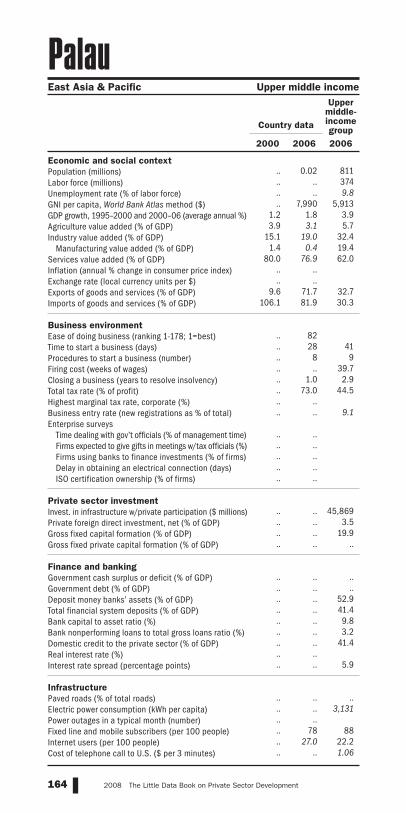
Economic and social contextPopulation (millions)Labor force (millions)Unemployment rate (% of labor force)GNI per capita, World Bank Atlas method ($)GDP growth, 1995–2000 and 2000–06 (average annual %)Agriculture value added (% of GDP)Industry value added (% of GDP)
Manufacturing value added (% of GDP)Services value added (% of GDP)Inflation (annual % change in consumer price index)Exchange rate (local currency units per $)Exports of goods and services (% of GDP)Imports of goods and services (% of GDP) Business environmentEase of doing business (ranking 1-178; 1=best)Time to start a business (days)Procedures to start a business (number)Firing cost (weeks of wages)Closing a business (years to resolve insolvency)Total tax rate (% of profit)Highest marginal tax rate, corporate (%)Business entry rate (new registrations as % of total)Enterprise surveys
Time dealing with gov’t officials (% of management time)Firms expected to give gifts in meetings w/tax officials (%)Firms using banks to finance investments (% of firms)Delay in obtaining an electrical connection (days)ISO certification ownership (% of firms)
Private sector investmentInvest. in infrastructure w/private participation ($ millions)Private foreign direct investment, net (% of GDP)Gross fixed capital formation (% of GDP)Gross fixed private capital formation (% of GDP) Finance and bankingGovernment cash surplus or deficit (% of GDP)Government debt (% of GDP)Deposit money banks’ assets (% of GDP)Total financial system deposits (% of GDP)Bank capital to asset ratio (%)Bank nonperforming loans to total gross loans ratio (%)Domestic credit to the private sector (% of GDP)Real interest rate (%)Interest rate spread (percentage points) Infrastructure Paved roads (% of total roads)Electric power consumption (kWh per capita)Power outages in a typical month (number)Fixed line and mobile subscribers (per 100 people)Internet users (per 100 people)Cost of telephone call to U.S. ($ per 3 minutes)
164 2008 The Little Data Book on Private Sector Development
.. 0.02 811.. .. 374.. .. 9.8.. 7,990 5,913
1.2 1.8 3.93.9 3.1 5.7
15.1 19.0 32.41.4 0.4 19.4
80.0 76.9 62.0.. .... ..
9.6 71.7 32.7106.1 81.9 30.3
.. 82.. 28 41.. 8 9.. .. 39.7.. 1.0 2.9.. 73.0 44.5.. .... .. 9.1 .. .... .... .... .... .. .. .. 45,869.. .. 3.5.. .. 19.9.. .. .. .. .. .... .. .... .. 52.9.. .. 41.4.. .. 9.8.. .. 3.2.. .. 41.4.. .... .. 5.9 .. .. .... .. 3,131.. .... 78 88.. 27.0 22.2.. .. 1.06
Country data
Upper middle-income group
2000 2006 2006
East Asia & Pacific Upper middle income
Palau
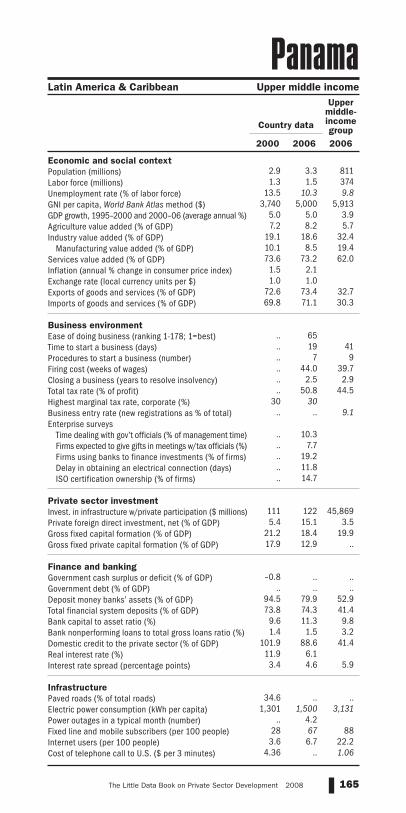
Economic and social contextPopulation (millions)Labor force (millions)Unemployment rate (% of labor force)GNI per capita, World Bank Atlas method ($)GDP growth, 1995–2000 and 2000–06 (average annual %)Agriculture value added (% of GDP)Industry value added (% of GDP)
Manufacturing value added (% of GDP)Services value added (% of GDP)Inflation (annual % change in consumer price index)Exchange rate (local currency units per $)Exports of goods and services (% of GDP)Imports of goods and services (% of GDP) Business environmentEase of doing business (ranking 1-178; 1=best)Time to start a business (days)Procedures to start a business (number)Firing cost (weeks of wages)Closing a business (years to resolve insolvency)Total tax rate (% of profit)Highest marginal tax rate, corporate (%)Business entry rate (new registrations as % of total)Enterprise surveys
Time dealing with gov’t officials (% of management time)Firms expected to give gifts in meetings w/tax officials (%)Firms using banks to finance investments (% of firms)Delay in obtaining an electrical connection (days)ISO certification ownership (% of firms)
Private sector investmentInvest. in infrastructure w/private participation ($ millions)Private foreign direct investment, net (% of GDP)Gross fixed capital formation (% of GDP)Gross fixed private capital formation (% of GDP) Finance and bankingGovernment cash surplus or deficit (% of GDP)Government debt (% of GDP)Deposit money banks’ assets (% of GDP)Total financial system deposits (% of GDP)Bank capital to asset ratio (%)Bank nonperforming loans to total gross loans ratio (%)Domestic credit to the private sector (% of GDP)Real interest rate (%)Interest rate spread (percentage points) Infrastructure Paved roads (% of total roads)Electric power consumption (kWh per capita)Power outages in a typical month (number)Fixed line and mobile subscribers (per 100 people)Internet users (per 100 people)Cost of telephone call to U.S. ($ per 3 minutes)
165The Little Data Book on Private Sector Development 2008
Latin America & Caribbean Upper middle income
Country data
Upper middle-income group
2000 2006 2006
2.9 3.3 8111.3 1.5 374
13.5 10.3 9.83,740 5,000 5,913
5.0 5.0 3.97.2 8.2 5.7
19.1 18.6 32.410.1 8.5 19.473.6 73.2 62.0
1.5 2.11.0 1.0
72.6 73.4 32.769.8 71.1 30.3
.. 65.. 19 41.. 7 9.. 44.0 39.7.. 2.5 2.9.. 50.8 44.5
30 30.. .. 9.1 .. 10.3.. 7.7.. 19.2.. 11.8.. 14.7
111 122 45,8695.4 15.1 3.5
21.2 18.4 19.917.9 12.9 ..
–0.8 .. .... .. ..
94.5 79.9 52.973.8 74.3 41.4
9.6 11.3 9.81.4 1.5 3.2
101.9 88.6 41.411.9 6.13.4 4.6 5.9
34.6 .. ..1,301 1,500 3,131
.. 4.228 67 883.6 6.7 22.2
4.36 .. 1.06
Panama

Economic and social contextPopulation (millions)Labor force (millions)Unemployment rate (% of labor force)GNI per capita, World Bank Atlas method ($)GDP growth, 1995–2000 and 2000–06 (average annual %)Agriculture value added (% of GDP)Industry value added (% of GDP)
Manufacturing value added (% of GDP)Services value added (% of GDP)Inflation (annual % change in consumer price index)Exchange rate (local currency units per $)Exports of goods and services (% of GDP)Imports of goods and services (% of GDP) Business environmentEase of doing business (ranking 1-178; 1=best)Time to start a business (days)Procedures to start a business (number)Firing cost (weeks of wages)Closing a business (years to resolve insolvency)Total tax rate (% of profit)Highest marginal tax rate, corporate (%)Business entry rate (new registrations as % of total)Enterprise surveys
Time dealing with gov’t officials (% of management time)Firms expected to give gifts in meetings w/tax officials (%)Firms using banks to finance investments (% of firms)Delay in obtaining an electrical connection (days)ISO certification ownership (% of firms)
Private sector investmentInvest. in infrastructure w/private participation ($ millions)Private foreign direct investment, net (% of GDP)Gross fixed capital formation (% of GDP)Gross fixed private capital formation (% of GDP) Finance and bankingGovernment cash surplus or deficit (% of GDP)Government debt (% of GDP)Deposit money banks’ assets (% of GDP)Total financial system deposits (% of GDP)Bank capital to asset ratio (%)Bank nonperforming loans to total gross loans ratio (%)Domestic credit to the private sector (% of GDP)Real interest rate (%)Interest rate spread (percentage points) Infrastructure Paved roads (% of total roads)Electric power consumption (kWh per capita)Power outages in a typical month (number)Fixed line and mobile subscribers (per 100 people)Internet users (per 100 people)Cost of telephone call to U.S. ($ per 3 minutes)
166 2008 The Little Data Book on Private Sector Development
5.4 6.2 2,4202.3 2.7 9952.8 .. ..
640 740 6490.7 1.9 6.5
28.4 41.8 20.444.0 39.1 27.7
8.9 6.3 15.827.7 19.0 51.915.6 2.32.8 3.1
72.0 .. 26.762.8 .. 30.1
.. 84.. 56 54.. 8 10.. 39.0 62.6.. 3.0 3.8.. 41.7 67.4
25 25.. .. 6.4 .. .... .... .... .... ..
71 .. 29,7852.8 0.6 2.6
12.1 .. 26.7.. .. 19.6
–1.9 .. –2.659.1 .. ..
.. .. 50.5
.. .. 44.6
.. .. ..
.. .. ..17.6 17.1 38.37.2 0.89.1 9.6 11.3
3.5 .. .... .. 391.. ..1 2 17
0.8 1.8 4.24.32 .. 1.99
Country dataLow-
income group
2000 2006 2006
East Asia & Pacific Low income
Papua New Guinea

Economic and social contextPopulation (millions)Labor force (millions)Unemployment rate (% of labor force)GNI per capita, World Bank Atlas method ($)GDP growth, 1995–2000 and 2000–06 (average annual %)Agriculture value added (% of GDP)Industry value added (% of GDP)
Manufacturing value added (% of GDP)Services value added (% of GDP)Inflation (annual % change in consumer price index)Exchange rate (local currency units per $)Exports of goods and services (% of GDP)Imports of goods and services (% of GDP) Business environmentEase of doing business (ranking 1-178; 1=best)Time to start a business (days)Procedures to start a business (number)Firing cost (weeks of wages)Closing a business (years to resolve insolvency)Total tax rate (% of profit)Highest marginal tax rate, corporate (%)Business entry rate (new registrations as % of total)Enterprise surveys
Time dealing with gov’t officials (% of management time)Firms expected to give gifts in meetings w/tax officials (%)Firms using banks to finance investments (% of firms)Delay in obtaining an electrical connection (days)ISO certification ownership (% of firms)
Private sector investmentInvest. in infrastructure w/private participation ($ millions)Private foreign direct investment, net (% of GDP)Gross fixed capital formation (% of GDP)Gross fixed private capital formation (% of GDP) Finance and bankingGovernment cash surplus or deficit (% of GDP)Government debt (% of GDP)Deposit money banks’ assets (% of GDP)Total financial system deposits (% of GDP)Bank capital to asset ratio (%)Bank nonperforming loans to total gross loans ratio (%)Domestic credit to the private sector (% of GDP)Real interest rate (%)Interest rate spread (percentage points) Infrastructure Paved roads (% of total roads)Electric power consumption (kWh per capita)Power outages in a typical month (number)Fixed line and mobile subscribers (per 100 people)Internet users (per 100 people)Cost of telephone call to U.S. ($ per 3 minutes)
167The Little Data Book on Private Sector Development 2008
Latin America & Caribbean Lower middle income
Country data
Lower middle-income group
2000 2006 2006
5.3 6.0 2,2762.4 2.9 1,2097.6 7.9 5.7
1,350 1,410 2,0380.1 2.9 7.6
17.0 21.0 11.922.5 18.3 43.515.5 11.8 26.760.5 60.7 44.6
9.0 9.63,486.4 5,635.5
38.2 49.2 40.449.0 66.0 36.4
.. 103.. 35 53.. 7 10.. 113.0 50.2.. 3.9 3.3.. 35.3 45.8
30 30.. .. 7.6 .. 7.9.. 24.5.. 8.2.. 27.2.. 7.1
30 167 38,1541.5 2.0 3.0
17.5 19.2 33.5.. .. 10.9 .. 1.2 –0.9.. .. ..
28.4 17.2 87.822.0 17.1 43.112.4 12.5 10.712.3 3.3 4.029.8 16.9 81.313.1 17.511.1 23.4 7.2
50.8 .. 65.8880 849 1,502
.. 2.521 59 600.7 4.3 11.4
0.97 0.90 2.08
Paraguay
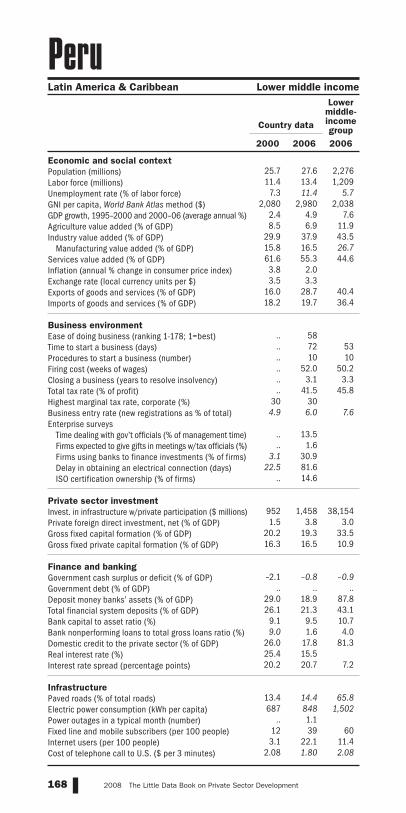
Economic and social contextPopulation (millions)Labor force (millions)Unemployment rate (% of labor force)GNI per capita, World Bank Atlas method ($)GDP growth, 1995–2000 and 2000–06 (average annual %)Agriculture value added (% of GDP)Industry value added (% of GDP)
Manufacturing value added (% of GDP)Services value added (% of GDP)Inflation (annual % change in consumer price index)Exchange rate (local currency units per $)Exports of goods and services (% of GDP)Imports of goods and services (% of GDP) Business environmentEase of doing business (ranking 1-178; 1=best)Time to start a business (days)Procedures to start a business (number)Firing cost (weeks of wages)Closing a business (years to resolve insolvency)Total tax rate (% of profit)Highest marginal tax rate, corporate (%)Business entry rate (new registrations as % of total)Enterprise surveys
Time dealing with gov’t officials (% of management time)Firms expected to give gifts in meetings w/tax officials (%)Firms using banks to finance investments (% of firms)Delay in obtaining an electrical connection (days)ISO certification ownership (% of firms)
Private sector investmentInvest. in infrastructure w/private participation ($ millions)Private foreign direct investment, net (% of GDP)Gross fixed capital formation (% of GDP)Gross fixed private capital formation (% of GDP) Finance and bankingGovernment cash surplus or deficit (% of GDP)Government debt (% of GDP)Deposit money banks’ assets (% of GDP)Total financial system deposits (% of GDP)Bank capital to asset ratio (%)Bank nonperforming loans to total gross loans ratio (%)Domestic credit to the private sector (% of GDP)Real interest rate (%)Interest rate spread (percentage points) Infrastructure Paved roads (% of total roads)Electric power consumption (kWh per capita)Power outages in a typical month (number)Fixed line and mobile subscribers (per 100 people)Internet users (per 100 people)Cost of telephone call to U.S. ($ per 3 minutes)
168 2008 The Little Data Book on Private Sector Development
25.7 27.6 2,27611.4 13.4 1,209
7.3 11.4 5.72,080 2,980 2,038
2.4 4.9 7.68.5 6.9 11.9
29.9 37.9 43.515.8 16.5 26.761.6 55.3 44.63.8 2.03.5 3.3
16.0 28.7 40.418.2 19.7 36.4
.. 58.. 72 53.. 10 10.. 52.0 50.2.. 3.1 3.3.. 41.5 45.8
30 304.9 6.0 7.6
.. 13.5.. 1.6
3.1 30.922.5 81.6
.. 14.6
952 1,458 38,1541.5 3.8 3.0
20.2 19.3 33.516.3 16.5 10.9
–2.1 –0.8 –0.9.. .. ..
29.0 18.9 87.826.1 21.3 43.1
9.1 9.5 10.79.0 1.6 4.0
26.0 17.8 81.325.4 15.520.2 20.7 7.2
13.4 14.4 65.8687 848 1,502
.. 1.112 39 603.1 22.1 11.4
2.08 1.80 2.08
Country data
Lower middle-income group
2000 2006 2006
Latin America & Caribbean Lower middle income
Peru

Economic and social contextPopulation (millions)Labor force (millions)Unemployment rate (% of labor force)GNI per capita, World Bank Atlas method ($)GDP growth, 1995–2000 and 2000–06 (average annual %)Agriculture value added (% of GDP)Industry value added (% of GDP)
Manufacturing value added (% of GDP)Services value added (% of GDP)Inflation (annual % change in consumer price index)Exchange rate (local currency units per $)Exports of goods and services (% of GDP)Imports of goods and services (% of GDP) Business environmentEase of doing business (ranking 1-178; 1=best)Time to start a business (days)Procedures to start a business (number)Firing cost (weeks of wages)Closing a business (years to resolve insolvency)Total tax rate (% of profit)Highest marginal tax rate, corporate (%)Business entry rate (new registrations as % of total)Enterprise surveys
Time dealing with gov’t officials (% of management time)Firms expected to give gifts in meetings w/tax officials (%)Firms using banks to finance investments (% of firms)Delay in obtaining an electrical connection (days)ISO certification ownership (% of firms)
Private sector investmentInvest. in infrastructure w/private participation ($ millions)Private foreign direct investment, net (% of GDP)Gross fixed capital formation (% of GDP)Gross fixed private capital formation (% of GDP) Finance and bankingGovernment cash surplus or deficit (% of GDP)Government debt (% of GDP)Deposit money banks’ assets (% of GDP)Total financial system deposits (% of GDP)Bank capital to asset ratio (%)Bank nonperforming loans to total gross loans ratio (%)Domestic credit to the private sector (% of GDP)Real interest rate (%)Interest rate spread (percentage points) Infrastructure Paved roads (% of total roads)Electric power consumption (kWh per capita)Power outages in a typical month (number)Fixed line and mobile subscribers (per 100 people)Internet users (per 100 people)Cost of telephone call to U.S. ($ per 3 minutes)
169The Little Data Book on Private Sector Development 2008
East Asia & Pacific Lower middle income
Country data
Lower middle-income group
2000 2006 2006
76.2 86.3 2,27630.8 38.4 1,20910.1 7.4 5.7
1,050 1,390 2,0383.5 4.9 7.6
15.8 14.2 11.932.3 31.6 43.522.2 22.9 26.752.0 54.2 44.6
4.0 6.244.2 51.355.4 46.4 40.453.5 47.6 36.4
.. 133.. 58 53.. 15 10.. 91.0 50.2.. 5.7 3.3.. 52.8 45.8
32 35.. .. 7.6 .. 6.9.. 27.6.. 5.5.. 13.5.. 15.8
2,153 1,815 38,1543.0 2.0 3.0
21.2 13.8 33.517.8 11.6 10.9
–3.9 –1.3 –0.952.9 77.7 ..50.3 40.1 87.854.0 51.3 43.113.6 11.7 10.724.0 18.6 4.043.8 30.0 81.3
4.3 4.32.6 4.5 7.2
20.0 9.9 65.8511 588 1,502
.. ..12 54 602.0 5.5 11.4
2.07 1.20 2.08
Philippines
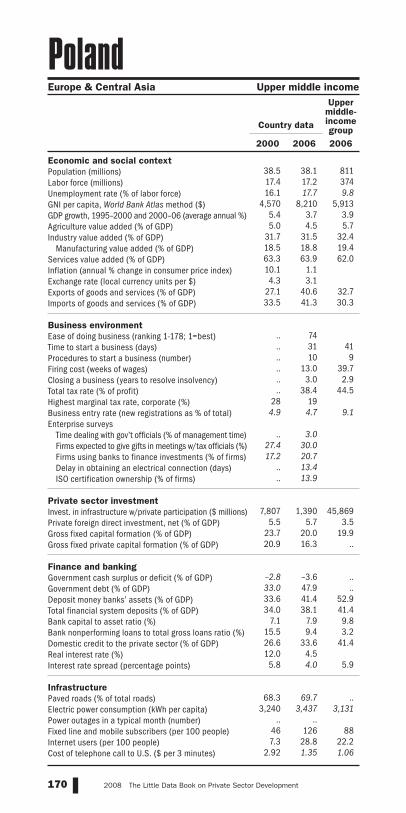
Economic and social contextPopulation (millions)Labor force (millions)Unemployment rate (% of labor force)GNI per capita, World Bank Atlas method ($)GDP growth, 1995–2000 and 2000–06 (average annual %)Agriculture value added (% of GDP)Industry value added (% of GDP)
Manufacturing value added (% of GDP)Services value added (% of GDP)Inflation (annual % change in consumer price index)Exchange rate (local currency units per $)Exports of goods and services (% of GDP)Imports of goods and services (% of GDP) Business environmentEase of doing business (ranking 1-178; 1=best)Time to start a business (days)Procedures to start a business (number)Firing cost (weeks of wages)Closing a business (years to resolve insolvency)Total tax rate (% of profit)Highest marginal tax rate, corporate (%)Business entry rate (new registrations as % of total)Enterprise surveys
Time dealing with gov’t officials (% of management time)Firms expected to give gifts in meetings w/tax officials (%)Firms using banks to finance investments (% of firms)Delay in obtaining an electrical connection (days)ISO certification ownership (% of firms)
Private sector investmentInvest. in infrastructure w/private participation ($ millions)Private foreign direct investment, net (% of GDP)Gross fixed capital formation (% of GDP)Gross fixed private capital formation (% of GDP) Finance and bankingGovernment cash surplus or deficit (% of GDP)Government debt (% of GDP)Deposit money banks’ assets (% of GDP)Total financial system deposits (% of GDP)Bank capital to asset ratio (%)Bank nonperforming loans to total gross loans ratio (%)Domestic credit to the private sector (% of GDP)Real interest rate (%)Interest rate spread (percentage points) Infrastructure Paved roads (% of total roads)Electric power consumption (kWh per capita)Power outages in a typical month (number)Fixed line and mobile subscribers (per 100 people)Internet users (per 100 people)Cost of telephone call to U.S. ($ per 3 minutes)
170 2008 The Little Data Book on Private Sector Development
38.5 38.1 81117.4 17.2 37416.1 17.7 9.8
4,570 8,210 5,9135.4 3.7 3.95.0 4.5 5.7
31.7 31.5 32.418.5 18.8 19.463.3 63.9 62.010.1 1.14.3 3.1
27.1 40.6 32.733.5 41.3 30.3
.. 74.. 31 41.. 10 9.. 13.0 39.7.. 3.0 2.9.. 38.4 44.5
28 194.9 4.7 9.1
.. 3.0
27.4 30.017.2 20.7
.. 13.4
.. 13.9
7,807 1,390 45,8695.5 5.7 3.5
23.7 20.0 19.920.9 16.3 ..
–2.8 –3.6 ..33.0 47.9 ..33.6 41.4 52.934.0 38.1 41.4
7.1 7.9 9.815.5 9.4 3.226.6 33.6 41.412.0 4.55.8 4.0 5.9
68.3 69.7 ..3,240 3,437 3,131
.. ..46 126 887.3 28.8 22.2
2.92 1.35 1.06
Country data
Upper middle-income group
2000 2006 2006
Europe & Central Asia Upper middle income
Poland

Economic and social contextPopulation (millions)Labor force (millions)Unemployment rate (% of labor force)GNI per capita, World Bank Atlas method ($)GDP growth, 1995–2000 and 2000–06 (average annual %)Agriculture value added (% of GDP)Industry value added (% of GDP)
Manufacturing value added (% of GDP)Services value added (% of GDP)Inflation (annual % change in consumer price index)Exchange rate (local currency units per $)Exports of goods and services (% of GDP)Imports of goods and services (% of GDP) Business environmentEase of doing business (ranking 1-178; 1=best)Time to start a business (days)Procedures to start a business (number)Firing cost (weeks of wages)Closing a business (years to resolve insolvency)Total tax rate (% of profit)Highest marginal tax rate, corporate (%)Business entry rate (new registrations as % of total)Enterprise surveys
Time dealing with gov’t officials (% of management time)Firms expected to give gifts in meetings w/tax officials (%)Firms using banks to finance investments (% of firms)Delay in obtaining an electrical connection (days)ISO certification ownership (% of firms)
Private sector investmentInvest. in infrastructure w/private participation ($ millions)Private foreign direct investment, net (% of GDP)Gross fixed capital formation (% of GDP)Gross fixed private capital formation (% of GDP) Finance and bankingGovernment cash surplus or deficit (% of GDP)Government debt (% of GDP)Deposit money banks’ assets (% of GDP)Total financial system deposits (% of GDP)Bank capital to asset ratio (%)Bank nonperforming loans to total gross loans ratio (%)Domestic credit to the private sector (% of GDP)Real interest rate (%)Interest rate spread (percentage points) Infrastructure Paved roads (% of total roads)Electric power consumption (kWh per capita)Power outages in a typical month (number)Fixed line and mobile subscribers (per 100 people)Internet users (per 100 people)Cost of telephone call to U.S. ($ per 3 minutes)
171The Little Data Book on Private Sector Development 2008
High income
Country dataHigh-
income group
2000 2006 2006
10.2 10.6 1,0315.2 5.6 5043.9 7.6 6.2
11,600 17,850 36,6084.2 0.7 2.33.8 2.8 1.5
27.6 25.0 26.217.1 15.7 16.868.6 72.2 72.3
2.8 2.71.1 0.8
29.8 31.1 25.640.6 38.9 26.3
.. 37.. 7 22.. 7 7.. 95.0 34.9.. 2.0 2.0.. 44.8 41.5
34 256.0 6.4 10.1
.. .... .... .... .... .. .. .. 849
5.9 3.8 2.727.1 21.2 20.4
.. .. ..
–2.4 –3.9 –1.3.. 72.2 47.6
106.4 .. 99.788.5 .. ..
5.8 6.4 6.22.2 1.3 1.1
131.5 157.4 162.01.9 ..2.8 .. 4.4
86.0 86.0 90.94,014 4,663 9,760
.. ..107 155 143
16.4 30.3 59.30.83 1.04 0.77
Portugal

Economic and social contextPopulation (millions)Labor force (millions)Unemployment rate (% of labor force)GNI per capita, World Bank Atlas method ($)GDP growth, 1995–2000 and 2000–06 (average annual %)Agriculture value added (% of GDP)Industry value added (% of GDP)
Manufacturing value added (% of GDP)Services value added (% of GDP)Inflation (annual % change in consumer price index)Exchange rate (local currency units per $)Exports of goods and services (% of GDP)Imports of goods and services (% of GDP) Business environmentEase of doing business (ranking 1-178; 1=best)Time to start a business (days)Procedures to start a business (number)Firing cost (weeks of wages)Closing a business (years to resolve insolvency)Total tax rate (% of profit)Highest marginal tax rate, corporate (%)Business entry rate (new registrations as % of total)Enterprise surveys
Time dealing with gov’t officials (% of management time)Firms expected to give gifts in meetings w/tax officials (%)Firms using banks to finance investments (% of firms)Delay in obtaining an electrical connection (days)ISO certification ownership (% of firms)
Private sector investmentInvest. in infrastructure w/private participation ($ millions)Private foreign direct investment, net (% of GDP)Gross fixed capital formation (% of GDP)Gross fixed private capital formation (% of GDP) Finance and bankingGovernment cash surplus or deficit (% of GDP)Government debt (% of GDP)Deposit money banks’ assets (% of GDP)Total financial system deposits (% of GDP)Bank capital to asset ratio (%)Bank nonperforming loans to total gross loans ratio (%)Domestic credit to the private sector (% of GDP)Real interest rate (%)Interest rate spread (percentage points) Infrastructure Paved roads (% of total roads)Electric power consumption (kWh per capita)Power outages in a typical month (number)Fixed line and mobile subscribers (per 100 people)Internet users (per 100 people)Cost of telephone call to U.S. ($ per 3 minutes)
172 2008 The Little Data Book on Private Sector Development
3.8 3.9 1,0311.4 1.5 504
10.2 11.3 6.210,560 .. 36,608
4.4 .. 2.30.9 .. 1.5
41.3 .. 26.238.3 .. 16.857.8 .. 72.3
.. ..
.. ..75.2 .. 25.698.0 .. 26.3
.. 28.. 7 22.. 7 7.. .. 34.9.. 3.8 2.0.. 44.3 41.5
20 20.. .. 10.1 .. .... .... .... .... .. .. .. 849.. .. 2.7.. .. 20.4.. .. .. .. .. –1.3.. .. 47.6.. .. 99.7.. .. .... .. 6.2.. .. 1.1.. .. 162.0.. .... .. 4.4
94.0 95.0 90.9.. .. 9,760.. ..
58 112 14310.5 23.4 59.30.87 .. 0.77
Country dataHigh-
income group
2000 2006 2006
High income
Puerto Rico

Economic and social contextPopulation (millions)Labor force (millions)Unemployment rate (% of labor force)GNI per capita, World Bank Atlas method ($)GDP growth, 1995–2000 and 2000–06 (average annual %)Agriculture value added (% of GDP)Industry value added (% of GDP)
Manufacturing value added (% of GDP)Services value added (% of GDP)Inflation (annual % change in consumer price index)Exchange rate (local currency units per $)Exports of goods and services (% of GDP)Imports of goods and services (% of GDP) Business environmentEase of doing business (ranking 1-178; 1=best)Time to start a business (days)Procedures to start a business (number)Firing cost (weeks of wages)Closing a business (years to resolve insolvency)Total tax rate (% of profit)Highest marginal tax rate, corporate (%)Business entry rate (new registrations as % of total)Enterprise surveys
Time dealing with gov’t officials (% of management time)Firms expected to give gifts in meetings w/tax officials (%)Firms using banks to finance investments (% of firms)Delay in obtaining an electrical connection (days)ISO certification ownership (% of firms)
Private sector investmentInvest. in infrastructure w/private participation ($ millions)Private foreign direct investment, net (% of GDP)Gross fixed capital formation (% of GDP)Gross fixed private capital formation (% of GDP) Finance and bankingGovernment cash surplus or deficit (% of GDP)Government debt (% of GDP)Deposit money banks’ assets (% of GDP)Total financial system deposits (% of GDP)Bank capital to asset ratio (%)Bank nonperforming loans to total gross loans ratio (%)Domestic credit to the private sector (% of GDP)Real interest rate (%)Interest rate spread (percentage points) Infrastructure Paved roads (% of total roads)Electric power consumption (kWh per capita)Power outages in a typical month (number)Fixed line and mobile subscribers (per 100 people)Internet users (per 100 people)Cost of telephone call to U.S. ($ per 3 minutes)
173The Little Data Book on Private Sector Development 2008
High income
Country dataHigh-
income group
2000 2006 2006
0.62 0.82 1,0310.33 0.48 504
3.9 .. 6.2.. .. 36,608.. 9.7 2.3.. .. 1.5.. .. 26.2.. .. 16.8.. .. 72.3
1.7 11.83.6 3.6
67.3 68.3 25.622.3 33.5 26.3
.. .... .. 22.. .. 7.. .. 34.9.. .. 2.0.. .. 41.5
35 .... .. 10.1 .. .... .... .... .... .. .. .. 849.. .. 2.7
19.5 33.6 20.4.. .. .. .. 9.7 –1.3.. .. 47.6.. 55.5 99.7.. 38.3 .... .. 6.2.. .. 1.1
26.8 35.4 162.0.. –15.5.. .. 4.4
90.0 .. 90.913,784 16,801 9,760
.. ..46 140 1434.9 35.3 59.3
4.45 1.95 0.77
Qatar
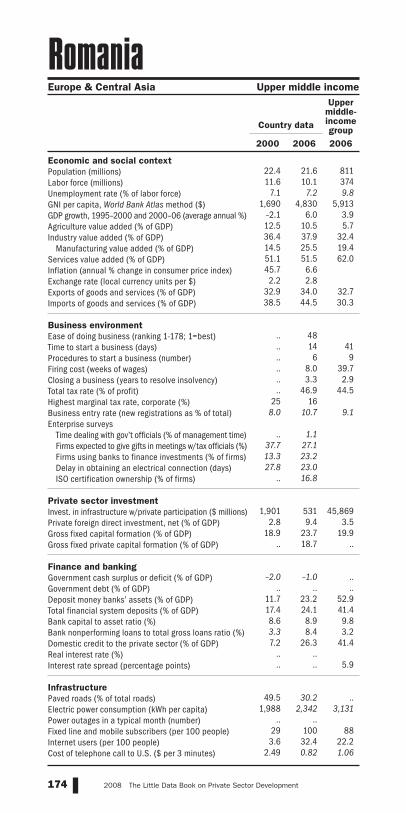
Economic and social contextPopulation (millions)Labor force (millions)Unemployment rate (% of labor force)GNI per capita, World Bank Atlas method ($)GDP growth, 1995–2000 and 2000–06 (average annual %)Agriculture value added (% of GDP)Industry value added (% of GDP)
Manufacturing value added (% of GDP)Services value added (% of GDP)Inflation (annual % change in consumer price index)Exchange rate (local currency units per $)Exports of goods and services (% of GDP)Imports of goods and services (% of GDP) Business environmentEase of doing business (ranking 1-178; 1=best)Time to start a business (days)Procedures to start a business (number)Firing cost (weeks of wages)Closing a business (years to resolve insolvency)Total tax rate (% of profit)Highest marginal tax rate, corporate (%)Business entry rate (new registrations as % of total)Enterprise surveys
Time dealing with gov’t officials (% of management time)Firms expected to give gifts in meetings w/tax officials (%)Firms using banks to finance investments (% of firms)Delay in obtaining an electrical connection (days)ISO certification ownership (% of firms)
Private sector investmentInvest. in infrastructure w/private participation ($ millions)Private foreign direct investment, net (% of GDP)Gross fixed capital formation (% of GDP)Gross fixed private capital formation (% of GDP) Finance and bankingGovernment cash surplus or deficit (% of GDP)Government debt (% of GDP)Deposit money banks’ assets (% of GDP)Total financial system deposits (% of GDP)Bank capital to asset ratio (%)Bank nonperforming loans to total gross loans ratio (%)Domestic credit to the private sector (% of GDP)Real interest rate (%)Interest rate spread (percentage points) Infrastructure Paved roads (% of total roads)Electric power consumption (kWh per capita)Power outages in a typical month (number)Fixed line and mobile subscribers (per 100 people)Internet users (per 100 people)Cost of telephone call to U.S. ($ per 3 minutes)
174 2008 The Little Data Book on Private Sector Development
22.4 21.6 81111.6 10.1 374
7.1 7.2 9.81,690 4,830 5,913
–2.1 6.0 3.912.5 10.5 5.736.4 37.9 32.414.5 25.5 19.451.1 51.5 62.045.7 6.62.2 2.8
32.9 34.0 32.738.5 44.5 30.3
.. 48.. 14 41.. 6 9.. 8.0 39.7.. 3.3 2.9.. 46.9 44.5
25 168.0 10.7 9.1
.. 1.1
37.7 27.113.3 23.227.8 23.0
.. 16.8
1,901 531 45,8692.8 9.4 3.5
18.9 23.7 19.9.. 18.7 ..
–2.0 –1.0 .... .. ..
11.7 23.2 52.917.4 24.1 41.48.6 8.9 9.83.3 8.4 3.27.2 26.3 41.4
.. ..
.. .. 5.9
49.5 30.2 ..1,988 2,342 3,131
.. ..29 100 883.6 32.4 22.2
2.49 0.82 1.06
Country data
Upper middle-income group
2000 2006 2006
Europe & Central Asia Upper middle income
Romania

Economic and social contextPopulation (millions)Labor force (millions)Unemployment rate (% of labor force)GNI per capita, World Bank Atlas method ($)GDP growth, 1995–2000 and 2000–06 (average annual %)Agriculture value added (% of GDP)Industry value added (% of GDP)
Manufacturing value added (% of GDP)Services value added (% of GDP)Inflation (annual % change in consumer price index)Exchange rate (local currency units per $)Exports of goods and services (% of GDP)Imports of goods and services (% of GDP) Business environmentEase of doing business (ranking 1-178; 1=best)Time to start a business (days)Procedures to start a business (number)Firing cost (weeks of wages)Closing a business (years to resolve insolvency)Total tax rate (% of profit)Highest marginal tax rate, corporate (%)Business entry rate (new registrations as % of total)Enterprise surveys
Time dealing with gov’t officials (% of management time)Firms expected to give gifts in meetings w/tax officials (%)Firms using banks to finance investments (% of firms)Delay in obtaining an electrical connection (days)ISO certification ownership (% of firms)
Private sector investmentInvest. in infrastructure w/private participation ($ millions)Private foreign direct investment, net (% of GDP)Gross fixed capital formation (% of GDP)Gross fixed private capital formation (% of GDP) Finance and bankingGovernment cash surplus or deficit (% of GDP)Government debt (% of GDP)Deposit money banks’ assets (% of GDP)Total financial system deposits (% of GDP)Bank capital to asset ratio (%)Bank nonperforming loans to total gross loans ratio (%)Domestic credit to the private sector (% of GDP)Real interest rate (%)Interest rate spread (percentage points) Infrastructure Paved roads (% of total roads)Electric power consumption (kWh per capita)Power outages in a typical month (number)Fixed line and mobile subscribers (per 100 people)Internet users (per 100 people)Cost of telephone call to U.S. ($ per 3 minutes)
175The Little Data Book on Private Sector Development 2008
Europe & Central Asia Upper middle income
Country data
Upper middle-income group
2000 2006 2006
146.3 142.5 811
71.4 73.5 3749.8 7.9 9.8
1,710 5,770 5,9131.2 6.4 3.96.4 4.9 5.7
37.9 39.4 32.417.6 19.4 19.455.6 55.8 62.020.8 9.728.1 27.244.1 33.9 32.724.0 21.2 30.3
.. 106.. 29 41.. 8 9.. 17.0 39.7.. 3.8 2.9.. 51.4 44.5
35 248.1 9.4 9.1
.. 6.3
53.5 58.05.7 10.2
19.9 16.1.. 9.3
1,939 6,073 45,8691.0 3.1 3.5
16.9 17.9 19.915.1 15.2 ..
2.5 8.1 ..62.1 .. ..
.. .. 52.9
.. .. 41.412.1 12.5 9.8
7.7 2.6 3.213.3 30.8 41.4–9.6 –4.917.9 6.4 5.9
67.4 .. ..5,209 5,785 3,131
.. ..24 112 88
2.0 18.0 22.22.56 2.03 1.06
Russian Federation

Economic and social contextPopulation (millions)Labor force (millions)Unemployment rate (% of labor force)GNI per capita, World Bank Atlas method ($)GDP growth, 1995–2000 and 2000–06 (average annual %)Agriculture value added (% of GDP)Industry value added (% of GDP)
Manufacturing value added (% of GDP)Services value added (% of GDP)Inflation (annual % change in consumer price index)Exchange rate (local currency units per $)Exports of goods and services (% of GDP)Imports of goods and services (% of GDP) Business environmentEase of doing business (ranking 1-178; 1=best)Time to start a business (days)Procedures to start a business (number)Firing cost (weeks of wages)Closing a business (years to resolve insolvency)Total tax rate (% of profit)Highest marginal tax rate, corporate (%)Business entry rate (new registrations as % of total)Enterprise surveys
Time dealing with gov’t officials (% of management time)Firms expected to give gifts in meetings w/tax officials (%)Firms using banks to finance investments (% of firms)Delay in obtaining an electrical connection (days)ISO certification ownership (% of firms)
Private sector investmentInvest. in infrastructure w/private participation ($ millions)Private foreign direct investment, net (% of GDP)Gross fixed capital formation (% of GDP)Gross fixed private capital formation (% of GDP) Finance and bankingGovernment cash surplus or deficit (% of GDP)Government debt (% of GDP)Deposit money banks’ assets (% of GDP)Total financial system deposits (% of GDP)Bank capital to asset ratio (%)Bank nonperforming loans to total gross loans ratio (%)Domestic credit to the private sector (% of GDP)Real interest rate (%)Interest rate spread (percentage points) Infrastructure Paved roads (% of total roads)Electric power consumption (kWh per capita)Power outages in a typical month (number)Fixed line and mobile subscribers (per 100 people)Internet users (per 100 people)Cost of telephone call to U.S. ($ per 3 minutes)
176 2008 The Little Data Book on Private Sector Development
8.2 9.5 2,4203.6 4.4 995
.. .. ..240 250 6499.8 5.0 6.5
41.4 41.0 20.420.5 21.2 27.711.3 8.5 15.838.1 37.8 51.94.3 8.9
389.7 551.78.3 11.7 26.7
24.6 31.5 30.1 .. 150.. 16 54.. 9 10.. 26.0 62.6.. .. 3.8.. 33.8 67.4.. .... .. 6.4 .. 5.9.. 4.9.. 15.9.. 18.2.. 10.8 8 10 29,785
0.5 0.5 2.617.5 21.4 26.711.6 12.8 19.6
.. .. –2.6.. .. ..
10.2 12.7 50.511.6 14.6 44.68.1 9.2 ..
57.0 27.2 ..10.0 13.5 38.313.3 6.4
8.1 8.1 11.3
8.3 19.0 .... .. 391.. 13.71 3 17
0.1 0.7 4.211.23 2.43 1.99
Country dataLow-
income group
2000 2006 2006
Sub-Saharan Africa Low income
Rwanda

Economic and social contextPopulation (millions)Labor force (millions)Unemployment rate (% of labor force)GNI per capita, World Bank Atlas method ($)GDP growth, 1995–2000 and 2000–06 (average annual %)Agriculture value added (% of GDP)Industry value added (% of GDP)
Manufacturing value added (% of GDP)Services value added (% of GDP)Inflation (annual % change in consumer price index)Exchange rate (local currency units per $)Exports of goods and services (% of GDP)Imports of goods and services (% of GDP) Business environmentEase of doing business (ranking 1-178; 1=best)Time to start a business (days)Procedures to start a business (number)Firing cost (weeks of wages)Closing a business (years to resolve insolvency)Total tax rate (% of profit)Highest marginal tax rate, corporate (%)Business entry rate (new registrations as % of total)Enterprise surveys
Time dealing with gov’t officials (% of management time)Firms expected to give gifts in meetings w/tax officials (%)Firms using banks to finance investments (% of firms)Delay in obtaining an electrical connection (days)ISO certification ownership (% of firms)
Private sector investmentInvest. in infrastructure w/private participation ($ millions)Private foreign direct investment, net (% of GDP)Gross fixed capital formation (% of GDP)Gross fixed private capital formation (% of GDP) Finance and bankingGovernment cash surplus or deficit (% of GDP)Government debt (% of GDP)Deposit money banks’ assets (% of GDP)Total financial system deposits (% of GDP)Bank capital to asset ratio (%)Bank nonperforming loans to total gross loans ratio (%)Domestic credit to the private sector (% of GDP)Real interest rate (%)Interest rate spread (percentage points) Infrastructure Paved roads (% of total roads)Electric power consumption (kWh per capita)Power outages in a typical month (number)Fixed line and mobile subscribers (per 100 people)Internet users (per 100 people)Cost of telephone call to U.S. ($ per 3 minutes)
177The Little Data Book on Private Sector Development 2008
East Asia & Pacific Lower middle income
Country data
Lower middle-income group
2000 2006 2006
0.18 0.19 2,2760.06 0.07 1,209
.. .. 5.71,350 2,270 2,038
3.3 3.8 7.616.8 12.2 11.926.0 27.4 43.514.8 13.9 26.757.2 60.5 44.61.0 3.83.3 2.8
33.8 28.0 40.457.2 50.1 36.4
.. 61.. 35 53.. 9 10.. 9.0 50.2.. 2.5 3.3.. 19.8 45.8.. .... .. 7.6 .. .... .... .... .... ..
10 .. 38,154–0.7 4.9 3.0
.. .. 33.5
.. .. 10.9 .. .. –0.9.. .. ..
31.7 38.2 87.832.6 39.3 43.1
.. .. 10.7
.. .. 4.030.6 45.7 81.3
8.0 6.24.5 7.1 7.2
14.2 .. 65.8.. .. 1,502.. ..6 24 60
0.6 4.3 11.41.36 .. 2.08
Samoa
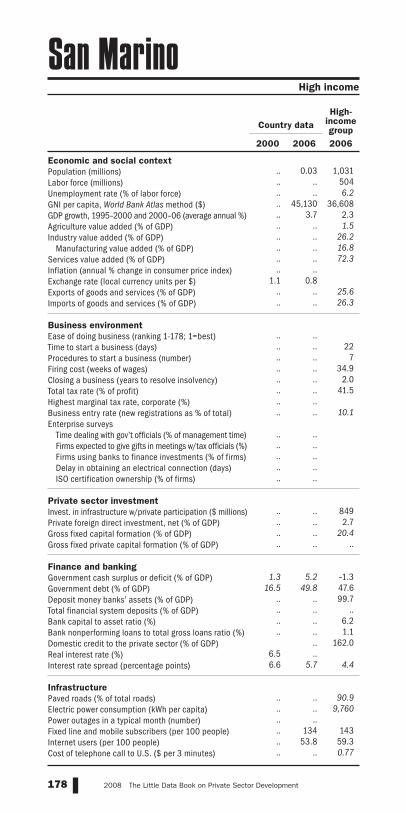
Economic and social contextPopulation (millions)Labor force (millions)Unemployment rate (% of labor force)GNI per capita, World Bank Atlas method ($)GDP growth, 1995–2000 and 2000–06 (average annual %)Agriculture value added (% of GDP)Industry value added (% of GDP)
Manufacturing value added (% of GDP)Services value added (% of GDP)Inflation (annual % change in consumer price index)Exchange rate (local currency units per $)Exports of goods and services (% of GDP)Imports of goods and services (% of GDP) Business environmentEase of doing business (ranking 1-178; 1=best)Time to start a business (days)Procedures to start a business (number)Firing cost (weeks of wages)Closing a business (years to resolve insolvency)Total tax rate (% of profit)Highest marginal tax rate, corporate (%)Business entry rate (new registrations as % of total)Enterprise surveys
Time dealing with gov’t officials (% of management time)Firms expected to give gifts in meetings w/tax officials (%)Firms using banks to finance investments (% of firms)Delay in obtaining an electrical connection (days)ISO certification ownership (% of firms)
Private sector investmentInvest. in infrastructure w/private participation ($ millions)Private foreign direct investment, net (% of GDP)Gross fixed capital formation (% of GDP)Gross fixed private capital formation (% of GDP) Finance and bankingGovernment cash surplus or deficit (% of GDP)Government debt (% of GDP)Deposit money banks’ assets (% of GDP)Total financial system deposits (% of GDP)Bank capital to asset ratio (%)Bank nonperforming loans to total gross loans ratio (%)Domestic credit to the private sector (% of GDP)Real interest rate (%)Interest rate spread (percentage points) Infrastructure Paved roads (% of total roads)Electric power consumption (kWh per capita)Power outages in a typical month (number)Fixed line and mobile subscribers (per 100 people)Internet users (per 100 people)Cost of telephone call to U.S. ($ per 3 minutes)
178 2008 The Little Data Book on Private Sector Development
.. 0.03 1,031.. .. 504.. .. 6.2.. 45,130 36,608.. 3.7 2.3.. .. 1.5.. .. 26.2.. .. 16.8.. .. 72.3.. ..
1.1 0.8.. .. 25.6.. .. 26.3 .. .... .. 22.. .. 7.. .. 34.9.. .. 2.0.. .. 41.5.. .... .. 10.1 .. .... .... .... .... .. .. .. 849.. .. 2.7.. .. 20.4.. .. ..
1.3 5.2 –1.316.5 49.8 47.6
.. .. 99.7
.. .. ..
.. .. 6.2
.. .. 1.1.. 162.0
6.5 ..6.6 5.7 4.4
.. .. 90.9.. .. 9,760.. .... 134 143.. 53.8 59.3.. .. 0.77
Country dataHigh-
income group
2000 2006 2006
High income
San Marino
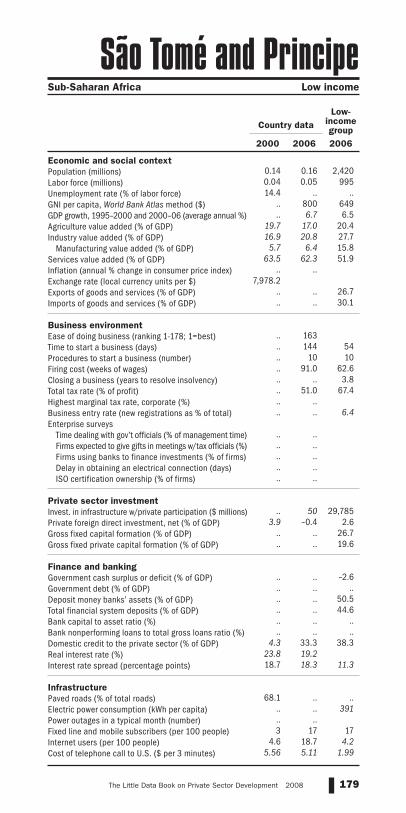
Economic and social contextPopulation (millions)Labor force (millions)Unemployment rate (% of labor force)GNI per capita, World Bank Atlas method ($)GDP growth, 1995–2000 and 2000–06 (average annual %)Agriculture value added (% of GDP)Industry value added (% of GDP)
Manufacturing value added (% of GDP)Services value added (% of GDP)Inflation (annual % change in consumer price index)Exchange rate (local currency units per $)Exports of goods and services (% of GDP)Imports of goods and services (% of GDP) Business environmentEase of doing business (ranking 1-178; 1=best)Time to start a business (days)Procedures to start a business (number)Firing cost (weeks of wages)Closing a business (years to resolve insolvency)Total tax rate (% of profit)Highest marginal tax rate, corporate (%)Business entry rate (new registrations as % of total)Enterprise surveys
Time dealing with gov’t officials (% of management time)Firms expected to give gifts in meetings w/tax officials (%)Firms using banks to finance investments (% of firms)Delay in obtaining an electrical connection (days)ISO certification ownership (% of firms)
Private sector investmentInvest. in infrastructure w/private participation ($ millions)Private foreign direct investment, net (% of GDP)Gross fixed capital formation (% of GDP)Gross fixed private capital formation (% of GDP) Finance and bankingGovernment cash surplus or deficit (% of GDP)Government debt (% of GDP)Deposit money banks’ assets (% of GDP)Total financial system deposits (% of GDP)Bank capital to asset ratio (%)Bank nonperforming loans to total gross loans ratio (%)Domestic credit to the private sector (% of GDP)Real interest rate (%)Interest rate spread (percentage points) Infrastructure Paved roads (% of total roads)Electric power consumption (kWh per capita)Power outages in a typical month (number)Fixed line and mobile subscribers (per 100 people)Internet users (per 100 people)Cost of telephone call to U.S. ($ per 3 minutes)
179The Little Data Book on Private Sector Development 2008
Sub-Saharan Africa Low income
Country dataLow-
income group
2000 2006 2006
0.14 0.16 2,4200.04 0.05 99514.4 .. ..
.. 800 649
.. 6.7 6.519.7 17.0 20.416.9 20.8 27.7
5.7 6.4 15.863.5 62.3 51.9
.. ..7,978.2
.. .. 26.7
.. .. 30.1 .. 163.. 144 54.. 10 10.. 91.0 62.6.. .. 3.8.. 51.0 67.4.. .... .. 6.4 .. .... .... .... .... .. .. 50 29,785
3.9 –0.4 2.6.. .. 26.7.. .. 19.6 .. .. –2.6.. .. .... .. 50.5.. .. 44.6.. .. .... .. ..
4.3 33.3 38.323.8 19.218.7 18.3 11.3
68.1 .. .... .. 391.. ..3 17 17
4.6 18.7 4.25.56 5.11 1.99
São Tomé and Principe

Economic and social contextPopulation (millions)Labor force (millions)Unemployment rate (% of labor force)GNI per capita, World Bank Atlas method ($)GDP growth, 1995–2000 and 2000–06 (average annual %)Agriculture value added (% of GDP)Industry value added (% of GDP)
Manufacturing value added (% of GDP)Services value added (% of GDP)Inflation (annual % change in consumer price index)Exchange rate (local currency units per $)Exports of goods and services (% of GDP)Imports of goods and services (% of GDP) Business environmentEase of doing business (ranking 1-178; 1=best)Time to start a business (days)Procedures to start a business (number)Firing cost (weeks of wages)Closing a business (years to resolve insolvency)Total tax rate (% of profit)Highest marginal tax rate, corporate (%)Business entry rate (new registrations as % of total)Enterprise surveys
Time dealing with gov’t officials (% of management time)Firms expected to give gifts in meetings w/tax officials (%)Firms using banks to finance investments (% of firms)Delay in obtaining an electrical connection (days)ISO certification ownership (% of firms)
Private sector investmentInvest. in infrastructure w/private participation ($ millions)Private foreign direct investment, net (% of GDP)Gross fixed capital formation (% of GDP)Gross fixed private capital formation (% of GDP) Finance and bankingGovernment cash surplus or deficit (% of GDP)Government debt (% of GDP)Deposit money banks’ assets (% of GDP)Total financial system deposits (% of GDP)Bank capital to asset ratio (%)Bank nonperforming loans to total gross loans ratio (%)Domestic credit to the private sector (% of GDP)Real interest rate (%)Interest rate spread (percentage points) Infrastructure Paved roads (% of total roads)Electric power consumption (kWh per capita)Power outages in a typical month (number)Fixed line and mobile subscribers (per 100 people)Internet users (per 100 people)Cost of telephone call to U.S. ($ per 3 minutes)
180 2008 The Little Data Book on Private Sector Development
20.7 23.7 1,0316.8 8.4 5044.6 6.2 6.2
8,140 13,980 36,6082.3 4.4 2.34.9 3.0 1.5
53.9 65.0 26.29.7 9.5 16.8
41.1 32.0 72.3–1.1 2.23.8 3.7
43.7 62.2 25.624.9 30.7 26.3
.. 23.. 15 22.. 7 7.. 80.0 34.9.. 2.8 2.0.. 14.5 41.5
45 .... .. 10.1 .. .... .... .... .... .. .. .. 849
–1.0 0.2 2.717.5 17.0 20.4
.. .. .. .. .. –1.3.. .. 47.6
40.6 46.9 99.715.3 17.7 ..
9.6 9.3 6.210.4 2.0 1.152.5 50.7 162.0
.. ..
.. .. 4.4
29.9 .. 90.95,666 6,813 9,760
.. ..21 100 143
2.2 19.8 59.35.20 .. 0.77
Country dataHigh-
income group
2000 2006 2006
High income
Saudi Arabia
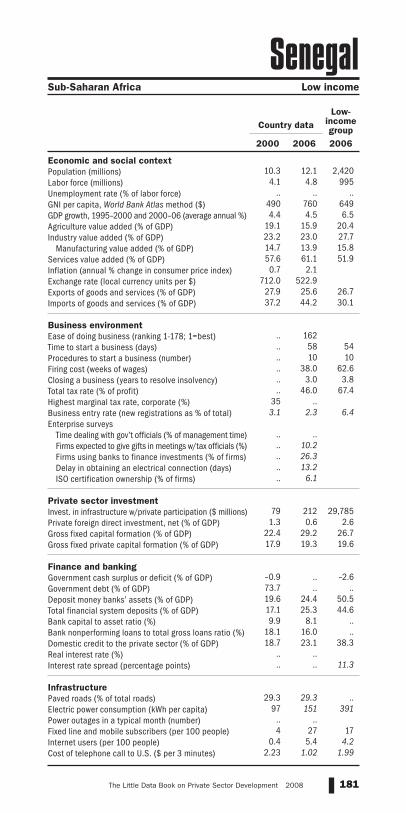
Economic and social contextPopulation (millions)Labor force (millions)Unemployment rate (% of labor force)GNI per capita, World Bank Atlas method ($)GDP growth, 1995–2000 and 2000–06 (average annual %)Agriculture value added (% of GDP)Industry value added (% of GDP)
Manufacturing value added (% of GDP)Services value added (% of GDP)Inflation (annual % change in consumer price index)Exchange rate (local currency units per $)Exports of goods and services (% of GDP)Imports of goods and services (% of GDP) Business environmentEase of doing business (ranking 1-178; 1=best)Time to start a business (days)Procedures to start a business (number)Firing cost (weeks of wages)Closing a business (years to resolve insolvency)Total tax rate (% of profit)Highest marginal tax rate, corporate (%)Business entry rate (new registrations as % of total)Enterprise surveys
Time dealing with gov’t officials (% of management time)Firms expected to give gifts in meetings w/tax officials (%)Firms using banks to finance investments (% of firms)Delay in obtaining an electrical connection (days)ISO certification ownership (% of firms)
Private sector investmentInvest. in infrastructure w/private participation ($ millions)Private foreign direct investment, net (% of GDP)Gross fixed capital formation (% of GDP)Gross fixed private capital formation (% of GDP) Finance and bankingGovernment cash surplus or deficit (% of GDP)Government debt (% of GDP)Deposit money banks’ assets (% of GDP)Total financial system deposits (% of GDP)Bank capital to asset ratio (%)Bank nonperforming loans to total gross loans ratio (%)Domestic credit to the private sector (% of GDP)Real interest rate (%)Interest rate spread (percentage points) Infrastructure Paved roads (% of total roads)Electric power consumption (kWh per capita)Power outages in a typical month (number)Fixed line and mobile subscribers (per 100 people)Internet users (per 100 people)Cost of telephone call to U.S. ($ per 3 minutes)
181The Little Data Book on Private Sector Development 2008
Sub-Saharan Africa Low income
Country dataLow-
income group
2000 2006 2006
10.3 12.1 2,420
4.1 4.8 995.. .. ..
490 760 6494.4 4.5 6.5
19.1 15.9 20.423.2 23.0 27.714.7 13.9 15.857.6 61.1 51.90.7 2.1
712.0 522.927.9 25.6 26.737.2 44.2 30.1
.. 162.. 58 54.. 10 10.. 38.0 62.6.. 3.0 3.8.. 46.0 67.4
35 ..3.1 2.3 6.4
.. .... 10.2.. 26.3.. 13.2.. 6.1
79 212 29,7851.3 0.6 2.6
22.4 29.2 26.717.9 19.3 19.6
–0.9 .. –2.673.7 .. ..19.6 24.4 50.517.1 25.3 44.69.9 8.1 ..
18.1 16.0 ..18.7 23.1 38.3
.. ..
.. .. 11.3
29.3 29.3 ..97 151 391
.. ..4 27 17
0.4 5.4 4.22.23 1.02 1.99
Senegal

Economic and social contextPopulation (millions)Labor force (millions)Unemployment rate (% of labor force)GNI per capita, World Bank Atlas method ($)GDP growth, 1995–2000 and 2000–06 (average annual %)Agriculture value added (% of GDP)Industry value added (% of GDP)
Manufacturing value added (% of GDP)Services value added (% of GDP)Inflation (annual % change in consumer price index)Exchange rate (local currency units per $)Exports of goods and services (% of GDP)Imports of goods and services (% of GDP) Business environmentEase of doing business (ranking 1-178; 1=best)Time to start a business (days)Procedures to start a business (number)Firing cost (weeks of wages)Closing a business (years to resolve insolvency)Total tax rate (% of profit)Highest marginal tax rate, corporate (%)Business entry rate (new registrations as % of total)Enterprise surveys
Time dealing with gov’t officials (% of management time)Firms expected to give gifts in meetings w/tax officials (%)Firms using banks to finance investments (% of firms)Delay in obtaining an electrical connection (days)ISO certification ownership (% of firms)
Private sector investmentInvest. in infrastructure w/private participation ($ millions)Private foreign direct investment, net (% of GDP)Gross fixed capital formation (% of GDP)Gross fixed private capital formation (% of GDP) Finance and bankingGovernment cash surplus or deficit (% of GDP)Government debt (% of GDP)Deposit money banks’ assets (% of GDP)Total financial system deposits (% of GDP)Bank capital to asset ratio (%)Bank nonperforming loans to total gross loans ratio (%)Domestic credit to the private sector (% of GDP)Real interest rate (%)Interest rate spread (percentage points) Infrastructure Paved roads (% of total roads)Electric power consumption (kWh per capita)Power outages in a typical month (number)Fixed line and mobile subscribers (per 100 people)Internet users (per 100 people)Cost of telephone call to U.S. ($ per 3 minutes)
182 2008 The Little Data Book on Private Sector Development
7.5 7.4 8113.5 3.6 374
.. .. 9.81,460 4,030 5,913
.. 5.3 3.919.4 12.7 5.729.6 25.5 32.4
.. .. 19.451.0 61.8 62.071.1 11.763.2 67.123.0 26.9 32.739.1 46.5 30.3
.. 86.. 23 41.. 11 9.. 25.0 39.7.. 2.7 2.9.. 35.8 44.5.. ..
3.8 5.4 9.1 .. 8.1
42.5 61.18.4 16.7
.. 16.8
.. 11.7
355 2,385 45,8690.3 16.0 3.5
12.3 17.9 19.99.5 14.2 ..
.. .. .... .. .... .. 52.9.. .. 41.4
18.3 15.6 9.821.6 21.4 3.247.5 26.8 41.4
–41.3 0.80.0 11.5 5.9
62.7 .. .... .. 3,131.. ..
49 99 885.3 20.3 22.2
.. .. 1.06
Country data
Upper middle-income group
2000 2006 2006
Europe & Central Asia Upper middle income
Serbia

Economic and social contextPopulation (millions)Labor force (millions)Unemployment rate (% of labor force)GNI per capita, World Bank Atlas method ($)GDP growth, 1995–2000 and 2000–06 (average annual %)Agriculture value added (% of GDP)Industry value added (% of GDP)
Manufacturing value added (% of GDP)Services value added (% of GDP)Inflation (annual % change in consumer price index)Exchange rate (local currency units per $)Exports of goods and services (% of GDP)Imports of goods and services (% of GDP) Business environmentEase of doing business (ranking 1-178; 1=best)Time to start a business (days)Procedures to start a business (number)Firing cost (weeks of wages)Closing a business (years to resolve insolvency)Total tax rate (% of profit)Highest marginal tax rate, corporate (%)Business entry rate (new registrations as % of total)Enterprise surveys
Time dealing with gov’t officials (% of management time)Firms expected to give gifts in meetings w/tax officials (%)Firms using banks to finance investments (% of firms)Delay in obtaining an electrical connection (days)ISO certification ownership (% of firms)
Private sector investmentInvest. in infrastructure w/private participation ($ millions)Private foreign direct investment, net (% of GDP)Gross fixed capital formation (% of GDP)Gross fixed private capital formation (% of GDP) Finance and bankingGovernment cash surplus or deficit (% of GDP)Government debt (% of GDP)Deposit money banks’ assets (% of GDP)Total financial system deposits (% of GDP)Bank capital to asset ratio (%)Bank nonperforming loans to total gross loans ratio (%)Domestic credit to the private sector (% of GDP)Real interest rate (%)Interest rate spread (percentage points) Infrastructure Paved roads (% of total roads)Electric power consumption (kWh per capita)Power outages in a typical month (number)Fixed line and mobile subscribers (per 100 people)Internet users (per 100 people)Cost of telephone call to U.S. ($ per 3 minutes)
183The Little Data Book on Private Sector Development 2008
Sub-Saharan Africa Upper middle income
Country data
Upper middle-income group
2000 2006 2006
0.08 0.08 811
.. .. 374
.. .. 9.87,420 8,870 5,913
6.6 –1.2 3.93.0 3.0 5.7
29.0 25.5 32.419.2 15.2 19.468.0 71.5 62.0
6.3 –0.35.7 5.5
78.2 111.0 32.781.4 133.5 30.3
.. 90.. 38 41.. 9 9.. 39.0 39.7.. .. 2.9.. 48.4 44.5.. .... .. 9.1 .. .... .... .... .... .. 7 15 45,869
4.0 18.8 3.525.2 32.7 19.913.8 22.6 ..
–13.9 –2.6 .... .. ..
90.2 104.5 52.980.7 105.4 41.4
.. .. 9.8
.. .. 3.222.3 36.9 41.4
9.4 7.76.0 7.4 5.9
84.5 96.0 .... .. 3,131.. ..
57 108 887.4 34.3 22.2
5.59 3.78 1.06
Seychelles
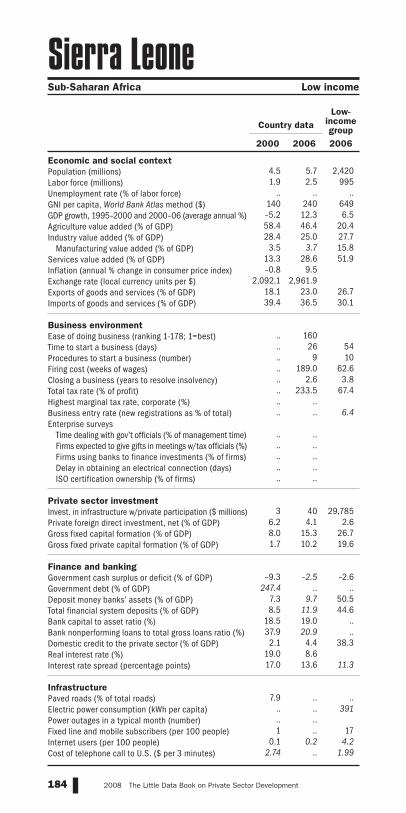
Economic and social contextPopulation (millions)Labor force (millions)Unemployment rate (% of labor force)GNI per capita, World Bank Atlas method ($)GDP growth, 1995–2000 and 2000–06 (average annual %)Agriculture value added (% of GDP)Industry value added (% of GDP)
Manufacturing value added (% of GDP)Services value added (% of GDP)Inflation (annual % change in consumer price index)Exchange rate (local currency units per $)Exports of goods and services (% of GDP)Imports of goods and services (% of GDP) Business environmentEase of doing business (ranking 1-178; 1=best)Time to start a business (days)Procedures to start a business (number)Firing cost (weeks of wages)Closing a business (years to resolve insolvency)Total tax rate (% of profit)Highest marginal tax rate, corporate (%)Business entry rate (new registrations as % of total)Enterprise surveys
Time dealing with gov’t officials (% of management time)Firms expected to give gifts in meetings w/tax officials (%)Firms using banks to finance investments (% of firms)Delay in obtaining an electrical connection (days)ISO certification ownership (% of firms)
Private sector investmentInvest. in infrastructure w/private participation ($ millions)Private foreign direct investment, net (% of GDP)Gross fixed capital formation (% of GDP)Gross fixed private capital formation (% of GDP) Finance and bankingGovernment cash surplus or deficit (% of GDP)Government debt (% of GDP)Deposit money banks’ assets (% of GDP)Total financial system deposits (% of GDP)Bank capital to asset ratio (%)Bank nonperforming loans to total gross loans ratio (%)Domestic credit to the private sector (% of GDP)Real interest rate (%)Interest rate spread (percentage points) Infrastructure Paved roads (% of total roads)Electric power consumption (kWh per capita)Power outages in a typical month (number)Fixed line and mobile subscribers (per 100 people)Internet users (per 100 people)Cost of telephone call to U.S. ($ per 3 minutes)
184 2008 The Little Data Book on Private Sector Development
4.5 5.7 2,4201.9 2.5 995
.. .. ..140 240 649–5.2 12.3 6.558.4 46.4 20.428.4 25.0 27.7
3.5 3.7 15.813.3 28.6 51.9–0.8 9.5
2,092.1 2,961.918.1 23.0 26.739.4 36.5 30.1
.. 160.. 26 54.. 9 10.. 189.0 62.6.. 2.6 3.8.. 233.5 67.4.. .... .. 6.4 .. .... .... .... .... .. 3 40 29,785
6.2 4.1 2.68.0 15.3 26.71.7 10.2 19.6
–9.3 –2.5 –2.6247.4 .. ..
7.3 9.7 50.58.5 11.9 44.6
18.5 19.0 ..37.9 20.9 ..2.1 4.4 38.3
19.0 8.617.0 13.6 11.3
7.9 .. .... .. 391.. ..1 .. 17
0.1 0.2 4.22.74 .. 1.99
Country dataLow-
income group
2000 2006 2006
Sub-Saharan Africa Low income
Sierra Leone
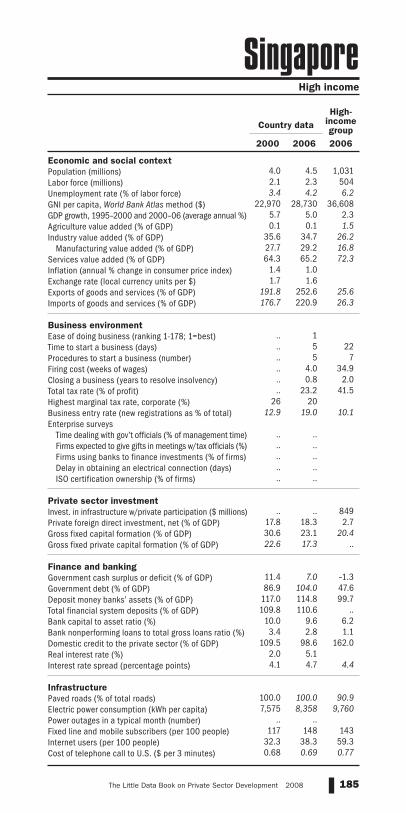
Economic and social contextPopulation (millions)Labor force (millions)Unemployment rate (% of labor force)GNI per capita, World Bank Atlas method ($)GDP growth, 1995–2000 and 2000–06 (average annual %)Agriculture value added (% of GDP)Industry value added (% of GDP)
Manufacturing value added (% of GDP)Services value added (% of GDP)Inflation (annual % change in consumer price index)Exchange rate (local currency units per $)Exports of goods and services (% of GDP)Imports of goods and services (% of GDP) Business environmentEase of doing business (ranking 1-178; 1=best)Time to start a business (days)Procedures to start a business (number)Firing cost (weeks of wages)Closing a business (years to resolve insolvency)Total tax rate (% of profit)Highest marginal tax rate, corporate (%)Business entry rate (new registrations as % of total)Enterprise surveys
Time dealing with gov’t officials (% of management time)Firms expected to give gifts in meetings w/tax officials (%)Firms using banks to finance investments (% of firms)Delay in obtaining an electrical connection (days)ISO certification ownership (% of firms)
Private sector investmentInvest. in infrastructure w/private participation ($ millions)Private foreign direct investment, net (% of GDP)Gross fixed capital formation (% of GDP)Gross fixed private capital formation (% of GDP) Finance and bankingGovernment cash surplus or deficit (% of GDP)Government debt (% of GDP)Deposit money banks’ assets (% of GDP)Total financial system deposits (% of GDP)Bank capital to asset ratio (%)Bank nonperforming loans to total gross loans ratio (%)Domestic credit to the private sector (% of GDP)Real interest rate (%)Interest rate spread (percentage points) Infrastructure Paved roads (% of total roads)Electric power consumption (kWh per capita)Power outages in a typical month (number)Fixed line and mobile subscribers (per 100 people)Internet users (per 100 people)Cost of telephone call to U.S. ($ per 3 minutes)
185The Little Data Book on Private Sector Development 2008
High income
Country dataHigh-
income group
2000 2006 2006
4.0 4.5 1,0312.1 2.3 5043.4 4.2 6.2
22,970 28,730 36,6085.7 5.0 2.30.1 0.1 1.5
35.6 34.7 26.227.7 29.2 16.864.3 65.2 72.3
1.4 1.01.7 1.6
191.8 252.6 25.6176.7 220.9 26.3
.. 1.. 5 22.. 5 7.. 4.0 34.9.. 0.8 2.0.. 23.2 41.5
26 2012.9 19.0 10.1
.. .... .... .... .... .. .. .. 849
17.8 18.3 2.730.6 23.1 20.422.6 17.3 ..
11.4 7.0 –1.386.9 104.0 47.6
117.0 114.8 99.7109.8 110.6 ..
10.0 9.6 6.23.4 2.8 1.1
109.5 98.6 162.02.0 5.14.1 4.7 4.4
100.0 100.0 90.97,575 8,358 9,760
.. ..117 148 143
32.3 38.3 59.30.68 0.69 0.77
Singapore
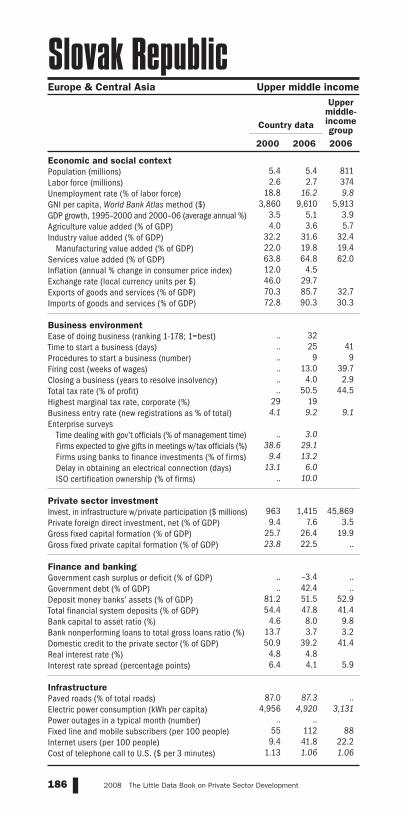
Economic and social contextPopulation (millions)Labor force (millions)Unemployment rate (% of labor force)GNI per capita, World Bank Atlas method ($)GDP growth, 1995–2000 and 2000–06 (average annual %)Agriculture value added (% of GDP)Industry value added (% of GDP)
Manufacturing value added (% of GDP)Services value added (% of GDP)Inflation (annual % change in consumer price index)Exchange rate (local currency units per $)Exports of goods and services (% of GDP)Imports of goods and services (% of GDP) Business environmentEase of doing business (ranking 1-178; 1=best)Time to start a business (days)Procedures to start a business (number)Firing cost (weeks of wages)Closing a business (years to resolve insolvency)Total tax rate (% of profit)Highest marginal tax rate, corporate (%)Business entry rate (new registrations as % of total)Enterprise surveys
Time dealing with gov’t officials (% of management time)Firms expected to give gifts in meetings w/tax officials (%)Firms using banks to finance investments (% of firms)Delay in obtaining an electrical connection (days)ISO certification ownership (% of firms)
Private sector investmentInvest. in infrastructure w/private participation ($ millions)Private foreign direct investment, net (% of GDP)Gross fixed capital formation (% of GDP)Gross fixed private capital formation (% of GDP) Finance and bankingGovernment cash surplus or deficit (% of GDP)Government debt (% of GDP)Deposit money banks’ assets (% of GDP)Total financial system deposits (% of GDP)Bank capital to asset ratio (%)Bank nonperforming loans to total gross loans ratio (%)Domestic credit to the private sector (% of GDP)Real interest rate (%)Interest rate spread (percentage points) Infrastructure Paved roads (% of total roads)Electric power consumption (kWh per capita)Power outages in a typical month (number)Fixed line and mobile subscribers (per 100 people)Internet users (per 100 people)Cost of telephone call to U.S. ($ per 3 minutes)
186 2008 The Little Data Book on Private Sector Development
5.4 5.4 8112.6 2.7 374
18.8 16.2 9.83,860 9,610 5,913
3.5 5.1 3.94.0 3.6 5.7
32.2 31.6 32.422.0 19.8 19.463.8 64.8 62.012.0 4.546.0 29.770.3 85.7 32.772.8 90.3 30.3
.. 32.. 25 41.. 9 9.. 13.0 39.7.. 4.0 2.9.. 50.5 44.5
29 194.1 9.2 9.1
.. 3.0
38.6 29.19.4 13.2
13.1 6.0.. 10.0
963 1,415 45,8699.4 7.6 3.5
25.7 26.4 19.923.8 22.5 ..
.. –3.4 .... 42.4 ..
81.2 51.5 52.954.4 47.8 41.4
4.6 8.0 9.813.7 3.7 3.250.9 39.2 41.4
4.8 4.86.4 4.1 5.9
87.0 87.3 ..4,956 4,920 3,131
.. ..55 112 889.4 41.8 22.2
1.13 1.06 1.06
Country data
Upper middle-income group
2000 2006 2006
Europe & Central Asia Upper middle income
Slovak Republic

Economic and social contextPopulation (millions)Labor force (millions)Unemployment rate (% of labor force)GNI per capita, World Bank Atlas method ($)GDP growth, 1995–2000 and 2000–06 (average annual %)Agriculture value added (% of GDP)Industry value added (% of GDP)
Manufacturing value added (% of GDP)Services value added (% of GDP)Inflation (annual % change in consumer price index)Exchange rate (local currency units per $)Exports of goods and services (% of GDP)Imports of goods and services (% of GDP) Business environmentEase of doing business (ranking 1-178; 1=best)Time to start a business (days)Procedures to start a business (number)Firing cost (weeks of wages)Closing a business (years to resolve insolvency)Total tax rate (% of profit)Highest marginal tax rate, corporate (%)Business entry rate (new registrations as % of total)Enterprise surveys
Time dealing with gov’t officials (% of management time)Firms expected to give gifts in meetings w/tax officials (%)Firms using banks to finance investments (% of firms)Delay in obtaining an electrical connection (days)ISO certification ownership (% of firms)
Private sector investmentInvest. in infrastructure w/private participation ($ millions)Private foreign direct investment, net (% of GDP)Gross fixed capital formation (% of GDP)Gross fixed private capital formation (% of GDP) Finance and bankingGovernment cash surplus or deficit (% of GDP)Government debt (% of GDP)Deposit money banks’ assets (% of GDP)Total financial system deposits (% of GDP)Bank capital to asset ratio (%)Bank nonperforming loans to total gross loans ratio (%)Domestic credit to the private sector (% of GDP)Real interest rate (%)Interest rate spread (percentage points) Infrastructure Paved roads (% of total roads)Electric power consumption (kWh per capita)Power outages in a typical month (number)Fixed line and mobile subscribers (per 100 people)Internet users (per 100 people)Cost of telephone call to U.S. ($ per 3 minutes)
187The Little Data Book on Private Sector Development 2008
High income
Country dataHigh-
income group
2000 2006 2006
2.0 2.0 1,031
0.97 1.0 5047.2 5.8 6.2
10,780 18,660 36,6084.5 3.7 2.33.2 2.3 1.5
36.2 34.6 26.226.5 24.6 16.860.6 63.1 72.3
8.9 2.5222.7 191.055.6 69.2 25.659.1 69.9 26.3
.. 55.. 60 22.. 9 7.. 40.0 34.9.. 2.0 2.0.. 39.2 41.5
25 256.4 8.0 10.1
.. 3.7
15.6 14.510.6 29.614.2 13.8
.. 20.2 .. .. 849
0.7 1.7 2.725.6 25.8 20.459.1 61.2 ..
–1.1 –0.8 –1.322.8 .. 47.644.9 71.3 99.742.4 52.9 ..10.1 7.4 6.26.5 4.9 1.1
37.0 68.8 162.09.8 5.05.7 4.6 4.4
100.0 100.0 90.95,778 6,918 9,760
.. ..101 132 14315.1 62.3 59.30.81 0.65 0.77
Slovenia

Economic and social contextPopulation (millions)Labor force (millions)Unemployment rate (% of labor force)GNI per capita, World Bank Atlas method ($)GDP growth, 1995–2000 and 2000–06 (average annual %)Agriculture value added (% of GDP)Industry value added (% of GDP)
Manufacturing value added (% of GDP)Services value added (% of GDP)Inflation (annual % change in consumer price index)Exchange rate (local currency units per $)Exports of goods and services (% of GDP)Imports of goods and services (% of GDP) Business environmentEase of doing business (ranking 1-178; 1=best)Time to start a business (days)Procedures to start a business (number)Firing cost (weeks of wages)Closing a business (years to resolve insolvency)Total tax rate (% of profit)Highest marginal tax rate, corporate (%)Business entry rate (new registrations as % of total)Enterprise surveys
Time dealing with gov’t officials (% of management time)Firms expected to give gifts in meetings w/tax officials (%)Firms using banks to finance investments (% of firms)Delay in obtaining an electrical connection (days)ISO certification ownership (% of firms)
Private sector investmentInvest. in infrastructure w/private participation ($ millions)Private foreign direct investment, net (% of GDP)Gross fixed capital formation (% of GDP)Gross fixed private capital formation (% of GDP) Finance and bankingGovernment cash surplus or deficit (% of GDP)Government debt (% of GDP)Deposit money banks’ assets (% of GDP)Total financial system deposits (% of GDP)Bank capital to asset ratio (%)Bank nonperforming loans to total gross loans ratio (%)Domestic credit to the private sector (% of GDP)Real interest rate (%)Interest rate spread (percentage points) Infrastructure Paved roads (% of total roads)Electric power consumption (kWh per capita)Power outages in a typical month (number)Fixed line and mobile subscribers (per 100 people)Internet users (per 100 people)Cost of telephone call to U.S. ($ per 3 minutes)
188 2008 The Little Data Book on Private Sector Development
0.42 0.48 2,4200.17 0.20 995
.. .. ..690 690 649–1.7 3.2 6.5
.. .. 20.4
.. .. 27.7
.. .. 15.8
.. .. 51.97.9 7.55.1 7.6
39.6 47.9 26.759.0 54.3 30.1
.. 79.. 57 54.. 7 10.. 44.0 62.6.. 1.0 3.8.. 32.6 67.4
30 30.. .. 6.4 .. .... .... .... .... .. .. .. 29,785
4.4 5.5 2.621.7 35.3 26.717.1 17.2 19.6
.. .. –2.6.. .. ..
22.5 .. 50.522.9 .. 44.6
.. .. ..
.. .. ..22.2 28.8 38.3
3.5 6.612.0 13.1 11.3
2.4 .. .... .. 391.. ..2 3 17
0.5 1.7 4.2.. .. 1.99
Country dataLow-
income group
2000 2006 2006
East Asia & Pacific Low income
Solomon Islands

Economic and social contextPopulation (millions)Labor force (millions)Unemployment rate (% of labor force)GNI per capita, World Bank Atlas method ($)GDP growth, 1995–2000 and 2000–06 (average annual %)Agriculture value added (% of GDP)Industry value added (% of GDP)
Manufacturing value added (% of GDP)Services value added (% of GDP)Inflation (annual % change in consumer price index)Exchange rate (local currency units per $)Exports of goods and services (% of GDP)Imports of goods and services (% of GDP) Business environmentEase of doing business (ranking 1-178; 1=best)Time to start a business (days)Procedures to start a business (number)Firing cost (weeks of wages)Closing a business (years to resolve insolvency)Total tax rate (% of profit)Highest marginal tax rate, corporate (%)Business entry rate (new registrations as % of total)Enterprise surveys
Time dealing with gov’t officials (% of management time)Firms expected to give gifts in meetings w/tax officials (%)Firms using banks to finance investments (% of firms)Delay in obtaining an electrical connection (days)ISO certification ownership (% of firms)
Private sector investmentInvest. in infrastructure w/private participation ($ millions)Private foreign direct investment, net (% of GDP)Gross fixed capital formation (% of GDP)Gross fixed private capital formation (% of GDP) Finance and bankingGovernment cash surplus or deficit (% of GDP)Government debt (% of GDP)Deposit money banks’ assets (% of GDP)Total financial system deposits (% of GDP)Bank capital to asset ratio (%)Bank nonperforming loans to total gross loans ratio (%)Domestic credit to the private sector (% of GDP)Real interest rate (%)Interest rate spread (percentage points) Infrastructure Paved roads (% of total roads)Electric power consumption (kWh per capita)Power outages in a typical month (number)Fixed line and mobile subscribers (per 100 people)Internet users (per 100 people)Cost of telephone call to U.S. ($ per 3 minutes)
189The Little Data Book on Private Sector Development 2008
Sub-Saharan Africa Low income
Country dataLow-
income group
2000 2006 2006
7.1 8.4 2,4203.0 3.6 995
.. .. ..
.. .. 649
.. .. 6.5
.. .. 20.4
.. .. 27.7
.. .. 15.8
.. .. 51.9
.. ..
.. ..
.. .. 26.7
.. .. 30.1 .. .... .. 54.. .. 10.. .. 62.6.. .. 3.8.. .. 67.4.. .... .. 6.4 .. .... .... .... .... .. 1 1 29,785.. .. 2.6.. .. 26.7.. .. 19.6 .. .. –2.6.. .. .... .. 50.5.. .. 44.6.. .. .... .. .... .. 38.3.. .... .. 11.3
11.8 .. .... .. 391.. ..1 7 17
0.2 1.1 4.2.. .. 1.99
Somalia
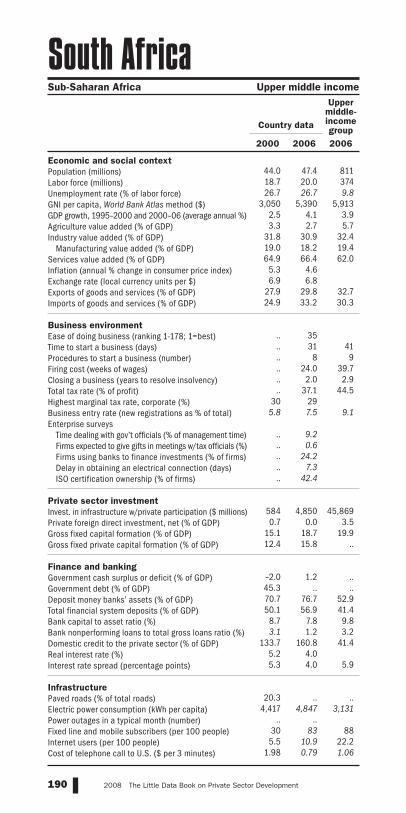
Economic and social contextPopulation (millions)Labor force (millions)Unemployment rate (% of labor force)GNI per capita, World Bank Atlas method ($)GDP growth, 1995–2000 and 2000–06 (average annual %)Agriculture value added (% of GDP)Industry value added (% of GDP)
Manufacturing value added (% of GDP)Services value added (% of GDP)Inflation (annual % change in consumer price index)Exchange rate (local currency units per $)Exports of goods and services (% of GDP)Imports of goods and services (% of GDP) Business environmentEase of doing business (ranking 1-178; 1=best)Time to start a business (days)Procedures to start a business (number)Firing cost (weeks of wages)Closing a business (years to resolve insolvency)Total tax rate (% of profit)Highest marginal tax rate, corporate (%)Business entry rate (new registrations as % of total)Enterprise surveys
Time dealing with gov’t officials (% of management time)Firms expected to give gifts in meetings w/tax officials (%)Firms using banks to finance investments (% of firms)Delay in obtaining an electrical connection (days)ISO certification ownership (% of firms)
Private sector investmentInvest. in infrastructure w/private participation ($ millions)Private foreign direct investment, net (% of GDP)Gross fixed capital formation (% of GDP)Gross fixed private capital formation (% of GDP) Finance and bankingGovernment cash surplus or deficit (% of GDP)Government debt (% of GDP)Deposit money banks’ assets (% of GDP)Total financial system deposits (% of GDP)Bank capital to asset ratio (%)Bank nonperforming loans to total gross loans ratio (%)Domestic credit to the private sector (% of GDP)Real interest rate (%)Interest rate spread (percentage points) Infrastructure Paved roads (% of total roads)Electric power consumption (kWh per capita)Power outages in a typical month (number)Fixed line and mobile subscribers (per 100 people)Internet users (per 100 people)Cost of telephone call to U.S. ($ per 3 minutes)
190 2008 The Little Data Book on Private Sector Development
44.0 47.4 81118.7 20.0 37426.7 26.7 9.8
3,050 5,390 5,9132.5 4.1 3.93.3 2.7 5.7
31.8 30.9 32.419.0 18.2 19.464.9 66.4 62.0
5.3 4.66.9 6.8
27.9 29.8 32.724.9 33.2 30.3
.. 35.. 31 41.. 8 9.. 24.0 39.7.. 2.0 2.9.. 37.1 44.5
30 295.8 7.5 9.1
.. 9.2.. 0.6.. 24.2.. 7.3.. 42.4
584 4,850 45,8690.7 0.0 3.5
15.1 18.7 19.912.4 15.8 ..
–2.0 1.2 ..45.3 .. ..70.7 76.7 52.950.1 56.9 41.4
8.7 7.8 9.83.1 1.2 3.2
133.7 160.8 41.45.2 4.05.3 4.0 5.9
20.3 .. ..4,417 4,847 3,131
.. ..30 83 885.5 10.9 22.2
1.98 0.79 1.06
Country data
Upper middle-income group
2000 2006 2006
Sub-Saharan Africa Upper middle income
South Africa

Economic and social contextPopulation (millions)Labor force (millions)Unemployment rate (% of labor force)GNI per capita, World Bank Atlas method ($)GDP growth, 1995–2000 and 2000–06 (average annual %)Agriculture value added (% of GDP)Industry value added (% of GDP)
Manufacturing value added (% of GDP)Services value added (% of GDP)Inflation (annual % change in consumer price index)Exchange rate (local currency units per $)Exports of goods and services (% of GDP)Imports of goods and services (% of GDP) Business environmentEase of doing business (ranking 1-178; 1=best)Time to start a business (days)Procedures to start a business (number)Firing cost (weeks of wages)Closing a business (years to resolve insolvency)Total tax rate (% of profit)Highest marginal tax rate, corporate (%)Business entry rate (new registrations as % of total)Enterprise surveys
Time dealing with gov’t officials (% of management time)Firms expected to give gifts in meetings w/tax officials (%)Firms using banks to finance investments (% of firms)Delay in obtaining an electrical connection (days)ISO certification ownership (% of firms)
Private sector investmentInvest. in infrastructure w/private participation ($ millions)Private foreign direct investment, net (% of GDP)Gross fixed capital formation (% of GDP)Gross fixed private capital formation (% of GDP) Finance and bankingGovernment cash surplus or deficit (% of GDP)Government debt (% of GDP)Deposit money banks’ assets (% of GDP)Total financial system deposits (% of GDP)Bank capital to asset ratio (%)Bank nonperforming loans to total gross loans ratio (%)Domestic credit to the private sector (% of GDP)Real interest rate (%)Interest rate spread (percentage points) Infrastructure Paved roads (% of total roads)Electric power consumption (kWh per capita)Power outages in a typical month (number)Fixed line and mobile subscribers (per 100 people)Internet users (per 100 people)Cost of telephone call to U.S. ($ per 3 minutes)
191The Little Data Book on Private Sector Development 2008
High income
Country dataHigh-
income group
2000 2006 2006
40.3 44.1 1,03118.3 21.1 50413.9 9.2 6.2
15,420 27,340 36,6084.2 3.3 2.34.4 3.1 1.5
29.2 29.7 26.218.6 15.5 16.866.4 67.2 72.3
3.4 3.51.1 0.8
29.0 26.1 25.632.2 32.3 26.3
.. 38.. 47 22.. 10 7.. 56.0 34.9.. 1.0 2.0.. 62.0 41.5
35 356.4 6.3 10.1
.. .... .... .... .... .. .. .. 849
6.7 1.6 2.725.8 30.3 20.4
.. .. ..
–0.5 1.9 –1.358.9 39.8 47.6
105.6 .. 99.758.1 .. ..8.5 7.2 6.21.2 0.6 1.1
97.7 167.4 162.01.7 ..2.2 .. 4.4
99.0 99.0 90.95,207 6,147 9,760
.. ..103 146 14313.6 42.1 59.31.08 0.60 0.77
Spain

Economic and social contextPopulation (millions)Labor force (millions)Unemployment rate (% of labor force)GNI per capita, World Bank Atlas method ($)GDP growth, 1995–2000 and 2000–06 (average annual %)Agriculture value added (% of GDP)Industry value added (% of GDP)
Manufacturing value added (% of GDP)Services value added (% of GDP)Inflation (annual % change in consumer price index)Exchange rate (local currency units per $)Exports of goods and services (% of GDP)Imports of goods and services (% of GDP) Business environmentEase of doing business (ranking 1-178; 1=best)Time to start a business (days)Procedures to start a business (number)Firing cost (weeks of wages)Closing a business (years to resolve insolvency)Total tax rate (% of profit)Highest marginal tax rate, corporate (%)Business entry rate (new registrations as % of total)Enterprise surveys
Time dealing with gov’t officials (% of management time)Firms expected to give gifts in meetings w/tax officials (%)Firms using banks to finance investments (% of firms)Delay in obtaining an electrical connection (days)ISO certification ownership (% of firms)
Private sector investmentInvest. in infrastructure w/private participation ($ millions)Private foreign direct investment, net (% of GDP)Gross fixed capital formation (% of GDP)Gross fixed private capital formation (% of GDP) Finance and bankingGovernment cash surplus or deficit (% of GDP)Government debt (% of GDP)Deposit money banks’ assets (% of GDP)Total financial system deposits (% of GDP)Bank capital to asset ratio (%)Bank nonperforming loans to total gross loans ratio (%)Domestic credit to the private sector (% of GDP)Real interest rate (%)Interest rate spread (percentage points) Infrastructure Paved roads (% of total roads)Electric power consumption (kWh per capita)Power outages in a typical month (number)Fixed line and mobile subscribers (per 100 people)Internet users (per 100 people)Cost of telephone call to U.S. ($ per 3 minutes)
192 2008 The Little Data Book on Private Sector Development
19.4 19.9 2,2768.0 8.4 1,2097.4 7.6 5.7
850 1,310 2,0385.0 4.8 7.6
19.9 16.5 11.927.3 27.1 43.516.8 13.9 26.752.8 56.5 44.66.2 13.7
77.0 103.939.0 31.6 40.449.6 43.2 36.4
.. 101.. 39 53.. 5 10.. 169.0 50.2.. 1.7 3.3.. 63.7 45.8
35 356.8 8.1 7.6
.. 3.5.. 2.7.. 16.2.. 83.4.. ..
159 310 38,1541.1 1.8 3.0
28.0 28.7 33.524.8 24.8 10.9
–8.4 –7.2 –0.996.9 93.0 ..32.1 35.8 87.831.1 34.6 43.14.4 6.7 10.7
15.3 9.6 4.028.8 32.8 81.3
8.3 –2.77.0 –3.2 7.2
85.8 81.0 65.8288 378 1,502
.. ..6 37 60
0.6 2.2 11.43.29 2.11 2.08
Country data
Lower middle-income group
2000 2006 2006
South Asia Lower middle income
Sri Lanka

Economic and social contextPopulation (millions)Labor force (millions)Unemployment rate (% of labor force)GNI per capita, World Bank Atlas method ($)GDP growth, 1995–2000 and 2000–06 (average annual %)Agriculture value added (% of GDP)Industry value added (% of GDP)
Manufacturing value added (% of GDP)Services value added (% of GDP)Inflation (annual % change in consumer price index)Exchange rate (local currency units per $)Exports of goods and services (% of GDP)Imports of goods and services (% of GDP) Business environmentEase of doing business (ranking 1-178; 1=best)Time to start a business (days)Procedures to start a business (number)Firing cost (weeks of wages)Closing a business (years to resolve insolvency)Total tax rate (% of profit)Highest marginal tax rate, corporate (%)Business entry rate (new registrations as % of total)Enterprise surveys
Time dealing with gov’t officials (% of management time)Firms expected to give gifts in meetings w/tax officials (%)Firms using banks to finance investments (% of firms)Delay in obtaining an electrical connection (days)ISO certification ownership (% of firms)
Private sector investmentInvest. in infrastructure w/private participation ($ millions)Private foreign direct investment, net (% of GDP)Gross fixed capital formation (% of GDP)Gross fixed private capital formation (% of GDP) Finance and bankingGovernment cash surplus or deficit (% of GDP)Government debt (% of GDP)Deposit money banks’ assets (% of GDP)Total financial system deposits (% of GDP)Bank capital to asset ratio (%)Bank nonperforming loans to total gross loans ratio (%)Domestic credit to the private sector (% of GDP)Real interest rate (%)Interest rate spread (percentage points) Infrastructure Paved roads (% of total roads)Electric power consumption (kWh per capita)Power outages in a typical month (number)Fixed line and mobile subscribers (per 100 people)Internet users (per 100 people)Cost of telephone call to U.S. ($ per 3 minutes)
193The Little Data Book on Private Sector Development 2008
Latin America & Caribbean Upper middle income
Country data
Upper middle-income group
2000 2006 2006
0.04 0.05 811
.. .. 374
.. .. 9.86,490 8,460 5,913
4.3 3.9 3.92.7 3.0 5.7
28.8 27.6 32.410.4 9.7 19.468.5 69.4 62.0
2.0 1.82.7 2.7
45.6 46.9 32.775.6 66.6 30.3
.. 64.. 46 41.. 9 9.. 8.0 39.7.. .. 2.9.. 52.6 44.5.. .... .. 9.1 .. .... .... .... .... .. .. .. 45,869
29.2 42.4 3.549.6 45.5 19.939.3 41.9 ..
.. 1.3 .... .. ..
117.3 119.6 52.9108.6 128.5 41.4
.. .. 9.8
.. .. 3.276.6 69.8 41.4
5.7 3.96.8 4.7 5.9
42.5 .. .... .. 3,131.. ..
52 74 886.1 .. 22.2
.. .. 1.06
St. Kitts and Nevis

Economic and social contextPopulation (millions)Labor force (millions)Unemployment rate (% of labor force)GNI per capita, World Bank Atlas method ($)GDP growth, 1995–2000 and 2000–06 (average annual %)Agriculture value added (% of GDP)Industry value added (% of GDP)
Manufacturing value added (% of GDP)Services value added (% of GDP)Inflation (annual % change in consumer price index)Exchange rate (local currency units per $)Exports of goods and services (% of GDP)Imports of goods and services (% of GDP) Business environmentEase of doing business (ranking 1-178; 1=best)Time to start a business (days)Procedures to start a business (number)Firing cost (weeks of wages)Closing a business (years to resolve insolvency)Total tax rate (% of profit)Highest marginal tax rate, corporate (%)Business entry rate (new registrations as % of total)Enterprise surveys
Time dealing with gov’t officials (% of management time)Firms expected to give gifts in meetings w/tax officials (%)Firms using banks to finance investments (% of firms)Delay in obtaining an electrical connection (days)ISO certification ownership (% of firms)
Private sector investmentInvest. in infrastructure w/private participation ($ millions)Private foreign direct investment, net (% of GDP)Gross fixed capital formation (% of GDP)Gross fixed private capital formation (% of GDP) Finance and bankingGovernment cash surplus or deficit (% of GDP)Government debt (% of GDP)Deposit money banks’ assets (% of GDP)Total financial system deposits (% of GDP)Bank capital to asset ratio (%)Bank nonperforming loans to total gross loans ratio (%)Domestic credit to the private sector (% of GDP)Real interest rate (%)Interest rate spread (percentage points) Infrastructure Paved roads (% of total roads)Electric power consumption (kWh per capita)Power outages in a typical month (number)Fixed line and mobile subscribers (per 100 people)Internet users (per 100 people)Cost of telephone call to U.S. ($ per 3 minutes)
194 2008 The Little Data Book on Private Sector Development
0.16 0.17 8110.07 0.08 37416.5 24.8 9.8
3,910 5,060 5,9133.0 3.8 3.96.5 3.9 5.7
18.2 18.8 32.45.0 5.5 19.4
75.3 77.3 62.03.6 2.32.7 2.7
57.2 52.0 32.767.7 65.5 30.3
.. 34.. 40 41.. 6 9.. 56.0 39.7.. 2.0 2.9.. 36.9 44.5
33 30.. .. 9.1 .. .... .... .... .... ..
15 10 45,8698.2 13.2 3.5
27.6 23.1 19.917.7 18.4 ..
.. .. .... .. ..
84.4 89.2 52.970.8 80.1 41.4
.. .. 9.8
.. .. 3.283.3 37.1 41.4
5.5 13.68.3 7.8 5.9
.. .. .... .. 3,131.. ..
33 .. 885.1 33.9 22.2
.. .. 1.06
Country data
Upper middle-income group
2000 2006 2006
Latin America & Caribbean Upper middle income
St. Lucia

Economic and social contextPopulation (millions)Labor force (millions)Unemployment rate (% of labor force)GNI per capita, World Bank Atlas method ($)GDP growth, 1995–2000 and 2000–06 (average annual %)Agriculture value added (% of GDP)Industry value added (% of GDP)
Manufacturing value added (% of GDP)Services value added (% of GDP)Inflation (annual % change in consumer price index)Exchange rate (local currency units per $)Exports of goods and services (% of GDP)Imports of goods and services (% of GDP) Business environmentEase of doing business (ranking 1-178; 1=best)Time to start a business (days)Procedures to start a business (number)Firing cost (weeks of wages)Closing a business (years to resolve insolvency)Total tax rate (% of profit)Highest marginal tax rate, corporate (%)Business entry rate (new registrations as % of total)Enterprise surveys
Time dealing with gov’t officials (% of management time)Firms expected to give gifts in meetings w/tax officials (%)Firms using banks to finance investments (% of firms)Delay in obtaining an electrical connection (days)ISO certification ownership (% of firms)
Private sector investmentInvest. in infrastructure w/private participation ($ millions)Private foreign direct investment, net (% of GDP)Gross fixed capital formation (% of GDP)Gross fixed private capital formation (% of GDP) Finance and bankingGovernment cash surplus or deficit (% of GDP)Government debt (% of GDP)Deposit money banks’ assets (% of GDP)Total financial system deposits (% of GDP)Bank capital to asset ratio (%)Bank nonperforming loans to total gross loans ratio (%)Domestic credit to the private sector (% of GDP)Real interest rate (%)Interest rate spread (percentage points) Infrastructure Paved roads (% of total roads)Electric power consumption (kWh per capita)Power outages in a typical month (number)Fixed line and mobile subscribers (per 100 people)Internet users (per 100 people)Cost of telephone call to U.S. ($ per 3 minutes)
195The Little Data Book on Private Sector Development 2008
Latin America & Caribbean Upper middle income
Country data
Upper middle-income group
2000 2006 2006
0.12 0.12 8110.05 0.06 374
.. .. 9.82,740 3,320 5,913
5.7 3.5 3.910.8 8.1 5.724.0 24.7 32.46.0 5.7 19.4
65.2 67.2 62.00.2 3.02.7 2.7
53.6 48.4 32.759.9 76.5 30.3
.. 54.. 12 41.. 8 9.. 54.0 39.7.. .. 2.9.. 45.0 44.5.. .... .. 9.1 .. .... .... .... .... .. .. 35 45,869
11.3 20.1 3.527.4 36.5 19.920.3 27.8 ..
.. .. .... .. ..
76.6 76.8 52.985.6 82.5 41.4
.. .. 9.8
.. .. 3.265.5 67.9 41.412.5 19.66.9 6.8 5.9
68.0 70.0 .... .. 3,131.. ..
24 92 883.0 8.4 22.2
3.97 .. 1.06
St. Vincent & Grenadines

Economic and social contextPopulation (millions)Labor force (millions)Unemployment rate (% of labor force)GNI per capita, World Bank Atlas method ($)GDP growth, 1995–2000 and 2000–06 (average annual %)Agriculture value added (% of GDP)Industry value added (% of GDP)
Manufacturing value added (% of GDP)Services value added (% of GDP)Inflation (annual % change in consumer price index)Exchange rate (local currency units per $)Exports of goods and services (% of GDP)Imports of goods and services (% of GDP) Business environmentEase of doing business (ranking 1-178; 1=best)Time to start a business (days)Procedures to start a business (number)Firing cost (weeks of wages)Closing a business (years to resolve insolvency)Total tax rate (% of profit)Highest marginal tax rate, corporate (%)Business entry rate (new registrations as % of total)Enterprise surveys
Time dealing with gov’t officials (% of management time)Firms expected to give gifts in meetings w/tax officials (%)Firms using banks to finance investments (% of firms)Delay in obtaining an electrical connection (days)ISO certification ownership (% of firms)
Private sector investmentInvest. in infrastructure w/private participation ($ millions)Private foreign direct investment, net (% of GDP)Gross fixed capital formation (% of GDP)Gross fixed private capital formation (% of GDP) Finance and bankingGovernment cash surplus or deficit (% of GDP)Government debt (% of GDP)Deposit money banks’ assets (% of GDP)Total financial system deposits (% of GDP)Bank capital to asset ratio (%)Bank nonperforming loans to total gross loans ratio (%)Domestic credit to the private sector (% of GDP)Real interest rate (%)Interest rate spread (percentage points) Infrastructure Paved roads (% of total roads)Electric power consumption (kWh per capita)Power outages in a typical month (number)Fixed line and mobile subscribers (per 100 people)Internet users (per 100 people)Cost of telephone call to U.S. ($ per 3 minutes)
196 2008 The Little Data Book on Private Sector Development
33.3 37.7 2,420
9.1 10.7 995.. .. ..
310 800 6496.2 7.0 6.5
41.7 32.3 20.421.5 28.5 27.78.6 6.2 15.8
36.8 39.2 51.96.9 7.22.6 2.2
15.3 16.1 26.717.7 26.7 30.1
.. 143.. 39 54.. 10 10.. 118.0 62.6.. .. 3.8.. 31.6 67.4.. .... .. 6.4 .. .... .... .... .... ..
12 736 29,7853.2 9.4 2.6
12.1 20.4 26.79.7 14.1 19.6
–0.4 .. –2.68.7 .. ..2.1 13.3 50.55.3 14.3 44.6
.. .. ..
.. .. ..2.2 12.7 38.3
.. ..
.. .. 11.3
36.3 .. ..62 94 391
.. ..1 14 17
0.1 9.3 4.242.02 .. 1.99
Country dataLow-
income group
2000 2006 2006
Sub-Saharan Africa Low income
Sudan

Economic and social contextPopulation (millions)Labor force (millions)Unemployment rate (% of labor force)GNI per capita, World Bank Atlas method ($)GDP growth, 1995–2000 and 2000–06 (average annual %)Agriculture value added (% of GDP)Industry value added (% of GDP)
Manufacturing value added (% of GDP)Services value added (% of GDP)Inflation (annual % change in consumer price index)Exchange rate (local currency units per $)Exports of goods and services (% of GDP)Imports of goods and services (% of GDP) Business environmentEase of doing business (ranking 1-178; 1=best)Time to start a business (days)Procedures to start a business (number)Firing cost (weeks of wages)Closing a business (years to resolve insolvency)Total tax rate (% of profit)Highest marginal tax rate, corporate (%)Business entry rate (new registrations as % of total)Enterprise surveys
Time dealing with gov’t officials (% of management time)Firms expected to give gifts in meetings w/tax officials (%)Firms using banks to finance investments (% of firms)Delay in obtaining an electrical connection (days)ISO certification ownership (% of firms)
Private sector investmentInvest. in infrastructure w/private participation ($ millions)Private foreign direct investment, net (% of GDP)Gross fixed capital formation (% of GDP)Gross fixed private capital formation (% of GDP) Finance and bankingGovernment cash surplus or deficit (% of GDP)Government debt (% of GDP)Deposit money banks’ assets (% of GDP)Total financial system deposits (% of GDP)Bank capital to asset ratio (%)Bank nonperforming loans to total gross loans ratio (%)Domestic credit to the private sector (% of GDP)Real interest rate (%)Interest rate spread (percentage points) Infrastructure Paved roads (% of total roads)Electric power consumption (kWh per capita)Power outages in a typical month (number)Fixed line and mobile subscribers (per 100 people)Internet users (per 100 people)Cost of telephone call to U.S. ($ per 3 minutes)
197The Little Data Book on Private Sector Development 2008
Latin America & Caribbean Lower middle income
Country data
Lower middle-income group
2000 2006 2006
0.44 0.46 2,2760.14 0.16 1,20913.8 .. 5.7
2,060 4,210 2,0381.7 6.0 7.6
11.2 5.2 11.925.2 35.7 43.5
9.0 14.2 26.763.7 59.1 44.659.4 11.3
1.3 2.719.7 30.7 40.433.2 45.6 36.4
.. 142.. 694 53.. 13 10.. 26.0 50.2.. 5.0 3.3.. 27.9 45.8.. .... .. 7.6 .. .... .... .... .... .. .. .. 38,154.. .. 3.0
12.4 25.1 33.59.8 19.8 10.9
.. .. –0.9.. .. ..
12.3 26.5 87.817.6 48.2 43.1
.. .. 10.7
.. .. 4.08.4 20.8 81.3
–16.7 2.313.5 9.0 7.2
26.0 26.3 65.8.. .. 1,502.. ..
27 88 602.7 7.1 11.4
2.29 1.33 2.08
Suriname

Economic and social contextPopulation (millions)Labor force (millions)Unemployment rate (% of labor force)GNI per capita, World Bank Atlas method ($)GDP growth, 1995–2000 and 2000–06 (average annual %)Agriculture value added (% of GDP)Industry value added (% of GDP)
Manufacturing value added (% of GDP)Services value added (% of GDP)Inflation (annual % change in consumer price index)Exchange rate (local currency units per $)Exports of goods and services (% of GDP)Imports of goods and services (% of GDP) Business environmentEase of doing business (ranking 1-178; 1=best)Time to start a business (days)Procedures to start a business (number)Firing cost (weeks of wages)Closing a business (years to resolve insolvency)Total tax rate (% of profit)Highest marginal tax rate, corporate (%)Business entry rate (new registrations as % of total)Enterprise surveys
Time dealing with gov’t officials (% of management time)Firms expected to give gifts in meetings w/tax officials (%)Firms using banks to finance investments (% of firms)Delay in obtaining an electrical connection (days)ISO certification ownership (% of firms)
Private sector investmentInvest. in infrastructure w/private participation ($ millions)Private foreign direct investment, net (% of GDP)Gross fixed capital formation (% of GDP)Gross fixed private capital formation (% of GDP) Finance and bankingGovernment cash surplus or deficit (% of GDP)Government debt (% of GDP)Deposit money banks’ assets (% of GDP)Total financial system deposits (% of GDP)Bank capital to asset ratio (%)Bank nonperforming loans to total gross loans ratio (%)Domestic credit to the private sector (% of GDP)Real interest rate (%)Interest rate spread (percentage points) Infrastructure Paved roads (% of total roads)Electric power consumption (kWh per capita)Power outages in a typical month (number)Fixed line and mobile subscribers (per 100 people)Internet users (per 100 people)Cost of telephone call to U.S. ($ per 3 minutes)
198 2008 The Little Data Book on Private Sector Development
1.0 1.1 2,276
0.32 0.36 1,20925.2 .. 5.7
1,370 2,400 2,0383.4 2.4 7.6
15.5 10.9 11.944.8 45.6 43.535.8 36.8 26.739.7 43.5 44.612.2 5.3
6.9 6.881.6 81.2 40.497.2 86.3 36.4
.. 95.. 61 53.. 13 10.. 53.0 50.2.. 2.0 3.3.. 36.6 45.8
30 30.. .. 7.6 .. 4.4.. 3.3.. 7.7.. 16.9.. 22.1 5 3 38,154
6.6 1.4 3.018.6 17.2 33.512.3 9.4 10.9
.. –2.6 –0.9.. .. ..
13.2 22.6 87.819.6 19.5 43.1
.. .. 10.7
.. 2.0 4.013.7 23.7 81.31.5 5.27.5 6.2 7.2
30.0 .. 65.8.. .. 1,502.. 2.56 26 60
1.0 3.7 11.43.68 2.97 2.08
Country data
Lower middle-income group
2000 2006 2006
Sub-Saharan Africa Lower middle income
Swaziland

Economic and social contextPopulation (millions)Labor force (millions)Unemployment rate (% of labor force)GNI per capita, World Bank Atlas method ($)GDP growth, 1995–2000 and 2000–06 (average annual %)Agriculture value added (% of GDP)Industry value added (% of GDP)
Manufacturing value added (% of GDP)Services value added (% of GDP)Inflation (annual % change in consumer price index)Exchange rate (local currency units per $)Exports of goods and services (% of GDP)Imports of goods and services (% of GDP) Business environmentEase of doing business (ranking 1-178; 1=best)Time to start a business (days)Procedures to start a business (number)Firing cost (weeks of wages)Closing a business (years to resolve insolvency)Total tax rate (% of profit)Highest marginal tax rate, corporate (%)Business entry rate (new registrations as % of total)Enterprise surveys
Time dealing with gov’t officials (% of management time)Firms expected to give gifts in meetings w/tax officials (%)Firms using banks to finance investments (% of firms)Delay in obtaining an electrical connection (days)ISO certification ownership (% of firms)
Private sector investmentInvest. in infrastructure w/private participation ($ millions)Private foreign direct investment, net (% of GDP)Gross fixed capital formation (% of GDP)Gross fixed private capital formation (% of GDP) Finance and bankingGovernment cash surplus or deficit (% of GDP)Government debt (% of GDP)Deposit money banks’ assets (% of GDP)Total financial system deposits (% of GDP)Bank capital to asset ratio (%)Bank nonperforming loans to total gross loans ratio (%)Domestic credit to the private sector (% of GDP)Real interest rate (%)Interest rate spread (percentage points) Infrastructure Paved roads (% of total roads)Electric power consumption (kWh per capita)Power outages in a typical month (number)Fixed line and mobile subscribers (per 100 people)Internet users (per 100 people)Cost of telephone call to U.S. ($ per 3 minutes)
199The Little Data Book on Private Sector Development 2008
High income
Country dataHigh-
income group
2000 2006 2006
8.9 9.1 1,0314.6 4.7 5045.8 7.7 6.2
28,870 43,530 36,6083.3 2.7 2.31.9 1.4 1.5
28.6 29.0 26.222.0 19.7 16.869.5 69.6 72.3
0.9 1.49.2 7.4
45.9 51.3 25.640.0 43.2 26.3
.. 14.. 15 22.. 3 7.. 26.0 34.9.. 2.0 2.0.. 54.5 41.5
28 285.8 7.2 10.1
.. .... .... .... .... .. .. .. 849
9.1 7.1 2.717.5 17.9 20.4
.. .. ..
3.2 1.9 –1.361.9 48.5 47.646.4 117.9 99.7
0.1 46.4 ..6.5 4.9 6.21.6 0.5 1.1
43.2 117.3 162.04.4 2.13.7 2.5 4.4
77.5 31.5 90.915,687 15,440 9,760
.. ..137 165 143
45.6 76.9 59.30.36 0.41 0.77
Sweden

Economic and social contextPopulation (millions)Labor force (millions)Unemployment rate (% of labor force)GNI per capita, World Bank Atlas method ($)GDP growth, 1995–2000 and 2000–06 (average annual %)Agriculture value added (% of GDP)Industry value added (% of GDP)
Manufacturing value added (% of GDP)Services value added (% of GDP)Inflation (annual % change in consumer price index)Exchange rate (local currency units per $)Exports of goods and services (% of GDP)Imports of goods and services (% of GDP) Business environmentEase of doing business (ranking 1-178; 1=best)Time to start a business (days)Procedures to start a business (number)Firing cost (weeks of wages)Closing a business (years to resolve insolvency)Total tax rate (% of profit)Highest marginal tax rate, corporate (%)Business entry rate (new registrations as % of total)Enterprise surveys
Time dealing with gov’t officials (% of management time)Firms expected to give gifts in meetings w/tax officials (%)Firms using banks to finance investments (% of firms)Delay in obtaining an electrical connection (days)ISO certification ownership (% of firms)
Private sector investmentInvest. in infrastructure w/private participation ($ millions)Private foreign direct investment, net (% of GDP)Gross fixed capital formation (% of GDP)Gross fixed private capital formation (% of GDP) Finance and bankingGovernment cash surplus or deficit (% of GDP)Government debt (% of GDP)Deposit money banks’ assets (% of GDP)Total financial system deposits (% of GDP)Bank capital to asset ratio (%)Bank nonperforming loans to total gross loans ratio (%)Domestic credit to the private sector (% of GDP)Real interest rate (%)Interest rate spread (percentage points) Infrastructure Paved roads (% of total roads)Electric power consumption (kWh per capita)Power outages in a typical month (number)Fixed line and mobile subscribers (per 100 people)Internet users (per 100 people)Cost of telephone call to U.S. ($ per 3 minutes)
200 2008 The Little Data Book on Private Sector Development
7.2 7.5 1,0314.0 4.2 5042.7 4.4 6.2
40,110 58,050 36,6082.0 1.3 2.31.7 1.3 1.5
28.7 28.4 26.220.2 19.8 16.869.6 70.3 72.3
1.5 1.11.7 1.3
45.7 47.9 25.640.0 41.1 26.3
.. 16.. 20 22.. 6 7.. 13.0 34.9.. 3.0 2.0.. 29.1 41.5
45 913.1 6.4 10.1
.. .... .... .... .... .. .. .. 849
8.0 7.1 2.722.8 21.4 20.4
.. .. ..
2.2 –0.4 –1.326.0 28.6 47.6
172.9 175.7 99.7129.4 137.0 ..
6.0 4.9 6.24.1 0.3 1.1
161.0 174.3 162.03.5 1.61.3 1.6 4.4
.. 100.0 90.9
7,847 8,305 9,760.. ..
137 166 14329.2 58.2 59.30.21 0.32 0.77
Country dataHigh-
income group
2000 2006 2006
High income
Switzerland

Economic and social contextPopulation (millions)Labor force (millions)Unemployment rate (% of labor force)GNI per capita, World Bank Atlas method ($)GDP growth, 1995–2000 and 2000–06 (average annual %)Agriculture value added (% of GDP)Industry value added (% of GDP)
Manufacturing value added (% of GDP)Services value added (% of GDP)Inflation (annual % change in consumer price index)Exchange rate (local currency units per $)Exports of goods and services (% of GDP)Imports of goods and services (% of GDP) Business environmentEase of doing business (ranking 1-178; 1=best)Time to start a business (days)Procedures to start a business (number)Firing cost (weeks of wages)Closing a business (years to resolve insolvency)Total tax rate (% of profit)Highest marginal tax rate, corporate (%)Business entry rate (new registrations as % of total)Enterprise surveys
Time dealing with gov’t officials (% of management time)Firms expected to give gifts in meetings w/tax officials (%)Firms using banks to finance investments (% of firms)Delay in obtaining an electrical connection (days)ISO certification ownership (% of firms)
Private sector investmentInvest. in infrastructure w/private participation ($ millions)Private foreign direct investment, net (% of GDP)Gross fixed capital formation (% of GDP)Gross fixed private capital formation (% of GDP) Finance and bankingGovernment cash surplus or deficit (% of GDP)Government debt (% of GDP)Deposit money banks’ assets (% of GDP)Total financial system deposits (% of GDP)Bank capital to asset ratio (%)Bank nonperforming loans to total gross loans ratio (%)Domestic credit to the private sector (% of GDP)Real interest rate (%)Interest rate spread (percentage points) Infrastructure Paved roads (% of total roads)Electric power consumption (kWh per capita)Power outages in a typical month (number)Fixed line and mobile subscribers (per 100 people)Internet users (per 100 people)Cost of telephone call to U.S. ($ per 3 minutes)
201The Little Data Book on Private Sector Development 2008
Middle East & North Africa Lower middle income
Country data
Lower middle-income group
2000 2006 2006
16.5 19.4 2,2765.9 7.9 1,209
11.6 12.3 5.7960 1,560 2,0382.2 4.2 7.6
23.8 18.3 11.937.9 32.2 43.56.5 7.1 26.7
38.3 49.5 44.6–3.8 10.011.2 11.235.4 39.4 40.428.6 35.6 36.4
.. 137.. 43 53.. 13 10.. 80.0 50.2.. 4.1 3.3.. 46.7 45.8.. ..
9.2 9.5 7.6 .. 10.3.. 68.8.. 2.9.. 61.8.. 7.4
161 82 38,1541.4 1.8 3.0
17.3 21.4 33.56.3 11.4 10.9
.. .. –0.9.. .. ..
33.6 32.5 87.832.6 42.3 43.1
.. .. 10.7
.. .. 4.08.3 14.9 81.3
–0.6 –4.45.0 7.0 7.2
20.1 20.1 65.81,058 1,411 1,502
.. ..10 41 60
0.2 7.7 11.44.81 .. 2.08
Syrian Arab Republic

Economic and social contextPopulation (millions)Labor force (millions)Unemployment rate (% of labor force)GNI per capita, World Bank Atlas method ($)GDP growth, 1995–2000 and 2000–06 (average annual %)Agriculture value added (% of GDP)Industry value added (% of GDP)
Manufacturing value added (% of GDP)Services value added (% of GDP)Inflation (annual % change in consumer price index)Exchange rate (local currency units per $)Exports of goods and services (% of GDP)Imports of goods and services (% of GDP) Business environmentEase of doing business (ranking 1-178; 1=best)Time to start a business (days)Procedures to start a business (number)Firing cost (weeks of wages)Closing a business (years to resolve insolvency)Total tax rate (% of profit)Highest marginal tax rate, corporate (%)Business entry rate (new registrations as % of total)Enterprise surveys
Time dealing with gov’t officials (% of management time)Firms expected to give gifts in meetings w/tax officials (%)Firms using banks to finance investments (% of firms)Delay in obtaining an electrical connection (days)ISO certification ownership (% of firms)
Private sector investmentInvest. in infrastructure w/private participation ($ millions)Private foreign direct investment, net (% of GDP)Gross fixed capital formation (% of GDP)Gross fixed private capital formation (% of GDP) Finance and bankingGovernment cash surplus or deficit (% of GDP)Government debt (% of GDP)Deposit money banks’ assets (% of GDP)Total financial system deposits (% of GDP)Bank capital to asset ratio (%)Bank nonperforming loans to total gross loans ratio (%)Domestic credit to the private sector (% of GDP)Real interest rate (%)Interest rate spread (percentage points) Infrastructure Paved roads (% of total roads)Electric power consumption (kWh per capita)Power outages in a typical month (number)Fixed line and mobile subscribers (per 100 people)Internet users (per 100 people)Cost of telephone call to U.S. ($ per 3 minutes)
202 2008 The Little Data Book on Private Sector Development
6.2 6.6 2,4202.0 2.2 995
.. .. ..180 390 6491.1 9.1 6.5
27.4 24.8 20.438.9 27.4 27.733.7 19.3 15.833.7 47.8 51.9
.. ..2.1 3.3
86.7 23.2 26.788.6 57.5 30.1
.. 153.. 49 54.. 13 10.. 22.0 62.6.. 3.0 3.8.. 82.2 67.4.. .... .. 6.4 .. 3.3
82.4 67.52.3 1.0
12.7 5.4.. 6.5 9 .. 29,785
2.4 12.0 2.69.5 13.1 26.72.8 6.1 19.6
–0.8 –6.6 –2.6114.1 .. ..
.. .. 50.5
.. .. 44.6
.. .. ..
.. .. ..13.8 16.0 38.3
2.4 3.424.3 15.3 11.3
.. .. ..
2,177 2,267 391.. ..4 8 17
0.0 0.3 4.28.10 7.84 1.99
Country dataLow-
income group
2000 2006 2006
Europe & Central Asia Low income
Tajikistan

Economic and social contextPopulation (millions)Labor force (millions)Unemployment rate (% of labor force)GNI per capita, World Bank Atlas method ($)GDP growth, 1995–2000 and 2000–06 (average annual %)Agriculture value added (% of GDP)Industry value added (% of GDP)
Manufacturing value added (% of GDP)Services value added (% of GDP)Inflation (annual % change in consumer price index)Exchange rate (local currency units per $)Exports of goods and services (% of GDP)Imports of goods and services (% of GDP) Business environmentEase of doing business (ranking 1-178; 1=best)Time to start a business (days)Procedures to start a business (number)Firing cost (weeks of wages)Closing a business (years to resolve insolvency)Total tax rate (% of profit)Highest marginal tax rate, corporate (%)Business entry rate (new registrations as % of total)Enterprise surveys
Time dealing with gov’t officials (% of management time)Firms expected to give gifts in meetings w/tax officials (%)Firms using banks to finance investments (% of firms)Delay in obtaining an electrical connection (days)ISO certification ownership (% of firms)
Private sector investmentInvest. in infrastructure w/private participation ($ millions)Private foreign direct investment, net (% of GDP)Gross fixed capital formation (% of GDP)Gross fixed private capital formation (% of GDP) Finance and bankingGovernment cash surplus or deficit (% of GDP)Government debt (% of GDP)Deposit money banks’ assets (% of GDP)Total financial system deposits (% of GDP)Bank capital to asset ratio (%)Bank nonperforming loans to total gross loans ratio (%)Domestic credit to the private sector (% of GDP)Real interest rate (%)Interest rate spread (percentage points) Infrastructure Paved roads (% of total roads)Electric power consumption (kWh per capita)Power outages in a typical month (number)Fixed line and mobile subscribers (per 100 people)Internet users (per 100 people)Cost of telephone call to U.S. ($ per 3 minutes)
203The Little Data Book on Private Sector Development 2008
Sub-Saharan Africa Low income
Country dataLow-
income group
2000 2006 2006
33.8 39.5 2,42016.7 19.3 9955.1 .. ..
270 350 6493.9 6.5 6.5
45.0 45.3 20.415.7 17.4 27.7
7.5 6.9 15.839.2 37.3 51.9
5.9 6.4800.4 1,251.9
16.8 24.3 26.724.2 30.8 30.1
.. 130.. 29 54.. 12 10.. 32.0 62.6.. 3.0 3.8.. 44.3 67.4
30 30.. 6.6 6.4 .. 4.0.. 14.7.. 6.8.. 44.3.. 14.7
61 98 29,7855.1 3.7 2.6
17.4 18.4 26.711.4 11.0 19.6
.. .. –2.6.. .. .... .. 50.5.. .. 44.6.. .. .... .. ..
4.6 12.2 38.313.1 8.614.2 8.8 11.3
4.2 8.6 ..58 61 391
.. 12.01 15 17
0.1 1.0 4.210.70 3.17 1.99
Tanzania

Economic and social contextPopulation (millions)Labor force (millions)Unemployment rate (% of labor force)GNI per capita, World Bank Atlas method ($)GDP growth, 1995–2000 and 2000–06 (average annual %)Agriculture value added (% of GDP)Industry value added (% of GDP)
Manufacturing value added (% of GDP)Services value added (% of GDP)Inflation (annual % change in consumer price index)Exchange rate (local currency units per $)Exports of goods and services (% of GDP)Imports of goods and services (% of GDP) Business environmentEase of doing business (ranking 1-178; 1=best)Time to start a business (days)Procedures to start a business (number)Firing cost (weeks of wages)Closing a business (years to resolve insolvency)Total tax rate (% of profit)Highest marginal tax rate, corporate (%)Business entry rate (new registrations as % of total)Enterprise surveys
Time dealing with gov’t officials (% of management time)Firms expected to give gifts in meetings w/tax officials (%)Firms using banks to finance investments (% of firms)Delay in obtaining an electrical connection (days)ISO certification ownership (% of firms)
Private sector investmentInvest. in infrastructure w/private participation ($ millions)Private foreign direct investment, net (% of GDP)Gross fixed capital formation (% of GDP)Gross fixed private capital formation (% of GDP) Finance and bankingGovernment cash surplus or deficit (% of GDP)Government debt (% of GDP)Deposit money banks’ assets (% of GDP)Total financial system deposits (% of GDP)Bank capital to asset ratio (%)Bank nonperforming loans to total gross loans ratio (%)Domestic credit to the private sector (% of GDP)Real interest rate (%)Interest rate spread (percentage points) Infrastructure Paved roads (% of total roads)Electric power consumption (kWh per capita)Power outages in a typical month (number)Fixed line and mobile subscribers (per 100 people)Internet users (per 100 people)Cost of telephone call to U.S. ($ per 3 minutes)
204 2008 The Little Data Book on Private Sector Development
60.7 63.4 2,27634.1 36.5 1,209
2.4 1.3 5.72,010 3,050 2,038
–0.7 5.4 7.69.0 10.7 11.9
42.0 44.6 43.533.6 35.0 26.749.0 44.7 44.6
1.6 4.640.1 37.966.8 73.7 40.458.1 69.8 36.4
.. 15.. 33 53.. 8 10.. 54.0 50.2.. 2.7 3.3.. 37.7 45.8
30 30.. .. 7.6 .. 1.3.. .... 74.7.. 24.2.. 44.6
1,377 1,149 38,1542.7 4.4 3.0
22.0 28.6 33.513.8 21.4 10.9
.. 1.9 –0.9.. 26.2 ..
131.6 99.2 87.8103.3 94.1 43.1
7.5 9.2 10.717.7 7.5 4.0
108.3 88.0 81.36.4 2.24.5 2.9 7.2
98.5 .. 65.81,503 1,988 1,502
.. ..14 75 60
3.8 13.3 11.42.19 0.67 2.08
Country data
Lower middle-income group
2000 2006 2006
East Asia & Pacific Lower middle income
Thailand

Economic and social contextPopulation (millions)Labor force (millions)Unemployment rate (% of labor force)GNI per capita, World Bank Atlas method ($)GDP growth, 1995–2000 and 2000–06 (average annual %)Agriculture value added (% of GDP)Industry value added (% of GDP)
Manufacturing value added (% of GDP)Services value added (% of GDP)Inflation (annual % change in consumer price index)Exchange rate (local currency units per $)Exports of goods and services (% of GDP)Imports of goods and services (% of GDP) Business environmentEase of doing business (ranking 1-178; 1=best)Time to start a business (days)Procedures to start a business (number)Firing cost (weeks of wages)Closing a business (years to resolve insolvency)Total tax rate (% of profit)Highest marginal tax rate, corporate (%)Business entry rate (new registrations as % of total)Enterprise surveys
Time dealing with gov’t officials (% of management time)Firms expected to give gifts in meetings w/tax officials (%)Firms using banks to finance investments (% of firms)Delay in obtaining an electrical connection (days)ISO certification ownership (% of firms)
Private sector investmentInvest. in infrastructure w/private participation ($ millions)Private foreign direct investment, net (% of GDP)Gross fixed capital formation (% of GDP)Gross fixed private capital formation (% of GDP) Finance and bankingGovernment cash surplus or deficit (% of GDP)Government debt (% of GDP)Deposit money banks’ assets (% of GDP)Total financial system deposits (% of GDP)Bank capital to asset ratio (%)Bank nonperforming loans to total gross loans ratio (%)Domestic credit to the private sector (% of GDP)Real interest rate (%)Interest rate spread (percentage points) Infrastructure Paved roads (% of total roads)Electric power consumption (kWh per capita)Power outages in a typical month (number)Fixed line and mobile subscribers (per 100 people)Internet users (per 100 people)Cost of telephone call to U.S. ($ per 3 minutes)
205The Little Data Book on Private Sector Development 2008
East Asia & Pacific Low income
Country dataLow-
income group
2000 2006 2006
0.78 1.0 2,4200.26 0.40 995
.. .. ..420 840 649
.. –0.7 6.525.8 32.2 20.418.5 12.8 27.7
2.8 2.6 15.855.7 55.0 51.9
.. ..180.1 ..
.. .. 26.7
.. .. 30.1 .. 168.. 82 54.. 9 10.. 17.0 62.6.. .. 3.8.. 28.3 67.4.. .... .. 6.4 .. .... .... .... .... .. .. .. 29,785.. .. 2.6
21.8 17.1 26.77.7 2.1 19.6
.. .. –2.6.. .. .... .. 50.5.. .. 44.6.. .. .... .. .... .. 38.3.. .... .. 11.3 .. .. .... .. 391.. .... .. 17.. .. 4.2.. .. 1.99
Timor-Leste

Economic and social contextPopulation (millions)Labor force (millions)Unemployment rate (% of labor force)GNI per capita, World Bank Atlas method ($)GDP growth, 1995–2000 and 2000–06 (average annual %)Agriculture value added (% of GDP)Industry value added (% of GDP)
Manufacturing value added (% of GDP)Services value added (% of GDP)Inflation (annual % change in consumer price index)Exchange rate (local currency units per $)Exports of goods and services (% of GDP)Imports of goods and services (% of GDP) Business environmentEase of doing business (ranking 1-178; 1=best)Time to start a business (days)Procedures to start a business (number)Firing cost (weeks of wages)Closing a business (years to resolve insolvency)Total tax rate (% of profit)Highest marginal tax rate, corporate (%)Business entry rate (new registrations as % of total)Enterprise surveys
Time dealing with gov’t officials (% of management time)Firms expected to give gifts in meetings w/tax officials (%)Firms using banks to finance investments (% of firms)Delay in obtaining an electrical connection (days)ISO certification ownership (% of firms)
Private sector investmentInvest. in infrastructure w/private participation ($ millions)Private foreign direct investment, net (% of GDP)Gross fixed capital formation (% of GDP)Gross fixed private capital formation (% of GDP) Finance and bankingGovernment cash surplus or deficit (% of GDP)Government debt (% of GDP)Deposit money banks’ assets (% of GDP)Total financial system deposits (% of GDP)Bank capital to asset ratio (%)Bank nonperforming loans to total gross loans ratio (%)Domestic credit to the private sector (% of GDP)Real interest rate (%)Interest rate spread (percentage points) Infrastructure Paved roads (% of total roads)Electric power consumption (kWh per capita)Power outages in a typical month (number)Fixed line and mobile subscribers (per 100 people)Internet users (per 100 people)Cost of telephone call to U.S. ($ per 3 minutes)
206 2008 The Little Data Book on Private Sector Development
5.4 6.4 2,4202.1 2.5 995
.. .. ..270 350 6494.2 2.6 6.5
34.2 43.6 20.417.8 24.0 27.78.4 10.1 15.8
47.9 32.4 51.91.9 2.2
712.0 522.930.7 35.2 26.750.7 48.6 30.1
.. 156.. 53 54.. 13 10.. 36.0 62.6.. 3.0 3.8.. 48.2 67.4.. .... .. 6.4 .. .... .... .... .... ..
68 590 29,7853.2 2.6 2.6
17.8 22.2 26.714.8 18.1 19.6
.. –0.1 –2.6.. .. ..
17.0 19.8 50.514.8 23.4 44.6
.. .. ..
.. .. ..15.6 16.9 38.3
.. ..
.. .. 11.3
31.6 .. ..86 94 391
.. ..2 12 17
1.9 5.0 4.27.90 3.98 1.99
Country dataLow-
income group
2000 2006 2006
Sub-Saharan Africa Low income
Togo

Economic and social contextPopulation (millions)Labor force (millions)Unemployment rate (% of labor force)GNI per capita, World Bank Atlas method ($)GDP growth, 1995–2000 and 2000–06 (average annual %)Agriculture value added (% of GDP)Industry value added (% of GDP)
Manufacturing value added (% of GDP)Services value added (% of GDP)Inflation (annual % change in consumer price index)Exchange rate (local currency units per $)Exports of goods and services (% of GDP)Imports of goods and services (% of GDP) Business environmentEase of doing business (ranking 1-178; 1=best)Time to start a business (days)Procedures to start a business (number)Firing cost (weeks of wages)Closing a business (years to resolve insolvency)Total tax rate (% of profit)Highest marginal tax rate, corporate (%)Business entry rate (new registrations as % of total)Enterprise surveys
Time dealing with gov’t officials (% of management time)Firms expected to give gifts in meetings w/tax officials (%)Firms using banks to finance investments (% of firms)Delay in obtaining an electrical connection (days)ISO certification ownership (% of firms)
Private sector investmentInvest. in infrastructure w/private participation ($ millions)Private foreign direct investment, net (% of GDP)Gross fixed capital formation (% of GDP)Gross fixed private capital formation (% of GDP) Finance and bankingGovernment cash surplus or deficit (% of GDP)Government debt (% of GDP)Deposit money banks’ assets (% of GDP)Total financial system deposits (% of GDP)Bank capital to asset ratio (%)Bank nonperforming loans to total gross loans ratio (%)Domestic credit to the private sector (% of GDP)Real interest rate (%)Interest rate spread (percentage points) Infrastructure Paved roads (% of total roads)Electric power consumption (kWh per capita)Power outages in a typical month (number)Fixed line and mobile subscribers (per 100 people)Internet users (per 100 people)Cost of telephone call to U.S. ($ per 3 minutes)
207The Little Data Book on Private Sector Development 2008
East Asia & Pacific Lower middle income
Country data
Lower middle-income group
2000 2006 2006
0.10 0.10 2,2760.04 0.04 1,209
.. .. 5.71,600 2,250 2,038
1.4 2.4 7.629.7 28.5 11.917.2 15.3 43.55.4 4.8 26.7
53.1 56.2 44.66.3 6.41.8 2.08.2 10.4 40.4
37.1 43.9 36.4 .. 47.. 32 53.. 4 10.. .. 50.2.. 2.7 3.3.. 25.0 45.8.. .... .. 7.6 .. .... .... .... .... .. 7 10 38,154
3.2 –0.7 3.018.5 16.7 33.5
.. .. 10.9 .. .. –0.9.. .. ..
55.1 58.9 87.840.3 45.9 43.1
.. .. 10.7
.. .. 4.052.5 62.5 81.311.1 4.76.0 5.5 7.2
27.0 .. 65.8.. .. 1,502.. ..
10 44 602.4 3.1 11.4
4.09 .. 2.08
Tonga

Economic and social contextPopulation (millions)Labor force (millions)Unemployment rate (% of labor force)GNI per capita, World Bank Atlas method ($)GDP growth, 1995–2000 and 2000–06 (average annual %)Agriculture value added (% of GDP)Industry value added (% of GDP)
Manufacturing value added (% of GDP)Services value added (% of GDP)Inflation (annual % change in consumer price index)Exchange rate (local currency units per $)Exports of goods and services (% of GDP)Imports of goods and services (% of GDP) Business environmentEase of doing business (ranking 1-178; 1=best)Time to start a business (days)Procedures to start a business (number)Firing cost (weeks of wages)Closing a business (years to resolve insolvency)Total tax rate (% of profit)Highest marginal tax rate, corporate (%)Business entry rate (new registrations as % of total)Enterprise surveys
Time dealing with gov’t officials (% of management time)Firms expected to give gifts in meetings w/tax officials (%)Firms using banks to finance investments (% of firms)Delay in obtaining an electrical connection (days)ISO certification ownership (% of firms)
Private sector investmentInvest. in infrastructure w/private participation ($ millions)Private foreign direct investment, net (% of GDP)Gross fixed capital formation (% of GDP)Gross fixed private capital formation (% of GDP) Finance and bankingGovernment cash surplus or deficit (% of GDP)Government debt (% of GDP)Deposit money banks’ assets (% of GDP)Total financial system deposits (% of GDP)Bank capital to asset ratio (%)Bank nonperforming loans to total gross loans ratio (%)Domestic credit to the private sector (% of GDP)Real interest rate (%)Interest rate spread (percentage points) Infrastructure Paved roads (% of total roads)Electric power consumption (kWh per capita)Power outages in a typical month (number)Fixed line and mobile subscribers (per 100 people)Internet users (per 100 people)Cost of telephone call to U.S. ($ per 3 minutes)
208 2008 The Little Data Book on Private Sector Development
1.3 1.3 1,031
0.59 0.64 50412.1 8.0 6.2
5,170 12,500 36,6085.0 9.5 2.31.4 0.6 1.5
49.5 61.7 26.27.3 5.8 16.8
49.1 37.7 72.33.6 8.36.3 6.3
59.1 64.5 25.645.5 43.5 26.3
.. 67.. 43 22.. 9 7.. 67.0 34.9.. .. 2.0.. 33.1 41.5
35 25.. .. 10.1 .. .... .... .... .... ..
120 229 8498.3 6.2 2.7
20.0 15.5 20.414.3 19.4 ..
2.0 6.1 –1.3.. .. 47.6
35.4 32.7 99.748.1 39.1 ..
.. .. 6.2
.. .. 1.141.0 34.3 162.03.2 3.18.3 6.1 4.4
51.1 .. 90.93,891 5,038 9,760
.. ..37 149 1437.7 12.3 59.3
2.47 2.19 0.77
Country dataHigh-
income group
2000 2006 2006
High income
Trinidad and Tobago

Economic and social contextPopulation (millions)Labor force (millions)Unemployment rate (% of labor force)GNI per capita, World Bank Atlas method ($)GDP growth, 1995–2000 and 2000–06 (average annual %)Agriculture value added (% of GDP)Industry value added (% of GDP)
Manufacturing value added (% of GDP)Services value added (% of GDP)Inflation (annual % change in consumer price index)Exchange rate (local currency units per $)Exports of goods and services (% of GDP)Imports of goods and services (% of GDP) Business environmentEase of doing business (ranking 1-178; 1=best)Time to start a business (days)Procedures to start a business (number)Firing cost (weeks of wages)Closing a business (years to resolve insolvency)Total tax rate (% of profit)Highest marginal tax rate, corporate (%)Business entry rate (new registrations as % of total)Enterprise surveys
Time dealing with gov’t officials (% of management time)Firms expected to give gifts in meetings w/tax officials (%)Firms using banks to finance investments (% of firms)Delay in obtaining an electrical connection (days)ISO certification ownership (% of firms)
Private sector investmentInvest. in infrastructure w/private participation ($ millions)Private foreign direct investment, net (% of GDP)Gross fixed capital formation (% of GDP)Gross fixed private capital formation (% of GDP) Finance and bankingGovernment cash surplus or deficit (% of GDP)Government debt (% of GDP)Deposit money banks’ assets (% of GDP)Total financial system deposits (% of GDP)Bank capital to asset ratio (%)Bank nonperforming loans to total gross loans ratio (%)Domestic credit to the private sector (% of GDP)Real interest rate (%)Interest rate spread (percentage points) Infrastructure Paved roads (% of total roads)Electric power consumption (kWh per capita)Power outages in a typical month (number)Fixed line and mobile subscribers (per 100 people)Internet users (per 100 people)Cost of telephone call to U.S. ($ per 3 minutes)
209The Little Data Book on Private Sector Development 2008
Middle East & North Africa Lower middle income
Country data
Lower middle-income group
2000 2006 2006
9.6 10.1 2,2763.3 3.9 1,209
15.7 14.2 5.72,090 2,970 2,038
5.5 4.6 7.612.3 11.3 11.928.6 28.4 43.518.2 17.4 26.759.1 60.3 44.62.9 4.51.4 1.3
44.5 54.4 40.448.2 54.3 36.4
.. 88.. 11 53.. 10 10.. 17.0 50.2.. 1.3 3.3.. 61.0 45.8.. ..
11.4 10.2 7.6 .. .... .... .... .... ..
261 2,343 38,1543.9 10.8 3.0
26.0 23.2 33.513.7 .. 10.9
–2.7 –2.8 –0.962.6 55.1 ..57.8 65.1 87.845.3 49.0 43.1
7.5 7.7 10.721.6 19.2 4.066.3 65.0 81.3
.. ..
.. .. 7.2
68.4 65.8 65.8991 1,194 1,502
.. ..11 85 602.7 12.8 11.4
2.25 .. 2.08
Tunisia

Economic and social contextPopulation (millions)Labor force (millions)Unemployment rate (% of labor force)GNI per capita, World Bank Atlas method ($)GDP growth, 1995–2000 and 2000–06 (average annual %)Agriculture value added (% of GDP)Industry value added (% of GDP)
Manufacturing value added (% of GDP)Services value added (% of GDP)Inflation (annual % change in consumer price index)Exchange rate (local currency units per $)Exports of goods and services (% of GDP)Imports of goods and services (% of GDP) Business environmentEase of doing business (ranking 1-178; 1=best)Time to start a business (days)Procedures to start a business (number)Firing cost (weeks of wages)Closing a business (years to resolve insolvency)Total tax rate (% of profit)Highest marginal tax rate, corporate (%)Business entry rate (new registrations as % of total)Enterprise surveys
Time dealing with gov’t officials (% of management time)Firms expected to give gifts in meetings w/tax officials (%)Firms using banks to finance investments (% of firms)Delay in obtaining an electrical connection (days)ISO certification ownership (% of firms)
Private sector investmentInvest. in infrastructure w/private participation ($ millions)Private foreign direct investment, net (% of GDP)Gross fixed capital formation (% of GDP)Gross fixed private capital formation (% of GDP) Finance and bankingGovernment cash surplus or deficit (% of GDP)Government debt (% of GDP)Deposit money banks’ assets (% of GDP)Total financial system deposits (% of GDP)Bank capital to asset ratio (%)Bank nonperforming loans to total gross loans ratio (%)Domestic credit to the private sector (% of GDP)Real interest rate (%)Interest rate spread (percentage points) Infrastructure Paved roads (% of total roads)Electric power consumption (kWh per capita)Power outages in a typical month (number)Fixed line and mobile subscribers (per 100 people)Internet users (per 100 people)Cost of telephone call to U.S. ($ per 3 minutes)
210 2008 The Little Data Book on Private Sector Development
67.4 73.0 81123.7 27.4 3746.5 10.3 9.8
2,990 5,400 5,9133.4 5.6 3.9
14.7 9.7 5.724.3 26.8 32.420.0 22.2 19.461.0 63.5 62.054.9 10.5
0.6 1.424.0 28.2 32.731.5 35.9 30.3
.. 57.. 6 41.. 6 9.. 95.0 39.7.. 3.3 2.9.. 45.1 44.5
30 309.6 14.7 9.1
.. 10.8
43.7 20.16.0 7.54.6 6.1
.. 12.6
8,215 2,438 45,8690.5 5.0 3.5
22.4 21.0 19.916.4 16.7 ..
.. 2.5 .... 67.8 ..
32.6 42.2 52.928.5 34.3 41.4
6.1 11.3 9.89.2 3.2 3.2
24.6 34.1 41.4.. .... .. 5.9
34.0 .. ..1,550 1,898 3,131
.. ..51 98 883.7 16.8 22.2
3.30 2.40 1.06
Country data
Upper middle-income group
2000 2006 2006
Europe & Central Asia Upper middle income
Turkey

Economic and social contextPopulation (millions)Labor force (millions)Unemployment rate (% of labor force)GNI per capita, World Bank Atlas method ($)GDP growth, 1995–2000 and 2000–06 (average annual %)Agriculture value added (% of GDP)Industry value added (% of GDP)
Manufacturing value added (% of GDP)Services value added (% of GDP)Inflation (annual % change in consumer price index)Exchange rate (local currency units per $)Exports of goods and services (% of GDP)Imports of goods and services (% of GDP) Business environmentEase of doing business (ranking 1-178; 1=best)Time to start a business (days)Procedures to start a business (number)Firing cost (weeks of wages)Closing a business (years to resolve insolvency)Total tax rate (% of profit)Highest marginal tax rate, corporate (%)Business entry rate (new registrations as % of total)Enterprise surveys
Time dealing with gov’t officials (% of management time)Firms expected to give gifts in meetings w/tax officials (%)Firms using banks to finance investments (% of firms)Delay in obtaining an electrical connection (days)ISO certification ownership (% of firms)
Private sector investmentInvest. in infrastructure w/private participation ($ millions)Private foreign direct investment, net (% of GDP)Gross fixed capital formation (% of GDP)Gross fixed private capital formation (% of GDP) Finance and bankingGovernment cash surplus or deficit (% of GDP)Government debt (% of GDP)Deposit money banks’ assets (% of GDP)Total financial system deposits (% of GDP)Bank capital to asset ratio (%)Bank nonperforming loans to total gross loans ratio (%)Domestic credit to the private sector (% of GDP)Real interest rate (%)Interest rate spread (percentage points) Infrastructure Paved roads (% of total roads)Electric power consumption (kWh per capita)Power outages in a typical month (number)Fixed line and mobile subscribers (per 100 people)Internet users (per 100 people)Cost of telephone call to U.S. ($ per 3 minutes)
211The Little Data Book on Private Sector Development 2008
Europe & Central Asia Lower middle income
Country data
Lower middle-income group
2000 2006 2006
4.5 4.9 2,2761.9 2.3 1,209
.. .. 5.7650 .. 2,0384.0 .. 7.6
24.4 19.6 11.944.4 40.1 43.510.6 21.7 26.731.2 40.3 44.6
.. ..5,200.0 ..
95.5 72.2 40.480.9 54.1 36.4
.. .... .. 53.. .. 10.. .. 50.2.. .. 3.3.. .. 45.8.. .... .. 7.6 .. .... .... .... .... ..
20 16 38,1544.3 7.0 3.0
34.7 22.9 33.5.. .. 10.9 .. .. –0.9.. .. .... .. 87.8.. .. 43.1.. .. 10.7.. .. 4.0
2.0 .. 81.3.. .... .. 7.2
81.2 .. 65.81,698 1,731 1,502
.. ..8 10 60
0.1 1.3 11.4.. .. 2.08
Turkmenistan

Economic and social contextPopulation (millions)Labor force (millions)Unemployment rate (% of labor force)GNI per capita, World Bank Atlas method ($)GDP growth, 1995–2000 and 2000–06 (average annual %)Agriculture value added (% of GDP)Industry value added (% of GDP)
Manufacturing value added (% of GDP)Services value added (% of GDP)Inflation (annual % change in consumer price index)Exchange rate (local currency units per $)Exports of goods and services (% of GDP)Imports of goods and services (% of GDP) Business environmentEase of doing business (ranking 1-178; 1=best)Time to start a business (days)Procedures to start a business (number)Firing cost (weeks of wages)Closing a business (years to resolve insolvency)Total tax rate (% of profit)Highest marginal tax rate, corporate (%)Business entry rate (new registrations as % of total)Enterprise surveys
Time dealing with gov’t officials (% of management time)Firms expected to give gifts in meetings w/tax officials (%)Firms using banks to finance investments (% of firms)Delay in obtaining an electrical connection (days)ISO certification ownership (% of firms)
Private sector investmentInvest. in infrastructure w/private participation ($ millions)Private foreign direct investment, net (% of GDP)Gross fixed capital formation (% of GDP)Gross fixed private capital formation (% of GDP) Finance and bankingGovernment cash surplus or deficit (% of GDP)Government debt (% of GDP)Deposit money banks’ assets (% of GDP)Total financial system deposits (% of GDP)Bank capital to asset ratio (%)Bank nonperforming loans to total gross loans ratio (%)Domestic credit to the private sector (% of GDP)Real interest rate (%)Interest rate spread (percentage points) Infrastructure Paved roads (% of total roads)Electric power consumption (kWh per capita)Power outages in a typical month (number)Fixed line and mobile subscribers (per 100 people)Internet users (per 100 people)Cost of telephone call to U.S. ($ per 3 minutes)
212 2008 The Little Data Book on Private Sector Development
24.7 29.9 2,42010.5 12.6 995
.. 3.2 ..260 300 6496.4 5.6 6.5
37.3 32.3 20.420.3 18.4 27.7
9.8 9.1 15.842.4 49.2 51.92.8 6.8
1,644.5 1,831.511.2 14.9 26.723.0 29.5 30.1
.. 118.. 28 54.. 18 10.. 13.0 62.6.. 2.2 3.8.. 32.3 67.4
30 30.. 9.0 6.4 .. 5.2.. 14.5.. 7.7.. 33.0.. 15.5
57 416 29,7852.7 4.2 2.6
19.6 23.2 26.713.3 18.7 19.6
–2.0 –2.0 –2.644.9 .. ..
9.7 13.3 50.510.7 14.0 44.69.8 9.7 ..9.8 2.8 ..6.5 7.9 38.3
18.4 10.713.1 9.6 11.3
.. 23.0 .... .. 391.. 11.01 7 17
0.2 2.5 4.23.63 3.21 1.99
Country dataLow-
income group
2000 2006 2006
Sub-Saharan Africa Low income
Uganda
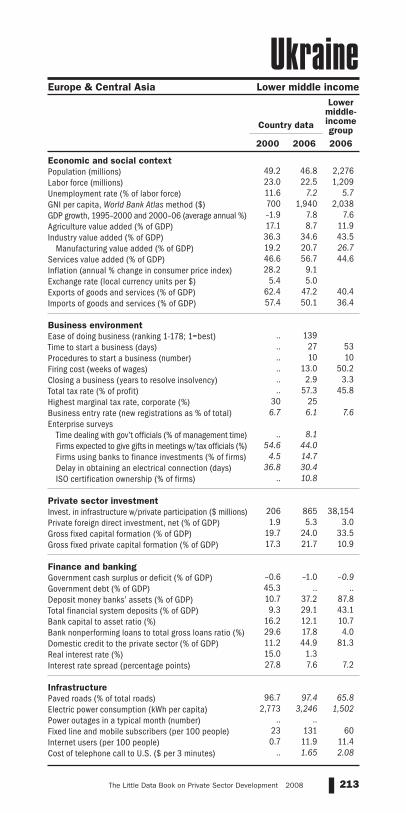
Economic and social contextPopulation (millions)Labor force (millions)Unemployment rate (% of labor force)GNI per capita, World Bank Atlas method ($)GDP growth, 1995–2000 and 2000–06 (average annual %)Agriculture value added (% of GDP)Industry value added (% of GDP)
Manufacturing value added (% of GDP)Services value added (% of GDP)Inflation (annual % change in consumer price index)Exchange rate (local currency units per $)Exports of goods and services (% of GDP)Imports of goods and services (% of GDP) Business environmentEase of doing business (ranking 1-178; 1=best)Time to start a business (days)Procedures to start a business (number)Firing cost (weeks of wages)Closing a business (years to resolve insolvency)Total tax rate (% of profit)Highest marginal tax rate, corporate (%)Business entry rate (new registrations as % of total)Enterprise surveys
Time dealing with gov’t officials (% of management time)Firms expected to give gifts in meetings w/tax officials (%)Firms using banks to finance investments (% of firms)Delay in obtaining an electrical connection (days)ISO certification ownership (% of firms)
Private sector investmentInvest. in infrastructure w/private participation ($ millions)Private foreign direct investment, net (% of GDP)Gross fixed capital formation (% of GDP)Gross fixed private capital formation (% of GDP) Finance and bankingGovernment cash surplus or deficit (% of GDP)Government debt (% of GDP)Deposit money banks’ assets (% of GDP)Total financial system deposits (% of GDP)Bank capital to asset ratio (%)Bank nonperforming loans to total gross loans ratio (%)Domestic credit to the private sector (% of GDP)Real interest rate (%)Interest rate spread (percentage points) Infrastructure Paved roads (% of total roads)Electric power consumption (kWh per capita)Power outages in a typical month (number)Fixed line and mobile subscribers (per 100 people)Internet users (per 100 people)Cost of telephone call to U.S. ($ per 3 minutes)
213The Little Data Book on Private Sector Development 2008
Europe & Central Asia Lower middle income
Country data
Lower middle-income group
2000 2006 2006
49.2 46.8 2,27623.0 22.5 1,20911.6 7.2 5.7700 1,940 2,038–1.9 7.8 7.617.1 8.7 11.936.3 34.6 43.519.2 20.7 26.746.6 56.7 44.628.2 9.1
5.4 5.062.4 47.2 40.457.4 50.1 36.4
.. 139.. 27 53.. 10 10.. 13.0 50.2.. 2.9 3.3.. 57.3 45.8
30 256.7 6.1 7.6
.. 8.1
54.6 44.04.5 14.7
36.8 30.4.. 10.8
206 865 38,1541.9 5.3 3.0
19.7 24.0 33.517.3 21.7 10.9
–0.6 –1.0 –0.945.3 .. ..10.7 37.2 87.89.3 29.1 43.1
16.2 12.1 10.729.6 17.8 4.011.2 44.9 81.315.0 1.327.8 7.6 7.2
96.7 97.4 65.82,773 3,246 1,502
.. ..23 131 600.7 11.9 11.4
.. 1.65 2.08
Ukraine

Economic and social contextPopulation (millions)Labor force (millions)Unemployment rate (% of labor force)GNI per capita, World Bank Atlas method ($)GDP growth, 1995–2000 and 2000–06 (average annual %)Agriculture value added (% of GDP)Industry value added (% of GDP)
Manufacturing value added (% of GDP)Services value added (% of GDP)Inflation (annual % change in consumer price index)Exchange rate (local currency units per $)Exports of goods and services (% of GDP)Imports of goods and services (% of GDP) Business environmentEase of doing business (ranking 1-178; 1=best)Time to start a business (days)Procedures to start a business (number)Firing cost (weeks of wages)Closing a business (years to resolve insolvency)Total tax rate (% of profit)Highest marginal tax rate, corporate (%)Business entry rate (new registrations as % of total)Enterprise surveys
Time dealing with gov’t officials (% of management time)Firms expected to give gifts in meetings w/tax officials (%)Firms using banks to finance investments (% of firms)Delay in obtaining an electrical connection (days)ISO certification ownership (% of firms)
Private sector investmentInvest. in infrastructure w/private participation ($ millions)Private foreign direct investment, net (% of GDP)Gross fixed capital formation (% of GDP)Gross fixed private capital formation (% of GDP) Finance and bankingGovernment cash surplus or deficit (% of GDP)Government debt (% of GDP)Deposit money banks’ assets (% of GDP)Total financial system deposits (% of GDP)Bank capital to asset ratio (%)Bank nonperforming loans to total gross loans ratio (%)Domestic credit to the private sector (% of GDP)Real interest rate (%)Interest rate spread (percentage points) Infrastructure Paved roads (% of total roads)Electric power consumption (kWh per capita)Power outages in a typical month (number)Fixed line and mobile subscribers (per 100 people)Internet users (per 100 people)Cost of telephone call to U.S. ($ per 3 minutes)
214 2008 The Little Data Book on Private Sector Development
3.2 4.2 1,0311.9 2.7 5042.3 .. 6.2
19,270 26,210 36,6085.1 8.2 2.33.5 2.3 1.5
55.7 55.7 26.213.5 14.1 16.840.8 42.0 72.3
.. ..3.7 3.7
73.3 94.3 25.655.3 76.3 26.3
.. 68.. 62 22.. 11 7.. 84.0 34.9.. 5.1 2.0.. 14.4 41.5
20 .... .. 10.1 .. .... .... .... .... .. .. .. 849.. .. 2.7
22.1 22.8 20.49.5 11.4 ..
0.1 .. –1.3.. .. 47.6.. .. 99.7.. .. ..
12.9 12.6 6.212.7 6.3 1.146.2 60.9 162.0–9.9 ..3.5 .. 4.4
100.0 .. 90.911,886 13,708 9,760
.. ..75 161 143
23.6 40.2 59.33.51 1.73 0.77
Country dataHigh-
income group
2000 2006 2006
High income
United Arab Emirates

Economic and social contextPopulation (millions)Labor force (millions)Unemployment rate (% of labor force)GNI per capita, World Bank Atlas method ($)GDP growth, 1995–2000 and 2000–06 (average annual %)Agriculture value added (% of GDP)Industry value added (% of GDP)
Manufacturing value added (% of GDP)Services value added (% of GDP)Inflation (annual % change in consumer price index)Exchange rate (local currency units per $)Exports of goods and services (% of GDP)Imports of goods and services (% of GDP) Business environmentEase of doing business (ranking 1-178; 1=best)Time to start a business (days)Procedures to start a business (number)Firing cost (weeks of wages)Closing a business (years to resolve insolvency)Total tax rate (% of profit)Highest marginal tax rate, corporate (%)Business entry rate (new registrations as % of total)Enterprise surveys
Time dealing with gov’t officials (% of management time)Firms expected to give gifts in meetings w/tax officials (%)Firms using banks to finance investments (% of firms)Delay in obtaining an electrical connection (days)ISO certification ownership (% of firms)
Private sector investmentInvest. in infrastructure w/private participation ($ millions)Private foreign direct investment, net (% of GDP)Gross fixed capital formation (% of GDP)Gross fixed private capital formation (% of GDP) Finance and bankingGovernment cash surplus or deficit (% of GDP)Government debt (% of GDP)Deposit money banks’ assets (% of GDP)Total financial system deposits (% of GDP)Bank capital to asset ratio (%)Bank nonperforming loans to total gross loans ratio (%)Domestic credit to the private sector (% of GDP)Real interest rate (%)Interest rate spread (percentage points) Infrastructure Paved roads (% of total roads)Electric power consumption (kWh per capita)Power outages in a typical month (number)Fixed line and mobile subscribers (per 100 people)Internet users (per 100 people)Cost of telephone call to U.S. ($ per 3 minutes)
215The Little Data Book on Private Sector Development 2008
High income
Country dataHigh-
income group
2000 2006 2006
59.7 60.6 1,03130.2 30.8 504
5.5 4.6 6.224,970 40,560 36,608
3.2 2.5 2.31.0 0.9 1.5
28.2 24.1 26.217.9 13.6 16.870.7 75.0 72.32.9 3.20.7 0.5
28.1 28.7 25.630.1 32.9 26.3
.. 6.. 13 22.. 6 7.. 22.0 34.9.. 1.0 2.0.. 35.7 41.5
30 3013.6 15.4 10.1
.. .... .... .... .... .. .. .. 849
8.5 5.9 2.716.9 17.3 20.4
.. .. ..
1.7 –2.8 –1.348.8 49.9 47.6
122.7 162.6 99.7.. .. ..
6.5 8.9 6.22.5 0.9 1.1
132.5 175.8 162.04.6 2.22.7 .. 4.4
100.0 100.0 90.96,027 6,253 9,760
.. ..132 171 14326.4 55.4 59.31.07 0.77 0.77
United Kingdom

Economic and social contextPopulation (millions)Labor force (millions)Unemployment rate (% of labor force)GNI per capita, World Bank Atlas method ($)GDP growth, 1995–2000 and 2000–06 (average annual %)Agriculture value added (% of GDP)Industry value added (% of GDP)
Manufacturing value added (% of GDP)Services value added (% of GDP)Inflation (annual % change in consumer price index)Exchange rate (local currency units per $)Exports of goods and services (% of GDP)Imports of goods and services (% of GDP) Business environmentEase of doing business (ranking 1-178; 1=best)Time to start a business (days)Procedures to start a business (number)Firing cost (weeks of wages)Closing a business (years to resolve insolvency)Total tax rate (% of profit)Highest marginal tax rate, corporate (%)Business entry rate (new registrations as % of total)Enterprise surveys
Time dealing with gov’t officials (% of management time)Firms expected to give gifts in meetings w/tax officials (%)Firms using banks to finance investments (% of firms)Delay in obtaining an electrical connection (days)ISO certification ownership (% of firms)
Private sector investmentInvest. in infrastructure w/private participation ($ millions)Private foreign direct investment, net (% of GDP)Gross fixed capital formation (% of GDP)Gross fixed private capital formation (% of GDP) Finance and bankingGovernment cash surplus or deficit (% of GDP)Government debt (% of GDP)Deposit money banks’ assets (% of GDP)Total financial system deposits (% of GDP)Bank capital to asset ratio (%)Bank nonperforming loans to total gross loans ratio (%)Domestic credit to the private sector (% of GDP)Real interest rate (%)Interest rate spread (percentage points) Infrastructure Paved roads (% of total roads)Electric power consumption (kWh per capita)Power outages in a typical month (number)Fixed line and mobile subscribers (per 100 people)Internet users (per 100 people)Cost of telephone call to U.S. ($ per 3 minutes)
216 2008 The Little Data Book on Private Sector Development
282.2 299.4 1,031147.8 157.0 504
4.0 5.1 6.234,400 44,710 36,608
4.2 2.6 2.31.2 1.2 1.5
24.2 22.8 26.217.0 14.4 16.874.6 76.0 72.33.4 3.21.0 1.0
11.2 10.5 25.615.1 16.3 26.3
.. 3.. 6 22.. 6 7.. .. 34.9.. 1.5 2.0.. 46.2 41.5
35 35.. 13.1 10.1 .. .... .... .... .... .. .. .. 849
3.3 1.4 2.719.9 19.1 20.4
.. .. ..
0.5 –2.0 –1.333.0 46.9 47.655.9 62.9 99.763.7 69.6 ..8.5 10.5 6.21.1 0.8 1.1
170.7 201.1 162.06.9 4.6
.. .. 4.4
58.8 65.3 90.913,668 13,648 9,760
.. ..107 135 143
43.9 69.5 59.3.. .. 0.77
Country dataHigh-
income group
2000 2006 2006
High income
United States

Economic and social contextPopulation (millions)Labor force (millions)Unemployment rate (% of labor force)GNI per capita, World Bank Atlas method ($)GDP growth, 1995–2000 and 2000–06 (average annual %)Agriculture value added (% of GDP)Industry value added (% of GDP)
Manufacturing value added (% of GDP)Services value added (% of GDP)Inflation (annual % change in consumer price index)Exchange rate (local currency units per $)Exports of goods and services (% of GDP)Imports of goods and services (% of GDP) Business environmentEase of doing business (ranking 1-178; 1=best)Time to start a business (days)Procedures to start a business (number)Firing cost (weeks of wages)Closing a business (years to resolve insolvency)Total tax rate (% of profit)Highest marginal tax rate, corporate (%)Business entry rate (new registrations as % of total)Enterprise surveys
Time dealing with gov’t officials (% of management time)Firms expected to give gifts in meetings w/tax officials (%)Firms using banks to finance investments (% of firms)Delay in obtaining an electrical connection (days)ISO certification ownership (% of firms)
Private sector investmentInvest. in infrastructure w/private participation ($ millions)Private foreign direct investment, net (% of GDP)Gross fixed capital formation (% of GDP)Gross fixed private capital formation (% of GDP) Finance and bankingGovernment cash surplus or deficit (% of GDP)Government debt (% of GDP)Deposit money banks’ assets (% of GDP)Total financial system deposits (% of GDP)Bank capital to asset ratio (%)Bank nonperforming loans to total gross loans ratio (%)Domestic credit to the private sector (% of GDP)Real interest rate (%)Interest rate spread (percentage points) Infrastructure Paved roads (% of total roads)Electric power consumption (kWh per capita)Power outages in a typical month (number)Fixed line and mobile subscribers (per 100 people)Internet users (per 100 people)Cost of telephone call to U.S. ($ per 3 minutes)
217The Little Data Book on Private Sector Development 2008
Latin America & Caribbean Upper middle income
Country data
Upper middle-income group
2000 2006 2006
3.3 3.3 8111.6 1.7 374
13.6 12.2 9.86,220 5,310 5,913
2.2 2.3 3.96.2 9.2 5.7
27.2 32.4 32.416.9 23.2 19.466.6 58.4 62.0
4.8 6.412.1 24.119.3 29.9 32.721.0 30.3 30.3
.. 98.. 44 41.. 11 9.. 31.0 39.7.. 2.1 2.9.. 40.7 44.5
30 30.. .. 9.1 .. 7.0.. 0.6.. 6.9.. 38.6.. 6.8
681 30 45,8691.3 7.0 3.5
13.2 16.0 19.99.9 13.1 ..
–3.4 –0.9 ..45.8 70.0 ..54.7 31.8 52.944.0 42.8 41.4
7.2 9.8 9.812.4 1.9 3.251.2 26.2 41.440.5 2.327.8 7.4 5.9
90.0 10.0 ..1,990 2,007 3,131
.. 0.541 100 88
10.6 22.8 22.24.88 0.52 1.06
Uruguay

Economic and social contextPopulation (millions)Labor force (millions)Unemployment rate (% of labor force)GNI per capita, World Bank Atlas method ($)GDP growth, 1995–2000 and 2000–06 (average annual %)Agriculture value added (% of GDP)Industry value added (% of GDP)
Manufacturing value added (% of GDP)Services value added (% of GDP)Inflation (annual % change in consumer price index)Exchange rate (local currency units per $)Exports of goods and services (% of GDP)Imports of goods and services (% of GDP) Business environmentEase of doing business (ranking 1-178; 1=best)Time to start a business (days)Procedures to start a business (number)Firing cost (weeks of wages)Closing a business (years to resolve insolvency)Total tax rate (% of profit)Highest marginal tax rate, corporate (%)Business entry rate (new registrations as % of total)Enterprise surveys
Time dealing with gov’t officials (% of management time)Firms expected to give gifts in meetings w/tax officials (%)Firms using banks to finance investments (% of firms)Delay in obtaining an electrical connection (days)ISO certification ownership (% of firms)
Private sector investmentInvest. in infrastructure w/private participation ($ millions)Private foreign direct investment, net (% of GDP)Gross fixed capital formation (% of GDP)Gross fixed private capital formation (% of GDP) Finance and bankingGovernment cash surplus or deficit (% of GDP)Government debt (% of GDP)Deposit money banks’ assets (% of GDP)Total financial system deposits (% of GDP)Bank capital to asset ratio (%)Bank nonperforming loans to total gross loans ratio (%)Domestic credit to the private sector (% of GDP)Real interest rate (%)Interest rate spread (percentage points) Infrastructure Paved roads (% of total roads)Electric power consumption (kWh per capita)Power outages in a typical month (number)Fixed line and mobile subscribers (per 100 people)Internet users (per 100 people)Cost of telephone call to U.S. ($ per 3 minutes)
218 2008 The Little Data Book on Private Sector Development
24.7 26.5 2,4209.8 11.6 995
.. .. ..630 610 6494.1 5.7 6.5
34.4 26.1 20.423.1 27.4 27.7
9.4 10.8 15.842.5 46.5 51.9
.. ..236.6 ..
24.6 37.5 26.721.5 25.9 30.1
.. 138.. 15 54.. 7 10.. 22.0 62.6.. 4.0 3.8.. 96.3 67.4
26 12.. .. 6.4 .. 2.5
50.0 60.41.2 3.3
21.0 8.6.. 8.7
26 100 29,7850.5 1.0 2.6
24.0 21.5 26.715.5 18.0 19.6
.. .. –2.6.. .. .... .. 50.5.. .. 44.6.. .. .... .. .... .. 38.3.. .... .. 11.3
87.3 .. ..1,780 1,659 391
.. ..7 10 17
0.5 6.4 4.213.95 .. 1.99
Country dataLow-
income group
2000 2006 2006
Europe & Central Asia Low income
Uzbekistan

Economic and social contextPopulation (millions)Labor force (millions)Unemployment rate (% of labor force)GNI per capita, World Bank Atlas method ($)GDP growth, 1995–2000 and 2000–06 (average annual %)Agriculture value added (% of GDP)Industry value added (% of GDP)
Manufacturing value added (% of GDP)Services value added (% of GDP)Inflation (annual % change in consumer price index)Exchange rate (local currency units per $)Exports of goods and services (% of GDP)Imports of goods and services (% of GDP) Business environmentEase of doing business (ranking 1-178; 1=best)Time to start a business (days)Procedures to start a business (number)Firing cost (weeks of wages)Closing a business (years to resolve insolvency)Total tax rate (% of profit)Highest marginal tax rate, corporate (%)Business entry rate (new registrations as % of total)Enterprise surveys
Time dealing with gov’t officials (% of management time)Firms expected to give gifts in meetings w/tax officials (%)Firms using banks to finance investments (% of firms)Delay in obtaining an electrical connection (days)ISO certification ownership (% of firms)
Private sector investmentInvest. in infrastructure w/private participation ($ millions)Private foreign direct investment, net (% of GDP)Gross fixed capital formation (% of GDP)Gross fixed private capital formation (% of GDP) Finance and bankingGovernment cash surplus or deficit (% of GDP)Government debt (% of GDP)Deposit money banks’ assets (% of GDP)Total financial system deposits (% of GDP)Bank capital to asset ratio (%)Bank nonperforming loans to total gross loans ratio (%)Domestic credit to the private sector (% of GDP)Real interest rate (%)Interest rate spread (percentage points) Infrastructure Paved roads (% of total roads)Electric power consumption (kWh per capita)Power outages in a typical month (number)Fixed line and mobile subscribers (per 100 people)Internet users (per 100 people)Cost of telephone call to U.S. ($ per 3 minutes)
219The Little Data Book on Private Sector Development 2008
East Asia & Pacific Lower middle income
Country data
Lower middle-income group
2000 2006 2006
0.19 0.22 2,2760.09 0.11 1,209
.. .. 5.71,250 1,690 2,038
1.4 2.0 7.615.6 15.6 11.99.3 9.2 43.54.4 3.4 26.7
75.1 81.7 44.62.5 1.9
137.6 110.643.6 39.8 40.456.5 60.5 36.4
.. 62.. 39 53.. 8 10.. 56.0 50.2.. 2.6 3.3.. 8.4 45.8.. .... .. 7.6 .. .... .... .... .... .. 6 .. 38,154
8.3 11.2 3.020.2 20.5 33.5
.. .. 10.9
–0.8 .. –0.929.2 .. ..
.. .. 87.8
.. .. 43.1
.. .. 10.7
.. .. 4.034.8 47.5 81.3
8.6 8.28.6 6.3 7.2
23.9 .. 65.8.. .. 1,502.. ..4 9 60
2.1 3.5 11.47.45 .. 2.08
Vanuatu

Economic and social contextPopulation (millions)Labor force (millions)Unemployment rate (% of labor force)GNI per capita, World Bank Atlas method ($)GDP growth, 1995–2000 and 2000–06 (average annual %)Agriculture value added (% of GDP)Industry value added (% of GDP)
Manufacturing value added (% of GDP)Services value added (% of GDP)Inflation (annual % change in consumer price index)Exchange rate (local currency units per $)Exports of goods and services (% of GDP)Imports of goods and services (% of GDP) Business environmentEase of doing business (ranking 1-178; 1=best)Time to start a business (days)Procedures to start a business (number)Firing cost (weeks of wages)Closing a business (years to resolve insolvency)Total tax rate (% of profit)Highest marginal tax rate, corporate (%)Business entry rate (new registrations as % of total)Enterprise surveys
Time dealing with gov’t officials (% of management time)Firms expected to give gifts in meetings w/tax officials (%)Firms using banks to finance investments (% of firms)Delay in obtaining an electrical connection (days)ISO certification ownership (% of firms)
Private sector investmentInvest. in infrastructure w/private participation ($ millions)Private foreign direct investment, net (% of GDP)Gross fixed capital formation (% of GDP)Gross fixed private capital formation (% of GDP) Finance and bankingGovernment cash surplus or deficit (% of GDP)Government debt (% of GDP)Deposit money banks’ assets (% of GDP)Total financial system deposits (% of GDP)Bank capital to asset ratio (%)Bank nonperforming loans to total gross loans ratio (%)Domestic credit to the private sector (% of GDP)Real interest rate (%)Interest rate spread (percentage points) Infrastructure Paved roads (% of total roads)Electric power consumption (kWh per capita)Power outages in a typical month (number)Fixed line and mobile subscribers (per 100 people)Internet users (per 100 people)Cost of telephone call to U.S. ($ per 3 minutes)
220 2008 The Little Data Book on Private Sector Development
24.3 27.0 81110.5 13.3 37413.9 15.0 9.8
4,100 6,070 5,9130.6 3.4 3.94.2 4.0 5.7
49.7 55.5 32.419.8 17.9 19.446.1 40.5 62.016.2 13.7
680.0 2,147.029.7 36.6 32.718.1 21.0 30.3
.. 172.. 141 41.. 16 9.. 47.3 39.7.. 4.0 2.9.. 53.3 44.5
34 34.. .. 9.1 .. 33.6.. 2.6.. 35.7.. 25.4.. 12.5
774 1,091 45,8694.0 –0.3 3.5
21.0 22.5 19.9.. .. ..
–1.2 2.2 .... .. ..
11.9 11.9 52.915.0 15.2 41.413.0 9.8 9.8
6.6 1.1 3.212.5 17.1 41.4–3.3 –1.28.9 5.2 5.9
33.6 .. ..2,654 2,848 3,131
.. 3.633 85 883.4 15.3 22.2
0.78 0.84 1.06
Country data
Upper middle-income group
2000 2006 2006
Latin America & Caribbean Upper middle income
Venezuela, RB

Economic and social contextPopulation (millions)Labor force (millions)Unemployment rate (% of labor force)GNI per capita, World Bank Atlas method ($)GDP growth, 1995–2000 and 2000–06 (average annual %)Agriculture value added (% of GDP)Industry value added (% of GDP)
Manufacturing value added (% of GDP)Services value added (% of GDP)Inflation (annual % change in consumer price index)Exchange rate (local currency units per $)Exports of goods and services (% of GDP)Imports of goods and services (% of GDP) Business environmentEase of doing business (ranking 1-178; 1=best)Time to start a business (days)Procedures to start a business (number)Firing cost (weeks of wages)Closing a business (years to resolve insolvency)Total tax rate (% of profit)Highest marginal tax rate, corporate (%)Business entry rate (new registrations as % of total)Enterprise surveys
Time dealing with gov’t officials (% of management time)Firms expected to give gifts in meetings w/tax officials (%)Firms using banks to finance investments (% of firms)Delay in obtaining an electrical connection (days)ISO certification ownership (% of firms)
Private sector investmentInvest. in infrastructure w/private participation ($ millions)Private foreign direct investment, net (% of GDP)Gross fixed capital formation (% of GDP)Gross fixed private capital formation (% of GDP) Finance and bankingGovernment cash surplus or deficit (% of GDP)Government debt (% of GDP)Deposit money banks’ assets (% of GDP)Total financial system deposits (% of GDP)Bank capital to asset ratio (%)Bank nonperforming loans to total gross loans ratio (%)Domestic credit to the private sector (% of GDP)Real interest rate (%)Interest rate spread (percentage points) Infrastructure Paved roads (% of total roads)Electric power consumption (kWh per capita)Power outages in a typical month (number)Fixed line and mobile subscribers (per 100 people)Internet users (per 100 people)Cost of telephone call to U.S. ($ per 3 minutes)
221The Little Data Book on Private Sector Development 2008
East Asia & Pacific Low income
Country dataLow-
income group
2000 2006 2006
77.6 84.1 2,42039.2 44.8 995
2.3 2.1 ..390 700 6496.7 7.6 6.5
24.5 20.4 20.436.7 41.6 27.718.6 21.3 15.838.7 38.1 51.9–1.7 7.7
14,167.855.0 73.5 26.757.5 76.8 30.1
.. 91.. 50 54.. 11 10.. 87.0 62.6.. 5.0 3.8.. 41.1 67.4
32 28.. .. 6.4 .. 3.1.. 78.7.. 29.2.. 12.4.. 11.4
150 260 29,7854.2 3.8 2.6
27.6 32.8 26.7.. .. 19.6 .. .. –2.6.. .. ..
32.0 71.5 50.57.4 12.6 44.6
.. .. ..
.. .. ..35.3 71.3 38.3
6.9 3.66.9 3.5 11.3
25.1 .. ..295 573 391
.. ..4 31 17
0.3 17.5 4.29.29 1.95 1.99
Vietnam
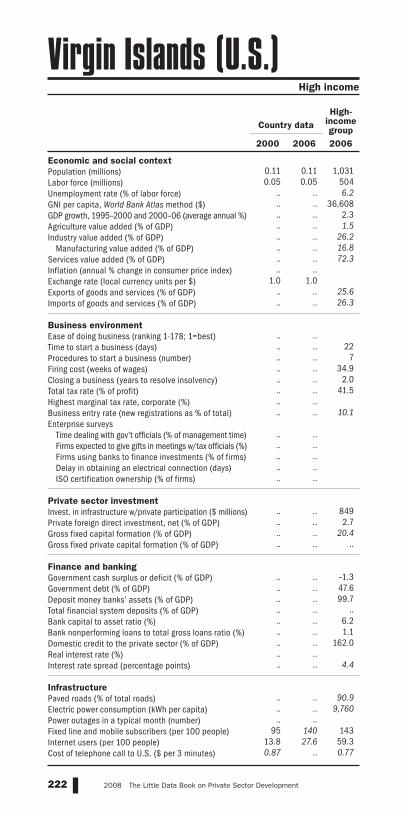
Economic and social contextPopulation (millions)Labor force (millions)Unemployment rate (% of labor force)GNI per capita, World Bank Atlas method ($)GDP growth, 1995–2000 and 2000–06 (average annual %)Agriculture value added (% of GDP)Industry value added (% of GDP)
Manufacturing value added (% of GDP)Services value added (% of GDP)Inflation (annual % change in consumer price index)Exchange rate (local currency units per $)Exports of goods and services (% of GDP)Imports of goods and services (% of GDP) Business environmentEase of doing business (ranking 1-178; 1=best)Time to start a business (days)Procedures to start a business (number)Firing cost (weeks of wages)Closing a business (years to resolve insolvency)Total tax rate (% of profit)Highest marginal tax rate, corporate (%)Business entry rate (new registrations as % of total)Enterprise surveys
Time dealing with gov’t officials (% of management time)Firms expected to give gifts in meetings w/tax officials (%)Firms using banks to finance investments (% of firms)Delay in obtaining an electrical connection (days)ISO certification ownership (% of firms)
Private sector investmentInvest. in infrastructure w/private participation ($ millions)Private foreign direct investment, net (% of GDP)Gross fixed capital formation (% of GDP)Gross fixed private capital formation (% of GDP) Finance and bankingGovernment cash surplus or deficit (% of GDP)Government debt (% of GDP)Deposit money banks’ assets (% of GDP)Total financial system deposits (% of GDP)Bank capital to asset ratio (%)Bank nonperforming loans to total gross loans ratio (%)Domestic credit to the private sector (% of GDP)Real interest rate (%)Interest rate spread (percentage points) Infrastructure Paved roads (% of total roads)Electric power consumption (kWh per capita)Power outages in a typical month (number)Fixed line and mobile subscribers (per 100 people)Internet users (per 100 people)Cost of telephone call to U.S. ($ per 3 minutes)
222 2008 The Little Data Book on Private Sector Development
0.11 0.11 1,0310.05 0.05 504
.. .. 6.2
.. .. 36,608
.. .. 2.3
.. .. 1.5
.. .. 26.2
.. .. 16.8
.. .. 72.3
.. ..1.0 1.0
.. .. 25.6
.. .. 26.3 .. .... .. 22.. .. 7.. .. 34.9.. .. 2.0.. .. 41.5.. .... .. 10.1 .. .... .... .... .... .. .. .. 849.. .. 2.7.. .. 20.4.. .. .. .. .. –1.3.. .. 47.6.. .. 99.7.. .. .... .. 6.2.. .. 1.1.. .. 162.0.. .... .. 4.4 .. .. 90.9.. .. 9,760.. ..
95 140 14313.8 27.6 59.30.87 .. 0.77
Country dataHigh-
income group
2000 2006 2006
High income
Virgin Islands (U.S.)
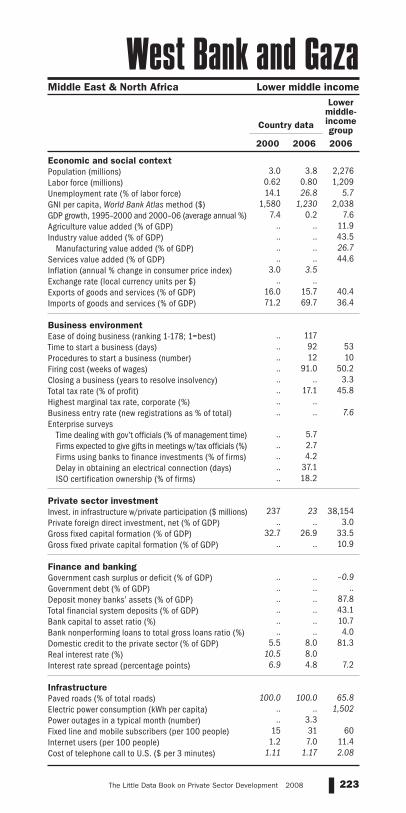
Economic and social contextPopulation (millions)Labor force (millions)Unemployment rate (% of labor force)GNI per capita, World Bank Atlas method ($)GDP growth, 1995–2000 and 2000–06 (average annual %)Agriculture value added (% of GDP)Industry value added (% of GDP)
Manufacturing value added (% of GDP)Services value added (% of GDP)Inflation (annual % change in consumer price index)Exchange rate (local currency units per $)Exports of goods and services (% of GDP)Imports of goods and services (% of GDP) Business environmentEase of doing business (ranking 1-178; 1=best)Time to start a business (days)Procedures to start a business (number)Firing cost (weeks of wages)Closing a business (years to resolve insolvency)Total tax rate (% of profit)Highest marginal tax rate, corporate (%)Business entry rate (new registrations as % of total)Enterprise surveys
Time dealing with gov’t officials (% of management time)Firms expected to give gifts in meetings w/tax officials (%)Firms using banks to finance investments (% of firms)Delay in obtaining an electrical connection (days)ISO certification ownership (% of firms)
Private sector investmentInvest. in infrastructure w/private participation ($ millions)Private foreign direct investment, net (% of GDP)Gross fixed capital formation (% of GDP)Gross fixed private capital formation (% of GDP) Finance and bankingGovernment cash surplus or deficit (% of GDP)Government debt (% of GDP)Deposit money banks’ assets (% of GDP)Total financial system deposits (% of GDP)Bank capital to asset ratio (%)Bank nonperforming loans to total gross loans ratio (%)Domestic credit to the private sector (% of GDP)Real interest rate (%)Interest rate spread (percentage points) Infrastructure Paved roads (% of total roads)Electric power consumption (kWh per capita)Power outages in a typical month (number)Fixed line and mobile subscribers (per 100 people)Internet users (per 100 people)Cost of telephone call to U.S. ($ per 3 minutes)
223The Little Data Book on Private Sector Development 2008
Middle East & North Africa Lower middle income
Country data
Lower middle-income group
2000 2006 2006
3.0 3.8 2,276
0.62 0.80 1,20914.1 26.8 5.7
1,580 1,230 2,0387.4 0.2 7.6
.. .. 11.9
.. .. 43.5
.. .. 26.7
.. .. 44.63.0 3.5
.. ..16.0 15.7 40.471.2 69.7 36.4
.. 117.. 92 53.. 12 10.. 91.0 50.2.. .. 3.3.. 17.1 45.8.. .... .. 7.6 .. 5.7.. 2.7.. 4.2.. 37.1.. 18.2
237 23 38,154.. .. 3.0
32.7 26.9 33.5.. .. 10.9 .. .. –0.9.. .. .... .. 87.8.. .. 43.1.. .. 10.7.. .. 4.0
5.5 8.0 81.310.5 8.06.9 4.8 7.2
100.0 100.0 65.8.. .. 1,502.. 3.3
15 31 601.2 7.0 11.4
1.11 1.17 2.08
West Bank and Gaza

Economic and social contextPopulation (millions)Labor force (millions)Unemployment rate (% of labor force)GNI per capita, World Bank Atlas method ($)GDP growth, 1995–2000 and 2000–06 (average annual %)Agriculture value added (% of GDP)Industry value added (% of GDP)
Manufacturing value added (% of GDP)Services value added (% of GDP)Inflation (annual % change in consumer price index)Exchange rate (local currency units per $)Exports of goods and services (% of GDP)Imports of goods and services (% of GDP) Business environmentEase of doing business (ranking 1-178; 1=best)Time to start a business (days)Procedures to start a business (number)Firing cost (weeks of wages)Closing a business (years to resolve insolvency)Total tax rate (% of profit)Highest marginal tax rate, corporate (%)Business entry rate (new registrations as % of total)Enterprise surveys
Time dealing with gov’t officials (% of management time)Firms expected to give gifts in meetings w/tax officials (%)Firms using banks to finance investments (% of firms)Delay in obtaining an electrical connection (days)ISO certification ownership (% of firms)
Private sector investmentInvest. in infrastructure w/private participation ($ millions)Private foreign direct investment, net (% of GDP)Gross fixed capital formation (% of GDP)Gross fixed private capital formation (% of GDP) Finance and bankingGovernment cash surplus or deficit (% of GDP)Government debt (% of GDP)Deposit money banks’ assets (% of GDP)Total financial system deposits (% of GDP)Bank capital to asset ratio (%)Bank nonperforming loans to total gross loans ratio (%)Domestic credit to the private sector (% of GDP)Real interest rate (%)Interest rate spread (percentage points) Infrastructure Paved roads (% of total roads)Electric power consumption (kWh per capita)Power outages in a typical month (number)Fixed line and mobile subscribers (per 100 people)Internet users (per 100 people)Cost of telephone call to U.S. ($ per 3 minutes)
224 2008 The Little Data Book on Private Sector Development
18.2 21.7 2,420
4.9 6.3 99511.5 .. ..400 760 6495.6 3.9 6.5
10.3 14.3 20.446.5 40.3 27.7
5.2 4.7 15.843.2 45.4 51.9
4.6 20.8161.7 197.042.3 38.0 26.736.6 41.4 30.1
.. 113.. 63 54.. 12 10.. 17.0 62.6.. 3.0 3.8.. 41.4 67.4.. .... 8.4 6.4 .. .... .... .... .... ..
20 287 29,7850.1 5.9 2.6
18.6 23.1 26.713.2 13.4 19.6
–2.3 .. –2.6.. .. ..
8.6 12.0 50.517.4 18.7 44.6
.. .. ..
.. .. ..5.0 6.9 38.3
–4.9 4.15.5 5.0 11.3
15.5 8.7 ..136 174 391
.. ..2 14 17
0.1 1.2 4.24.45 2.39 1.99
Country dataLow-
income group
2000 2006 2006
Middle East & North Africa Low income
Yemen, Rep.

Economic and social contextPopulation (millions)Labor force (millions)Unemployment rate (% of labor force)GNI per capita, World Bank Atlas method ($)GDP growth, 1995–2000 and 2000–06 (average annual %)Agriculture value added (% of GDP)Industry value added (% of GDP)
Manufacturing value added (% of GDP)Services value added (% of GDP)Inflation (annual % change in consumer price index)Exchange rate (local currency units per $)Exports of goods and services (% of GDP)Imports of goods and services (% of GDP) Business environmentEase of doing business (ranking 1-178; 1=best)Time to start a business (days)Procedures to start a business (number)Firing cost (weeks of wages)Closing a business (years to resolve insolvency)Total tax rate (% of profit)Highest marginal tax rate, corporate (%)Business entry rate (new registrations as % of total)Enterprise surveys
Time dealing with gov’t officials (% of management time)Firms expected to give gifts in meetings w/tax officials (%)Firms using banks to finance investments (% of firms)Delay in obtaining an electrical connection (days)ISO certification ownership (% of firms)
Private sector investmentInvest. in infrastructure w/private participation ($ millions)Private foreign direct investment, net (% of GDP)Gross fixed capital formation (% of GDP)Gross fixed private capital formation (% of GDP) Finance and bankingGovernment cash surplus or deficit (% of GDP)Government debt (% of GDP)Deposit money banks’ assets (% of GDP)Total financial system deposits (% of GDP)Bank capital to asset ratio (%)Bank nonperforming loans to total gross loans ratio (%)Domestic credit to the private sector (% of GDP)Real interest rate (%)Interest rate spread (percentage points) Infrastructure Paved roads (% of total roads)Electric power consumption (kWh per capita)Power outages in a typical month (number)Fixed line and mobile subscribers (per 100 people)Internet users (per 100 people)Cost of telephone call to U.S. ($ per 3 minutes)
225The Little Data Book on Private Sector Development 2008
Sub-Saharan Africa Low income
Country dataLow-
income group
2000 2006 2006
10.5 11.7 2,4204.5 5.0 995
12.0 .. ..300 630 6492.2 5.0 6.5
22.3 21.8 20.425.3 32.9 27.711.4 11.1 15.852.4 45.3 51.926.0 9.0
3,110.8 3,603.127.1 38.2 26.741.5 29.6 30.1
.. 116.. 33 54.. 6 10.. 178.0 62.6.. 2.7 3.8.. 16.1 67.4
35 35.. 5.2 6.4
13.0 .... 5.4
17.4 10.1142.4 93.2
5.8 ..
27 238 29,7853.8 5.4 2.6
16.0 23.0 26.76.0 19.0 19.6
1.8 –2.8 –2.6176.2 .. ..12.4 13.9 50.516.3 15.4 44.6
.. .. ..23.6 10.8 ..
8.6 9.7 38.36.7 9.8
18.6 12.8 11.3
22.0 .. ..595 721 391
.. 4.22 15 17
0.2 4.3 4.22.57 1.41 1.99
Zambia

Economic and social contextPopulation (millions)Labor force (millions)Unemployment rate (% of labor force)GNI per capita, World Bank Atlas method ($)GDP growth, 1995–2000 and 2000–06 (average annual %)Agriculture value added (% of GDP)Industry value added (% of GDP)
Manufacturing value added (% of GDP)Services value added (% of GDP)Inflation (annual % change in consumer price index)Exchange rate (local currency units per $)Exports of goods and services (% of GDP)Imports of goods and services (% of GDP) Business environmentEase of doing business (ranking 1-178; 1=best)Time to start a business (days)Procedures to start a business (number)Firing cost (weeks of wages)Closing a business (years to resolve insolvency)Total tax rate (% of profit)Highest marginal tax rate, corporate (%)Business entry rate (new registrations as % of total)Enterprise surveys
Time dealing with gov’t officials (% of management time)Firms expected to give gifts in meetings w/tax officials (%)Firms using banks to finance investments (% of firms)Delay in obtaining an electrical connection (days)ISO certification ownership (% of firms)
Private sector investmentInvest. in infrastructure w/private participation ($ millions)Private foreign direct investment, net (% of GDP)Gross fixed capital formation (% of GDP)Gross fixed private capital formation (% of GDP) Finance and bankingGovernment cash surplus or deficit (% of GDP)Government debt (% of GDP)Deposit money banks’ assets (% of GDP)Total financial system deposits (% of GDP)Bank capital to asset ratio (%)Bank nonperforming loans to total gross loans ratio (%)Domestic credit to the private sector (% of GDP)Real interest rate (%)Interest rate spread (percentage points) Infrastructure Paved roads (% of total roads)Electric power consumption (kWh per capita)Power outages in a typical month (number)Fixed line and mobile subscribers (per 100 people)Internet users (per 100 people)Cost of telephone call to U.S. ($ per 3 minutes)
226 2008 The Little Data Book on Private Sector Development
12.7 13.2 2,4205.4 6.0 9956.0 .. ..
450 340 6490.7 –5.7 6.5
18.5 19.1 20.425.0 23.9 27.715.8 13.5 15.856.5 57.0 51.955.9 1,096.7
0.0 164.435.9 56.8 26.736.2 73.0 30.1
.. 152.. 96 54.. 10 10.. 446.0 62.6.. 3.3 3.8.. 53.0 67.4
30 30.. .. 6.4 .. .... .... .... .... .. 8 20 29,785
0.3 3.0 2.611.8 21.0 26.711.1 19.5 19.6
–5.2 .. –2.658.1 .. ..24.3 15.9 50.528.3 18.4 44.6
9.4 12.1 ..19.6 23.2 ..24.5 26.6 38.3
7.7 –0.718.0 293.1 11.3
19.0 .. ..843 953 391
.. ..4 9 17
0.4 9.2 4.24.36 .. 1.99
Country dataLow-
income group
2000 2006 2006
Sub-Saharan Africa Low income
Zimbabwe

230 2008 The Little Data Book on Private Sector Development
GlossaryImports of goods and services are the value of all goods and other market services received from the rest of the world. They include the value of mer-chandise, freight, insurance, transport, travel, royalties, license fees, and other services, such as communication, construction, financial, information, business, personal, and government services. They exclude compensation of employees and investment income (formerly called factor services) as well as transfer payments. (World Bank and Organisation for Economic Co-operation and Development)
Industry value added is the net output of industry (International Standard Industrial Classification divisions 10–45, including mining, manufacturing, construction, electricity, water, and gas) after totaling outputs and subtracting intermediate inputs. (World Bank and Organisation for Economic Co-opera-tion and Development)
Inflation is the annual percentage change in the cost to the average consumer of acquiring a basket of goods and services that may be fixed or changed at specified intervals, such as yearly. The Laspeyres formula is generally used. (International Monetary Fund)
Interest rate spread is the interest rate charged by banks on loans to prime customers minus the interest rate paid by commercial or similar banks for demand, time, or savings deposits. (International Monetary Fund)
Internet users are people with access to the worldwide network. (International Telecommunication Union)
Investment in infrastructure with private participation is the value of infra-structure projects in telecommunications, energy (electricity and natural gas transmission and distribution), transport, and water and sanitation that have reached financial closure and directly or indirectly serve the public, includ-ing operation and management contracts with major capital expenditure, greenfield projects (in which a private entity or public-private joint venture builds and operates a new facility), and divestitures. Incinerators, movable assets, standalone solid waste projects, and small projects such as windmills are excluded. (World Bank)
ISO certification ownership is the percentage of firms that have earned a quality certification recognized by the International Organization for Standardization (ISO). (World Bank)
Labor force is all people who supply labor for the production of goods and services during a specified period, according to the International Labour Organization definition of the economically active population. It includes both the employed and the unemployed. While national practices vary in the treatment of such groups as the armed forces and seasonal or part-time workers, in general the labor force includes the armed forces, the unemployed, and first-time job-seekers and excludes homemakers and other

231The Little Data Book on Private Sector Development 2008
unpaid caregivers and workers in the informal sector. (International Labour Organization and World Bank)
Manufacturing value added is the net output of industries belonging to International Standard Industrial Classification divisions 15–37 after totaling outputs and subtracting intermediate inputs. (World Bank and Organisation for Economic Co-operation and Development)
Paved roads are roads surfaced with concrete, cobblestones, or crushed stone (macadam) and hydrocarbon binder or bituminized agents. (International Road Federation)
Population is based on the de facto definition of population, which counts all residents regardless of legal status or citizenship—except for refugees not permanently settled in the country of asylum, who are generally con-sidered part of the population of their country of origin. Data are midyear estimates. (World Bank)
Power outages in a typical month are the average number of power outages that establishments experience in a typical month. (World Bank)
Private foreign direct investment, net, is net inflows of private investment to acquire a lasting management interest (10 percent or more of voting stock) in an enterprise operating in an economy other than that of the investor. It is the sum of equity capital, reinvestment of earnings, other long-term capital, and short-term capital, as shown in the balance of payments. (International Monetary Fund, World Bank, and Organisation for Economic Co-operation and Development)
Procedures to start a business are the number of procedures required to start a business, including interactions to obtain necessary permits and licenses and to complete all inscriptions, verifications, and notifications to start operations. Data are for businesses with specific characteristics of ownership, size, and type of production. Data listed for 2006 are for June 2007. (World Bank)
Real interest rate is the lending interest rate adjusted for inflation as mea-sured by the GDP deflator. (International Monetary Fund and World Bank)
Services value added is the net output of services (International Standard Industrial Classification divisions 50–99) after totaling outputs and sub-tracting intermediate inputs. (World Bank and Organisation for Economic Co-operation and Development)
Time dealing with government officials is the percentage of management time in a given week spent on requirements imposed by government regula-tions (taxes, customs, labor regulations, licensing, and registration). (World Bank)

232 2008 The Little Data Book on Private Sector Development
GlossaryTime to start a business is the number of calendar days needed to complete the required procedures for legally operating a business. If a procedure can be expedited at additional cost, the fastest procedure, independent of cost, is chosen. Data listed for 2006 are for June 2007. (World Bank)
Total financial system deposits are the demand, time, and saving depos-its in deposit money banks and other financial institutions. (International Monetary Fund)
Total tax rate is the total amount of taxes payable by the business (except for labor taxes) after accounting for deductions and exemptions as a per-centage of profit. For further details on the method used for assessing the total tax payable, see the World Bank’s Doing Business 2008. Data listed for 2006 are for June 2007. (World Bank)
Unemployment rate is the share of the labor force without work but available for and seeking employment. Definitions of labor force and unemployment
differ by country. (International Labour Organization)


1818 H Street N.W.
Washington, D.C. 20433 USA
Telephone: 202 473 1000
Fax: 202 477 6391
Web site: www.worldbank.org
Email: [email protected]
AFGHANISTAN ALBANIA ALGERIA AMERICAN SAMOA ANDORRA ANGOLA ANTIGUA ANDBARBUDA ARGENTINA ARMENIA ARUBA AUSTRALIA AUSTRIA AZERBAIJAN THE BAHAMASBAHRAIN BANGLADESH BARBADOS BELARUS BELGIUM BELIZE BENIN BERMUDA BHUTANBOLIVIA BOSNIA AND HERZEGOVINA BOTSWANA BRAZIL BRUNEI DARUSSALAM BULGARIABURKINA FASO BURUNDI CAMBODIA CAMEROON CANADA CAPE VERDE CAYMAN ISLANDSCENTRAL AFRICAN REPUBLIC CHAD CHANNEL ISLANDS CHILE CHINA COLOMBIA COMOROSDEMOCRATIC REPUBLIC OF CONGO REPUBLIC OF CONGO COSTA RICA CÔTE D’IVOIRECROATIA CUBA CYPRUS CZECH REPUBLIC DENMARK DJIBOUTI DOMINICA DOMINICANREPUBLIC ECUADOR ARAB REPUBLIC OF EGYPT EL SALVADOR EQUATORIAL GUINEA ERITREAESTONIA ETHIOPIA FAEROE ISLANDS FIJI FINLAND FRANCE FRENCH POLYNESIA GABON THEGAMBIA GEORGIA GERMANY GHANA GREECE GREENLAND GRENADA GUAM GUATEMALA GUINEAGUINEA-BISSAU GUYANA HAITI HONDURAS HONG KONG, CHINA HUNGARY ICELAND INDIAINDONESIA ISLAMIC REPUBLIC OF IRAN IRAQ IRELAND ISLE OF MAN ISRAEL ITALY JAMAICAJAPAN JORDAN KAZAKHSTAN KENYA KIRIBATI DEMOCRATIC REPUBLIC OF KOREA REPUBLICOF KOREA KUWAIT KYRGYZ REPUBLIC LAO PEOPLE’S DEMOCRATIC REPUBLIC LATVIA LEBANONLESOTHO LIBERIA LIBYA LIECHTENSTEIN LITHUANIA LUXEMBOURG MACAO, CHINA FORMERYUGOSLAV REPUBLIC OF MACEDONIA MADAGASCAR MALAWI MALAYSIA MALDIVES MALIMALTA MARSHALL ISLANDS MAURITANIA MAURITIUS MAYOTTE MEXICO FEDERATED STATESOF MICRONESIA MOLDOVA MONACO MONGOLIA MONTENEGRO MOROCCO MOZAMBIQUEMYANMAR NAMIBIA NEPAL NETHERLANDS NETHERLANDS ANTILLES NEW CALEDONIA NEWZEALAND NICARAGUA NIGER NIGERIA NORTHERN MARIANA ISLANDS NORWAY OMANPAKISTAN PALAU PANAMA PAPUA NEW GUINEA PARAGUAY PERU PHILIPPINES POLANDPORTUGAL PUERTO RICO QATAR ROMANIA RUSSIAN FEDERATION RWANDA SAMOA SANMARINO SÃO TOMÉ AND PRINCIPE SAUDI ARABIA SENEGAL SERBIA SEYCHELLES SIERRALEONE SINGAPORE SLOVAK REPUBLIC SLOVENIA SOLOMON ISLANDS SOMALIA SOUTHAFRICA SPAIN SRI LANKA ST. KITTS AND NEVIS ST. LUCIA ST. VINCENT & GRENADINESSUDAN SURINAME SWAZILAND SWEDEN SWITZERLAND SYRIAN ARAB REPUBLIC TAJIKISTANTANZANIA THAILAND TIMOR-LESTE TOGO TONGA TRINIDAD AND TOBAGO TUNISIA TURKEYTURKMENISTAN UGANDA UKRAINE UNITED ARAB EMIRATES UNITED KINGDOM UNITEDSTATES URUGUAY UZBEKISTAN VANUATU REPÚBLICA BOLIVIARANA DE VENEZUELA VIETNAMU.S. VIRGIN ISLANDS WEST BANK AND GAZA REPUBLIC OF YEMEN ZAMBIA ZIMBABWE
From World Development Indicators
Economic and social context
Business environment
Private sector investment
Finance and banking
Infrastructure
The Little Data Book on Private Sector Development
The Little Data Book on Private SectorDevelopment
ISBN 978-0-8213-7430-6
SKU 17430