from waste to taste, dr tóth gergely, 27. 3. 2015
TRANSCRIPT

Brave New Economic Theory
for Sustainable DevelopmentTóth Gergely

New economics
1. Moral economics has a history!
2. Utilitarian economics is over?
3. Beware: Mainstream is a religion.

1817
Embe
dmen
t of t
he e
cono
mic
par
adig
m in
soc
iety
(-)
B.C. a.D.333
1269
1375
1776
1664 1716
1798
1759
Moral Economics, Uti l i tarian Economics
1871
1874
1890

Adam Smith, 1776
„It is not from the benevolence of the butcher, the brewer or the baker, that we expect our dinner, but from their regard to their own interest… We address ourselves, not to their humanity but to their self-love”
„And he is … led by an invisible hand to promote an end which was no part of his intention.”

Baker – p. 27.Book 1, Chapter 2.: On the Principle which gives occasion to the Division of Labour
Invisible hand – p. 456Book 4, Chap 2.: Of Restraints upon the Importation from Foreign Countries of Such Goods as can be produced at Home
429 pages
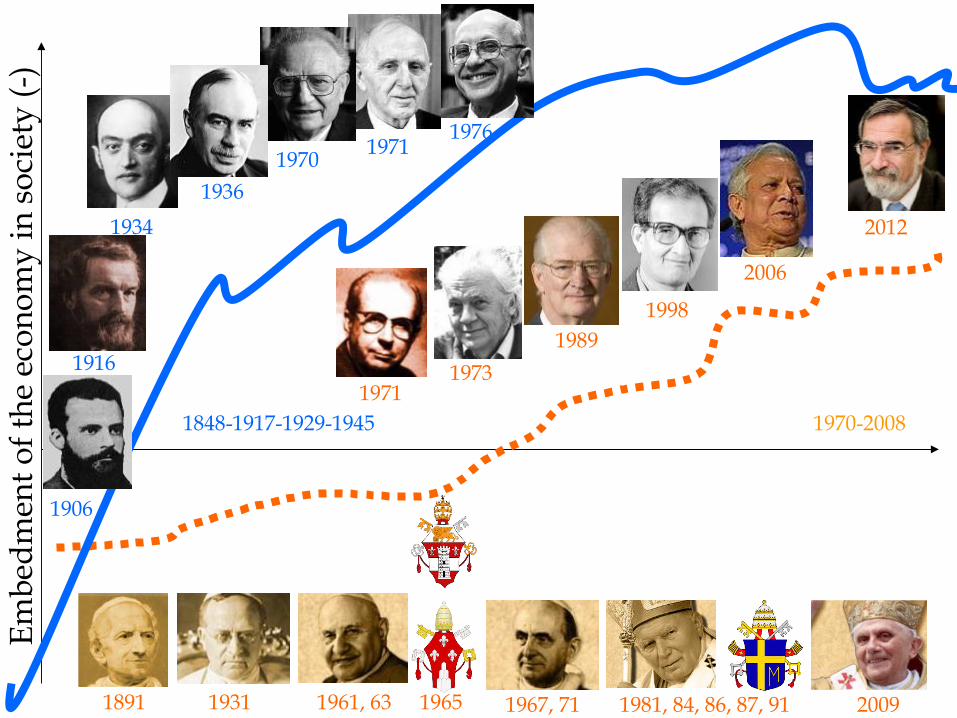
1970-20081848-1917-1929-1945
1971
1934
19701976
1998
1936
19711973
1989
2006
1891 1931 1961, 63 1965 1967, 71 20091981, 84, 86, 87, 91
Embe
dmen
t of t
he e
cono
my
in s
ocie
ty (-
)
2012
1906
1916
New economics
1. Moral economics has a history!
2. Utilitarian economics is over?
3. Beware: Mainstream is a religion.

Ecological footprint and biocapacity
Source: WWF, GFN, ZSL [2012]: Living Planet Report, p. 40.

Own research on EFwith Cecília Szigeti
1. Trends before 1961?
2. What are the turning points in history?
3. Birth of the current growth paradigm?
Estimation of the Ecological Footprint from 10,000 B.C.

Sources Bolt , J. and van Zanden J. L [2013]: The
First Update of the Maddison Project; Re-Estimating Growth Before 1820. Maddison Project Working Paper 4.
Kremer, M [1993]: Population Growth and Technical Change: One Million BC. The Quarterly Journal of Economics Vol. 108 No 3. (Aug. 1993) pp. 681-716.
Angus Maddison [2001]: The World Economy: A millennial perspective Paris: OECD.
Angus Maddison [2003]: The World Economy: Historical Statistics. OECD.
J. M. Keynes [1930]: Economic Possibilities for Our Grandchildren. in Essays in Peruasion Ch. 5. 360-361 Macmillan, London.
1. GFN database
2. Maddison data table
3. Bolt-van Zanden data

yearNo. of
countries R2 Consumption dependent EF (x=GDP)
„Autonomous EF”
1961 113 0,5075 0,0004x 1,1331
1962 119 0,5323 0,0004x 1,0221
1975 118 0,6044 0,0004x 1,1185
1980 118 0,6332 0,0003x 1,1621
1985 119 0,6938 0,0003x 1,1652
2005 114 0,7231 0,0002x 1,2501
2008 113 0,7529 0,0002x 1,2618
Regression Functions
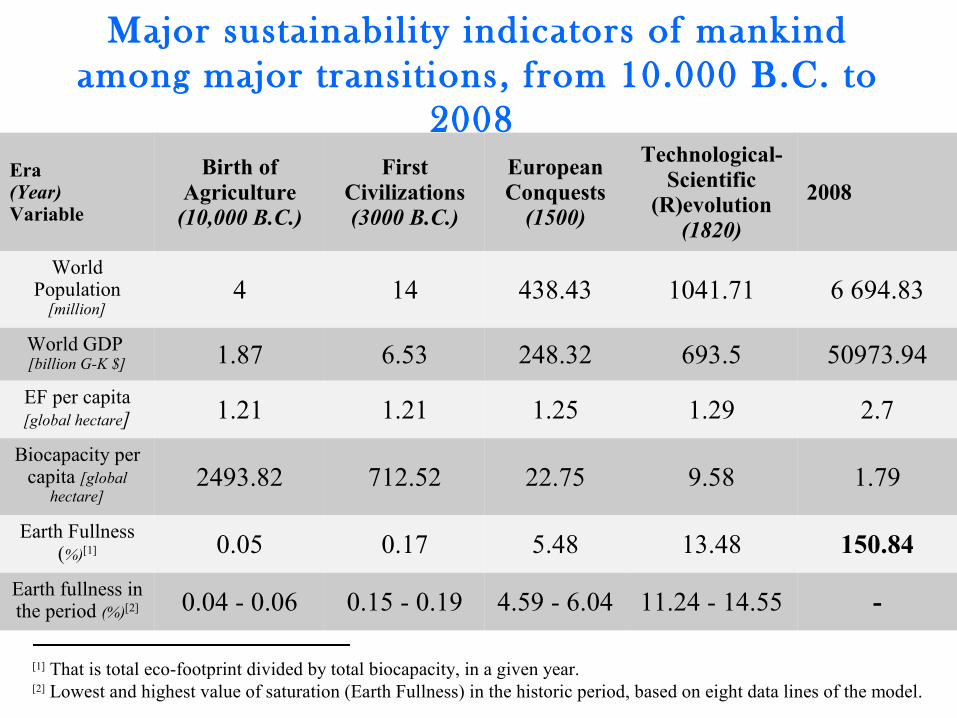
Major sustainability indicators of mankind among major transitions, from 10.000 B.C. to
2008 Era(Year)Variable
Birth of Agriculture
(10,000 B.C.)
First Civilizations(3000 B.C.)
European Conquests
(1500)
Technological-Scientific
(R)evolution(1820)
2008
World Population
[million]4 14 438.43 1041.71 6 694.83
World GDP [billion G-K $] 1.87 6.53 248.32 693.5 50973.94
EF per capita [global hectare] 1.21 1.21 1.25 1.29 2.7
Biocapacity per capita [global
hectare]2493.82 712.52 22.75 9.58 1.79
Earth Fullness (%)[1] 0.05 0.17 5.48 13.48 150.84
Earth fullness in the period (%)[2] 0.04 - 0.06 0.15 - 0.19 4.59 - 6.04 11.24 - 14.55 -
[1] That is total eco-footprint divided by total biocapacity, in a given year.[2] Lowest and highest value of saturation (Earth Fullness) in the historic period, based on eight data lines of the model.
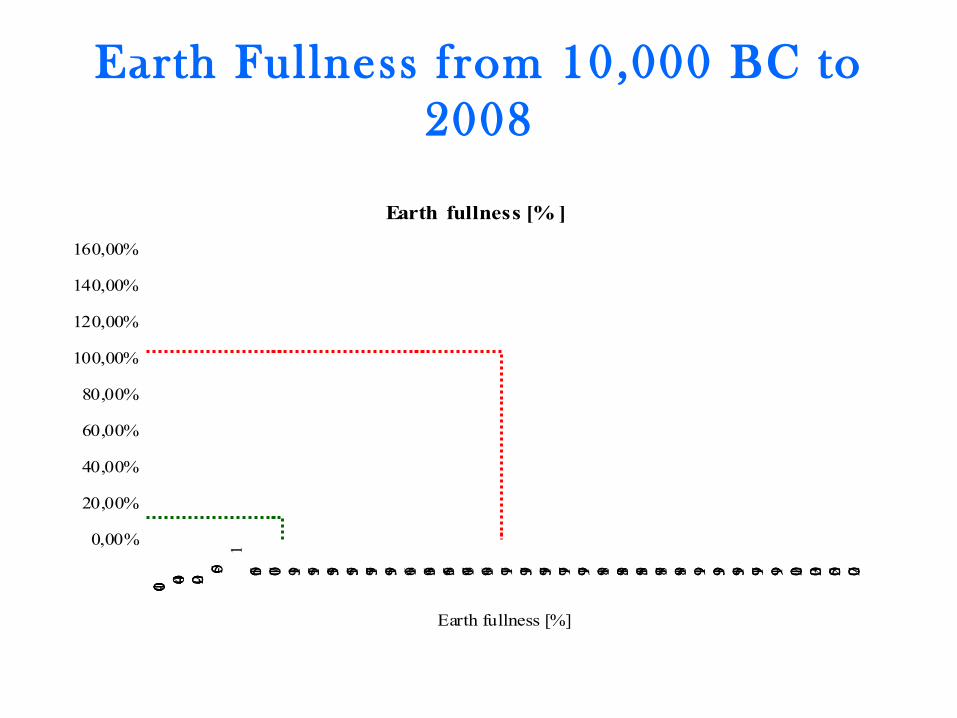
Earth Fullness from 10,000 BC to 2008
0,00%
20,00%
40,00%
60,00%
80,00%
100,00%
120,00%
140,00%
160,00%
-10 000 -4 000 -2 000-500
11500 1700 1913 1951 1953 1955 1957 1959 1961 1963 1965 1967 1969 1971 1973 1975 1977 1979 1981 1983 1985 1987 1989 1991 1993 1995 1997 1999 2001 2003 2005 2007
Earth fullness [% ]
Earth fullness [%]

Long term changes in Earth Fullness and World Total Population, from 10.000 B.C. to
2008
0%
20%
40%
60%
80%
100%
120%
140%
160%
-10 000 -3 000 -2 000 1500 1700 1820 1913 1961 1990 2008
0
1000
2000
3000
4000
5000
6000
7000
8000
Earthfullness (%)
WorldPopulation(million)

New economics
1. Moral economics has a history!
2. Utilitarian economics is over?
3. Beware: Mainstream is a religion.

1. God (HC*)
2. Commandments (TG)
3. Chief command (HC*)
4. Credo (TG)
5. Holy Trinity (TG)
*Harvey Cox [1999]: The Market as God: Living in the new dispensation. The Atlantic Monthly, March 1999, p. 18-23.
Furnishing of the Religion of Economism

1. Marketgod Invisible, but overwhelming Power over time (credit) Infuses everywhere (family) Solves everything – Do not disturb! Confessional box, indulgence tickets Priests (econologians) Transformation

4. The creed of unsustainable development
I believe in Growth, the sustainable, almighty maker of products and services, and the Invisible Hand, which corrects all market failures and leads us to the Pareto optimum.And in the Competition, the only safeguard of development and natural selection, which led from the big boom, through evolution, to the appearance of Man.Science of science, rationality of rationality, idol-worship from paradigm, from science pretending omnicompetence.
Everybody believes but not one has proven, of one essence with the meme, commanding and controlling all our thoughts.
It was created for us men and for our welfare, but has become our enemy, descended into hell and made the earth an impersonal hell.
It became a spiritual reality, and was incarnate of the enlightenment and Darwin, Freud, Marx, Mill, Einstein. It became a Spirit.
…

5. The ‘holy trinity’ of
economism

Go back, boys.This is a TRAP!
Thank you for your attention!

Extra

Between 10,000 and 3000 B.C.
Between 3000 B.C. and 1500
Between 1500 and
1820
Between 1820 and
2008
a. Length of periodapp. 7000
yearsapp. 4500
years320 years 188 years
b.
Change of World Population [million/100 years]
0.14[1] 9.43 188.53 3141.17
c.Change of Earth-fullness in 100 years [ratio]
0.17[2] 11.8 250 7696
d.
b/a 1.2 1.25 1.33 2.45
[1] Method of calculation: difference in population (from Table 3) divided by the number of years. For a specific year: (14-4)/70=0.14.[2] Change in World Fullness (from Table 3) divided by the number of years. For a specific year: (0.17-0.05)*100/70=0.17.
Length and pace of sustainabil i ty changes from
10.000 B.C. to 2008
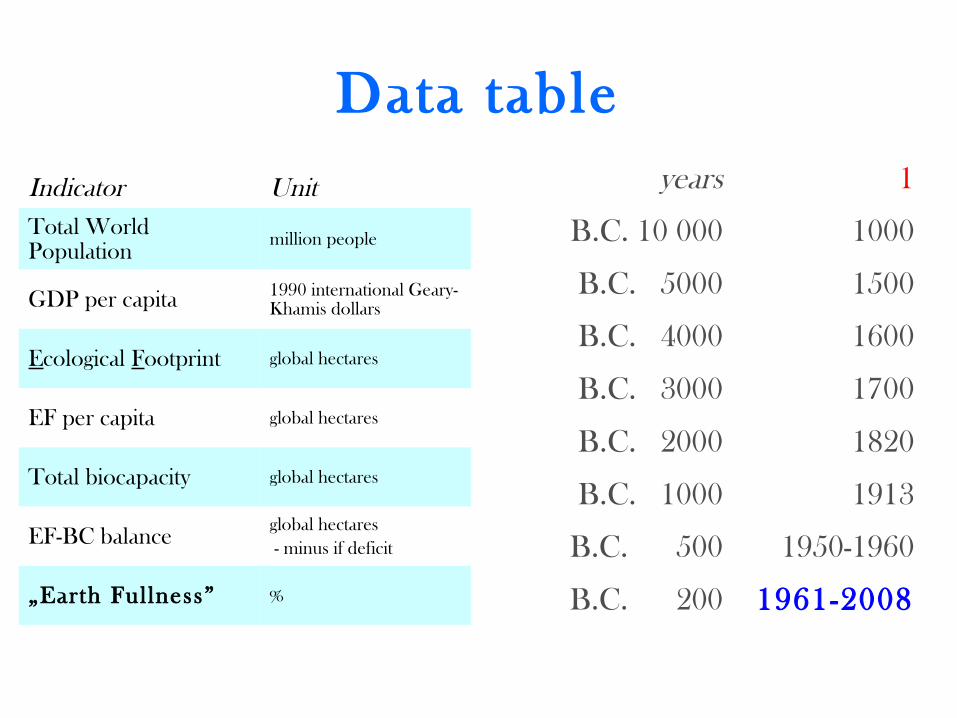
Data tableyears 1
B.C. 10 000 1000
B.C. 5000 1500
B.C. 4000 1600
B.C. 3000 1700
B.C. 2000 1820
B.C. 1000 1913
B.C. 500 1950-1960
B.C. 200 1961-2008
Indicator UnitTotal World Population
million people
GDP per capita 1990 international Geary-Khamis dollars
Ecological Footprint global hectares
EF per capita global hectares
Total biocapacity global hectares
EF-BC balance global hectares - minus if deficit
„Earth Fullness” %

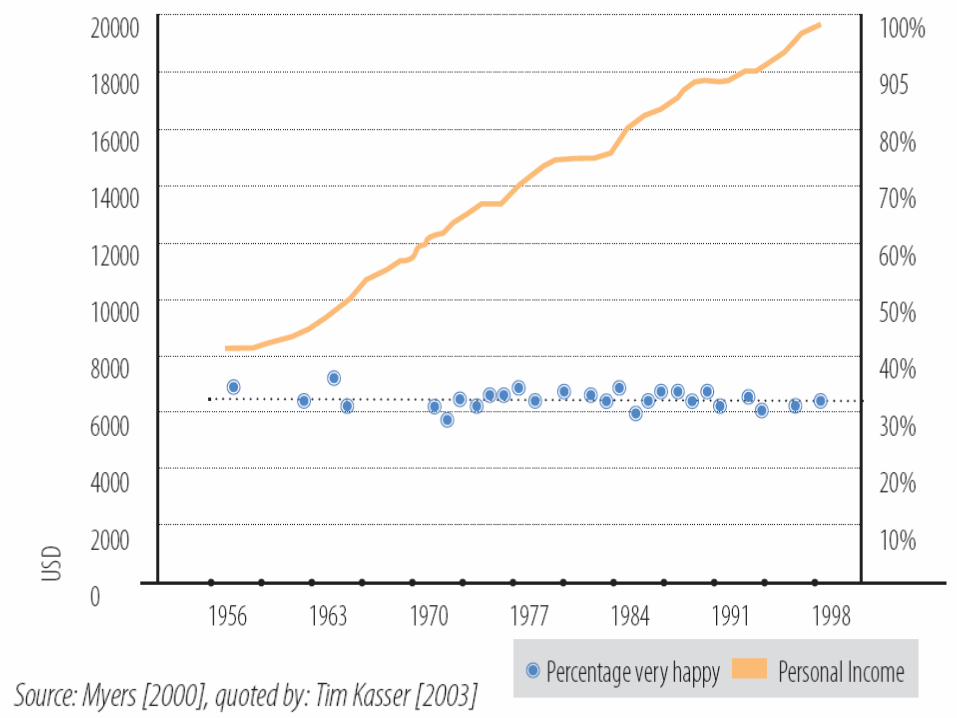
USA: GDP and poor
0
2000
4000
6000
8000
10000
12000
14000
1930193419381942194619501954195819621966197019741978198219861990199419982002
2004: 11 734 bl USD(114 X)
1929: 103 bl USD
Own calculation based on data from U.S. Department of Commerce
1959: 18.5%2004: 10.2%
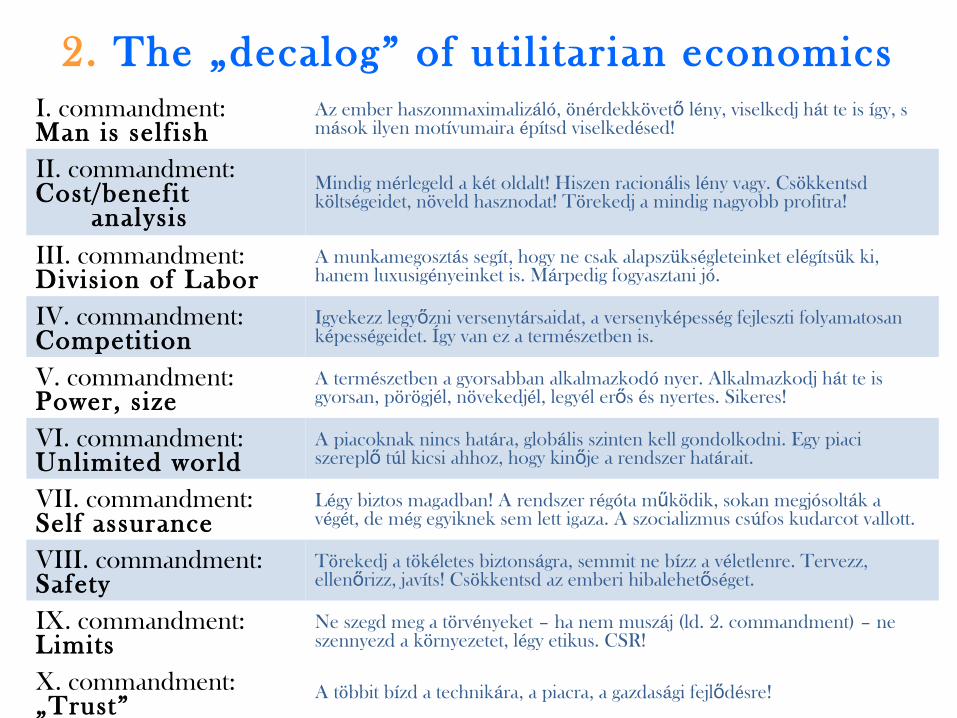
2. The „decalog” of uti l i tarian economicsI. commandment:Man is self ish
Az ember haszonmaximalizáló, önérdekkövet lő ény, viselkedj hát te is így, s mások ilyen motívumaira építsd viselkedésed!
II. commandment:Cost/benefit
analysisMindig mérlegeld a két oldalt! Hiszen racionális lény vagy. Csökkentsd költségeidet, növeld hasznodat! Törekedj a mindig nagyobb profitra!
III. commandment:Division of Labor
A munkamegosztás segít, hogy ne csak alapszükségleteinket elégítsük ki, hanem luxusigényeinket is. Márpedig fogyasztani jó.
IV. commandment:Competit ion
Igyekezz legy zni versenytő ársaidat, a versenyképesség fejleszti folyamatosan képességeidet. Így van ez a természetben is.
V. commandment:Power, s ize
A természetben a gyorsabban alkalmazkodó nyer. Alkalmazkodj hát te is gyorsan, pörögjél, növekedjél, legyél er s ő és nyertes. Sikeres!
VI. commandment:Unlimited world
A piacoknak nincs határa, globális szinten kell gondolkodni. Egy piaci szerepl tő úl kicsi ahhoz, hogy kin je a rendszer hatő árait.
VII. commandment:Self assurance
Légy biztos magadban! A rendszer régóta m kű ödik, sokan megjósolták a végét, de még egyiknek sem lett igaza. A szocializmus csúfos kudarcot vallott.
VIII. commandment:Safety
Törekedj a tökéletes biztonságra, semmit ne bízz a véletlenre. Tervezz, ellen rizz, javő íts! Csökkentsd az emberi hibalehet ső éget.
IX. commandment:Limits
Ne szegd meg a törvényeket – ha nem muszáj (ld. 2. commandment) – ne szennyezd a környezetet, légy etikus. CSR!
X. commandment:„Trust”
A többit bízd a technikára, a piacra, a gazdasági fejl dő ésre!
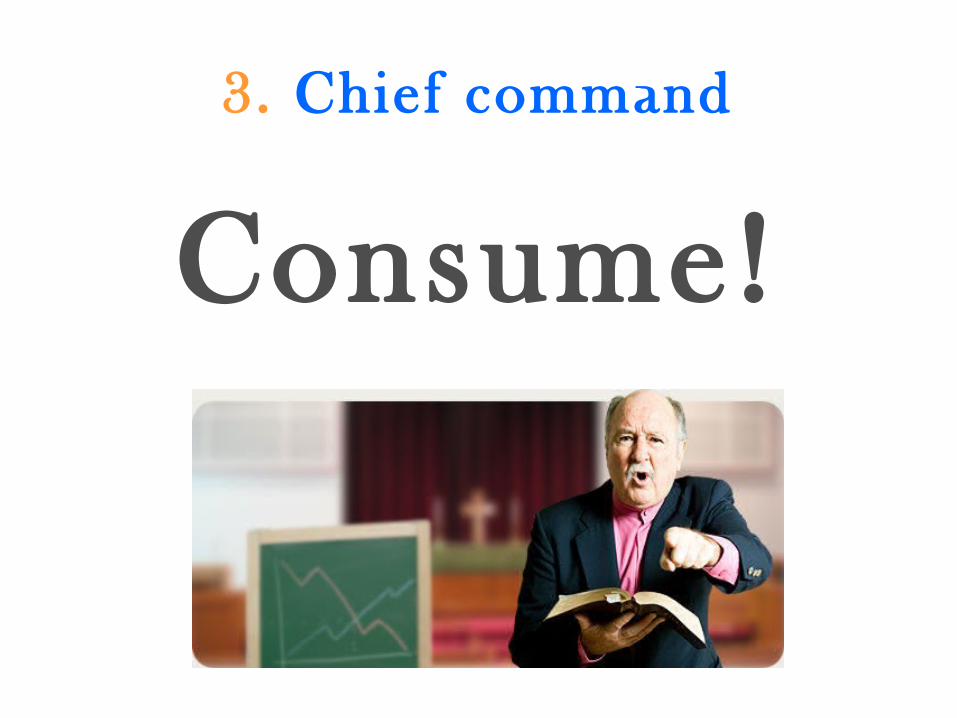
3. Chief command
Consume!

But what is economics?
Making money? A Science? Natural Science? Paradigm?
Religion!

Per capita ecological footprint and GDP from 10,000 BC to 2008
0,00
1,00
2,00
3,00
4,00
-10 000-1 000
1500 1950 1955 1960 1965 1970 1975 1980 1985 1990 1995 2000 2005
Ecological footprint per capita [global hectare]
Ecological footprint per capita [globalhectare]
0
2000
4000
6000
8000
-10 000-1 000
1500 1950 1955 1960 1965 1970 1975 1980 1985 1990 1995 2000 2005
Per Capita GDP [1990 International Geary-Khamis dollars]
Per Capita GDP [1990 InternationalGeary-Khamis dollars]
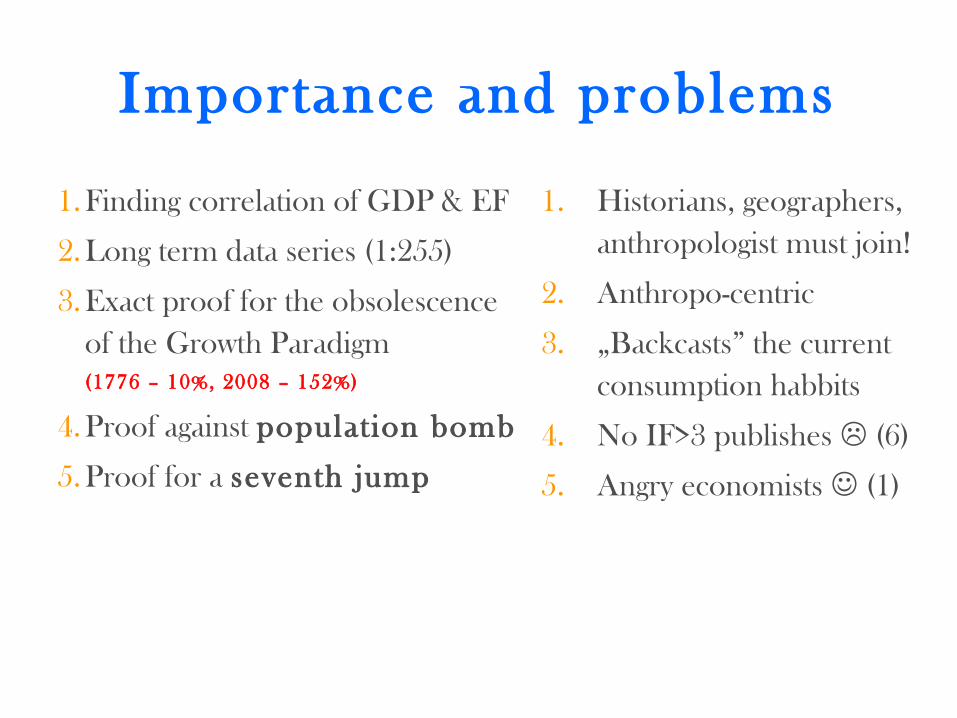
Importance and problems
1.Finding correlation of GDP & EF
2.Long term data series (1:255)
3.Exact proof for the obsolescence of the Growth Paradigm (1776 – 10%, 2008 – 152%)
4.Proof against populat ion bomb
5.Proof for a seventh jump
1. Historians, geographers, anthropologist must join!
2. Anthropo-centric
3. „Backcasts” the current consumption habbits
4. No IF>3 publishes (6)
5. Angry economists (1)

Input data, in signif icant historical moments
Era(Year)Variable
Birth of Agriculture
(10,000 B.C.)
First Civilizations(3000 B.C.)
European Conquests
(1500)
Technological-Scientific (R)evolution
(1820)
2008
GDP per capita (G-K $) 467 467 566 666 7614Total
Population (million) 4 14 438.43 1041.71 6 694.83
Sources: Keynes (1930), Kremer (1993), Maddison (2008), Takács-Sánta András (2004)

Eco-footprint and Earth-fullness from 10.000 B.C. to 2008
YearWorld
population [million]
Per Capita GDP
[1990 Int'l G-K
dollars]
EF per capita [global hectare]
Total EF [1000 global
ha]
Total biocapacity [1000 global
ha]
Footprint balance
[global ha – minus if deficit]
Earth fullness
[%]
-10 000 4 467 1,21 4,8 9 975,3 9 970,5 0,05%
-5 000 5 467 1,21 6,0 9 975,3 9 969,3 0,06%
-4 000 7 467 1,21 8,4 9 975,3 9 966,9 0,08%
-3 000 14 467 1,21 16,9 9 975,3 9 958,4 0,17%
-2 000 27 467 1,21 32,6 9 975,3 9 942,7 0,33%
-1 000 50 467 1,21 60,3 9 975,3 9 915,0 0,60%
-500 100 467 1,21 120,7 9 975,3 9 854,6 1,21%
-200 150 467 1,21 181,0 9 975,3 9 794,3 1,81%
1 226 467 1,21 272,5 9 975,3 9 702,8 2,73%
1000 267 453 1,20 321,2 9 975,3 9 654,1 3,22%
1500 438 566 1,25 546,5 9 975,3 9 428,8 5,48%
1600 556 596 1,26 699,8 9 975,3 9 275,5 7,02%
1700 603 615 1,27 764,0 9 975,3 9 211,3 7,66%
1820 1 042 666 1,29 1 339,9 9 975,3 8 635,4 13,43%
1950 2 528 2 111 1,86 4 712,9 9 975,3 5 262,4 47,25%
1970 3 691 3 729 2,77 10 208,8 10 230,8 22,1 99,78%
1990 5 269 5 150 2,66 14 063,9 11 282,1 -2 781,9 124,66%
2008 6 695 7 614 2,70 18 191,7 11 967,5 -6 224,2 152,01%

„The ideas of economists and political philosophers, both when they are right and when they are wrong, are more powerful than is commonly understood. Indeed the world is ruled by little else. Practical men, who believe themselves to be quite exempt from any intellectual influence, are usually the slaves of some defunct economist. Madmen in authority…”
„It is ideas, not vested interests, which are dangerous for good or evil.”
J. M. Keynes, 1935.

(1986) 2008
1945
1492 (1640)
1760 (1789)
476
B.C. a.D.
1269
1776
1936
333
Embe
dmen
t of t
he e
cono
my
in s
ocie
ty (-
)

John Maynard Keynes, 1930.
„For at least another hundred years we must pretend to ourselves and to everyone that fair is foul and foul is fair; for foul is useful and fair is not. Avarice and usury and precaution must be our gods for a little longer still. For only they can lead us out of the tunnel of economic necessity into daylight.”

2008
1945
1789
1848 1989
Embe
dmen
t of t
he e
cono
my
in s
ocie
ty (-
)What about marxism?

1971-1986-2008
1973
1375
Embe
dmen
t of t
he e
cono
my
in s
ocie
ty (-
)
2012
2006
Religious economics

Source: GFN [2011]: Global Footprint Network Annual Report 2010, p. 28-29.
Ecological footprint: Debtors and Creditors

Impossible to be human and sustainable
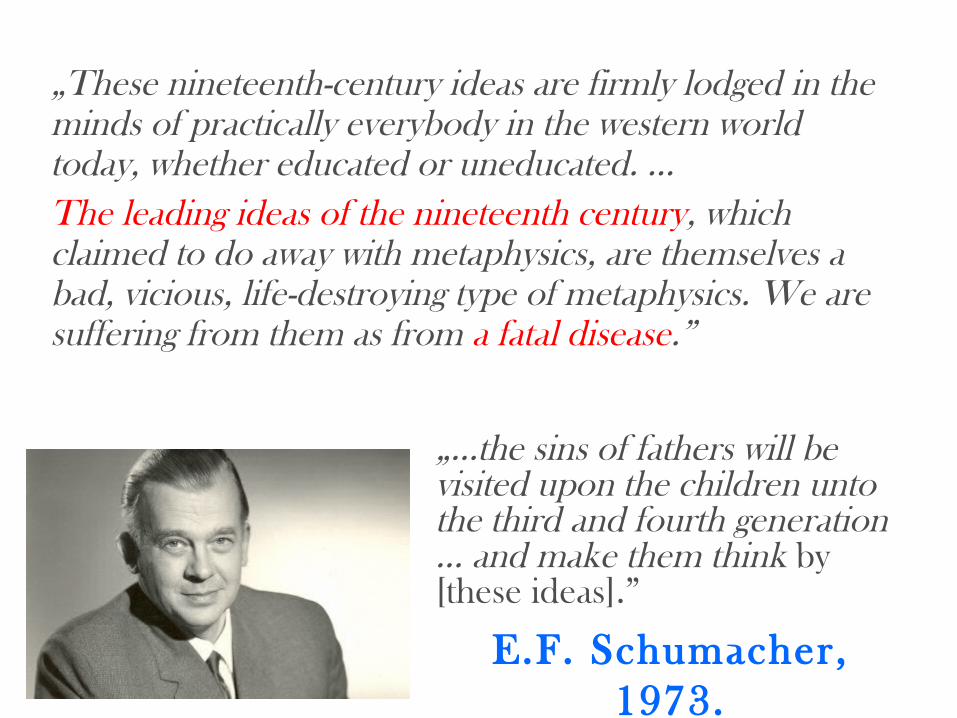
„These nineteenth-century ideas are firmly lodged in the minds of practically everybody in the western world today, whether educated or uneducated. …The leading ideas of the nineteenth century, which claimed to do away with metaphysics, are themselves a bad, vicious, life-destroying type of metaphysics. We are suffering from them as from a fatal disease.”
„…the sins of fathers will be visited upon the children unto the third and fourth generation … and make them think by [these ideas].”
E.F. Schumacher, 1973.
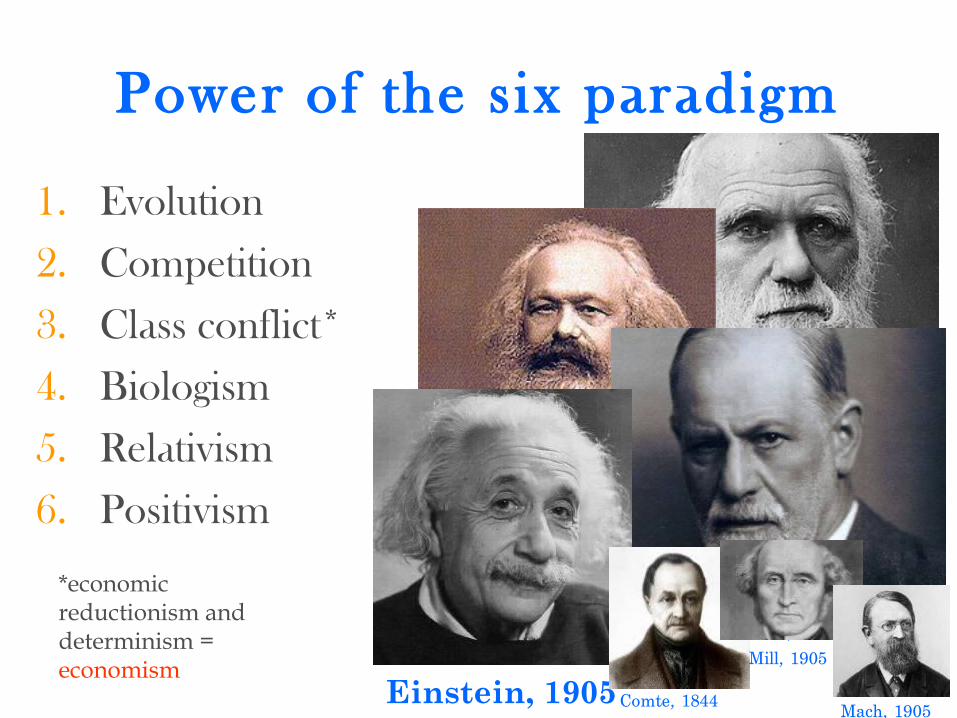
Power of the six paradigm
1. Evolution
2. Competition
3. Class conflict*
4. Biologism
5. Relativism
6. Positivism
*economic reductionism and determinism = economism
Darwin, 1859
Marx, 1848
Freud, 1917
Einstein, 1905Comte, 1844
Mill, 1905
Mach, 1905

Content
3. How
2. What
The Miscarriage of Economism1. Why
Moral vs. Utilitarian Economics
Bionomy – Economic Theology
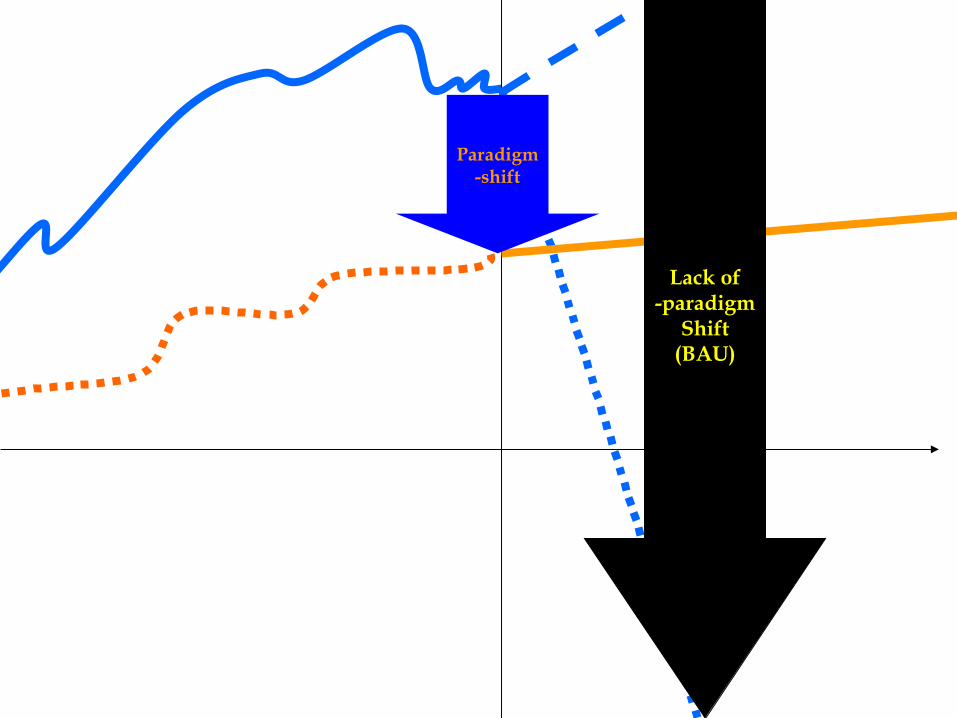
Lack of-paradigm
Shift(BAU)
Paradigm-shift

Capitalism(mainstram economics)
Reformers and challangers of economism
Alternative
economicsReligious moral
teachingsSustainability
„science”
Socialism
Feudalism
Somethingism(42)

Economic theories of SDBionomia is a new kind of economic theory, which is based
on the thorough study of the laws of life, with the primary objective of serving life, especially human communities.
Economic theology is an economic philosophy from the school of moral economics,
which considers material goods as a means to advance towards God, to human improvement,
which embraces the economic teaching of world religions, alternative schools of economics and sustainable
development science.
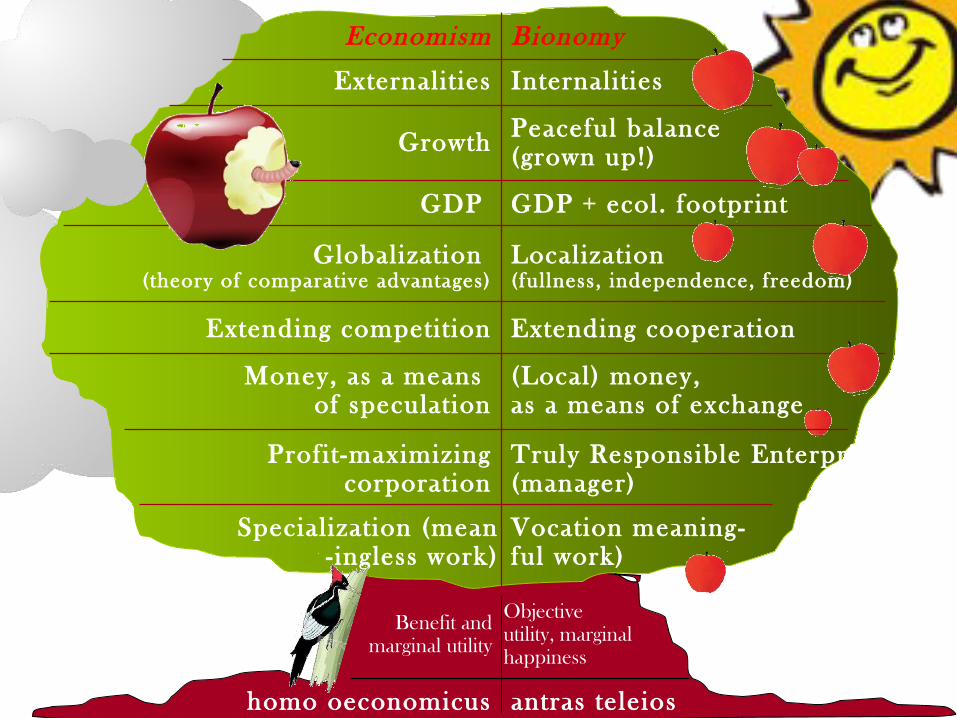
homo oeconomicus
Objective utility, marginal happiness
Benefit and marginal utility
Vocation meaning-ful work)
Specialization (mean-ingless work)
Truly Responsible Enterprise (manager)
Profit -maximizing corporation
(Local) money, as a means of exchange
Money, as a means of speculation
Extending cooperationExtending competit ion
Localization (fullness, independence, freedom)
Globalization (theory of comparative advantages)
GDP + ecol. footprint GDP
Peaceful balance (grown up!)Growth
Internalit iesExternalit ies
BionomyEconomism
antras teleios
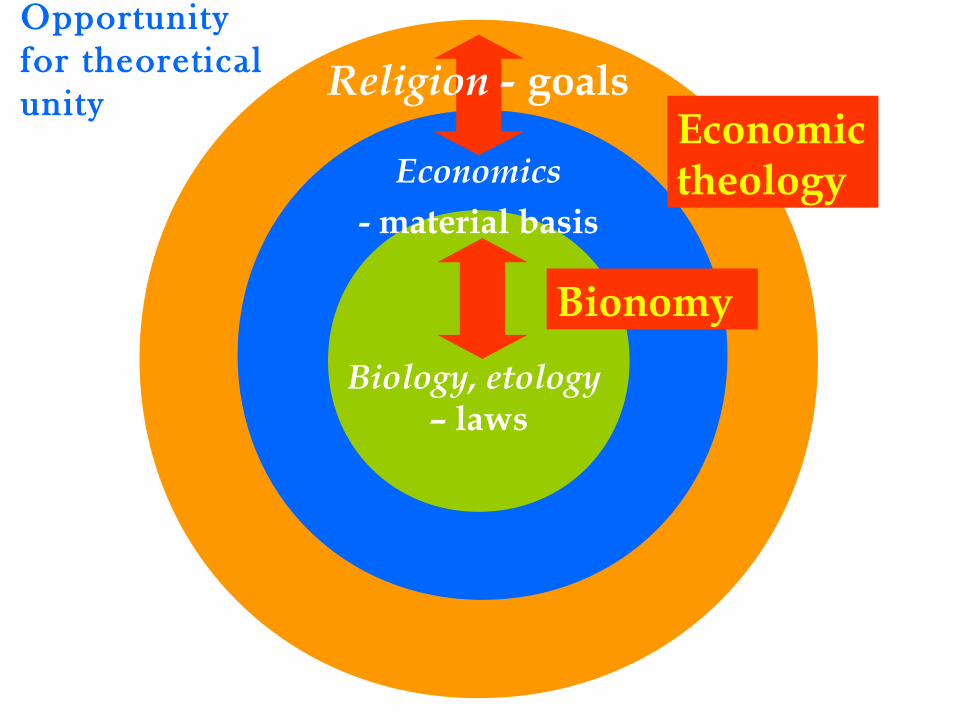
Biology, etology – laws
Religion - goals
Economics- material basis
Economic theology
Bionomy
Opportunity for theoretical unity

Gaps in existence
1.1. GodGod
2. Angel
3. Community
4. Man
5. Animal
6. Plant
7. Machine
8. Material
9. Nothing
Utilitarian econom
ics
Bionomia
Economic theology
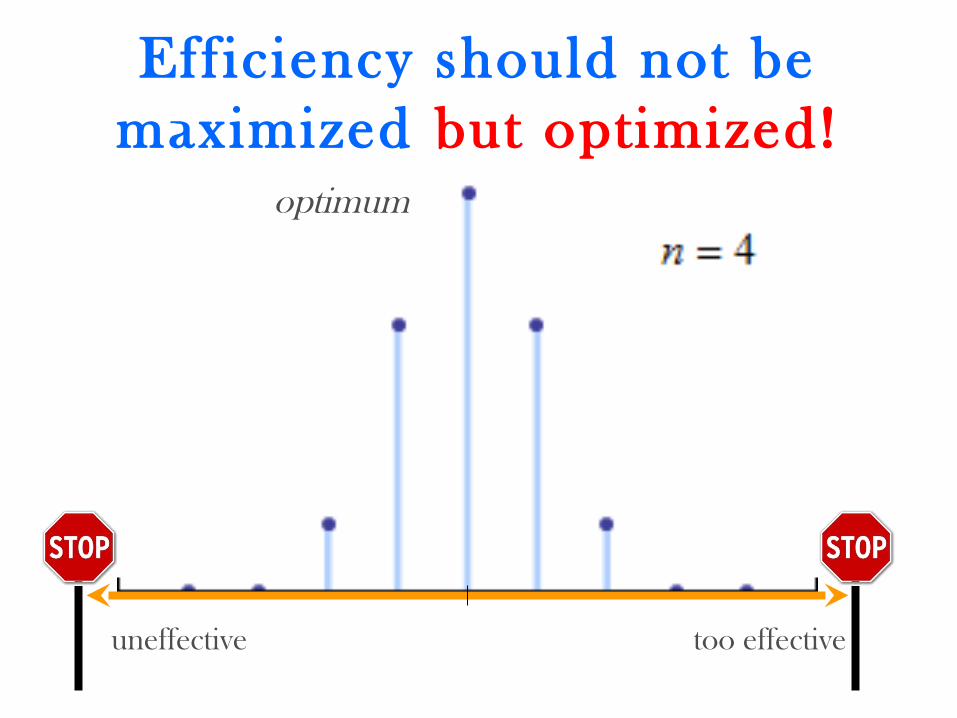
too effectiveuneffective
optimum
Efficiency should not be maximized but optimized!

Rethinking eff iciency
X Efficiency means
Y Effectiveness own goal
Z Public-effectiveness
public goal

„We are not blindly opposed to progress … we
are opposed to blind progress”

Thank you for your attention!
OK, I tell them. But they won’t
like it…