from terman to today · from terman to today: a century of findings on intellectual precocity david...
TRANSCRIPT
Review of Educational ResearchDecember 2016, Vol. 86, No. 4, pp. 900 –944
DOI: 10.3102/0034654316675476© 2016 AERA. http://rer.aera.net
900
From Terman to Today: A Century of Findings on Intellectual Precocity
David LubinskiVanderbilt University
One hundred years of research (1916–2016) on intellectually precocious youth is reviewed, painting a portrait of an extraordinary source of human capital and the kinds of learning opportunities needed to facilitate exceptional accomplishments, life satisfaction, and positive growth. The focus is on those studies conducted on individuals within the top 1% in general or specific (mathematical, spatial, or verbal reasoning) abilities. Early insights into the giftedness phenomenon actually foretold what would be scientifically demon-strated 100 years later. Thus, evidence-based conceptualizations quickly moved from viewing intellectually precocious individuals as weak and emo-tionally labile to highly effective and resilient individuals. Like all groups, intellectually precocious students and adults have strengths and relative weaknesses; they also reveal vast differences in their passion for different pursuits and their drive to achieve. Because they do not possess multipotenti-ality, we must take a multidimensional view of their individuality. When done, it predicts well long-term educational, occupational, and creative outcomes.
Keywords: gifted, intellectual precocity, talent development, intelligence, creativity, life span development, longitudinal studies, individual differences, quasi-experimental research, survey research, psychological measurement, replication
In 1916, when Lewis Terman published his translation and updating of the Binet–Simon Intelligence Scale, called the Stanford–Binet, he also planted the seed for the eventual emergence of the field of giftedness. In the 100 years since then, that seed not only germinated and took hold, but it also blossomed into a prolific scientific, multidimensional research program. In this article, I will try to describe some of the markers on the path that has taken us to the present-day conceptions of giftedness from the predominant view in 1916 as a phenomenon that is “early to ripe, early to rot,” or of individuals who are physically weak and emotionally unstable.
Myths, such as women being unable to learn and achieve at high levels without compromising fertility to ability differences within the top 1% not mattering for real-world accomplishments, comprised conventional wisdom then. They were quickly dispelled by Hollingworth and Terman (e.g., Terman, 1925). By the 1930s,
675476 RERXXX10.3102/0034654316675476LubinskiA Century of Findings on Intellectual Precocityresearch-article2016
at VANDERBILT UNIVERSITY LIBRARY on November 29, 2016http://rer.aera.netDownloaded from

A Century of Findings on Intellectual Precocity
901
a quite different picture of the gifted child had emerged: a socially able and mature individual, who was physically robust and desirous of taking on challenging intel-lectual tasks (see Supplemental Note 1, available in the online version of the journal).1,SN1 In one of his last publications, reflecting on the progress achieved over those initial decades of scientific inquiry, Terman (1954a) affirmed the impor-tance of initially utilizing measures of general intelligence to identify participants who would go on to achieve educationally and professionally at high levels, which was the case when the gifted field was freshly hatched. He then added that
[s]uch tests do not, however, enable us to predict what direction the achievement will take, . . . both interest patterns and special aptitudes play important roles in the making of a gifted scientist, mathematician, mechanic, artist, poet, or musical composer. (Terman, 1954a, p. 224)
He foretold where the field would be 100 years after its launch.So, whereas the first 50 years of research on precocious learners utilized selec-
tion procedures based on general intellectual ability, the past 50 years saw a movement to and an acceptance of the need for selection based on specific abili-ties. Thereby, the past 50 years have provided a much more nuanced portrait of the diversity and individuality of these talented young people.2 Moreover, we now know much more about their attributes, needs, and development than we did when Terman departed 60 years ago (cf. Boring, 1959).
Comprehensively covering 100 years work in the area of giftedness in a single article is not possible without choices being made. Thus, this review examines findings on the interest patterns and special aptitudes of the intellectual precocious, defined here as those being in the top 1% on measures of either general or specific—mathematical, spatial, and verbal reasoning—abilities. Moreover, because espe-cially powerful evidence has come from longitudinal studies conducted over multiple decades, such studies will be privileged. As well, the focus will be further narrowed to studies attempting to ascertain the unique personal qualities giving rise to different forms of educational accomplishments and occupational groupings as well as the contrasting aspects of human individuality indicative of different kinds of creativity (e.g., refereed publications across diverse disciplines, patents, academic tenure, and leadership positions in a variety of impactful organizations and occupational roles). Given the importance of human capital for our modern-day, conceptual economy, this narrowing seemed appropriate and most timely.
Thus, this study is a wide-ranging review of intellectual precocity and how different personal qualities within this special population factor into qualitatively different accomplishments. Such findings inform research and practice in educa-tion and the learning sciences as well as multidisciplinary agendas ranging from economic and sociological outcomes to cross-cultural procedures for developing the many different kinds of talents required to compete in global economies.
Method
Review Design Features
Because this review focuses on long-term educational, occupational, and cre-ative outcomes among individuals within in the top 1% of general or specific
at VANDERBILT UNIVERSITY LIBRARY on November 29, 2016http://rer.aera.netDownloaded from
Lubinski
902
intellectual abilities, priority is given to empirical studies with particular method-ological features. Since the top 1% contains over one-third the ability range (e.g., for IQ units, approximately 137 to over 200), to evaluate the scientific signifi-cance of individual differences within this range requires ability measures with high ceilings, low base rate criteria (indicative of rare accomplishments), and pro-tracted longitudinal time frames to determine not only the meaningfulness of early adolescent assessments but also to allow sufficient time for expertise to develop. By definition, precocious youth are rare, and so are exceptional achieve-ments. Therefore, reliably indexing each is needed to ascertain the extent to which these two rare events covary. In addition, because general and specific abilities give rise to many outcomes (as a function of their level and configuration, per-sonal preferences, and opportunity), designs involving multiple criteria and large samples are required. Multiple criteria are needed because investing in one rare form of achievement often precludes doing so in another. Large samples are nec-essary to establish robust statistical trends (cf. Ackerman, 2014).
This review focuses on variables that engender differential outcomes among intellectually talented youth as well as outcomes used to validate edu-cational interventions and opportunities. To ensure that robust empirical rela-tionships surface, replicated findings revealing longitudinal consistency are given priority (Open Science Collaboration, 2015). Finally, mixed-methods approaches that combine idiographic and normative assessments, and mea-sures that include all three generic data sources (Cattell, 1957)—Q data (ques-tionnaires), T data (tests or objective assessments), and L data (life record)—are given primacy.
Another criterion for selection into this review is proportionality. Following Jenkins (1981, p. 224),
[I]f you are concerned with improving the output of some complex system, you must study the component that produces the largest variance first. Adjusting or correcting smaller sources of variance has no appreciable effect on the output of the system as long as the major source of variance is uncontrolled.
Every variable introduced has met the screening criterion, “Is this variable impor-tant to take into account for understanding consequential educational, occupa-tional, or creative outcomes among intellectually talented populations over protracted intervals?” This review focuses on variables that matter and their sub-stantive significance is illustrated through graphic displays when possible. Readers should be able to “see” readily why a finding is important with the naked eye. Findings and studies that do not accord with these considerations are given less weight.
Finally, following Meehl (1978, 1990), in the early stages of theoretical devel-opment, function-form, and pattern are often more important than statistical sig-nificance (see also Steen, 1988). This idea is leveraged so that distinct patterns of individual differences giving rise to differential learning and development can be uncovered. All things considered, studies of intellectually talented youth involv-ing multi-attribute designs using multiple abilities or abilities combined with motivational proclivities (e.g., interests and values) for predicting concrete
at VANDERBILT UNIVERSITY LIBRARY on November 29, 2016http://rer.aera.netDownloaded from

A Century of Findings on Intellectual Precocity
903
outcomes are stressed. Particular attention is given to the added value or incre-mental validity of each predictor set relative to others.
Selection of Constructs and Measures
Just as Spearman (Spearman & Jones, 1950) and Thurstone (1948) came to an empirically driven compromise about general and specific abilities over the course of their careers, psychometricians since have reached consensus that intellectual abilities are organized hierarchically (Carroll, 1993; Corno et al., 2002; Detterman, 2014; Hunt, 2011; Jensen, 1998a, 1998b; Mackintosh, 2011; Messick, 1992; Snow, Corno, & Jackson, 1996; Snow & Lohman, 1989; Warne, 2015). Different labels have been attached to the central dimension of this intellectual hierarchy’s apex. That is, g, fluid reasoning ability, general intelligence, general mental ability, and IQ essentially denote the same overarching construct.
Carroll’s (1993) three-stratum organization of intellectual abilities, arguably the most comprehensive and definitive model, is based on extensive and meticu-lous analyses of over 460 data sets collected over the past century. However, the number of dimensions beyond the general factor are too numerous for this wide-ranging review. Thus, for a general outline of the major dimensions of intellectual functioning beyond a dominant dimension of general abstract/symbolic process-ing and reasoning capability, the radex model of three specific abilities is utilized.These abilities mirror the three distinct symbolic systems—quantitative/numeri-cal, spatial/figural, and verbal/linguistic. Several major handbooks and publica-tions employ its comprehensiveness as a wide-angle organizational lens (see Corno et al., 2002; Gustafsson, 2002; Guttman, 1954; Lubinski & Dawis, 1992; Snow et al., 1996; Snow & Lohman, 1989).
Therefore, studies of select samples within the top 1% that use either the over-arching general dimension or one of the other specific abilities named are reviewed. Studies that select participants through above-level testing (i.e., studies that select young adolescents using measures designed for older age groups and young adults) will be particularly stressed, as these are especially well-equipped for differentiating the full scope of their individuality.3
Outcome Criteria
Following Thorndike’s (1949) classic nomenclature of immediate, intermedi-ate, and ultimate criteria, a premium will be placed on ultimate criteria assessed over protracted intervals (i.e., “remote criteria,” following Humm, 1946). Examples are concrete outcomes such as educational degrees, or criteria such as occupational income, level of responsibility, prestige, and type, or genuine cre-ative outcomes (e.g., academic tenure, patents, refereed publications, and presti-gious awards).
A Conceptual Framework
Two major longitudinal studies structure this review. At Julian C. Stanley’s Festschrift, Lee J. Cronbach (1992a) remarked that “[I]n 100 years, when the his-tory of gifted education is written, Lewis Terman and Julian Stanley are the two names that will be remembered” (cf. Benbow & Lubinski, 1996). Each contributed immensely to developing successive waves of scientists and practitioners in the
at VANDERBILT UNIVERSITY LIBRARY on November 29, 2016http://rer.aera.netDownloaded from

Lubinski
904
gifted field (Benbow & Lubinski, 2006; Boring, 1959; McNemar & Merrill, 1942; Rogers, 1999). For the purposes of this review, what history will remember most is that Terman and Stanley each launched a major longitudinal study of intellectually talented youth and identified hundreds of adolescents within the top 1% of general and specific intellectual abilities, respectively. Terman’s study began in 1921, Stanley’s in 1971. Terman’s major research findings are published in six volumes (Burks, Jensen, & Terman, 1930; Cox, 1926; Holahan, Sears, & Cronbach, 1995; Terman, 1925; Terman & Oden, 1947, 1959); and the major findings of Stanley’s early SMPY (Study of Mathematically Precocious Youth) research, before his shift in focus to counseling exceptionally talented youth, are found in six volumes as well (Benbow & Stanley, 1983; Fox, Brody, & Tobin, 1980; George, Cohen, & Stanley, 1979; Keating, 1976; Stanley, George, & Solano, 1977; Stanley, Keating, & Fox, 1974). Concomitant with and for decades following these two ground-breaking studies, findings from each stimulated profitable research and aligned with large-scale findings on national probability samples across mainstream social sciences (e.g., Project TALENT; http://www.projecttalent.org/).
Terman’s (1925) Genetic Studies of Genius4 is arguably the most famous lon-gitudinal study in psychology: 1,528 adolescents identified as in the top 1% of general intellectual ability through individually administered Stanford–Binet IQ tests given (primarily) in the early 1920s. This landmark study endeavored to uncover the characteristics and learning needs of intellectually talented youth and provide a greater psychological understanding of this group, who were seen as a valuable national resource. Through one-on-one interviews and surveys (with participants, parents, spouses, and teachers), Terman collected outcomes and self-reports on these participants throughout his life; his students and other collabora-tors did so subsequently (Elder, Pavalko, & Hastings, 1991; Holahan et al., 1995; Holahan, Holahan, & Wonacott, 1999; Oden, 1968; Sears, 1977). The project con-tinues to advance knowledge today, particularly with respect to physical health outcomes and psychological well-being (Friedman & Martin, 2011).
Fifty years after Terman’s study began, Stanley (1996; Keating & Stanley, 1972) launched the SMPY. SMPY was transferred to Camilla P. Benbow in 1985 (who initially developed the plan to track these participants beyond their early educational outcomes to ages 18, 23, 33, 50, and 65). She and David Lubinski have been codirecting SMPY since 1991. SMPY’s database has since grown to include over 5,000 intellectually talented participants and five cohorts (Lubinski & Benbow, 2006). Four cohorts (1972–1974, 1976–1979, 1980–1983, and 1987–1997) were identified by group-administered assessments. A fifth SMPY cohort of 714 top math–science graduate students was identified as first- and second-year graduate students and psychologically profiled in 1992 (Lubinski, Benbow, Shea, Eftekhari-Sanjani, & Halvorson, 2001; Lubinski, Benbow, Webb, & Bleske-Rechek, 2006). The first three SMPY cohorts were selected at ages 12 and 13: Young adolescents’ scoring in the top 3% to 5% on conventional achievement tests routinely administered in their schools were invited to talent searches utiliz-ing above-level assessments (Keating & Stanley, 1972; Olszewski-Kubilius, 2015; Warne, 2012), where they took college entrance exams assessing specific abilities (viz., mathematical and verbal reasoning assessed by the SAT-M and SAT-V). Participants were then selected for longitudinal study if they scored
at VANDERBILT UNIVERSITY LIBRARY on November 29, 2016http://rer.aera.netDownloaded from

A Century of Findings on Intellectual Precocity
905
within the top 1% on (initially) SAT-M or (eventually) SAT-V. The move from individual to group-administered assessment was an enormous advantage for research on students with intellectual precocity, and it proved equally revolution-ary for gifted education.
When Stanley conducted his first talent search in 1972, it consisted of just over 450 participants. Today, around 200,000 seventh and eighth graders take college entrance exams to learn about their abilities and to qualify for educational pro-gramming for intellectually talented youth (Olszewski-Kubilius, 2015; Warne, 2012). “Paradigm shift” is an overused phrase. That above-level testing, however, revolutionized gifted education cannot be overstated. Across major U.S. universi-ties such as Johns Hopkins, Duke, Northwestern, Vanderbilt, Iowa, and Iowa State, thousands of intellectually young adolescents annually qualify for and par-ticipate in fast-paced (accelerated) educational opportunities, wherein many receive credit for a full high school course in three weeks’ time (Assouline, Colangelo, & Vantassel-Baska, 2015; Benbow & Stanley, 1996; Colangelo, Assouline, & Gross, 2004). This practice is now commonplace and provides an opportunity to study the learning needs and personal development of this popula-tion further, as reviewed here.
Normative Benchmarks and Landmarks: Two Baseline Longitudinal Studies
Before the modern findings on intellectual precocity are covered, some histori-cal landmarks and normative empirical findings can provide useful background information. Learned and Wood’s (1928, 1938) classic longitudinal studies on the range of individual differences in achievement found in typical high school and college populations is presented, a study that has influenced the gifted child movement not only early on but through today.
Additionally, toward the end of the first 50-year period under review, Project TALENT was launched (Flanagan et al., 1962). It consists of a stratified random sample of over 1,000 U.S. high schools (N > 400,000 participants). Over the course of a 1-week period in 1960, students in Grades 9 through 12, approximately 100,000 students per grade, were assessed on abilities, academic and everyday information, interests, and personality. They also completed an extensive 398-item background questionnaire. The same ability measures were group-administered to each of the four grades, and subsequently, outcomes were assessed at 1, 5, and 11 years after their high school graduation. Data from this comprehensive study are unparalleled and provide a baseline for the ability levels and patterns found among top 1% intellectually talented youth. Among other things, Project TALENT pro-vides a basis for aligning a series of constructive replications (Lykken, 1968, 1991) of findings, by utilizing experimentally distinct but conceptually equivalent mea-sures over different time periods (cf. Wai, Lubinski, & Benbow, 2009).
Finally, given space limitations, many of the historical volumes cited as well as less central empirical studies are placed in a supplemental list of references (avail-able in the online version of the journal). In addition, five supplementary notes embedded in the text explicate, provide historical context, and further explain content coverage and methodological decisions. They also can lead readers to top-ics that could only be touched upon. These appear as superscripts denoted SN1, SN2, SN3, SN4, and SN5 (available in the online version of the journal).
at VANDERBILT UNIVERSITY LIBRARY on November 29, 2016http://rer.aera.netDownloaded from
Lubinski
906
Results
Historical Signposts and Normative Benchmarks
As Terman launched his longitudinal study in 1921, Hollingworth, Pressey, Thorndike, and others advocated for the special educational needs and the impor-tance of studying intellectually precocious students (Witty, 1951). In a compelling publication in Science, “The Gifted Student and Research,” Seashore (1922) argued that for every 100 incoming college freshman chosen at random, the top five assimilate five times as much information as the bottom five and stressed that these differences necessitate different opportunities for meeting their respective needs. He emphasized that optimal learning environments for all students avoided the undesirable extremes of frustration and boredom destined for appreciable numbers of students when inflexible, lock-step learning environments were enforced upon all.
Adjusting the depth and pace of the curriculum to the rate at which each stu-dent learned would “keep each student busy at his highest level of achievement in order that he may be successful, happy, and good” (italics in original, Seashore, 1922, p. 644). For the gifted, Seashore recommended that instead of whipping them into line, we “whip them out of line.” Seashore (1930, 1942) leveraged this idea when he marshaled his campaign for establishing honors colleges throughout major U.S. universities. Although his name does not always surface in historical treatments of the gifted movement, Seashore’s impact was profound (Miles, 1956). He traveled to 46 of the contiguous states within the United States meeting with university officials to discuss the importance of honors colleges and more challenging curricula and opportunities for the most talented university students.
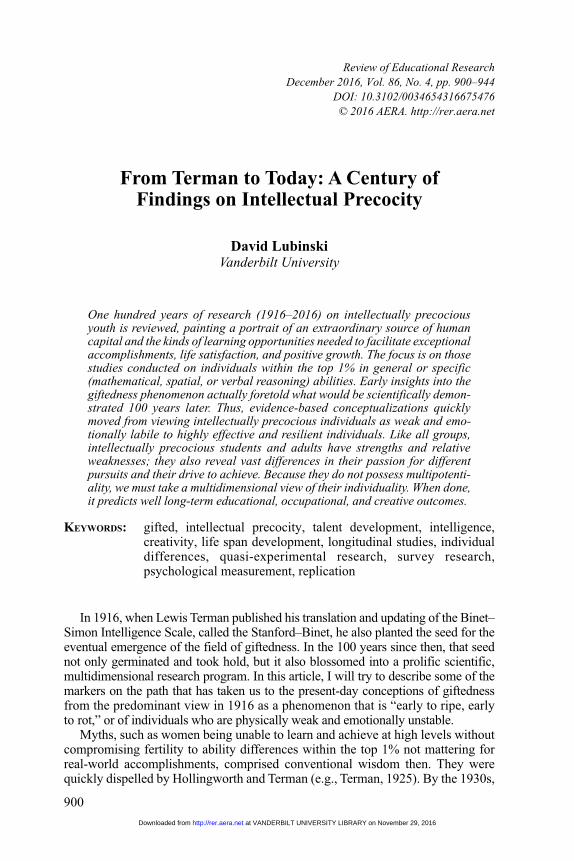
Large-scale empirical evidence for these considerations was introduced a few years later by the extensive longitudinal findings of Learned and Wood (1928, 1938). Figure 1 is reproduced from their extensive analysis of tens of thousands of high school and college students, many of whom were tracked for years and systematically assessed on academic knowledge. For decades, major textbooks on individual differences (Anastasi, 1958; Tyler, 1965; Willerman, 1979) and policy recommendations for restructuring classrooms (Benbow & Stanley, 1996; Pressey, 1949; Terman, 1954a) cited this important study. It was cited as empirical evi-dence for why instruction needs to be adjusted to the individual learning needs of each student—and intellectually precocious students, in particular.
When Terman (1939) reviewed Learned and Wood (1938) for the Journal of Higher Education, he regarded it as the most relevant research contribution that addressed higher education problems in the United States. Terman (1939, p. 111) maintained it “warrants a thorough overhauling of our educational procedures,” because it documented the extent to which vast knowledge differentials exist among students in lock-step systems. It demonstrated that the range of individual differences in knowledge among high school seniors, college sophomores, and college seniors, across wide varieties of professionally developed achievement tests, was vast. For example, about 10% of 12th-grade students younger than 18 years of age had more scientific knowledge than the average college senior. Within all grade levels, younger students were more knowledgeable than the older students. And, if graduation from college were based on demonstrated
at VANDERBILT UNIVERSITY LIBRARY on November 29, 2016http://rer.aera.netDownloaded from
907
knowledge rather than time in the educational system, a full 15% of the entering freshmen class would be deemed ready to graduate. Indeed, they would make the top 20% cut on the broad-spectrum 1,200-item achievement test in the combined (Freshman + Sophomore + Junior + Senior) college sample.SN2
FIGURE 1. Overlapping of total score distributions of high school senior, college sophomore, and college senior men on an extensive battery of cognitive tests. Adapted from Learned and Wood (1938, p. 278).
at VANDERBILT UNIVERSITY LIBRARY on November 29, 2016http://rer.aera.netDownloaded from

Lubinski
908
Another landmark was Pressey’s (1949, p. 2) monograph based on years of research and scholarship on educational acceleration or “progress through an edu-cational program at rates faster or ages younger than conventional.” This publica-tion was at that time, and still is, a remarkable achievement. It pulls together many different sources of empirical evidence on age of graduation, the pacing of educa-tional curricula, subsequent achievements, and subjective descriptions of intel-lectually talented populations as a function of the extent to which they experienced acceleration. This empirical research appeared in highly visible outlets (e.g., Pressey, 1946a, 1946b). On the 50-year anniversary of Terman’s study, Stanley hosted a symposium at Johns Hopkins to mark this historic occasion (see Stanley et al., 1977). In his contribution, on the first 5 years of SMPY promoting educa-tional acceleration, Stanley (1977) remarked,
The most comprehensive study of educational acceleration was the splendid monograph by Pressey (1949). Anyone who can read it carefully and still oppose such acceleration certainly has the courage of his or her preconvictions. Pressey, Hobson, Worcester, and others reveal that opposition to acceleration is founded on emotionalized prejudices rather than facts. . . . We do not know of a careful single study of actual accelerants that has shown acceleration not to be beneficial, though armchair articles against it abound. (p. 94)
Pressey’s (1949) document was both prescient and visionary and, shortly thereafter, he extended it by advancing one of positive psychology’s earliest con-cepts, furtherance (Pressey, 1955). Drawing widely upon his knowledge of gen-eral psychology, Pressey (1955) hypothesized that by securing educational credentials at an earlier age than was typical, intellectually precocious youth have an added advantage in their personal, professional, and creative potential because, in addition to being at the height of their intellectual prowess then, other psycho-somatic systems of energy, interest, and endurance are at their height as well. Accomplishment builds on accomplishment to augment personal strength and psychosomatic vigor, engendering a furtherance of remarkable achievement. Just as Piaget drew on much of Binet’s early work to construct his formulation of child development (Siegler, 1992), conceptual threads of furtherance extend to such subsequent performance-based frameworks as developing “effectance motiva-tion” (White, 1959), “flow” (Csikszentmihalyi, 1993), and “states of excellence” (Lubinski & Benbow, 2000).
According to Pressey (1949),
There should be a broad program aiming expressly at adjustment to individual differences in capacities and rates of development, and recognizing the need also for each individual to move into the accomplishment and full experience of adult life without undue delay. Education may then be far better fitted to the needs of each young person, and years may be added to achievement and the satisfaction of adult self-realization. It is indeed noble when advances in medicine add years to life. But to add a year or so at the end of life might be far less of a contribution to both individual total happiness and total social usefulness than years added to adult living in the very prime of life. (p. 148)
at VANDERBILT UNIVERSITY LIBRARY on November 29, 2016http://rer.aera.netDownloaded from

A Century of Findings on Intellectual Precocity
909
Propelled by these earlier writings, research on the educational efficacy of accel-eration for intellectually talented students flourished. In 2003, a convocation of international leaders in gifted education, sponsored by the Templeton Foundation, met at the University of Iowa. Their charge was to outline best practices in gifted education. A consensus among participants emerged. The educational efficacy of acceleration for intellectually talented youth when students are motivated was uni-formly agreed on by conference participants (based on the evidence).
The conference spawned “A Nation Deceived” (Colangelo et al., 2004), enti-tled to throw light on the extent of neglect and misinformation (see TIME Magazine, September 27, 2004). Recently updated, as “A Nation Empowered” (Assouline, Colangelo, & VanTassel-Baska, 2015; Assouline, Colangelo, VanTassel-Baska, Lupkowski-Shoplik, 2015), this publication documents advances and progress over the ensuing decade. These include the National Mathematics Advisory Panel’s (2008, p. 53) report, which endorses acceleration for mathematically talent youth: “Recommendation: Mathematically gifted stu-dents with sufficient motivation appear to be able to learn mathematics much faster than students proceeding through the curriculum at a normal pace, with no harm to their learning, and should be allowed to do so.”
Modern discussions of educational acceleration view these interventions and opportunities more broadly as examples of “appropriate developmental place-ment.” That concept, relevant to all students, served as a basis for Stanley’s (2000) educational philosophy: “All students have the right to learn something new every day.”SN3 Longitudinal findings over multiple decades revealed enhanced occupa-tional and creative performance when participants who experienced appropriate developmental placement were compared to quasi-experimental controls (Bleske-Rechek, Lubinski, & Benbow, 2004; Park, Lubinski, & Benbow, 2013, Wai, Lubinski, Benbow, & Steiger, 2010). Subjective reports years removed from schooling further demonstrated overall positive experiences and relatively few regrets (Benbow, Lubinski, Shea, & Eftekhari-Sanjani, 2000; Benbow, Lubinski, & Suchy, 1996).
In arguably the longest longitudinal study of acceleration in the literature, Cronbach (1996) compared Terman’s participants who were accelerated versus those who were not:
In many aspects of their adult lives those who had accelerated as a group did not differ from the roughly equated controls. Every nontrivial difference that did appear on a value-laden variable showed those who had been accelerated at an advantage. . . . Frankly, I had not expected to find effects cropping up in responses forty to fifty years after high school graduation. I expected the vicissitudes of life gradually to wash out the initial difference favoring those who had been accelerated. Instead, it appears that their personal qualities or the encouragement and tangible boost given by acceleration, or both, produced a lasting increment of momentum. (p. 190)
In the decade following Pressey’s (1949) monograph, the National Science Foundation assembled a blue ribbon committee chaired by Donald Super to con-duct a literature review of the scientific findings of the nascent personal
at VANDERBILT UNIVERSITY LIBRARY on November 29, 2016http://rer.aera.netDownloaded from

Lubinski
910
characteristics of engineers and physical scientists. The Scientific Careers Project (Super & Bachrach, 1957) included Raymond C. Hummel, John R. Mayor, Harrold B. Pepinski, Anne Roe, Albert S. Thompson, David V. Tiedeman, Leona E. Tyler, Dael Wolfle, and others. When Sputnik was launched in 1957, intellectually tal-ented students in the United States suddenly became “all the rage” (Hobbs, 1958). Political leaders and the population generally became concerned about America’s status in the “space race.” Super and Bachrach’s committee report concluded that, in addition to superior levels of general intelligence, promising engineers and physical scientists tend to be highly facile in mathematical and spatial reasoning ability and also possess regnant scientific interests. They further recommended longitudinal studies of such youth over the course of 10 to 15 years to uncover bar-riers and facilitators of their educational and occupational development.
Shortly thereafter, Project TALENT was launched (Flanagan et al., 1962). As described in the Method section, Project TALENT is unparalleled; and the con-clusions ventured in the 1957 National Science Foundation report were largely supported by Project TALENT’s longitudinal findings. For example, Project TALENT data found in Figure 2 reveals the joint operation of level and pattern of both general and specific abilities, as well as how they unfold over time across nine categories of undergraduate/graduate terminal degrees. With respect to gen-eral ability, the familiar intellectual hierarchy of disciplines from Business/Education to Math/Science is shown on the x-axis. The higher levels of ability associated with more advanced terminal degrees is shown on the y-axis: doctor-ates > masters > bachelors.
Figure 2 also demonstrates an important difference in intellectual orientation. Although participants securing advanced terminal degrees in physical science, technology, engineering, and mathematics (STEM) manifest verbal abilities com-mensurate with or exceeding those of members of other disciplines, they also exhibit a distinctive specific-ability pattern. STEM degree holders display higher levels of spatial ability relative to verbal ability, whereas the inverse is true of disciplines ranging from Education to Biology. (Business is the only exception.) The importance of assessing individual differences in both level and pattern sur-faces throughout this review.
Collectively, these important advances in cumulative knowledge on intellectu-ally talented populations were rapidly becoming broadly known among educators and psychological scientists.SN4 Prior to the late-1960s, for example, the range of ability differences between students was common knowledge; it was showcased in major textbooks (cf. Tyler, 1965; Williamson, 1965) and it was highlighted in widely circulated outlets such as the prestigious Bingham Lecture Series, pub-lished in the American Psychologist (Paterson, 1957; Terman, 1954a; Wolfle, 1960, 1969). The demonstrative scope of differential learning rates among stu-dents was unhesitatingly drawn on by distinguished psychological theorists, as diverse as Gordon Allport and B. F. Skinner, for developing optimal learning environments to serve all students:
It is my own conviction that most of our institutions of higher learning offer intellectual fare distressingly below the digestive capacity of the gifted. I am not thinking of
at VANDERBILT UNIVERSITY LIBRARY on November 29, 2016http://rer.aera.netDownloaded from

911
colleges that offer frivolous courses in fudge-making, but of our “best” institutions, where courses are often repetitive, routine, and devoid of challenge. Perhaps from the point of view of the average student they are adequate, but they stretch no nerve in the gifted student. . . . Usually the student does well, and the teacher rejoices, but in many cases the teacher should feel less joy than guilt, for he has, unintentionally, beckoned the gifted student downward toward mediocrity rather than upward to maximum self-development. (Allport, 1960, p. 68)
Failure to provide for differences among students is perhaps the greatest source of inefficiency in education.
[I]t is still standard practice for large groups to move forward at the same speed, cover much the same material, and reach the same standards for promotion from one grade to the next. The speed is appropriate to the average or mediocre student. Those who could
FIGURE 2. Average z-scores of participants on verbal, spatial, and mathematical ability for terminal bachelor’s degrees, terminal master’s degrees, and doctoral degrees plotted by field. The groups are plotted in rank order of their normative standing on g (verbal [V] + spatial [S] + mathematical [M]) along the x-axis, and the lines with arrows from each field indicate where these disciplines average in general mental ability in z-score units. This figure is standardized in relation to all participants with complete ability data at the time of initial testing. Respective Ns for each group (men + women) were as follows for bachelor’s, master’s, and doctorates, respectively: engineering (1,143, 339, 71), physical science (633, 182, 202), math/computer science (877, 266, 57), biological science (740, 182, 79), humanities (3,226, 695, 82), social science (2,609, 484, 158), arts (615, 171 [master’s only]), business (2,386, 191 [master’s + doctorate]), and education (3,403, 1,505 [master’s + doctorate]).*For education and business, master’s degrees and doctorates were combined because the doctorate samples for these groups were too small to obtain stability (N < 30). Adapted from Appendix A in Wai et al. (2009).
at VANDERBILT UNIVERSITY LIBRARY on November 29, 2016http://rer.aera.netDownloaded from
Lubinski
912
move faster lose interest and waste time; those who should move more slowly fall behind and lose interest for another reason. . . . It is not only differences among students which are at issue. One student must move at the same rate in several fields, although he may be able to move more rapidly in one but should move more slowly in another [due to intra-individual differences] . . . [A] technology of teaching will solve many of the problems raised by differences among students. It will not, however, reduce all students to the same pattern. On the contrary, it will discover and emphasize genuine genetic differences. If it is based on wise policy, it will also design environmental contingencies in such a way as to generate the most promising diversity. (Skinner, 1968, pp. 242–243)
Nowadays, remarks like these are uncommon among educational and psycho-logical scientists outside of the field of intellectual precocity. Compared with ear-lier time points, modern longitudinal findings over the past few decades are not nearly as much a part of the educational and psychological landscape. That is, an unfortunate contrast, inasmuch as modern scientific advances on intellectual pre-cocity hold more relevance for education and the biosocial sciences than ever before (Clynes, 2016; Makel, Kell, Lubinski, Putallaz, & Benbow, 2016).
Modern Educational, Occupational, and Creative Outcomes
Ability LevelThis section examines the range of over 4 standard deviations of ability that
exists beyond the cut score for the top 1%. It represents approximately the top one third of the ability range (i.e., from around 137 to around 200 in IQ units). For years, individual differences within the top 1% of ability have been demonstrated to matter for a host of educational accomplishments (Benbow, 1992; Hollingworth & Cobb, 1928). To what extent, however, do individual differences within this range matter for concrete “real-world” accomplishments? Is there a threshold point at which differences in ability cease to matter and other attributes become more critical? In popular writing, this idea is common. For example, in Outliers: The Story of Success, Malcolm Gladwell (2008, p. 79) wrote, “The relationship between success and IQ works only up to a point. Once someone has an IQ of somewhere around 120, having additional IQ points doesn’t seem to translate into any measurable real-world advantage.” This claim is also asserted by segments of the gifted field, as in the following remarks found in Gifted Child Quarterly (Renzulli, 2012, p. 153): “The reason [for] reference to ‘above average ability’ (as opposed to, e.g., ‘the top 5%’ or ‘exceptional ability’) derives from research that highlights minimal criterion validity between academic aptitude and professional accomplishments (Renzulli, 1976, 1986, 2005).”
Figure 3 presents data from 2,329 SMPY participants (Lubinski, 2009a). Frey and Detterman (2004) documented that the SAT-M plus SAT-V composite con-stitutes an excellent measure of general intelligence (for above-average popula-tions). Therefore, an age 12 SAT composite was formed and parsed into quartiles to array participants on general intelligence. Then, a variety of longitudinal cri-teria secured over two decades later, which reflect rare accomplishments in edu-cation, the world of work, and creative expression (securing a patent, publishing a novel or major literary work, or publishing a refereed scientific article) were
at VANDERBILT UNIVERSITY LIBRARY on November 29, 2016http://rer.aera.netDownloaded from

913
regressed onto the four quartiles. Finally, odds ratios were computed so the top and the bottom quartiles could be compared. All the differences were statistically and substantively significant. There is an old saying in applied social science research, “for a difference to be a difference it must make a difference.” These differences do.
Moving along the gradient of individual differences within the top 1% of general intellectual ability, assessed at age 12, ultimately results in a family of achievement functions that documents that more ability matters. Although the base rate for patents in the United States is 1%, the bottom quartile within the top 1% achieves around five times this rate. And a statistically significant dif-ference between the top and bottom quartiles exists as well—13.2% versus 4.8%, respectively. A significant difference between the top and bottom
FIGURE 3. Participants are separated into quartiles based on their age 13 SAT-M + SAT-V composite. The mean age 13 SAT composite scores for each quartile are displayed in parentheses along the x-axis. Odds ratios (ORs) comparing the likelihood of each outcome in the top (Q4) and bottom (Q1) SAT quartiles are displayed at the end of every respective criterion line. An asterisk indicates that the 95% confidence interval for the odds ratio did not include 1.0, meaning that the likelihood of the outcome in Q4 was significantly greater than in Q1. These SAT assessments by age 13 were conducted before the recentering of the SAT in the mid-1990s; at that time, cutting scores for the top 1 in 200 were SAT-M ≥ 500, SAT-V ≥ 430; for the top 1 in 10,000, cutting scores were SAT-M ≥ 700, SAT-V ≥ 630 by age 13. From Lubinski (2009a).
at VANDERBILT UNIVERSITY LIBRARY on November 29, 2016http://rer.aera.netDownloaded from

Lubinski
914
quartiles in percent with incomes in the top 95th percentile also is observed (10.5% vs. 4.8%, respectively). Typically the incomes earned by the partici-pants are found much later in life, not in their mid-30s as is the case here. Overall, there does not seem to be an ability threshold within the top 1% beyond which more ability does not matter. Other personal attributes such as energy and commitment certainly matter (Ericsson et al., 2006; Eysenck, 1995; Jensen, 1996; Simonton, 1994, 2014), and opportunity clearly always matters. Nevertheless, age 12 ability differences within the top 1% still impart an advantage, even when controlling for terminal educational degree and uni-versity prestige (cf. Park, Lubinski, & Benbow, 2008).
Ability PatternStudies of intellectual precocity have advanced beyond these considerations
and documented the importance of intellectual dimensions beyond general intel-ligence. Park, Lubinski, and Benbow (2007) analyzed a group of over 2,400 intel-lectually talented young adolescents (top 1%) identified with the SAT who had been tracked for over 25 years. Major findings are shown in Figure 4, organized into four Tukey plots. Specifically, adolescents’ SAT composites were plotted on the y-axis and their SAT-M minus SAT-V scores were plotted in the x-axis. This method results in two independent dimensions simultaneously assessing ability level (y-axis) and ability pattern or “tilt” (x-axis). For the latter, positive scores on the x-axis indicate greater ability in mathematical relative to verbal reasoning ability, whereas the inverse is true for scores to the left. Bivariate means for con-crete educational, occupational, and creative outcomes accomplished over 25 years were then plotted in this two-dimensional intellectual space. These means were then surrounded by ellipses, defined by ±1 standard deviation on x and y, respectively, for members in each group.
For all four panels, outcomes in the Humanities and STEM were consistently examined because they had the largest sample sizes needed to justify statistically stable results. However, bivariate points for other outcomes (e.g., MDs, JDs, nov-elists, and nonfiction writers) are also plotted to provide a more complete picture. Moving from 4-year and master’s degrees (Panel a) to doctorates (Panel b) increases ability level and differential ability pattern becomes more distinctive. Tenured faculty at major universities are particularly distinct, as are those who secured refereed publications and patents. Participants achieving these qualita-tively different outcomes occupy different regions of the intellectual space defined by these dimensions.
Differences in ability level and pattern are detectable in early adolescence. Routinely, they go unnoticed because the vast majority of these participants earn close to top possible scores on conventional college entrance examinations well before they graduate from high school (a ceiling problem). At that point, for this population, such assessments are no longer capable of distinguishing the able from the exceptionally able. They are insensitive to their individuality and devel-opmentally inappropriate because they assess individual differences below par-ticipants’ basal level. Such considerations become particularly cogent when attention turns to profoundly gifted youth.
at VANDERBILT UNIVERSITY LIBRARY on November 29, 2016http://rer.aera.netDownloaded from

915
FIGURE 4. Participants’ achievements as a function of ability tilt (SAT-Math score minus SAT-Verbal score) and ability level (sum of both SAT scores), in standard deviation units. Achievement categories were the following: (a) completing a terminal 4-year or master’s degree, (b) completing a PhD (means for MDs and JDs are also shown), (c) securing a tenure-track faculty position, and (d) publishing a literary work or securing a patent. In each graph, bivariate means are shown for achievements in humanities and in science, technology, engineering, and mathematics (STEM), respectively; the ellipse surrounding each mean indicates the space within 1 standard deviation on each dimension. The n for each group is indicated in parentheses. Mean SAT-Math and SAT-V scores, respectively, for each criterion group were the following: 4-year and master’s STEM degree—575, 450; 4-year and master’s humanities degree—551, 497; STEM PhD—642, 499; humanities PhD—553, 572; tenure-track STEM position in a top-50 universities—697, 534; tenure-track humanities position in a top-50 university—591, 557; tenure track STEM position in a non-top-50 university—659, 478; tenure-track humanities position in a non-top-50 university—550, 566; patents (i.e., STEM creative achievements)—626, 471; and publications (i.e., humanities creative achievements)—561, 567. From Park et al. (2007).
at VANDERBILT UNIVERSITY LIBRARY on November 29, 2016http://rer.aera.netDownloaded from
Lubinski
916
Profoundly GiftedHistorically, the profoundly gifted were recognized by Terman’s generation
(Hollingworth, 1926, 1942). The problem was sample size. It took Herculean efforts to assemble Terman’s study of 1,528 participants through individual test-ing, and they were “only” in the top 1% of ability. Over many years of working in the greater New York City area, Hollingworth (1942) was able to identify 12 children with measured IQs ≥180. Yet, because of the recognized extraordinary potential they represent, even hard-nosed empirical outlets such as the Journal of Applied Psychology were willing to devote precious page space to individual case history reports (Garrison, Burke, & Hollingsworth, 1917; Hollingworth, 1927; Hollingworth, Garrison, & Burke, 1922; Terman & Fenton, 1921). Terman’s (1917) retrospective appraisal of Francis Galton’s IQ as approximat-ing 200 formed the basis of Cox’s (1926) study. She estimated the IQs of 301 leading historical figures based on biographical records. At this time, there was also a superb empirical study (Hollingworth & Cobb, 1928) that compared two groups of intellectually talented students: one with a mean IQ = 146 (N = 20), the other mean IQ = 165 (N = 20). This study reinforced the idea that students with profound intellectual gifts assemble knowledge even faster than do typi-cally gifted students.
Hollingworth and Cobb (1928) is noteworthy because both groups of partici-pants were studied over ages 8 to 11 and their family and learning environments were highly comparable. Indeed, the two least privileged participants both belonged to the higher ability group. With particular care, participants were assessed over this 3-year span on the Stanford Achievement Tests (a heteroge-neous collection of typical academic topics: word meaning, paragraph meaning, arithmetic reasoning, history, literature, and nature and science). As Learned and Wood’s (1938) findings suggest, the accomplishment profiles of each group were non-overlapping with and markedly superior to their normative age mates. Still, the 165- and 146-IQ groups were distinguished from one another on almost all assessments. The extent to which they differed was primarily a function of the complexity of the criterion on which they were evaluated.
By drawing knowledge-growth functions over the 3-year period, the IQ-165 group was found to be several months ahead of the IQ-146 group in academic knowledge: 16 months for Word Meaning, 15 months for Paragraph Meaning, and 14.5 months for Nature Study and Science to name but a few (cf. Hollingworth & Cobb [1928], Table VI: “Time Saved by Higher IQ Groups in Attaining Various Levels of Achievements”). Moreover, as the authors pointed out, the observed differences were constrained by ceiling effects associated with the achievement criterion assessments. Paraphrasing their conclusions, they questioned whether equalized achievements should be anticipated by the equalization of opportunity. They also observed that academic tasks varied widely in their complexity, and to the extent that academic tasks were complex, their high- versus low-ability groups differed more in terms of the amount they learned per unit time. Illustrating the importance of time as a variable (Anderson, 1984, 1985; Carroll, 1989), Hollingworth and Cobb (1928) suggested that the differences in the learning observed between the IQ-165 versus IQ-146 groups were reliably anticipated by their initial IQ differences.
at VANDERBILT UNIVERSITY LIBRARY on November 29, 2016http://rer.aera.netDownloaded from

A Century of Findings on Intellectual Precocity
917
Although Hollingworth and Cobb’s (1928) study was suggestive, sample size limitations prohibit firm conclusions. Feldman (1984) conducted an analysis of the 26 participants in Terman’s study with IQs > 180. He compared them to 26 other participants in that study randomly selected for comparison purposes. Results were suggestive but, again, sample sizes suboptimal. The more contempo-rary literature, however, overcomes this though mass testing utilizing above-level assessments.
For example, Figure 5 contains two scatter plots. The bottom plot is based on 320 SMPY talent search participants scoring in the top 1 in 10,000 in either math-ematical or verbal reasoning ability (Kell, Lubinski, & Benbow, 2013); the top plot consists of 259 equally able participants identified by Duke University’s Talent Identification Program for replication purposes (Makel et al., 2016). Both samples were identified by age 13 and tracked for 25 years. The diagonal line on each plot reveals a large majority in each group had estimated IQs > 160. Data were collected on their advanced educational credentials, careers, occupational stature, and creativity (awards, patents, and refereed publications).
In Kell, Lubinski, and Benbow’s (2013) study, many participants by their late 30s were highly successful vice presidents, partners, and department heads in academe, the corporate sector, law, medicine, or information technology. Many were entrusted with and responsible for managing a great deal of economic and human resources. Furthermore, different patterns of profound intellectual talent uncovered in their youth were predictive of qualitatively different educational, occupational, and creative outcomes. Makel et al. (2016) was designed to ascer-tain whether Kell, Lubinski, and Benbow’s (2013) findings on level and pattern would generalize to a different sample of equally able young adolescents.
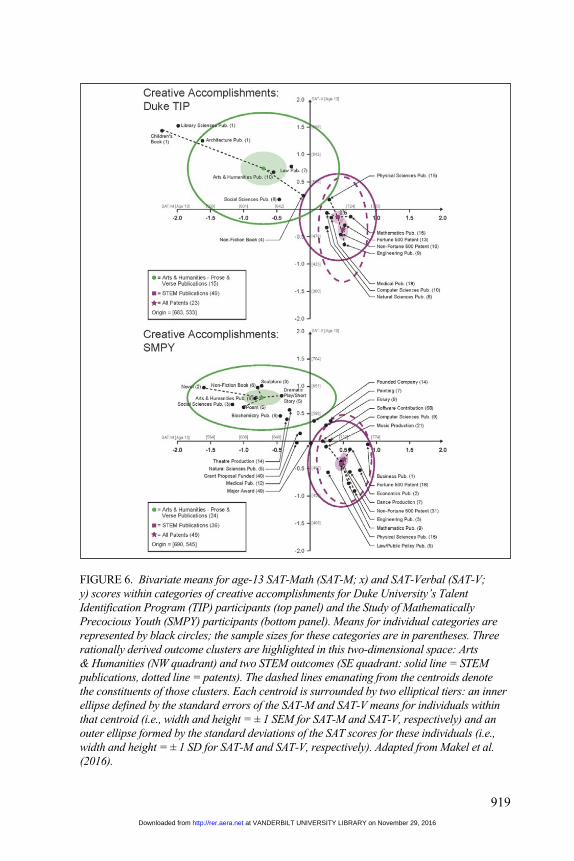
Figure 6 presents a sampling of the creative outcomes of these two groups as a function of their pattern of specific abilities. Just as typical college (Figure 2) and typical gifted students (Figure 4) tend to invest their energies in what they do best, so too do the profoundly gifted. Essentially, all of the participants examined here possess more mathematical and verbal reasoning ability than the typical PhD in any discipline (Figure 2). Yet, they choose to invest their creative energies in pur-suits that draw on their greatest strength. Like college students and the typically gifted, the profoundly gifted had a tendency to invest in pursuits that favored their intellectual strength. The same was true at earlier stages in their educational and occupational development (cf. Figures 2 and 3, respectively, in Makel et al., 2016). As Figure 5 illustrates, some participants who meet the top 1 in 10,000 group cut for mathematical reasoning ability have verbal reasoning abilities that are more impressive, while the verbal reasoning abilities of others are “merely” around the cutting score for the top 1% of ability (SAT-V scores just under 400). Assessments such as these are needed to capture the full scope of intellectual capability and the psychological import of its contrasting patterns.
The foregoing analyses only characterize the nature of the accomplishments observed by Kell, Lubinski, and Benbow (2013) and Makel et al. (2016). Tables 1 and 2 were constructed to assess the magnitude of participants’ accomplish-ments. Table 1 organizes a condensed sampling of some of their accomplish-ments prior to age 40; Table 2 lists some of their individual accomplishments (each listing represents a unique participant). With respect to the latter, any one
at VANDERBILT UNIVERSITY LIBRARY on November 29, 2016http://rer.aera.netDownloaded from

918
of these individual accomplishments, if viewed in isolation, could easily be dis-missed as an interesting anecdote. However, taken together and across both sam-ples, they aggregate to tell a compelling story. These normative and idiographic outcomes, both quantitatively and qualitatively, reveal the magnitude of human
FIGURE 5. Scatterplot of age-13 SAT-Math (X) and SAT-Verbal (Y) scores for Duke TIP participants (top panel) and SMPY participants (bottom panel). Circles, triangles, and squares are used to denote bivariate points that are occupied by one or more than one participant. The diagonal line in each scatterplot denotes where estimated IQs of 160 fall; bivariate values above these diagonals correspond to estimated IQs above 160. On the axes, the boldface numbers indicate cutoffs for the top 1 in 200 and the top 1 in 10,000 for this age group. TIP = Talent Identification Program; SMPY = Study of Mathematically Precocious Youth. Adapted from Makel et al. (2016).
at VANDERBILT UNIVERSITY LIBRARY on November 29, 2016http://rer.aera.netDownloaded from
919
FIGURE 6. Bivariate means for age-13 SAT-Math (SAT-M; x) and SAT-Verbal (SAT-V; y) scores within categories of creative accomplishments for Duke University’s Talent Identification Program (TIP) participants (top panel) and the Study of Mathematically Precocious Youth (SMPY) participants (bottom panel). Means for individual categories are represented by black circles; the sample sizes for these categories are in parentheses. Three rationally derived outcome clusters are highlighted in this two-dimensional space: Arts & Humanities (NW quadrant) and two STEM outcomes (SE quadrant: solid line = STEM publications, dotted line = patents). The dashed lines emanating from the centroids denote the constituents of those clusters. Each centroid is surrounded by two elliptical tiers: an inner ellipse defined by the standard errors of the SAT-M and SAT-V means for individuals within that centroid (i.e., width and height = ± 1 SEM for SAT-M and SAT-V, respectively) and an outer ellipse formed by the standard deviations of the SAT scores for these individuals (i.e., width and height = ± 1 SD for SAT-M and SAT-V, respectively). Adapted from Makel et al. (2016).
at VANDERBILT UNIVERSITY LIBRARY on November 29, 2016http://rer.aera.netDownloaded from

920
capital capable of being uncovered by above-level assessments prior to age 13 (see Kell, Lubinski, and Benbow’s [2013] and Makel et al. [2016] for many others).
There is no evidence of any categorical quality specific to the profoundly gifted. Rather, what the assessments described above reflect is a continuous stream of intellectual capability and attendant accomplishment (cf. Figure 3). Just as qualitatively different outcomes are observed as a function of contrasting ability patterns among college students (Figure 2), the typically gifted (Figure 4), and the profoundly gifted (Figure 6), the magnitude of their accomplishments across intellectual gradations of 3, 4, and 5 standard deviations above the norma-tive mean reflect a continuous progression of real-world accomplishment and creativity.
Assessing individual differences in ability level and ability pattern within the top 1% in their full scope has implications beyond the evidence reviewed thus far. For decades, empirical evidence has suggested that college entrance examinations are suboptimal for more reasons than their ceiling limitations (Humphreys, Lubinski, & Yao, 1993). They are also suboptimal qualitatively. Intellectual dimen-sions beyond general-, mathematical-, and verbal-reasoning ability add important value for assessing differential responsiveness to opportunities in learning and work settings for typical college students, the gifted, and the profoundly gifted.
TAbLe 1
Selected educational, occupational, and creative accomplishments of the Talent Identification Program (TIP) and the Study of Mathematically Precocious Youth (SMPY) participants
Accomplishment TIP SMPY
Doctoral degree 37% 44%Doctoral degree from top-
10 universitya16.3% 22.5%
Tenure at the college level 7.5% 11.3%Tenure at research-intensive
university4.3% 7.5%
Peer-reviewed publication (≥1)
39% 24%
Patent (≥1) 9% 15%Fortune 500 patent (≥1) 5% 6%Book (≥1) 2% 3%NSF grant (≥1) 4% (mean award
= $63,700)6% (mean award
= $91,600)NIH grant (≥1) 1% (mean award
= $10,700)3% (mean award
= $18,900)
Note. NIH = National Institutes of Health; NSF = National Science Foundation. Standard errors for the percentages reported in this table are as follows: 1% for percentages <9%; 2% for percentages from 9% through 25%; and 3% for percentages greater than 25%. The one exception is that the standard error for the percentage of tenured professors among TIP participants is 2%. Adapted from Makel et al. (2016).aIdentification of the top-10 doctoral programs was based on the National Research Council’s (1995) ratings.
at VANDERBILT UNIVERSITY LIBRARY on November 29, 2016http://rer.aera.netDownloaded from

921
Spatial AbilityFigure 2 provides a basis for anticipating the unique value spatial ability might
contribute to understanding intellectually talented youth. In the late 1970s, because of his interest in identifying and developing scientific talent—and know-ing that by utilizing exclusively a general ability measure, Terman assessed and missed two Nobel Laurates (viz., Luis Alvarez and William Shockley, see Shurkin, 1992)—Stanley gave a group of 563 SMPY participants tests of spatial ability designed for high school seniors. Years later (Shea, Lubinski, & Benbow, 2001),
TAbLe 2
Outlying accomplishments of the Talent Identification Program (TIP) and the Study of Mathematically Precocious Youth (SMPY) participants
TIP SMPY
Named as one of “America’s Top Physicians” (Consumers’ Research Council of America)
Codirector of hospital organ-trans-plant center serving more than 3 million people
Holder of 43 patents Produced 100 software contributionsPresident of chamber of commerce of
one of the 100 richest cities in the United States, by per capita income
Raised more than $65 million in private equity investment to fund own company
Associate chief counsel for a U.S. federal agency
Vice president of Fortune 500 company
Member of the Council on Foreign Relations
Deputy assistant to a president of the United States (national policy adviser)
Deputy director of the Office of the Assistant Secretary for a U.S. federal agency
Founder of three companies
Argued more than 10 cases before the U.S. Supreme Court
Producer of 500 musical productions
Professional poker player with an-nual earnings >$100,000
Marshall Scholar
Rhodes Scholar Recipient of 8 grants from the National Science Foundation (total funding >$5.5 million)
Recipient of 9 grants from the National Science Foundation (total funding >$6.5 million)
Recipient of 6 grants from the National Institutes of Health (total funding >$1.6 million)
Recipient of 6 grants from the National Institutes of Health (total funding >$1.4 million)
Note. The accomplishments listed in this table are nonoverlapping, and each refers to the achievement of a single individual. Universities were classified as research-intensive by the Carnegie Foundation (2010) if they were deemed to have “very high research productivity.” Adapted from Makel et al. (2016).
at VANDERBILT UNIVERSITY LIBRARY on November 29, 2016http://rer.aera.netDownloaded from

922
their educational and occupational outcomes were recorded at ages 18 (after high school), 23 (after college) and 33 (early career).
The three-dimensional plots in Figure 7 graph some of their outcomes over a 20-year period for favorite and least favorite high school class, 4-year college degree, and occupation. In standard deviation units, mathematical reasoning is scaled on the x-axis, verbal reasoning on the y-axis, and bivariate points at the base of each arrow denote the location of these two specific abilities. Spatial ability is also scaled in standard deviation units using arrow points. Arrows to the right rep-resent positive values; to the left, negative values. When these arrows are rotated up from the page for the positive values at 90° angles from the x and y axes, and down from the page for the negative values, again at 90° from x and y, the bold arrowheads indicate the location in three-dimensional space of the trivariate points
FIGURE 7. Trivariate (X/Y/Z = Mathematical/Verbal/Spatial) means for (Panel A) favorite and (B) least favorite high school course at age 18, (C) college majors at age 23, and (D) occupation at age 33. Mathematical, verbal, and spatial ability are on the x-, y-, and z-axes, respectively (arrows to the right indicate a positive z value; arrows to the left indicate a negative z value). Panels A and B are standardized within sex; Panels C and D are standardized across sexes. For Business in Panel C, note that the length of the arrow is actually z = 0.73. CS = computer science. Along the axes, unbracketed values are SAT-M and SAT-V scores in z-score units, and bracketed values are raw SAT scores.Dotted rectangles surround the STEM degrees and occupations to reveal that they occupy the same intellectual space across all time points. Adapted from Shea et al. (2001).
at VANDERBILT UNIVERSITY LIBRARY on November 29, 2016http://rer.aera.netDownloaded from

A Century of Findings on Intellectual Precocity
923
that each labeled group occupies. At each developmental milestone (after high school, after college, securing an occupation), all three specific abilities add value to the prediction of the criteria under analysis relative to the other two. To highlight that distinct outcomes reflect contrasting intellectual patterns, dotted-lined rectan-gles were drawn around the STEM outcomes in each panel.
Thus, for this sample in the top 1% of ability, those who find humanities to be their favorite high school course tend to have an intellectual repertoire dominated by verbal ability relative to mathematical and spatial ability, whereas the inverse is true for students who prefer STEM domains. This pattern is not only true for pref-erences in learning environments but also for occupations. Conversely, individuals with educational credentials and occupations in STEM possess salient mathemati-cal and spatial abilities relative to their verbal ability. Each of these specific abili-ties adds value to the other two in the prediction of these educational–occupational outcomes; neglecting any one misses a critical component. Doing so compromises the psychological understanding of intellectually precocious youth. This finding was reinforced 15 years later for these participants in the prediction of their cre-ative accomplishments (Kell, Lubinski, Benbow, & Steiger, 2013).
Specifically, these same participants were followed-up again at age 48 by Kell, Lubinski, Benbow, et al. (2013). That spatial ability adds value to measures of mathematical and verbal reasoning ability in educational outcomes (assimilating knowledge) and in occupational outcomes (utilizing knowledge) was established by Shea et al. (2001), as well as others (Gohm, Humphreys, & Yao, 1998; Humphreys et al., 1993; Wai et al., 2009; Wai & Worrell, 2016; Webb, Lubinski, & Benbow, 2007). But does spatial ability add value in the same way for creative outcomes (creating knowledge)? Is Howard Gardner (1983, p. 192) correct, that “it is skill in spatial ability that determines how far one will go in science”?
Age 48 outcomes deemed genuinely creative were identified. The final groupings (with sample sizes in parentheses) were three types of refereed publications—namely, Art–Humanities–Law–Social Sciences (27), Biology–Medicine (35), STEM (65), and, finally, patents (33). These categories are mutually exclusive and exhaus-tive. Participants who earned patents and published were placed in the relevant pub-lication category. Thus, the 33 individuals placed in the patent category did not have a refereed publication when studied. Then, using a discriminant function analysis, participants’ age 13 mathematical, spatial, and verbal ability assessments were used to predict these four classes of creative outcomes over the 35-year time frame. When only mathematical and verbal ability scores were entered into the analysis, they accounted for 10.5% of the variance in these group outcomes (Kell, Lubinski, Benbow, et al., 2013). When spatial ability was added, an additional 7.5% of the vari-ance was accounted for (both steps being statistically and substantively significant).
It has been known for years that level and pattern of mathematical and verbal ability are important in forecasting both the likelihood and nature of creative out-comes among intellectually precocious youth over multiple decades (Park et al., 2007, 2008; Wai, Lubinski, & Benbow, 2005). The Kell, Lubinski, Benbow, et al. (2013) study, however, was the first demonstration that spatial ability adds addi-tional value to the prediction of genuine creative outcomes as well.
A trivariate (mathematical/spatial/verbal) three-dimensional plot of these find-ings rotated three ways is found in Supplemental Figure S1 (available in the online
at VANDERBILT UNIVERSITY LIBRARY on November 29, 2016http://rer.aera.netDownloaded from

Lubinski
924
version of the journal; taken from Kell, Lubinski, Benbow, et al., 2013). Each tri-variate point, one for each outcome, is surrounded by the orthogonal orbits of the three standard errors of each ability to form ellipsoids, which are color-coded to enhance their distinctiveness. Clearly, the creative outcomes under analysis are supported by different configurations of intellectual talent. For example, among participants who secure patents, their spatial ability is commensurate with those who publish in STEM, but the latter are more impressive in mathematical and verbal reasoning. Participants who publish in Art–Humanities–Law–Social Sciences are the lowest in spatial ability of all four groups. This graph is psycho-logically informative, depicting the intellectual design space of creative thought.
Other Psychological Attributes
Educational–Occupational Interests and ValuesTerman and Stanley also sought to assess other personal attributes for under-
standing the learning needs and personal development of intellectually precocious youth beyond the criteria used to identify them. Spatial–mechanical reasoning was one such attribute and educational/vocational needs and interests was another. Terman and Miles’s (1936) early treatment of masculinity and femininity partly captured a dominant dimension that ran through the most well-known occupa-tional interest inventories for decades (Campbell, 1971; Strong, 1943), and con-tinues to do so (Su, Rounds, & Armstrong, 2009).5 Masculinity–femininity gave rise to modern more sophisticated treatments of the dominant and substantively significant people-versus-things interest dimension (Su et al., 2009), which adds appreciable clarity to understanding sex differences in educational and occupa-tional choices (Lippa, 1998; Schmidt, 2011). This dimension cuts across historical as well as widely accepted contemporary models of educational/occupational interests: from Mechanical to Social Welfare in Guilford’s (1954) model and Realistic to Social in Holland’s (1996) hexagon.
It is important to provide this context before documenting that essentially all of the psychometric properties found on general and specific abilities as well as inter-est and values measures for college bound high school seniors now have been rep-licated for intellectually talented young adolescents. These psychometric properties include 15- and 20-year test–retest and constructive replications of the longitudinal stability of interests and values (Lubinski et al., 1995, 1996), commensurate cross-scale ability/interest/values covariance structures (Schmidt, Lubinski, & Benbow, 1998), and perhaps most importantly, incremental validity of specific abilities and preferences (interests and values) relative to each other in the prediction of educa-tional and occupational outcomes—over 5, 10, and 20 years (Achter, Lubinski, Benbow, & Eftekhari-Sanjani, 1999; Wai et al., 2005; Webb et al., 2002, 2007).
Using a series of cross-validation designs, regression equations developed on hundreds of intellectually talented young adolescents, based on educational/voca-tional interests to predict life values, generalized to samples of hundreds of gradu-ate students attending top U.S. STEM programs (Schmidt et al., 1998). Partly because of this, it has been clear for at least two decades that the concept of “mul-tipotentiality” among the intellectually talented is largely untenable (Achter, Lubinski, & Benbow, 1996). When ability, interest, and values measures designed for college-bound high school seniors are administered to intellectually
at VANDERBILT UNIVERSITY LIBRARY on November 29, 2016http://rer.aera.netDownloaded from

A Century of Findings on Intellectual Precocity
925
precocious young adolescents (e.g., above-level assessments, or measures with appropriate ceilings), they uncover amounts of psychological diversity commen-surate to those found for the older students for whom these measures were ini-tially designed. For further evidence of commensurate adolescence-to-adult measurement, see Lubinski et al. (2001).
For example, Achter et al. (1999) were interested in ascertaining whether the Allport–Vernon–Lindsey Study of Values (SOV) provided incremental validity beyond the SAT in predicting college majors. They studied 432 SMPY partici-pants who had taken both instruments and had reported earning a college degree by their 10-year follow-up. Participants were grouped into three categories based on whether they secured their degree in (a) the humanities, (b) math–science, or (c) something else. Then, a two-step discriminant function analysis, utilizing the SAT first (Step 1) followed by the SOV (Step 2), was performed to evaluate the value added by educational–occupation preferences relative to mathematical and verbal ability.
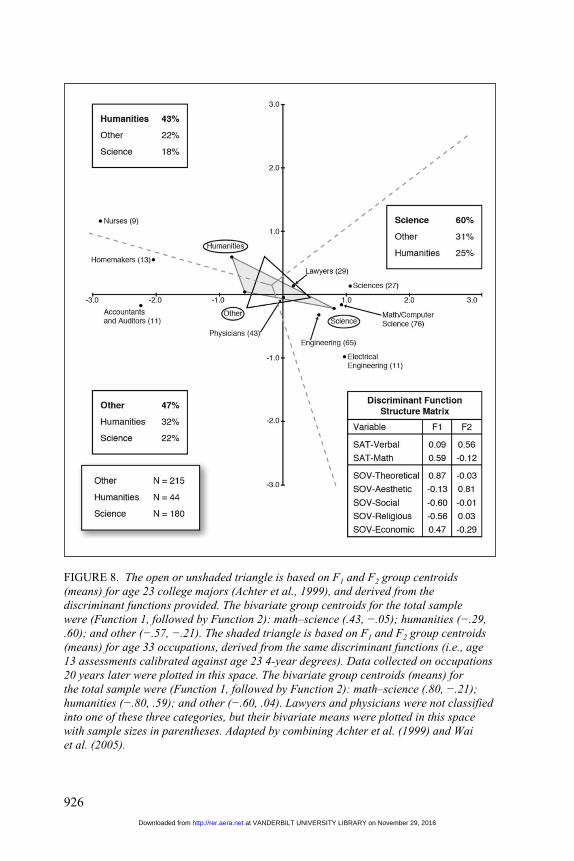
The matrix embedded in Figure 8 contains the two discriminant functions derived from this analysis and their loadings. These loadings form distinct math–science and humanities amalgams, respectively, with math ability + theoretical values loading most strongly on Function 1 (coupled with negative loadings for social and religious values), and verbal ability + aesthetic values loading most strongly on Function 2. In Step 1, the SAT-M and SAT-V measures accounted for 10% of the variance between these three groups, and Step 2’s addition of the five SOV scales accounted for an additional 13% of the variance. Given the heteroge-neity within these three degree groupings, and Time 1 assessments coming a decade earlier at age 13, accounting for 23% of the variance is noteworthy. The bivariate means for all three educational groups on these two functions are plotted in Figure 8. Lines connecting these three bivariate means form the unshaded tri-angle, and lines from each point running through the midpoint of the other two parse the two dimensional space formed by these functions into three exhaustive regions (see Achter et al., 1999, for further details).
In a subsequent study conducted 10 years later (Wai et al., 2005), 20-year occupational data were plotted within this three-region space. Wai et al. (2005) were interested in ascertaining whether the Achter et al. (1999) functions were robust enough to maintain their predictive validity for these participants a decade later. Could they differentiate their occupational group membership at age 33? If age 33 occupational data occupied regions drawn with discriminant functions based on age-13 predictor assessments and calibrated on age-23 edu-cational criteria maintained their potency in distinguishing qualitatively differ-ent occupations at age 33, this finding would support the idea that something psychologically meaningful was being captured by these early adolescence assessments. There were 323 men and 188 women who had taken both the SAT and SOV at age 13 and had 20-year longitudinal data listing an occupation. Participants’ occupations were classified as Humanities, Math–Science, or Other, and their discriminant function scores were plotted in the space derived by Achter et al. (1999; lawyers and MDs were not classified, but their bivariate means were plotted).
at VANDERBILT UNIVERSITY LIBRARY on November 29, 2016http://rer.aera.netDownloaded from
926
FIGURE 8. The open or unshaded triangle is based on F1 and F2 group centroids (means) for age 23 college majors (Achter et al., 1999), and derived from the discriminant functions provided. The bivariate group centroids for the total sample were (Function 1, followed by Function 2): math–science (.43, −.05); humanities (−.29, .60); and other (−.57, −.21). The shaded triangle is based on F1 and F2 group centroids (means) for age 33 occupations, derived from the same discriminant functions (i.e., age 13 assessments calibrated against age 23 4-year degrees). Data collected on occupations 20 years later were plotted in this space. The bivariate group centroids (means) for the total sample were (Function 1, followed by Function 2): math–science (.80, −.21); humanities (−.80, .59); and other (−.60, .04). Lawyers and physicians were not classified into one of these three categories, but their bivariate means were plotted in this space with sample sizes in parentheses. Adapted by combining Achter et al. (1999) and Wai et al. (2005).
at VANDERBILT UNIVERSITY LIBRARY on November 29, 2016http://rer.aera.netDownloaded from

A Century of Findings on Intellectual Precocity
927
The bivariate means for all three occupational groups on the two discriminant functions are plotted in Figure 8. Lines connecting these three bivariate means form the shaded triangle. In addition, bivariate means for some of the individual occupational groupings are plotted in this space (with their sample sizes in paren-theses). The percentage of hits and misses is provided in each region for each of the three major categories. Clearly, combining abilities and preferences effec-tively predicts qualitative differences not only in educational but also occupa-tional choice. The preponderance of each occupational group is located in the appropriate region defined 10 years earlier (utilizing predictor assessments secured 20 years earlier). Indeed, a salient people-versus-things dimension runs just above the negative x-axis around nurses and homemakers and passes through the origin to just under the positive x-axis to engineers and computer scientists.
Conative Determinants: Developing Expertise and EminenceOne uncontroversial finding in the study of talent development is the amount
of time outstanding performers devote to developing and applying their expertise. Life is ipsative. All of us have the same number of hours in the day to allocate, and there are huge individual differences in how people choose to apportion time when exigencies are not operating. The latter consideration is important, because exigencies suppress individual differences. When loved ones need medical care, hunger is intense, or life-threatening circumstances arise, most people become unidimensionally one-sided; they focus exclusively on meeting a single goal. As personality theorist Henry Murray (1938) astutely suggested, if you want to understand someone (what they value), look at what they do when free of exigen-cies. The choices they make under such circumstances tell you what they value (strive to accomplish). These considerations afford another opportunity for the gifted field to shed light on the social sciences generally because rarely does other research ask people how much would they be willing to work, if given the oppor-tunity to have their ideal job. Just as it is important to not to treat individuals in the top 1% on general or specific abilities as categorical types, it is likewise important not to conceptualize full-time students or employees categorically. Within all dis-ciplines and professions, administrators, employers, students, and workers differ appreciably in commitment, drive, and energy. Quantitatively, just how much variability exists and how much does it matter?
Figure 9 is based on two questions from a 20-year follow-up of a group of profoundly gifted adolescents and a 10-year follow-up of top math/science graduate students (Lubinski et al., 2006). When in their mid-30s, both samples were asked how much they would be willing to work in their “ideal job” and, second, how much they actually do work. These figures, which represent two of the most talented samples ever assembled for longitudinal study, reveal an important noncognitive factor: willingness to work long hours. To understand the relevance of these data, one only needs to imagine the differences in research productivity likely to accrue over 5- to 10-year intervals between faculty mem-bers, research scientists, or high-powered lawyers working 45- versus 65-hour weeks (other things being equal). The same is true for advancing knowledge or achieving distinction in many occupational pursuits (Campbell, 1977; Simonton, 1988, 1994; Wilson, 1998). These distributions also have been replicated at two time points for a large sample of intellectually talented young adolescents in the
at VANDERBILT UNIVERSITY LIBRARY on November 29, 2016http://rer.aera.netDownloaded from

928
FIGURE 9. Number of hours top STEM graduate-student (GS) and profoundly gifted talent-search (TS) participants worked per week and were willing to work per week in the ideal job. The data for hours worked are based on ns of 276 and 264 for male and female GS participants, respectively, and 217 and 54 for male and female TS participants, respectively. The data for hours participants were willing to work are based on ns of 269 and 263 for male and female GS participants, respectively, and 206 and 57 for male and female TS participants, respectively. From Lubinski et al. (2006).
at VANDERBILT UNIVERSITY LIBRARY on November 29, 2016http://rer.aera.netDownloaded from

A Century of Findings on Intellectual Precocity
929
top 1% at age 33, N = 1,995 (Benbow et al., 2000) and ages 48 to 53, N = 1,650 (Lubinski, Benbow, & Kell, 2014).
Omitted Variables: Individual Differences in Life Priorities and LifestyleThe findings in Figure 9 and the replications referenced above point to a post–
formal education phenomenon crucial to document before closing the Results sec-tion. Depending on the ultimate outcomes investigators are intending to model, or use to validate educational opportunities, another set of determinants must be considered: the dynamic changes in lifestyle preferences and priorities that occur during young adulthood and subsequent to formal education. Vast individual dif-ferences in lifestyle preferences and priorities were observed in four SMPY cohorts from age 33 on, and replicated across multiple time points (Ferriman, Lubinski, & Benbow, 2009; Lubinski et al., 2014). Essentially, these differences reflect how much time one is willing to devote to any one thing (across multiple life domains), and there are marked individual differences. In part, they explain why significant subsets of intellectually talented participants work less than 40 hours per week as young adults and beyond, and why they are unwilling to devote more time to their careers even under ideal circumstances. Scanning the multiple figures arrayed in Ferriman et al. (2009) and Lubinski et al. (2014) illuminates the substantive significance of these broader classes of variables. Importantly, these marked differences in life priorities do not covary with a variety of life satisfac-tion and psychological well-being measures (Lubinski et al., 2014), which the authors interpret as evidence for not only the importance of equal opportunity but also as signaling that there are multiple ways to develop a meaningful (satisfying and successful) life.
Discussion
In Terman’s (1954a) Bingham Lecture, he stressed that, although decades of longitudinal research confirmed the importance of general intelligence for overall distinction
[s]uch tests do not, however, enable us to predict what direction the achievement will take, . . . both interest patterns and special aptitudes play important roles in the making of a gifted scientist, mathematician, mechanic, artist, poet, or musical composer. (p. 224)
The modern literature has flushed out these interests and special talents consider-ably. The top 1% contains one-third of the ability range. Examining this range with general and specific ability measures capable of differentiating the able and the exceptionally able, and measuring their development in the context of qualita-tively different low base rate outcomes, is scientifically informative. The evidence reviewed reveals that mathematical, spatial, and verbal ability assessments each offer something unique to understanding the learning needs and differential pro-clivities of intellectually talented students—just as they do for all students.
Moreover, educational and occupational interests and values, as well as cona-tive determinants of commitment and time on task, provided opportunity is avail-able, add additional value to understanding the individuality within intellectually precocious populations. The unique constellations of personal attributes that these
at VANDERBILT UNIVERSITY LIBRARY on November 29, 2016http://rer.aera.netDownloaded from

Lubinski
930
dimensions form help in placing intellectually precocious populations in the broader context of systematic sources of individual differences. This is one reason why modern behavioral geneticists have noted that “atypical is typical,” and devel-opmental psychopathologists similarly observe that “abnormal is normal” (Asbury & Plomin, 2014; Plomin, DeFries, Knopik, & Neiderhiser, 2016). Across physical, cognitive, and all other behavioral domains, individuals vary tremendously. At the extremes, atypical developmental trajectories are to be expected and are observed and what is atypical for an individual is typical within a population. A number of these topics warrant further attention.
Spatial Ability
An important corollary of the study of individual differences is highlighted by the findings on spatial ability. Namely, that important psychological attributes operate in learning and work settings whether or not participants consider them, practitioners or theorists assess them, or selection is based on them. All of the intellectually talented young adolescents assessed on above-level assessments in the studies reviewed understood the importance of doing well on mathematical and verbal reasoning tests for their eventual college placement. However, the sig-nificance of spatial ability was never on their radar screen, nor was it ever used for selecting them for educational or occupational opportunities. Still, spatial ability played a critical role in structuring their educational, occupational, and creative pursuits and ultimate outcomes.
Approximately half of young adolescents in the top 1% in spatial ability are missed by modern talent searches restricted exclusively to mathematical and ver-bal reasoning ability (Wai et al., 2009). This omission not only neglects an under-served population—and a critical source of human capital for advanced technical professions—it also constitutes a lost opportunity for the kind of refinements seen across Figures 2, 7, and Supplemental Figure S1. Participants may be highly simi-lar on any two of these critical specific abilities but, if they differ markedly on the third, differential development is anticipated.
Prior to the appearance of the modern longitudinal research on spatial ability reviewed here, one of the world’s leading authorities on the psychoeducational significance of spatial ability remarked,
There is good evidence that [visual-spatial reasoning] relates to specialized achievements in fields such as architecture, dentistry, engineering, and medicine. . . . Given this plus the longstanding anecdotal evidence on the role of visualization in scientific discovery, . . . it is incredible that there has been so little programmatic research on admissions testing in this domain. (Snow, 1999, p. 136).6
Studying educational, occupational, and creative outcomes with models incorpo-rating all three specific ability dimensions clearly constitutes best practice and is recommended to prevent underdetermined causal modeling.
Conative Determinants and Exceptionality
Adding individual differences in conative determinants to intellectual abilities and motivational proclivities (interest and values) highlights the collective role
at VANDERBILT UNIVERSITY LIBRARY on November 29, 2016http://rer.aera.netDownloaded from

A Century of Findings on Intellectual Precocity
931
multiple attributes play in jointly answering broader social science questions: What ultimate criteria should be used for evaluating the long-term educational efficacy of interventions and opportunities as well as expectations for exceptional accomplishments? Given that people differ markedly in terms of their individual-ity, how they define success, and how much they are willing to invest in their career development (Ferriman et al., 2009; Lubinski et al., 2014), these personal views moderate outcome expectations.
Regardless of the endeavor, developing extraordinary expertise and, subse-quently, applying oneself to become an outstanding contributor requires doing more than is required. There are no graduate student handbooks or job descrip-tions for the outer envelope of cutting-edge performance because such accom-plishments are far beyond the threshold for competent (adequate) performance. For most people, even among the most educationally accomplished and intellec-tually talented (Ferriman et al., 2009; Lubinski et al., 2014), the lifestyle required is not readily embraced (Hakim, 2000; Simonton, 1994; Wilson, 1998; Zuckerman, 1977).
Just as Hollingworth and Cobb (1928) documented meaningful learning dif-ferentials over the course of 3 years between two groups of gifted versus pro-foundly gifted 8-year-olds, and Schmidt and Hunter (1998) documented meaningful differences in performance–output among workers in complex occu-pations who differ in general intelligence,7 it is crucial to take into account time devoted to and intensity of commitment for learning and work. Meaningful differ-ences among people performing in school and at work are to be anticipated across IQs centered at 140 versus 155 versus 170. When these differences, however, are combined with individual differences in time and commitment to career, such as 40 versus 55 versus 70 hours per week, differences in achievement outcomes are anticipated to expand exponentially (Simonton, 1999, 2014).8,9
Quantification of this is possible. For a given occupation and pay grade, indus-trial/organizational psychologists estimate the standard deviation of performance output (i.e., worth to the organization) to be 40% of the median income (Schmidt & Hunter, 1998). Therefore, for occupations with a median income of $100,000, the standard deviation of employees’ dollar value output is $40,000 (a lower bound estimate). So for employees located 1 standard deviation above the median versus 1 standard deviation below, the differential value amounts to $140,000 − $60,000 = $80,000.
As society becomes more complex, employee worth among the intellectually exceptional has become a high value currency. For better or worse, cutting-edge expertise in law, medicine, or technology has extraordinary value to organiza-tions. Outstanding members of legal teams, medical units, and the professoriate readily comment on this appreciable range (Pinker, 2002). Quantifying perfor-mance differences among workers in standard deviation units, as a function of exceptional levels of general intelligence, or what former Secretary of Labor Robert Reich (1991) referred to as “symbolic analysts,” adds clarifying precision. Empirical findings on outstanding intellectual capabilities resonate with remarks like Netscape cofounder Marc Andreessen’s: “Five great programmers can com-pletely outperform 1,000 mediocre programmers.” As Learned and Wood (1938), Pressey (1946a, 1946b), and Seashore (1922) provided empirical evidence for
at VANDERBILT UNIVERSITY LIBRARY on November 29, 2016http://rer.aera.netDownloaded from

Lubinski
932
early on, the expansion of individual differences in achievement is typical and provides a basis for understanding individual differences in accomplishments pre- and post-formal-education (Golden, 2014).
Throughout the past century, across educational and occupational settings, increased opportunity has been shown to expand performance variance (Gagne, 2005; Pressey, 1949; Stanley, 2000; Terman, 1954a; Thorndike, 1975; Thurstone, 1948), termed a “fanning effect” (Kenny, 1975). This phenomenon has also been referred to as the “Matthew effect” (Merton, 1968), the “first law of individual differences” (Jensen, 1991), or, as Ceci and Papierno (2005) aptly subtitle their excellent review on this topic, “When the Have Nots Gain, But the Haves Gain Even More.” Opportunity certainly increases achievement but, simultaneously, it also augments individual differences in educational and occupational accomplish-ments.10 These differences, in part, are what allow for cultures to become more sophisticated through concentrated-specializations (expertise) with implications for economic, political, and sociological phenomena. At a deeper level of analy-sis, increased variance undoubtedly factors into the inherent conflict between three “tensions” that characterize advanced societies: “Order, liberty, and indi-vidual differences; any two can be had, but they must be paid for by the third” (F. L. Wells, 1937, p. 1280). This contention illuminates the significance of empirical findings on exceptional intellectual capability for contemporary learning settings and labor markets. They operate whether or not they are considered or measured. As Cronbach (1957) advocated 60 years ago in his 1956 American Psychological Association Presidential Address, evaluating responsiveness to interventions and opportunities is best accomplished by incorporating the assessment of individual differences (cf. Corno et al., 2002).
Broader Frameworks and Theoretical Considerations
Taking a multivariate individual differences approach to the scientific study of intellectual precocity helps explain why exceptional members of distinct special-ties appear to be categorical “types,” or as having “different intelligences.” When two specific abilities manifest small correlations with interests and values but in opposite directions (e.g., the contrasting correlational signs spatial and verbal ability each display with scientific and social interests and values; Ackerman & Heggestad, 1997; Schmidt et al., 1998), selecting endpoint extremes on each results in two samples having distinct intellectual and nonintellectual characteris-tics. These two groups will vary markedly in their preferences for learning about and working with inorganic versus organic material (people-versus-things). This variation aligns with broader frameworks, which assemble abilities, preferences, and conative determinants to form constellations indicative of differential prom-ise for learning “aptitude complexes” (Snow, 1991), work “taxons” (Dawis & Lofquist, 1984), and intellectual development “trait clusters” (Ackerman, 1996; Ackerman & Heggestad, 1997; von Strumm & Ackerman, 2013).
Educational and occupational counselors who work with individual differences draw on multi-attribute models and emphasize that select subpopulations identi-fied as endpoint extremes on any one dimension vary widely on a host of others; therefore, multi-attribute and intraindividual assessments are critical (Dawis, 1992; Tyler, 1974, 1992). Terman (1955) clinically commented on a similar phenomenon
at VANDERBILT UNIVERSITY LIBRARY on November 29, 2016http://rer.aera.netDownloaded from

A Century of Findings on Intellectual Precocity
933
in one of his last contributions, “Are scientists different” an essay drawing on his extensive study of the personal (individual differences) attributes of scientists and nonscientists among his participants (Terman, 1954b). At the end of his extensive analysis, Terman (1954b) ventured, what is now called for,
Instead of a single group of subjects representing the generality of children with high IQs, two gifted groups closely matched for superior IQs but otherwise unlike as possible with respect to scientific promise. The selection of the two contrasting groups would need to be based largely on batteries of tests and ratings of special abilities and interests believed to be symptomatic of scientific talent. (p. 40)
Subsequent to Terman’s writings, the psychological basis for C. P. Snow’s (1967) “two cultures” was observed by both differential (Cronbach, 1957; Humphreys et al., 1993) and experimental (Boring, 1950; Kimble, 1984) psy-chologists. That humanists are more verbal and social and scientists more math-ematical/spatial and gravitating toward learning about and working with inorganic material is shown in Figures 2, 7, and 8. These considerations might provide an opportunity for more than a psychological understanding of contrast-ing intellectual orientations and learning preferences. They suggest epistemo-logical preferences for contrasting approaches to conceptualizing human and social phenomena.
Upon analysis, distinct constellations of intellectual and motivational proclivi-ties likely factor into individual differences for what constitutes meaningful explanations of physical and social reality. Consider, for example, the contentious friction and cross-talk between educational and psychological enthusiasts of clini-cal versus statistical prediction, qualitative versus quantitative research, idio-graphic versus normative assessment, and literary versus psychometric approaches to the study of human intelligence. Do these distinctions parallel differential affin-ities toward verbal versus nonverbal ideation as well as preferences for different substantive determinants for construing the human condition and physical uni-verse (Dawis, 2001; Lubinski, 1996, 2000)? Complex stimulus fields are multi-faceted, and the intellectually able are especially deft at finding cross-cutting patterns and developing narratives to fit with their self-interests, enduring disposi-tions, and salient strengths to construct their personal point of view. As William James (1890) observed,
Millions of items of outward order are presented to my senses which never properly enter into my experience. Why? Because they have no interest for me. My experience is what I agree to attend to. Only those items which I notice shape my mind—without selective interest, experience would be utter chaos. (p. 402)
The dimensions of human individuality under analysis and the constellations they form could have verisimilitude for understanding not only contrasting points of view (and varying selective perceptions), but also for providing insight into why some explanations of human behavior are found to be intellectually soothing and others disturbing.
at VANDERBILT UNIVERSITY LIBRARY on November 29, 2016http://rer.aera.netDownloaded from

Lubinski
934
Biological Underpinnings
Educational and psychological findings reviewed have important implications for molar social phenomena in economics, political science, and sociology. What about more molecular biological-phenomena? Isolating with precision personal attribute constellations indicative of contrasting developmental delays and psy-chopathology has provided distinct phenotypes for profitable behavioral genetic and neuroscientific inquiry (Plomin DeFries, Knopik, & Neiderhiser, 2013, 2016). The distinct phenotypic constellations of profound intellectual talent, seen in Figures 5 and 6, offer several possibilities for the biosciences. They are currently being examined for differential gene frequencies that distinguish the profoundly gifted from typically developing individuals (Spain et al., 2016), but could be exploited more widely in the neurosciences (Colom & Thompson, 2011; Jung & Haier, 2007) in attaining a deeper understanding of the structures, systems, and subsystems underlying human intelligence and cognition.
Concluding Statement
Over the past 100 years, the longitudinal study of youth who learn abstract/symbolic material at precocious rates has generated important empirical findings that replicate. These findings have implications beyond the importance of meeting the educational needs of all students and the range of learning environments required to do so. They align with other findings in the study of individual differ-ences and foster an appreciation of the multidimensionality and scope of human psychological diversity. A number of socially valued topics critical for maintain-ing and advancing modern cultures are informed by these findings (Giles, 2011). The empirical evidence reviewed reveals not only neglected intellectual talent but also the kinds of cross-cultural talents characteristic of contrasting high-impact positions in global economies (Friedman, 2007; Zakaria, 2011).SN5
Furthermore, the dimensions under analysis provide powerful tools for multi-disciplinary inquiry: They organize economic and sociological phenomena as well as distinct phenotypes for linking general and specific aspects of cognitive functioning to behavioral genetics and the neurosciences. Moreover, the intellec-tual dimensions reviewed covary with other sources of human individuality and their constellations form psychological orientations with qualitatively different implications for how people see the world, selectively perceive, and ultimately accomplish. They also afford a compelling counterexample to recent concerns about empirical findings in education and the psychological sciences failing to replicate (Open Science Collaboration, 2015), which is not new.
Over 40 years ago, the most distinguished psychological scientist identified and tracked by Terman’s study, Lee J. Cronbach (1975), painted a gloomy picture by asking whether robust findings on human behavior were even possible. Cronbach bemoaned that empirical findings in the psychological sciences have a “short half-life.” He even suggested that, perhaps, the best we social scientists can do is to capture a brief snapshot of the human condition at a particular point in time. Just as Cronbach fulfilled the promise of his profoundly gifted IQ—the “mirror that was held up to him as a child” (Cronbach, 1989, p. 63)—by, among other things, publishing 4 of the top 10 most widely cited articles ever to appear
at VANDERBILT UNIVERSITY LIBRARY on November 29, 2016http://rer.aera.netDownloaded from

A Century of Findings on Intellectual Precocity
935
in the Psychological Bulletin (Cronbach, 1992b), major longitudinal findings on large samples of intellectually precocious students have fulfilled their promise by solidifying empirical generalizations that replicate throughout the educational and psychological sciences. What better way to conclude a centennial review, and the co-occurrence of Cronbach’s 100th birthday (1916–2016), than by allaying his concern about whether we will ever have a solid edifice of empirical knowledge that withstands the test of time. That this conclusion is based in part on idio-graphic and normative data that he contributed, qualitatively and quantitatively, both personally and professionally (Cronbach, 1989, 1992b, 1996), forms another mirror—one that reflects the kind of aesthetic symmetry found in noteworthy scientific advances and remarkable careers.
Notes
Support for this article was provided by a research and training grant from the Templeton Foundation (Grant 55996) and by the Vanderbilt Kennedy Center for Research on Human Development. I am indebted to the following colleagues for invaluable discussions and comments on earlier versions of this work: Camilla P. Benbow, Brian O. Bernstein, Thomas J. Bouchard Jr., Rene V. Dawis, Douglas K. Detterman, Douglas Fuchs, Lynn S. Fuchs, Irving I. Gottesman, Harrison J. Kell, Kira O. McCabe, Frank Miele, Robert Plomin, Nancy M. Robinson, Karen B. Rogers, Frank L. Schmidt, Auke Tellegen, and Leslie J. Yonce.
1Throughout this review, five Supplemental Notes provide further detail and nuance, denoted by the following superscripts: SN1, SN2, SN3, SN4, and SN5. The first supple-mental link is titled, “Intellectual Precocity and Health.” Titles for the others are found in the Supplemental Notes (all Supplemental Notes are available in the online version of the journal).
2This review focuses on intellectual talent as opposed to the performing arts and ath-letics with the acknowledgment that these domains too possess an appreciable intellec-tual component (e.g., Simonton, 2014; Subotnik, Olszewski-Kubilius, & Worrell, 2011; Worrell, Olszewski-Kubilius, & Subotnik, 2012; Zimmerman, 1984).
3One way to get a purchase on the intellectual dimensions of central relevance for intel-lectually precocious youth is to view them as reflections of mirror images of the dimen-sions of central importance for meeting the learning needs of students with developmental delays. Interventions designed to facilitate learning in students with developmental delays essentially reduce to delays in either general abstract reasoning and/or those concerning numerical/quantitative, spatial/pictorial, or verbal/linguistic media (Douglas K. Detterman, Douglas Fuchs, & Lynn Fuchs, personal communication, May 2016).
4Thomas J. Bouchard and Nancy M. Robinson point out that at the time, the usage of “Genetic” in Terman’s title was common to denote “developmental.”
5In their section on “Suggestions for Revision of the M-F Test,” Terman and Miles (1936, p. 459) aptly state, “Possibly ‘interests’ could be divided into (a) interests in objec-tive things, occupations, and activities, and (b) interests in people and their relationships.” See Su et al. (2009) for a modern and sophisticated treatment with meta-analytic empirical support for this position.
6Currently, procedures for selecting students for advanced STEM degrees actually could be iatrogenic. Graduate Record Exam (GRE) is the selection tool utilized in the United States for admission into prestigious graduate training programs. Based on approximately 2.5 million GRE test takers assessed in 2002 to 2005, 30% scored ≥700 (out of a top pos-sible score of 800) on GRE-Q (ETS data: all examinees tested between July 1, 2002, and June 30, 2005, N GRE-V = 1,245,878, N GRE-Q = 1,245,182). The GRE-Verbal was not compromised by ceiling effects, with only 3% scoring ≥700. Indeed, the GRE-Q mean of
at VANDERBILT UNIVERSITY LIBRARY on November 29, 2016http://rer.aera.netDownloaded from
Lubinski
936
591, with a standard deviation of 148, reveals that the mean is 1.4 standard deviations from the GRE-Q ceiling, whereas the GRE-V mean of 467, with a standard deviation of 118, places this mean at 2.8 standard deviations from the GRE-V ceiling (twice the distance). This results in 10 times as many scores ≥700 for GRE-Q than GRE-V! Given the profile differences in specific ability pattern associated with advanced educational credentials and occupations in STEM (Figures 2 and 5), it is important to consider the following possibility: If schools of engineering are attempting to be more selective with respect to the intellectual profile of their graduate student body, by selecting students based on their GRE composite (GRE-Q + GRE-V), they could actually be working against themselves. That is, verbal ability could be operating as a suppressor variable and systematically precluding through indirect selection students exceptionally talented in spatial ability but relatively unexcep-tional in verbal ability. Humphreys et al. (1993) argued that a more able student body for engineering would be identified by a Mathematical + Spatial Ability Composite, rather than a Mathematical + Verbal Ability Composite. See also Austin and Hanisch (1990).
7Correlations between general intelligence and work performance for unskilled/semi-skilled jobs, skilled jobs, and managerial/professional jobs center around .20, .40, and .63, respectively (Schmidt & Hunter, 1998). Although other things clearly matter, gen-eral ability is the most important personal attribute for predicting work performance in complex settings (i.e., occupations that require coping with novelty in dynamic, highly-abstract environments). These correlations are useful because they reflect how many stan-dard deviation units in performance two individuals are likely to differ by as a function of every standard deviation difference in general intellectual ability (e.g., in complex occu-pations, a 1 SD difference in general intellectual ability, on average, translates into a 0.63 SD difference in work performance). (Furthermore, individuals migrate up or down the scale of occupational prestige as a function of general ability [Ackerman & Humphreys, 1990; Wilk et al., 1995; Wilk & Sackett, 1996], even within families [Firkowska, 2011; Firkowska et al., 1978; Lubinski, 2004; Murray, 1998; Waller, 1971].)
8Murray (2003) devoted 5 years of his professional life to writing about and rank-order-ing the top-20 historical figures of all time in 21 disciplines ranging across the humanities, science, and technology based on the density of their coverage in major world encyclope-dias. When asked in a 2011 interview what impressed him the most in terms of common themes cutting across these various creative geniuses, his response was: “How hard they worked” (http://www.isironline.org/2009-madrid-spain/).
9Tilted intellectual profiles and the attendant preferences and problem solving orienta-tions they reflect, when combined with the contemporary literature on the development of expertise and eminence (Simonton, 2014), reinforce Goodenough’s (1956, p. 107) reflec-tions about the importance of diversity of opportunity: “Perhaps we have been too strongly dominated by the concept of a ‘well-rounded personality’; almost certainly we have been inclined to insist upon a stereotyped pattern as the only possible example of a well-adjusted person. We have sung the praises of the extrovert, found virtue in the gregariousness, but have overlooked the desirability of being able to find resources for enjoyment within one-self. This does not mean that social relationships are unimportant. But too much emphasis upon social contacts, particularly for children with many intellectual interests, can defeat its own objective. Often more will be accomplished if less is attempted.” See also Wolfle’s (1960, p. 539) Bingham Lecture, “Diversity of Talent,” and White’s (1973) “The Concept of Healthy Personality: What Do We Really Mean?”
10Particularly germane is the likelihood that knowledge-base differences among same-age students are currently in the process of expanding unprecedentedly: As opportuni-ties become more readily available for all students to efficiently “self-administer” their educational curriculum at the pace and depth at which they are most comfortable (e.g., over the Internet, through computer-adapted instruction, or seeking out equally able peers), knowledge-base differences between students will likely enlarge to an even greater extent
at VANDERBILT UNIVERSITY LIBRARY on November 29, 2016http://rer.aera.netDownloaded from
A Century of Findings on Intellectual Precocity
937
and more rapidly than in the past. A recent article in the Atlantic, “The Math Revolution” (Tyre, 2016), portrays one of many ways in which this is becoming detected and so reported by the popular press. The historical literature anticipated this. Elliott Eisner’s (1999) insistence that the best of schools not only increase the mean of performance but also the variance aligns with this phenomenon, and resonates with Allport’s (1960) remarks and Skinner’s (1968) conceptualization of “the most promising diversity.” Attendant are implications for conceptualizing how schools structure learning, evaluate students and teachers, and facilitate positive development for all students (Asbury & Plomin, 2014; Scarr, 1996; Williamson, 1965).
References
Achter, J. A., Lubinski, D., & Benbow, C. P. (1996). Multipotentiality among intel-lectually gifted: “It was never there and already it’s vanishing.” Journal of Counseling Psychology, 43, 65–76. doi:10.1037/0021-9010.75.1.77
Achter, J. A., Lubinski, D., Benbow, C. P., & Eftekhari-Sanjani, H. (1999). Assessing vocational preferences among gifted adolescents adds incremental validity to abili-ties: A discriminant analysis of educational outcomes over a 10-year interval. Journal of Educational Psychology, 91, 777–786. doi:10.1037/0022-0663.91.4.777
Ackerman, P. L. (1996). A theory of adult intellectual development: Process, personal-ity, interests, and knowledge. Intelligence, 22, 227–257. doi:10.1016/S0160-2896(96)90016-1
Ackerman, P. L. (2014). Nonsense, common sense, and science of expert performance: Talent and individual differences. Intelligence, 45, 6–17. doi:10.1016/j.intell.2013.04.009
Ackerman, P. L., & Heggestad, E. D. (1997). Intelligence, personality, and interests: Evidence for overlapping traits. Psychological Bulletin, 121, 218–245. doi:10.1037/0033-2909.121.2.219
Allport, G. W. (1960). Uniqueness in students. In W. D. Weatherford (Ed.), The goals of higher education. Cambridge, MA: Harvard University Press.
Asbury, K., & Plomin, R. (2014). G is for genes: The impact of genetics on educational achievement. New York, NY: Wiley.
Assouline, S. G., Colangelo, N., & Vantassel-Baska, J. (2015). A nation empowered (Vol. I). Iowa City, IA: Belin-Blank Center.
Assouline, S. G., Colangelo, N., Vantassel-Baska, J., & Lupkowski-Shoplik, A. (2015). A nation empowered (Vol. II). Iowa City, IA: Belin-Blank Center.
Austin, J. T., & Hanisch, K. A. (1990). Occupational attainment as a function of abili-ties and interests: A longitudinal analysis using Project Talent data. Journal of Applied Psychology, 75, 77–86. doi:10.1037/0021-9010.75.1.77
Benbow, C. P. (1992). Academic achievement in mathematics and science between ages 13 and 23: Are there differences among students in the top one percent of math-ematical ability? Journal of Educational Psychology, 84, 51–61. doi:10.1037/0022-0663.84.1.51
Benbow, C. P., Lubinski, D., Shea, D. L., & Eftekhari-Sanjani, H. (2000). Sex differ-ences in mathematical reasoning ability: Their status 20 years later. Psychological Science, 11, 474–480. doi:10.1111/1467-9280.00291
Bleske-Rechek, A., Lubinski, D., & Benbow, C. P. (2004). Meeting the educational needs of special populations: Advanced Placement’s role in developing exceptional human capital. Psychological Science, 15, 217–224. doi:10.1111/j.0956-7976.2004.00655.x
at VANDERBILT UNIVERSITY LIBRARY on November 29, 2016http://rer.aera.netDownloaded from

Lubinski
938
Boring, E. G. (1959). Lewis Madison Terman: 1877–1956. Biographical Memoirs of the National Academy of Science, 33, 414–440.
Campbell, D. P. (1977). Take the road to creativity and get off your dead end. Allen, TX: Argus Communications.
Carroll, J. B. (1993). Human cognitive abilities: A survey of factor-analytic studies. Cambridge, England: Cambridge University Press.
Cattell, R. B. (1957). Personality and motivational structure and measurement. New York: World Book.
Ceci, S. J., & Papierno, P. B. (2005). The rhetoric and reality of gap closing: When the “have nots” gain but the “haves” gain even more. American Psychologist, 60, 149–160. doi:10.1037/0003-066X.60.2.149
Clynes, T. (2016). How to raise a genius: A long-running study of exceptional children reveals what it takes to produce the scientists who will lead the twenty-first century. Nature, 573, 152–155. doi:10.1038/537152a
Colangelo, N., Assouline, S. G., & Gross, M. U. M. (Eds.). (2004). A nation deceived: How schools hold back America’s brightest students. Iowa City: University of Iowa.
Colom, R., & Thompson, P. M. (2011). Understanding human intelligence by imaging the brain. In T. Chamorro-Premuzic, S. Von Stumm, & A. Furnham (Eds.), Handbook of individual differences (pp. 330–352). Cambridge, MA: Blackwell. doi:10.1002/9781444343120.ch12
Corno, L., Cronbach, L. J., Kupermintz, H., Lohman, D. F., Mandinach, E. B., Porteus, A. W., & Talbert, J. E. (Eds.). (2002). Remaking the concept of aptitude: Extending the legacy of Richard E. Snow. Mahwah, NJ: Erlbaum.
Cronbach, L. J. (1957). The two disciplines of scientific psychology. American Psychologist, 12, 671–684. doi:10.1037/h0043943
Cronbach, L. J. (1975). Beyond the two disciplines of scientific psychology. American Psychologist, 30, 116–127. doi:10.1037/h0076829
Cronbach, L. J. (1989). Lee J. Cronbach. In G. Lindzey (Ed.), A history of psychology in autobiography (Vol. VIII, pp. 62–93). Stanford, CA: Stanford University Press.
Cronbach, L. J. (1992a, April 19). Opening remarks: Julian C. Stanley’s Festschrift [Video recording]. San Francisco, CA: American Educational Research Association. Copy in possession of author.
Cronbach, L. J. (1992b). Four Psychological Bulletin articles in perspective. Psychological Bulletin, 112, 389–392. doi:10.1037/0033-2909.112.3.389
Cronbach, L. J. (1996). Acceleration among the Terman males: Correlates in midlife and after. In C. P. Benbow & D. Lubinski (Eds.), Intellectual talent: Psychometric and social issues (pp. 179–191). Baltimore, MD: Johns Hopkins University Press.
Dawis, R. V. (1992). The individual differences tradition in counseling psychology. Journal of Counseling Psychology, 39, 7–19. doi:10.1037/0022-0167.39.1.7
Eisner, E. W. (1999). The uses and limits of performance assessment. Phi Delta Kappan, 80, 658–670.
Ericsson, K. A., Charness, N., Feltovich, P., & Hoffman, R. R. (2006). Cambridge handbook of expertise and expert performance. Cambridge: Cambridge University Press.
Feldman, D. H. (1984). A follow-up of subjects scoring above 180 IQ in Terman’s genetic studies of genius. Exceptional Children, 50, 518–523.
Ferriman, K., Lubinski, D., & Benbow, C. P. (2009). Work preferences, life values, and personal views of top math/science graduate students and the profoundly gifted: Developmental changes and sex differences during emerging adulthood and parent-
at VANDERBILT UNIVERSITY LIBRARY on November 29, 2016http://rer.aera.netDownloaded from

A Century of Findings on Intellectual Precocity
939
hood. Journal of Personality and Social Psychology, 97, 517–532. doi:10.1037/a0016030
Flanagan, J. C., Dailey, J. T., Shaycoft, M. F., Gorham, W. A., Orr, D. B., & Goldberg, I. (1962). Design for a study of American youth. Boston, MA: Houghton Mifflin.
Frey, M. C., & Detterman, D. K. (2004). Scholastic assessment or g? The relationship between the scholastic assessment test and general cognitive ability. Psychological Science, 15, 373–378. doi:10.1111/j.0956-7976.2004.00687.x
Gagne, F. (2005). From noncompetence to exceptional talent: Exploring the range of academic achievement within and between grade levels. Gifted Child Quarterly, 49, 139–153. doi:10.1177/001698620504900204
Garrison, C. G., Burke, A., & Hollingsworth, L. S. (1917). The psychology of a prodi-gious child. Journal of Applied Psychology, 1, 101–110. doi:10.1037/h0070864
Giles, J. (2011). Social science lines up its biggest challenges: “Top ten” crucial ques-tions set research priorities for the field. Nature, 470, 18–19. doi:10.1038/470018a
Gohm, C. L., Humphreys, L. G., & Yao, G. (1998). Underachievement among spatially gifted students. American Educational Research Journal, 35, 515–531. doi:10.3102/00028312035003515
Golden, C. (2014). A grand gender convergence: Its last chapter. American Economic Review, 104, 1–30. doi:10.1257/aer.104.4.1091
Guttman, L. (1954). A new approach to factor analysis: The radex. In P. Lazarsfeld (Ed.), Mathematical thinking in the social sciences (pp. 258–348). New York, NY: Free Press.
Holahan, C. K., Sears, R. R., & Cronbach, L. J. (1995). The gifted group in later matu-rity. Stanford, CA: Stanford University Press.
Holland, J. L. (1996). Exploring careers with a typology: What we have learned and some new directions. American Psychologist, 51, 397–406. doi:10.1037/0003-066X.51.4.397
Hollingworth, L. S. (1926). Gifted children: Their nature and nurture. New York, NY: Macmillan.
Hollingworth, L. S. (1927). Subsequent history of E: Ten years after the initial report. Journal of Applied Psychology, 11, 385–390. doi:10.1037/h0070579
Hollingworth, L. S. (1942). Children above 180 IQ, Stanford-Binet. Yonkers, NY: World Book Company.
Hollingworth, L. S., & Cobb, M. V. (1928). Children clustering at 165 IQ and children clustering at 146 IQ compared for three years in achievement. In Twenty-seventh Yearbook of the National Society for the Study of Education (pp. 3–33). Chicago, IL: University of Chicago Press.
Hollingworth, L. S., Garrison, C. G., & Burke, A. (1922). Subsequent history of E: Five years after the initial report. Journal of Applied Psychology, 6, 205–210. doi:10.1037/h0069972
Humm, D. G. (1946). Validation by remote criteria. Journal of Applied Psychology, 30, 333–339.
Humphreys, L. G., Lubinski, D., & Yao, G. (1993). Utility of predicting group mem-bership and the role of spatial visualization in becoming an engineer, physical sci-entist, or artist. Journal of Applied Psychology, 78, 250–261. doi:10.1037/0021-9010.78.2.250
James, W. (1890). Principles of psychology. New York, NY: Holt.Jenkins, J. J. (1981). Can we have a fruitful cognitive psychology? In H. E. Howe, Jr.
& J. H. Flowers (Eds.) Cognitive processes: Nebraska symposium on motivation 1980 (pp. 211–238). Lincoln, Nebraska: University of Nebraska Press.
at VANDERBILT UNIVERSITY LIBRARY on November 29, 2016http://rer.aera.netDownloaded from

Lubinski
940
Jensen, A. R. (1991). Spearman’s g and the problem of educational equality. Oxford Review of Education, 17, 169–187. doi:10.1080/0305498910170205
Jensen, A. R. (1996). Giftedness and genius: Crucial differences. In C. P. Benbow & D. Lubinski (Eds.), Intellectual talent: Psychometric and social issues (pp. 393–411). Baltimore: Johns Hopkins University Press.
Jung, R. E., & Haier, R. J. (2007). The Parieto-frontal integration theory (P-FIT) of intelligence: Converging neuroimaging evidence. Behavioral and Brain Sciences, 30, 135–187. doi:10.1017/S0140525X07001185
Kell, H. J., Lubinski, D., & Benbow, C. P. (2013). Who rises to the top? Early indica-tors. Psychological Science, 24, 648–658. doi:10.1177/0956797612457784
Kell, H. J., Lubinski, D., Benbow, C. P., & Steiger, J. H. (2013). Creativity and techni-cal innovation: Spatial ability’s unique role. Psychological Science, 24, 1831–1836. doi:10.1177/0956797613478615
Kenny, D. A. (1975). A quasi-experimental approach to assessing treatment effects in the nonequivalent control group design. Psychological Bulletin, 82, 345–362. doi:10.1037/0033-2909.82.3.345
Learned, W. S., & Wood, B. D. (1938). The student and his knowledge. New York, NY: Carnegie Foundation for the Advancement of Teaching.
Lubinski, D. (2000). Scientific and social significance of assessing individual differ-ences: “Sinking shafts at a few critical points.” Annual Review of Psychology, 51, 405–444. doi:10.1146/annurev.psych.51.1.405
Lubinski, D. (2004). Introduction to the special section on cognitive abilities: 100 years after Spearman’s (1904) “‘General intelligence,’ objectively determined and mea-sured.” Journal of Personality and Social Psychology, 86, 96–111. doi:10.1037/0022-3514.86.1.96
Lubinski, D. (2009a). Exceptional cognitive ability: The phenotype. Behavior Genetics, 39, 350–358. doi:10.1007/s10519-009-9273-0
Lubinski, D., & Benbow, C. P. (2000). States of excellence. American Psychologist, 55, 137–150. doi:10.1037/0003-066X.55.1.137
Lubinski, D., & Benbow, C. P. (2006). Study of Mathematically Precocious Youth after 35 years: Uncovering antecedents for the development of math-science expertise. Perspectives on Psychological Science, 1, 316–345. doi:10.1111/j.1745-6916.2006.00019.x
Lubinski, D., Benbow, C. P., & Kell, H. J. (2014). Life paths and accomplishments of mathematically precocious males and females four decades later. Psychological Science, 25, 2217–2232. doi:10.1177/0956797614551371
Lubinski, D., Benbow, C. P., Shea, D. L., Eftekhari-Sanjani, H., & Halvorson, M. B. J. (2001). Men and women at promise for scientific excellence: Similarity not dis-similarity. Psychological Science, 12, 309–317. doi:10.1111/1467-9280.00357
Lubinski, D., Benbow, C. P., Webb, R. M., & Bleske-Rechek, A. (2006). Tracking exceptional human capital over two decades. Psychological Science, 17, 194–199. doi:10.1111/j.1467-9280.2006.01685.x
Mackintosh, N. J. (2011). IQ and human intelligence (2nd ed.). Oxford, UK: Oxford University Press.
Makel, M., Kell, H. J., Lubinski, D., Putallaz, M., & Benbow, C. P. (2016). When lightning strikes twice: Profoundly gifted, profoundly accomplished. Psychological Science, 27, 1004–1018. doi:10.1177/0956797616644735
Meehl, P. E. (1978). Theoretical risks and tabular asterisks: Sir Karl, Sir Ronald, and the slow progress of soft psychology. Journal of Consulting and Clinical Psychology, 46, 806–834.
at VANDERBILT UNIVERSITY LIBRARY on November 29, 2016http://rer.aera.netDownloaded from

A Century of Findings on Intellectual Precocity
941
Meehl, P. E. (1990). Appraising and amending theories: The strategy of Lakatosian defense and two principles that warrant it. Psychological Inquiry, 1, 108–141, 173–180. doi:10.1207/s15327965pli0102_1
Merton, R. K. (1968). The Matthew effect in science. Science, 159, 56–63. doi:10.1126/science.159.3810.56
Messick, S. (1992). Multiple intelligences or multilevel intelligence? Selective empha-sis on distinctive properties of hierarchy: An essay review of Gardner’s Frames of Mind and Sternberg’s Beyond IQ in the context of theory and research on the struc-ture of human abilities. Psychological Inquiry, 3, 365–384. doi:10.1207/s15327965pli0304_20
Miles, W. R. (1956). Carl Emil Seashore (1866–1949) [Biographical memoir]. Washington, DC: National Academy of Science Press.
Murray, C. (2003). Human accomplishment: The pursuit of excellence in the arts and sciences, 800 B.C. to 1950. New York, NY: Harper Collins.
National Research Council (1995). Research-doctorate programs in the United States: Continuity and change. Washington, DC: National Academy Press.
Oden, M. H. (1968). The fulfillment of promise: 40-Year follow-up of the Terman group. Genetic Psychology Monographs, 77, 3–93.
Olszewski-Kubilius, P. (2015). Talent searches and accelerated programming for gifted students. In S. G. Assouline, N. Colangelo, J. Vantassel-Baska, & A. Lupkowski-Shoplik (Eds.), A nation empowered (Vol. II, pp. 111–121). Iowa City, IA: Belin-Blank Center.
Open Science Collaboration. (2015). Estimating the reproducibility of psychological science. Science, 349, 4716. doi:10.1126/science.aac4716
Park, G., Lubinski, D., & Benbow, C. P. (2007). Contrasting intellectual patterns for creativity in the arts and sciences: Tracking intellectually precocious youth over 25 years. Psychological Science, 18, 948–952. doi:10.1111/j.1467-9280.2007.02007.x
Park, G., Lubinski, D., & Benbow, C. P. (2008). Ability differences among people who have commensurate degrees matter for scientific creativity. Psychological Science, 19, 957–961. doi:10.1111/j.1467-9280.2008.02182.x
Paterson, D. G. (1957). The conservation of human talent. American Psychologist, 12, 134–144. doi:10.1037/h0043853
Pinker, S. (2002). The blank slate: The modern denial of human nature. New York, NY: Penguin Putnam.
Plomin, R., DeFries, J. C., Knopik, V. S., & Neiderhiser, J. M. (2013). Behavioral genetics (6th ed.). New York, NY: Worth.
Plomin, R., DeFries, J. C., Knopik, V. S., & Neiderhiser, J. M. (2016). Top 10 replicated findings from behavioral genetics. Perspectives on Psychological Science, 11, 3–23. doi:10.1177/1745691615617439
Pressey, S. L. (1946a). Acceleration: Disgrace or challenge? Science, 104, 215–219. doi:10.1126/science.104.2697.215
Pressey, S. L. (1946b). Time-saving in professional training. American Psychologist, 1, 324–329. doi:10.1037/h0062575
Pressey, S. L. (1949). Educational acceleration: Appraisals and basic problems. Columbus: Ohio State University.
Pressey, S. L. (1955). Concerning the nature and nurture of genius. Scientific Monthly, 81, 123–129.
Renzulli, J. S. (2012). Reexamining the role of gifted education and talent development for the 21st century: A four part theoretical approach. Gifted Child Quarterly, 56, 150–159. doi:10.1177/0016986212444901
at VANDERBILT UNIVERSITY LIBRARY on November 29, 2016http://rer.aera.netDownloaded from
Lubinski
942
Schmidt, D. B., Lubinski, D., & Benbow, C. P. (1998). Validity of assessing educa-tional-vocational preference dimensions among intellectually talented 13-year olds. Journal of Counseling Psychology, 45, 436–453. doi:10.1037/0022-0167.45.4.436
Schmidt, F. L., & Hunter, J. E. (1998). The validity and utility of selection methods in personnel psychology: Practical and theoretical implications of 85 years of research findings. Psychological Bulletin, 124, 262–274. doi:10.1037/0033-2909.124.2.262
Seashore, C. E. (1922). The gifted student and research. Science, 56, 641–648. doi:10.1126/science.56.1458.641
Seashore, C. E. (1930). Carl Emil Seashore. In C. Murchison (Ed.), A history of psychology in autobiography (Vol. 1, pp. 225–297). Worcester, MA: Clark University Press.
Seashore, C. E. (1942). Pioneering in psychology (University of Iowa Studies, No. 398). Iowa City: University of Iowa Press.
Shea, D. L., Lubinski, D., & Benbow, C. P. (2001). Importance of assessing spatial ability in intellectually talented young adolescents: A 20-year longitudinal study. Journal of Educational Psychology, 93, 604–614. doi:10.1037/0022-0663.93.3.604
Shurkin, J. N. (1992). Terman’s kids: The groundbreaking study of how the gifted grow up. Boston, MA: Little Brown.
Siegler, R. S. (1992). The other Alfred Binet. Developmental Psychology, 28, 179–190. doi:10.1037/0012-1649.28.2.179
Simonton, D. K. (1988). Scientific genius. Cambridge, England: Cambridge University Press.
Simonton, D. K. (1994). Greatness: Who makes history and why. New York, NY: Guilford Press.
Simonton, D. K. (1999). Talent and its development: An emergenic and epigenetic model. Psychological Review, 106, 435–457.
Simonton, D. K. (2014). Handbook of genius. New York, NY: Wiley.Skinner, B. F. (1968). The technology of teaching. New York, NY: Appleton-Century-
Crofts.Snow, R. E. (1991). The concept of aptitude. In R. E. Snow & D. E. Wiley (Eds.),
Improving inquiry in the social sciences (pp. 249–284). Hillsdale, NJ: Erlbaum.Snow, R. E. (1999). Commentary: Expanding the breadth and depth of admissions
testing. In S. Messick (Ed.), Assessment in higher education: Issues of access, qual-ity, student development, and public policy (pp. 133–140). Hillsdale, NJ: Erlbaum.
Snow, R. E., Corno, L., & Jackson, D., III. (1996). Individual differences in affective and conative functions. In D. C. Berliner & R. C. Calfee (Eds.), Handbook of edu-cational psychology (pp. 243–310). New York, NY: Macmillan.
Snow, R. E., & Lohman, D. F. (1989). Implications of cognitive psychology for edu-cational measurement. In R. L. Linn (Ed.), Educational measurement (3rd ed., pp. 263–331). New York, NY: Collier.
Spain, S. L., Pedroso, I., Kadeva, N., Miller, M. B., Iacono, W. G., McGue, M., . . . Simpson, M. A. (2016). A genome-wide analysis of putative functional and exonic variation associated with extremely high intelligence. Molecular Psychiatry, 21, 1145–1151. doi:10.1038/mp.2015.108
Spearman, C., & Jones, L. L. (1950). Human ability. London: Macmillan.Stanley, J. C. (2000). Helping students learn only what they don’t already know.
Psychology, Public Policy, and Law, 6, 216–222. doi:10.1037/1076-8971.6.1.216Steen, L. A. (1988). The science of patterns. Science, 240, 611–616. doi:10.1126/
science.240.4852.611
at VANDERBILT UNIVERSITY LIBRARY on November 29, 2016http://rer.aera.netDownloaded from
A Century of Findings on Intellectual Precocity
943
Su, R., Rounds, J., & Armstrong, P. I. (2009). Men and things, women and people: A meta-analysis of sex differences in interests. Psychological Bulletin, 135, 859–884. doi:10.1037/a0017364
Subotnik, R. F., Olszewski-Kubilius, P., & Worrell, F. C. (2011). Rethinking giftedness and gifted education: A proposed direction forward based on psychological science. Psychological Science in the Public Interest, 12, 3–54. doi:10.1177/1529100611418056
Super, D. E., & Bachrach, P. B. (1957). Scientific careers and vocational development theory. New York, NY: Teachers College, Columbia University.
Terman, L. M. (1916). The measurement of intelligence. Boston, MA: Houghton Mifflin.
Terman, L. M. (1917). The intelligence quotient of Francis Galton in childhood. American Journal of Psychology, 28, 209–215. doi:10.2307/1413721
Terman, L. M. (1925). Genetic studies of genius. Stanford, CA: Stanford University Press.
Terman, L. M. (1939). Review of “The student and his knowledge,” by Willian S. Learned and Ben D. Wood. Journal of Higher Education, 10, 111–113. doi:10.2307/1974727
Terman, L. M. (1954a). The discovery and encouragement of exceptional talent. American Psychologist, 9, 221–230. doi:10.1037/h0060516
Terman, L. M. (1954b). Scientists and nonscientists in a group of 800 gifted men. Psychological Monographs, 68, 1–44. doi:10.1037/h0093672
Terman, L. M. (1955). Are scientists different? Scientific American, 192, 25–29. doi:10.1038/scientificamerican0155-25
Terman, L. M., & Fenton, J. C. (1921). Preliminary report on a gifted juvenile author. Journal of Applied Psychology, 5, 163–178. doi:10.1037/h0074962
Terman, L. M., & Miles, C. C. (1936). Sex and personality: Studies in masculinity and femininity. New York, NY: McGraw-Hill.
Thorndike, R. L. (1949). Personnel selection: Test and measurement techniques. New York, NY: John Wiley.
Tyler, L. E. (1965). The psychology of human differences (3rd ed.). New York, NY: Applton-Century-Crofts.
Tyler, L. E. (1992). Counseling psychology—Why? Professional Psychology, 23, 342–344. doi:10.1037/0735-7028.23.5.342
Tyre, P. (2016). The math revolution. Atlantic, 3, 50–57.von Strumm, S., & Ackerman, P. L. (2013). Investment and intelligence: A review and
meta-analysis. Psychological Bulletin, 139, 841–869. doi:10.1037/a0030746Wai, J., Lubinski, D., & Benbow, C. P. (2005). Creativity and occupational accomplish-
ments among intellectually precocious youth: An age 13 to age 33 longitudinal study. Journal of Educational Psychology, 97, 484–492. doi:10.1037/0022-0663.97.3.484
Wai, J., Lubinski, D., & Benbow, C. P. (2009). Spatial ability for STEM domains: Aligning over fifty years of cumulative psychological knowledge solidifies its importance. Journal of Educational Psychology, 101, 817–835. doi:10.1037/a0016127
Wai, J., & Worrell, F. C. (2016). Helping disadvantaged and spatially talented students fulfill their potential: Related and neglected national resources. Policy Insights from the Behavioral and Brain Sciences, 3, 122–128. doi:10.1177/2372732215621310
Warne, R. T. (2012). History and development of above-level testing of the gifted. Roeper Review, 34, 183–193. doi:10.1080/02783193.2012.686425
at VANDERBILT UNIVERSITY LIBRARY on November 29, 2016http://rer.aera.netDownloaded from

Lubinski
944
Warne, R. T. (2015). Five reasons to put the g back into giftedness: An argument for applying the Cattell–Horn–Carroll Theory of intelligence to gifted education research and practice. Gifted Child Quarterly. doi:10.1177/0016986215605360
Webb, R. M., Lubinski, D., & Benbow, C. P. (2002). Mathematically facile adolescents with math-science aspirations: New perspectives on their educational and vocational develop-ment. Journal of Educational Psychology, 94, 785–794. doi:10.1037/0022-0663.94.4.785
Webb, R. M., Lubinski, D., & Benbow, C. P. (2007). Spatial ability: A neglected dimen-sion in talent searches for intellectually precocious youth. Journal of Educational Psychology, 99, 397–420. doi:10.1037/0022-0663.99.2.397
Wells, F. L. (1937). Intelligence and socialization. American Journal of Psychiatry, 93, 1265–1291. doi:10.1176/ajp.93.6.1265
White, R. W. (1959). Motivation reconsidered: The concept of competence. Psychological Review, 66, 297–333. doi:10.1037/h0040934
White, R. W. (1973). The concept of healthy personality: What do we really mean? The Counseling Psychologist, 4, 3–12. doi:10.1177/001100007300400203
Willerman, L. (1979). The psychology of individual and group differences. San Francisco, CA: Freedman.
Williamson, E. G. (1965). Vocational counseling. New York, NY: McGraw-Hill.Witty, P. (1951). The gifted child. Boston, MA: Heath.Wolfle, D. (1960). Diversity of talent. American Psychologist, 15, 535–545.
doi:10.1037/h0046101Wolfle, D. (1969). The discovery of talent: The Walter Van Dyke Bingham lectures on
the development of exceptional abilities and capacities. Cambridge, MA: Harvard University Press.
Worrell, F. C., Olszewski-Kubilius, P., & Subotnik, R. F. (2012). Important issues, some rhetoric, and a few straw men: A response to comments on “Rethinking Giftedness and Gifted Education.” Gifted Child Quarterly, 56, 224–231. doi:10.1177/0016986212456080
Author
DAVID LUBINSKI received both his BA (1981) and PhD (1987) in psychology from the University of Minnesota. From 1987 to 1990, he was a postdoctoral fellow, Quantitative Methods Training Program, Department of Psychology, University of Illinois (Champaign). He is currently professor of psychology at the Department of Psychology and Human Development, Vanderbilt University, 0552 GPC, 230 Appleton Place, Nashville, TN 37203; email: [email protected]. At Vanderbilt University, he co-directs the Study of Mathematically Precocious Youth, a planned 50-year longitudinal study of over 5,000 intellectually talented participants, begun in 1971. His research interests are in mod-eling the development of exceptional intellectual talent over the life span (with cognitive, affective, and conative assessments), and uncovering factors that enhance and attenuate for this population learning and work accomplishments as well as creativity. He has served as president for the International Society for Intelligence Research, a trustee for the Society for Multivariate Experimental Psychology, and associate editor for the Journal of Personality and Social Psychology. In 1996, he received American Psychological Association’s Early Career Award (psychometrics/applied individual differences) and the George A. Miller Outstanding Article in General Psychology Award; in 2006, he received the Distinguished Scholar Award from the National Association for Gifted Children; and in 2015, he received the MENSA Research Foundation’s Lifetime Achievement Award.
at VANDERBILT UNIVERSITY LIBRARY on November 29, 2016http://rer.aera.netDownloaded from