from postal surveys to electronic data capture: building higher response rates christopher taylor,...
TRANSCRIPT

From postal surveys to electronic data capture: building higher response rates
Christopher Taylor, CBI
Technical Development Executive
EU BCS Workshop
November 13th 2014

INTRODUCTION
• THE JOURNEY TO ELECTRONIC DATA CAPTURE (E-CAPTURE)
• THE THINKING BEHIND OUR DECISIONS
• BROADER IMPACTS ON OUR METHODOLOGY
• THE IMPACT ON RESPONSE RATES
• THE FUTURE…

Background context
● The CBI has a long and well established relationship with its participants using paper based surveys dating back to the first Industrial Trends survey in 1958
● At present all CBI business surveys are paper based with the majority being distributed by post and returned via the same method or faxed with some being scanned and emailed
● Participants are also offered the opportunity to return responses over the phone by phoning us themselves or receiving a pre-arranged call
● All our current methods of return are known to be reliable and traditionally popular within our survey samples.
● The long standing nature of these processes mean we have also developed several mitigation processes if a problem such as a postal strike might arise. This contingency planning is a key aspect of our sample management

Is there demand?
● As part of our usual practice we provide space in our questionnaires for participants to comment on any subject they choose
● In some of our samples we were capturing increased interest in online response possibilities
● The Survey management group decided to follow up these comments by asking our broader sample
● We did this by asking about online response in our 2007-09 cycle of Answering Practice surveys. These are research surveys conducted to gain detailed insight into participant response behaviour

Previous APS Findings
We first asked participants about online response in our 2007-09 Answering practices surveys
APS 07-09 Response0%
10%
20%
30%
40%
50%
60%
70%
80%
90%
100%
51%55%
60%
67%
DTS ITS SSS FSS
The findings were positive with an Average of 58% in favour
ITS APS 07 Yes - 55%SSS APS 08 Yes - 60% DTS APS 08 Yes - 51%FSS APS 09 Yes - 67%
The results weren’t absolute but clearly showed there was a encouraging majority in favour of having an online response option
This led to an internal discussion paper investigating online response with the assistance of a third party developer.
A paper proposing a road map to online response was developed but deferred due to the significant amount of work required for the NACE Rev 2/SIC2007 project and updating of the survey weights

Recent APS findings
The ambition to expand our response offering to participants remained, so we turned to our participants again. In the 2012-14 APS surveys we asked participants if they would like the option to submit their response online
● SSS APS 2012 demand had risen to 75%● ITS APS 2013 demand had risen to 73%● DTS APS 2014 demand had risen to 75%
With a clear increase in demand we began looking into a variety of online options that would meet our business and stakeholder requirements as well as our participants response needs
APS 07-09 APS 10-140%
10%
20%
30%
40%
50%
60%
70%
80%
90%
100%
51%
75%
55%
73%
60%
75%
0.67
DTS ITS SSS FSS

GETTING STARTED: project stakeholders
Electronic Data Capture
SMG
Systems
I.T
ITIM
EconomicAnalysis
Participants
Resources
Focus Groups
CBI
Bank of England
European Commission
H.R
FinancePress
Media
Membership
Academic Community
Software Developers
Economic Community
Public
Design
Web Team
Policy
Survey Sponsor
Data Vendors
Key throughout project lifespan
Key to multiple aspects of the project
Key to a particular aspect of project
A strong interest in project

Key consideration when developing the new system
To enable the SMG to collect
data from participants in an
online format
reliability, security and accuracy of
the system created are absolutely paramount
It must be easy to create, adapt and
maintain
Any impact on established systems and methodologies must have clear positive gains
The participants must find it time and cost efficient whilst being simple to use

E-methodology
The method chosen is E-questionnaires using a PDF platform which are distributed by a mail merge system
● What does this mean?
Questionnaire Distributed by post
Participant receives and populates questionnaire
Participant returns response via fax,
post, phone or scan/email
SMG Scrutinises response
Response information entered into main data set
E-questionnaire Distributed via
Participant receives part populated E
questionnaire enters response information
Participant returns response via Submit
button, fax, post, phone
SMG & E-system Scrutinise response
Response information entered into main data set

Why this method?
Existing Response behaviour, brandContinuity
Online and Offline, pre-populationFunctionality
Existing software platform, known process, multiple fail safesStability
Added scrutiny points, maintains existing high levels of scrutinyScrutiny
Non hosted, quick turnaround, internal management and controlProduction

So what does this look like?


We have several established survey process and analytical systems which have been utilised in accordance with some of the functionality now available as a result of our new E-methodology
● Firm Level Data system – Built in 2008/9 this in access data interface linked directly to our survey system response data. It allows the SMG to extract unweight raw data directly from the system in a specified format
● Non-Response model – this is an excel analytical tool that uses participant ID numbers to track response behaviour. The system identifies differing levels of response and non response and helps the SMG identify dormant or non trading participants
● Participant Emails rounds – these are enacted based upon data provided by both the afore mentioned systems
How can we use this opportunity?
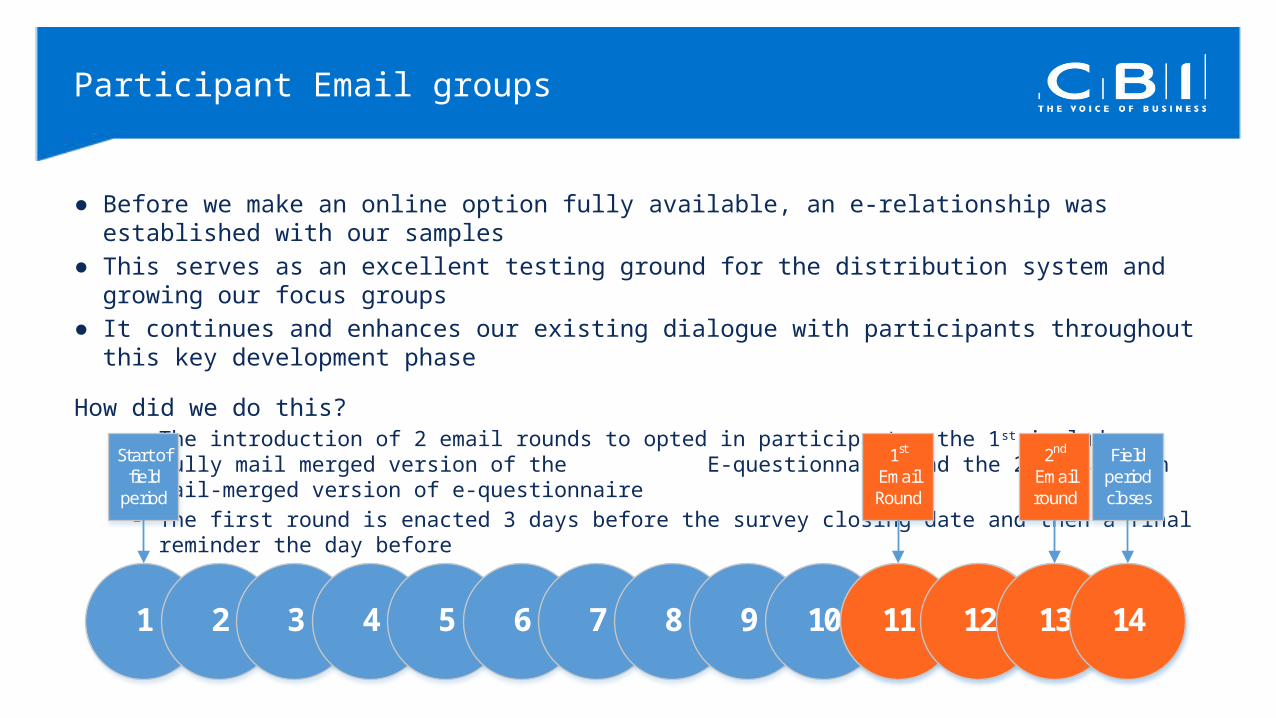
Participant Email groups
● Before we make an online option fully available, an e-relationship was established with our samples● This serves as an excellent testing ground for the distribution system and growing our focus groups● It continues and enhances our existing dialogue with participants throughout this key development phase
How did we do this?- The introduction of 2 email rounds to opted in participants, the 1st includes a fully mail merged version of the
E-questionnaire and the 2nd has a non mail-merged version of e-questionnaire - The first round is enacted 3 days before the survey closing date and then a final reminder the day before
1 2 3 4 5 6 7 8 9 10 11 12 13 14
Start of field
period
Field period closes
11 12 13 14
1st Email Round
2nd Email round

Day 1 Day 2 Day 3 Day 4 Day 5 Day 6 Day 7 Day 8 Day 9 Day 10 Day 11 Day 12 Day 13 Day 14 Day 15 Day 160
10
20
30
40
50
60
70
2013 2014
Average daily response - April-October 2013/14
Below is the average daily response to the Industrial trends survey over a normal field period prior to the introduction of the Email rounds and post. The impact of the Email rounds is clearly illustrated by the appearance of the upward curve on the final 4 days of the 2014 trend line

Email round impact on final 4 days of field period 2013 vs. 2014
Day 1 Day 2 Day 3 Day 4
19
12
18
3
46
38
36
16
Industrial trends
2013 2014
The charts show the year on year increase in response rates over the final 4 days of the September field periods for the Service sector and Industrial trends survey
Day 1 Day 2 Day 3 Day 4
9
6
4
1
21
12
11
6
Service Sector
2013 2014

Percentage increase in Total response over the last 6 months
The percentage increase in Response rates April-October 2014 in relation to the equivalent period 2013
May June July August September October
-20.0%
-10.0%
0.0%
10.0%
20.0%
30.0%
40.0%
8.6%
27.7%
22.8%
1.0%
22.6%20.5%
-11.0%
26.7%
21.4%
33.7% 34.8%33.1%
Industrial Trends Service Sector

The Distributive Trades survey total response over the final 4 days 2013/14
The distributive trades sample has reacted positively although slightly differently from the other samples
In place of a large spike in response post the email rounds we’ve seen an evenly proportioned increase in response.
April May June July August September October0
10
20
30
40
50
60
3537 37
2730
40
33
47
56 55
46
55
49
41
Distributive Trades final 4 days of Field period response totals 2013 2014

20
Average growth
The average proportion of survey responses received within the final 4 days of our surveys has grown from 18% to just over 30%
Since elements of our E-methodology were introduced we have observed an average growth rate of 14.9% in our sample
Average
Distributive Trades
Industrial Trends
Service Sector
0.0% 5.0% 10.0% 15.0% 20.0% 25.0%
14.9%
9.7%
15.7%
19.4%
Average growth in sample size
18.6%
81.4%
30.3%
69.7%
This is a work in progress but the initial results are very encouraging, we’re seeing growth in all our samples
Our participants have greeted our work with enthusiasm and are providing invaluable feedback
Development work will continue with additional functionality continuing to be made available to participants
2015 will be a key year for rolling out and promoting our full E-methodology to a wider audience
Summary

Prepare Survey folder
Run E-participant report
Participants opt in via Questionnaire/email/phone
Mail merge distribution
Participants receive e-questionnaire as an email attachment
Scrutiny
Pre distribution Email
Prepare E-questionnaire
E-Capture 4 stage cycle
The operational step-by-step run through of the processes incorporated within our E-methodology
Response
Late/non response
S c r u t i n y
Participant opens pre-populated E-questionnaire
Participants enter answers
Response returned to designated Email inbox
Participants Submit response
printed version
returned Via Fax or
Post
Via Submit button
As email attachment
Scrutiny
Responses saved to response folder
Data mapping conducted
Mapped response data placed into Import folder
Results uploaded onto survey system via importer
Response data extracted into spreadsheet
S c r u t i n y
All imported data will be marked as manual or E-capture
3 calculation reports will be run for each survey
Non web responses
only
Web responses
only
Combo of All
Reponses
Data supplied to Economists
Economists conduct analysis of results

The future and the E-community
What do we expect in the future…● Instant and easy dialogue survey sample● Resilient process, provision of support to postal system● Possible ad-hoc questions● Embedded links● Social media● Online metrics/analytics● New response metrics● New soft material delivered to participants● Greener ● Broader distribution of soft media

Thank you!
Thank you to the Commission for the opportunity to present today
Thank you to my colleagues at the CBI
I look forward to answering any questions you might have