from mfa to seea to smm material sado-masochism for beginners upton resources presentation...
TRANSCRIPT

Simon Upton Director OECD Environment Directorate
From MFA to SEEA to SMM
Material Sado-Masochism for Beginners

Organisation for Economic Co-operation and Development (OECD) 2
A story of industrial entropy
Increasing cost
Atmosphere
Resource Stocks Reservoirs
Increasing Saturation
Water
Terrestrial
62 Gt
49 Gt of GHG
22 Mt of P
12 Gt of Waste
Source: OECD/IEA data, OECD Materials Report

Organisation for Economic Co-operation and Development (OECD) 3
Planetary accounting level
Global Extraction Used (GEU) =
Global Material Consumption (GMC)
Unused Global Extraction (UGE)
Reusable
• Mining overburden • Harvest residues • Fishery by-catch • Soil erosion from agriculture
Global Extraction Waste

Organisation for Economic Co-operation and Development (OECD) 4
62 Gt of material resources extracted in 2008
8.2 Gt 12.7 Gt 20.3 Gt
30%
50%
90% 90%
70%
50%
10% 10%
0%
10%
20%
30%
40%
50%
60%
70%
80%
90%
100%
Fossil Energy Carriers
Metals Biomass Minerals
Unused Extraction
Used Extraction
20.8 Gt
Source: OECD Material Flow Analysis Data, SERI

Organisation for Economic Co-operation and Development (OECD) 5
National accounting level
Domestic Extraction
Domestic Extraction
Used (DEU)
Waste Unused
Domestic Extraction
(UDE)
Reusable / recycled

Organisation for Economic Co-operation and Development (OECD) 6
Domestic Extraction Used (DEU) 17.1 Gt
Domestic Material Consumption (DMC) 17.8 Gt
But nations trade; from DEU to DMC
Exports 0.4 Gt
Imports 1.1 Gt
Imports 0.08 Gt
Exports 0.7 Gt
Domestic Extraction Used (DEU)
1.6 Gt
Domestic Material Consumption (DMC)
1 Gt
Australia China
Source: OECD computations based on UN COMTRADE data.

Organisation for Economic Co-operation and Development (OECD) 7
Global material resource extraction, 1980-2008
0
10
20
30
40
50
60
70
1980 1990 2000 2008
Billi
ons o
f met
ric to
nnes
(Gt)
Industrial minerals
Wood
Metals
Fossil energy carriers
Construction minerals
Biomass (food & feed)
+49%
+80%
+60%
+133% +19%
-29%
Source: OECD Material Flow database and SERI (Sustainable Europe Research Institute)

Organisation for Economic Co-operation and Development (OECD) 8
Regional shares – all have increased
OECD41%
BRIICS35%
RoW24%
Fossil fuels9.2 billion tonnes
1990 2008
OECD56%BRIICS
26%
RoW18%
Minerals20.8 billion tonnes
OECD72%
BRIICS14%
RoW14%
Minerals14.5 billion tonnes
OECD30%
BRIICS43%
RoW27%
Fossil fuels12.7 billion tonnes
OECD38%
BRIICS29%
RoW33%
Metals4.1 billion tonnes
OECD29%
BRIICS39%
RoW32%
Biomass16.3 billion tonnes
OECD43%
BRIICS33%
RoW24%
Metals8.2 billion tonnes
OECD23%
BRIICS42%
RoW35%
Biomass20.2 billion tonnes
1990 2008
Source: OECD Material Flow database and SERI (Sustainable Europe Research Institute)
Organisation for Economic Co-operation and Development (OECD) 9
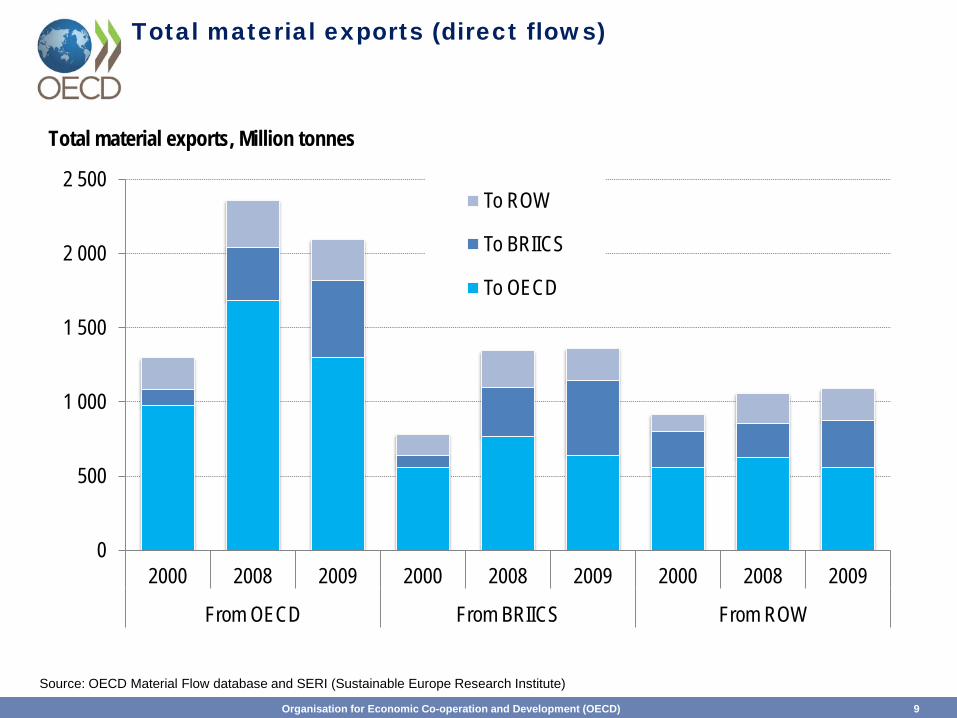
Total material exports (direct flows)
0
500
1 000
1 500
2 000
2 500
2000 2008 2009 2000 2008 2009 2000 2008 2009
From OECD From BRIICS From ROW
To ROW
To BRIICS
To OECD
Total material exports, Million tonnes
Source: OECD Material Flow database and SERI (Sustainable Europe Research Institute)

Organisation for Economic Co-operation and Development (OECD) 10
The System of Environmental-Economic Accounting (SEEA) – A framework for measuring interactions between the environment and the economy

Organisation for Economic Co-operation and Development (OECD) 11
SEEA Conceptual Framework
Territory of reference
Environment
Natural Resources (stocks) -Land -Water
-Ecosystems -Soil -Etc.
Natural Resource flows -Materials -Energy -Water
-Ecosystem services -Etc.
Economy
Activities -Production
-Consumption -Accumulation
Instruments -Financial/Monetary
-Taxes/subsidies -Financing -Resource rent -Permits
Actors -Enterprises -Households -Government
-Non-profit institutions
Outside territory of reference
Outside territory of reference
Analytical and Policy Frameworks
-Productivity analysis
-Natural resource management -Climate change
-Green Growth/Green Economy
Land / Resource use / Ecosystems
Emissions / waste

Organisation for Economic Co-operation and Development (OECD) 12
SEEA Conceptual Framework Challenges
SEEA Central Framework was adopted as the international statistical standard in 2012; Efforts are needed to implement it to ensure consistency and comparability of measures. More and improved data are needed on...
stocks and flows of non-energy minerals stocks and flows of waste secondary raw materials better data for MFA including trade
changes in key stocks and flows
land valuation social values of resources
subsidies regulatory instruments
Valuation
Physical side
Policy tools

Organisation for Economic Co-operation and Development (OECD) 13
Global distribution of phosphate rock reserves, 2010
Morocco and Western Sahara
77%
China 6%
Algeria 3%
Syria 3%
South Africa 2%
Jordan 2%
USA 2%
Other countries 5%
Source: U.S. Geological Survey.

Organisation for Economic Co-operation and Development (OECD) 14
Global distribution of rare earth oxides by end-use, 2008
Phosphors 7%
Batteries 9%
Magnets 20%
Metal alloys 9% Glass industry
22%
Ceramics 6%
Catalysts 21%
Other 6%
Source: Adapted from BGS (2010) and Goonan (2011).

Organisation for Economic Co-operation and Development (OECD) 15
Copper mine grades and recoveries
Source: Citigroup (2011)

Organisation for Economic Co-operation and Development (OECD) 16
Energy consumption across the conventional milk production and consumption system

Thank you
From MFA to SEEA to SMM