from inferior to superior products: an inquiry into the wenzhou
TRANSCRIPT

n
omicrocesselectriclity
tionary.ku-ku,al
ights
Journal of Comparative Economics 32 (2004) 542–563
www.elsevier.com/locate/jce
From inferior to superior products:an inquiry into the Wenzhou modelof industrial development in China
Tetsushi Sonobea, Dinghuan Hub, Keijiro Otsukaa,∗
a Foundation for Advanced Studies on International Development, Wakamatsu-cho, Shinjuku-ku,Tokyo 162-8677, Japan
b Institute of Agricultural Economics, Chinese Academy of Agricultural Sciences, Beijing 100081, China
Received 27 December 2002; revised 14 May 2004
Available online 3 July 2004
Sonobe, Tetsushi, Hu, Dinghuan, and Otsuka, Keijiro—From inferior to superior products: ainquiry into the Wenzhou model of industrial development in China
Although the vitality of small private enterprises as the prime mover of the substantial econgrowth in Wenzhou is widely recognized, empirical research investigating the development pof such private enterprises is useful. Based on a survey of enterprises producing low-voltageappliances, we find that the entry of a large number of new enterprises producing poor-quaproducts was followed by the upgrading of product quality and the introduction of new marketingstrategies. Hence, we attempt to identify statistically the mechanisms underlying this evoluprocess of industrial development.Journal of Comparative Economics 32 (3) (2004) 542–563Foundation for Advanced Studies on International Development, Wakamatsu-cho, ShinjuTokyo 162-8677, Japan; Institute of Agricultural Economics, Chinese Academy of AgriculturSciences, Beijing 100081, China. 2004 Association for Comparative Economic Studies. Published by Elsevier Inc. All rreserved.
JEL classification: O12; P23
* Corresponding author.E-mail address: [email protected] (K. Otsuka).
0147-5967/$ – see front matter 2004 Association for Comparative Economic Studies. Published by ElsevierInc. All rights reserved.doi:10.1016/j.jce.2004.05.001
T. Sonobe et al. / Journal of Comparative Economics 32 (2004) 542–563 543
ship-
inesejiang),
uina due990s.el andat
ith theushender.
alhieved
ion inivateancesinly ins were
ormusing
ctoriessoumberntss.ent of arcome
ion oft on the
re
)er, wemingalso
nce ofent.
1. Introduction
China’s substantial economic growth in the 1980s is attributable mainly to townand village enterprises (TVEs) according toChen et al. (1992), Jefferson et al. (1996), andOtsuka et al. (1998). However, the private sector emerged as the new engine of Checonomic growth in the 1990s. The heartland of this private sector growth is ZheProvince, particularly in Wenzhou City asZhang (1989), Nolan (1990), Dong (1990Wang (1996), Li (1997), Zhang (1999) and Sonobe et al. (2002)attest. Although Wenzhoused to be a poor rural area, it now ranks among the most prosperous cities in Chto its relatively rapid economic growth in the 1980s and its explosive growth in the 1Initially, poor farmers began to produce poor-quality consumer goods, e.g., apparfootwear items, and sold them in major cities throughout China. The label indicating ththe product was made in Wenzhou became synonymous with inferior products. Wrise in their income levels in the 1990s, consumers in China became increasingly fastidioabout the quality of products. Hence, enterprises in Wenzhou attempted to improve tquality of their products. How these enterprises were able to upgrade their products aovercome their bad reputations to capture the national market is the topic of this pap
The development strategy pursued in Wenzhou is widely acclaimed, but few empiricinquiries have investigated how small and medium scale enterprises in Wenzhou acsuch dramatic industrial growth. We analyze the process of innovation and imitatthe industrial development in Wenzhou by using primary data collected from prenterprises in the low-voltage electric appliance industry. Low-voltage electric applirefer to products such as switches, wall outlets, and ammeters that are used mahouses, apartments, and office buildings. In the planned economy period, these itemrationed and it was difficult to obtain replacements and parts. Before the economic refin 1978, this industry began in Wenzhou when a farmer produced simple partsscraps from the factories of state owned enterprises and sold them illegally to faand offices in Shanghai.Schumpeter (1912)classifies this activity as a new combinationthat this farmer should be considered to be an innovator. In the mid 1980s, when a nof enterprises produced and marketed low-quality products despite increasing complaifrom their customers, a few enterprises began to improve the quality of their productOne enterprise actually introduced new marketing strategies, such as the establishmbrand name and the development of a network of own sales throughout China, to ovethe bad reputation of Wenzhou as the homeland of inferior products. The introductthese new strategies constitutes another innovation, which had a pervasive impacgrowth of the industry because it stimulated imitation by many other enterprises.
Recently, the evolutionary process of innovation and imitation in the economic literatuhas attracted much attention, e.g.,Filson (2002), Gort and Klepper (1982), Jovanovicand MacDonald (1994a, 1994b), Klepper (1996, 2002), andKlepper and Simons (2000.However, few empirical studies are found in less developed economies. In this papinvestigate the improvement of product quality, the marketing strategies for overcothe bad reputation, and the diffusion through imitation by followers in Wenzhou. Weexplore the consequences of this innovation and imitation for the growth performathe industry to understand the essence of the Wenzhou model of industrial developm

544 T. Sonobe et al. / Journal of Comparative Economics 32 (2004) 542–563
k.
ity.ting inture
rn ofonomy,as
onents,y, poor
veic
terapidly
e rapid
ctbediess withucts. Ifroved
ity
as
t,reasesfor
urage
ncts ofing
such
The paper is organized as follows.Section 2contains a brief conceptual frameworAfter the pattern of economic growth in Wenzhou is described,Section 3provides detailsof the history of the industry, especially the process of improvements in product qualSection 4formulates the hypotheses and specifies the equations for empirical tesSection 5. Finally, we summarize our major findings and discuss implications for fustudies inSection 6.
2. Conceptual framework
Until the mid 1980s, the quality of manufactured products was not a major conceChinese consumers because most goods were in short supply. In the planned ecplanners had little interest in the quality ofbuilding materials and components as longthe structures built did not topple; hence, builders used cheap materials and compincluding low-voltage electric appliances. As the transition from a planned economto a market economy proceeded and as the income level of consumers rosequality products became increasingly difficult to sell and it became profitable to improproduct quality. According to our interviews, an increasing number of low-voltage electrappliance enterprises in Wenzhou began improving the quality of their products in the la1980s. Subsequently, enterprises introduced a mass production system to meet thegrowing demand for their products due to the booming construction business and thelectrification in poor rural villages in the 1990s.
According to the literature concerning the effects of imperfect information on produquality pioneered byAkerlof (1970), an enterprise’s effort to improve quality mayfruitless due to adverse selection if the products having improved quality are interminglewith poor-quality products of other enterprises. This literature suggests several strategto avoid this problem, including the establishment of brand names, direct transactioncustomers, and the use of sales agencies that deal only in the enterprise’s prodthe brand name is virtually unknown to consumers, the producer who has just impproduct quality may not be able to command the high prices associated with high qualitems until his reputation is established.Shapiro (1983)assumes that the pricep of aproduct is an increasing function of the level of qualityθP perceived by consumers whereproduction costC is an increasing function of both actual qualityθA and outputQ. Hence,profit is given byπ = p(θP )Q − C(Q,θA). Immediately after quality improvemenperceived qualityθP remains low whereas production cost has increased with the incin the actual qualityθA so that the profit margin decreases.Shapiro (1983)demonstratethat the optimal policy is to keep selling the improved product with thin profit marginsa certain period of time, which can be interpreted as an investment in reputation.Klein andLeffler (1981)show that high profit margins of enterprises with good reputations encothem to maintain their reputations for the high quality of products.
We adopt the following conceptual framework to investigate quality improvement ithe low-voltage electric appliance industry in Wenzhou. Suppose that the produall enterprises are equally poor initially, but that some enterprises succeed in improvproduct quality. For these forerunners, a perception gap betweenθP and θA emergesleading to low profit margins even if these enterprises introduce signaling devices

T. Sonobe et al. / Journal of Comparative Economics 32 (2004) 542–563 545
e in these the
withependayality.
ess of
s of thedowever,is vast,
et andggests
ngtheth.esrisesince
ous toen
ityic
ed thans their
on andrialoutch asme
eirnewalastse
ducts03
were
as brand names and own retail networks. As a result, sales volume does not increasshort run in spite of the improved product quality. However, consumers who purchaproducts of these enterprises revise their perceptions if the high quality is maintained andthis information may also be communicated to other potential buyers. The rapiditywhich perception gaps are narrowed depends on sales volume, which will in turn don the price of the product. AsShapiro (1983)indicates, quality-improvingenterprises mreduce the price, and thus profit margins, intentionally to build their reputations for quAs the perception gap narrows, these enterprises earn high profits and begin to grow.
Observing the success of such enterprises, an increasing number of other enterprisfollow suit by imitating both the high quality products and the marketing strategiethe leading enterprises. These followers may also imitate the production processeleaders to meet the increasing demand for high quality products. Other enterprises thatnot imitate the products or marketing strategies of the leaders are left behind. Hosince the range of the Chinese markets served by producers of electric componentssome enterprises may specialize intentionally in the low-quality segment of the marktarget rural households with very low incomes. Thus, our conceptual framework suthat three types of enterprises, namely, leaders, followers, and laggards, will arise.
Efforts to improve product quality represent partly a response to the decliniprofitability of producing simple, low-quality products and partly a response toincreasing demand of consumers for high-qualityproducts associated with income growAlthough statistical evidence on quality improvements of low-voltage electric appliancin the entire Chinese market is difficult to obtain, our informal interviews with enterpmanagers in Wenzhou clearly indicate that competition on quality has intensifiedthe late 1980s. However, the growing demand for high-quality products is exogenthe enterprises in Wenzhou because it is determined by the rate of economic growth of thentire Chinese economy. Although the demand for high-quality products would have growgradually with income growth, quality competition began suddenly after the profitabilof producing low quality products declined inthe early 1990s. Hence, internal economforces stimulated directly the improvement of product quality.
We conjecture that the managers in the leading enterprises are more educatthose in the other enterprises and that their prior experience in marketing influencemanagement strategy by the leading enterprises. Such a link between innovatiexperience is suggested by both historical evidence and recent case studies of industdevelopment.Landes (1969)argues that the internal contradictions of the putting-system in the proto-industrialization in England in the seventeenth century, suthe embezzlement of cloth and other material by domestic weavers, were overcoby merchants through the introduction of thefactory production system because thexperiences in selling and manufacturing alerted them to the possibility of thisprofitable production system. Recent case studies of garment clusters in HiroshimPrefecture in Japan after World War II and in Zhejiang Province in China for thetwo decades report that new marketing and production systems were introduced to theclusters by former local merchants with relatively high education when inferior prowere replaced with superior products (Sonobe et al., 2002 and Yamamura et al., 20).In a case study of the machine tool industry in Taiwan,Sonobe et al. (2003)reports thatthe new methods of production and marketing of numerically controlled machines

546 T. Sonobe et al. / Journal of Comparative Economics 32 (2004) 542–563
se newIn the
n their
d buthand-u,and then theh were
-farm
sing tooltageoductsallyInnticelpedrs.of theimilar
tiesarette
oreholdd final
odaylongittrade,
apital
ializedin
first introduced by two new enterprises with highly educated managers and that themethods were imitated quickly by the experienced manufacturers of machine tools.following section, we characterize the innovators and imitators in Wenzhou based oeducational and occupational backgrounds.
3. The process of economic development in Wenzhou
When the economic reform started in 1978, Wenzhou was densely populateendowed with little arable land. Poor farmers peddled miscellaneous low-quality,made goods, such as leather goods, apparel, and footwear, to major cities. Within Wenzhofew state-owned enterprises were set up because Wenzhou is close to Taiwanfinancially weak local governments could not afford to establish TVEs. However, iearly 1980s, a large number of small-scale red-cap enterprises emerged, whicessentially private but disguised themselves as TVEs. AsNolan (1990)asserts, privateenterprises were important in the non-farm sector in poor areas with weak noneconomies.
The local governments in Wenzhou didnot simply permit free economic activitiepassively; they facilitated them by constructing several local marketplaces. Accordour interviews with the managers of long-established enterprises producing low-velectric appliances, the establishment of the marketplace for various metal prin Yueqing city, which is a lower-level city within Wenzhou city, reduced drasticthe difficulties in procuring raw materials and finding buyers for their products.the marketplace, producers learn the ideas and designs of other producers and obtaiinformation from outside traders on what products are selling in large cities. The drasreduction in search costs and the spillovers of valuable market information not only hincumbents but also attracted new entrants, who were farmers, factory workers, and tradeThus, the entry of new enterprises increased significantly after the constructionmarketplace in the early 1980s. As a result, a cluster of enterprises producing sproducts was formed in Yueqing. Similar development processes took place in other ciwithin Wenzhou specializing in other products, such as garments, footwear, and ciglighters. Thus,Dong (1990), Wang (1996), andLi (1997) argue that, although the majcharacteristic of the Wenzhou model of development is the growth of private housenterprises, the role of specialized markets in facilitating transactions of parts anproducts is no less important.1
Friedmann (2003)argues that to interpret accurately what is happening in China trequires a knowledge of history, particularly a history of cities. Wenzhou has atradition of handicrafts and commerce beginning in the Sung period, even thoughwas not as prosperous as Ningbo, a center of long-distance as well as foreignfrom which it is separated by a chain of high mountains (Shiba, 1968, 1977; Skinner,1977). Because of this tradition, this city was endowed with substantial human c
1 According toLi (1997), Wenzhou had as many as 528 specialized markets, of which 114 markets specin different parts, materials, and machines for industrial production and construction and the rest dealtconsumption goods.
T. Sonobe et al. / Journal of Comparative Economics 32 (2004) 542–563 547
it hadzhouzhouou andnt,not beroughhina
qingrcent
apita inonomicin1990s.of
gestducing
in
in the form of latent mercantile skills when the reform began and, consequently,strong potential for growth. Indeed, this tradition led to active outmigration of Wenpeople during the reform period, which has contributed to the formation of Wenmarkets in various large Chinese cities and commercial networks between Wenzhthose cities, including Beijing(Zhang, 2001). Thus, the Wenzhou model of developmewhich depends on a network of Wenzhou traders working throughout China, mayreplicable. Nonetheless, rural-urban information and marketing networks created thmigration play a key role in the development of rural industries in other parts of C(Murphy, 2002)and also in other East Asian countries(Otsuka, 1998).
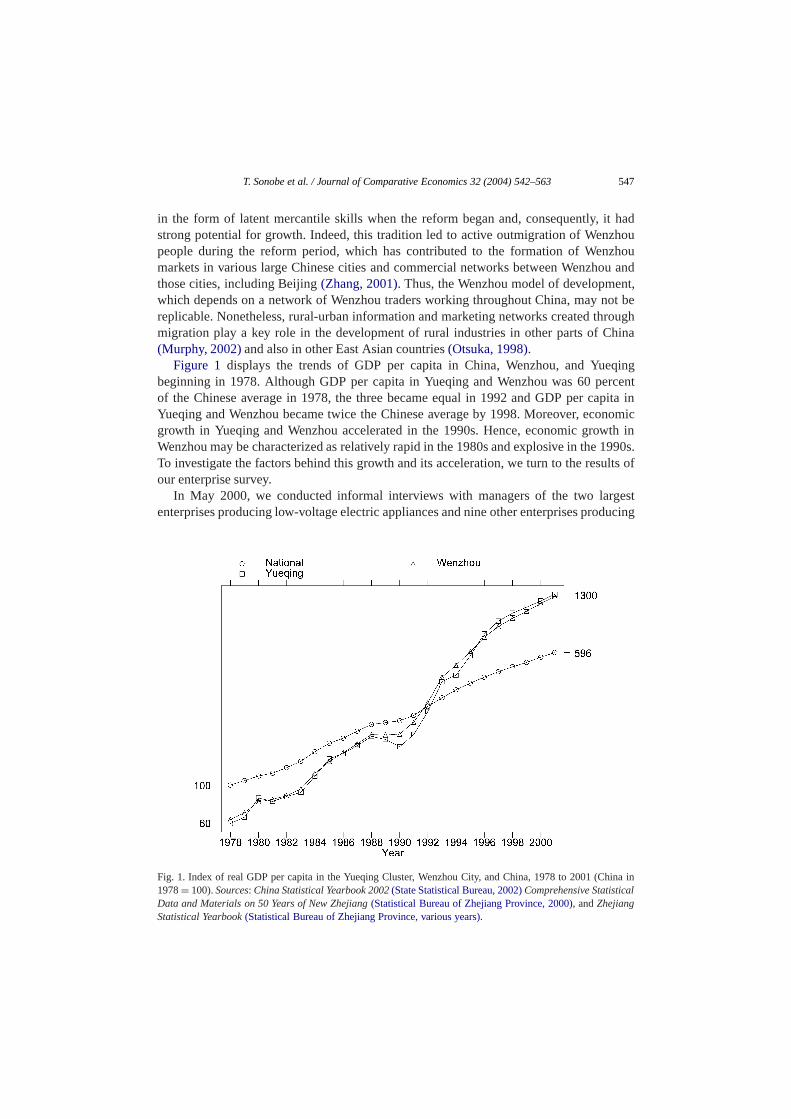
Figure 1 displays the trends of GDP per capita in China, Wenzhou, and Yuebeginning in 1978. Although GDP per capita in Yueqing and Wenzhou was 60 peof the Chinese average in 1978, the three became equal in 1992 and GDP per cYueqing and Wenzhou became twice the Chinese average by 1998. Moreover, ecgrowth in Yueqing and Wenzhou accelerated in the 1990s. Hence, economic growthWenzhou may be characterized as relatively rapid in the 1980s and explosive in theTo investigate the factors behind this growth and its acceleration, we turn to the resultsour enterprise survey.
In May 2000, we conducted informal interviews with managers of the two larenterprises producing low-voltage electric appliances and nine other enterprises pro
Fig. 1. Index of real GDP per capita in the Yueqing Cluster, Wenzhou City, and China, 1978 to 2001 (China1978= 100).Sources: China Statistical Yearbook 2002 (State Statistical Bureau, 2002)Comprehensive StatisticalData and Materials on 50 Years of New Zhejiang (Statistical Bureau of Zhejiang Province, 2000), andZhejiangStatistical Yearbook (Statistical Bureau of Zhejiang Province, various years).

548 T. Sonobe et al. / Journal of Comparative Economics 32 (2004) 542–563
000
dave of,ed them,nd 90e
of partsand
currentndof 112
of theoftrantsructed.ase inthentrantsearly
entryse, whichre the
lly
ant
art of
Table 1Characteristics of enterprise founders
Before 1980 1981–1985 1986–1990 1991–1995 1995–2
No. of enterprises 4 32 30 36 10Years of schooling 8.0 9.8 10.0 10.5 10.9Occupation (%)
Farmers 50 12.5 6.7 2.8 0Factory workers 0 25 16.7 16.7 10Salesmen or traders 25 25 43.3 63.9 50Engineers 0 3.1 13.3 5.6 0Managers 0 9.4 10 5.6 10Others 25 25 10 5.6 30
garments, footwear, and cigarette lighters in Wenzhou.2 After this survey, we decideto focus on the low-voltage electric appliance industry and conducted a second wpersonal interviews with eight enterprise managers, including the initiator of this industryin December 2000. Based on these interviews, we designed questionnaires, pretestand conducted a formal survey of 117 enterprises producing finished products aenterprises producing parts in Yueqing city from May to December 2001. In this paper, wanalyze the data for enterprises producing finished products and leave the analysissuppliers to future study.3 We obtained data on production and costs in 1990, 1995,2000, as well as various characteristics of the enterprises, their founders, and theirmanagers. We eliminated five enterprises from the analysis because their production acost data were either incomplete or highly suspicious. Thus, the sample consistsenterprises, all of which were active at the time of our survey.
Table 1displays the number of sample enterprises, the average years of schoolingfounders, and the percentage composition of their occupational backgrounds at the timetheir entry into the industry. The industry began in 1973 and the number of new enincreased dramatically in the early 1980s when the first marketplace was constThe years of schooling of the founders increased gradually along with the increthe average education level in Wenzhou. However, the occupational backgrounds ofentrants changed drastically. The proportion of farmers was high among the early ebut the proportion of factory workers as a former occupation was high in the1980s, suggesting that prior knowledge of marketing and engineering was not anrequirement in the early stage of development.4 In the later periods, the proportion of theoccupations declined as the majority of new entrants were salesmen and tradersis characteristic of merchant-led industrial development, in which the merchants aentrepreneurs.5
2 The qualitative pattern of development in the garment and footwear industries did not differ substantiafrom that in the low-voltage electric appliance industry.
3 Thus, this paper neglects the inter-enterprise division of labor even though we think that it plays an importrole in the development of the industry.
4 Sonobe et al. (2002)find a similar tendency in a cluster of garment enterprises in the northern pZhejiang Province.
T. Sonobe et al. / Journal of Comparative Economics 32 (2004) 542–563 549
ear.ies.000achinery
ge sizeas wasisesdiaries.me5, andlateer
6 to 94
priset half
rprisescludedsample
the latenagerse, thishnicalg
erpriser or noton isthree
Table 2Descriptive statistics
1990 1995 2000
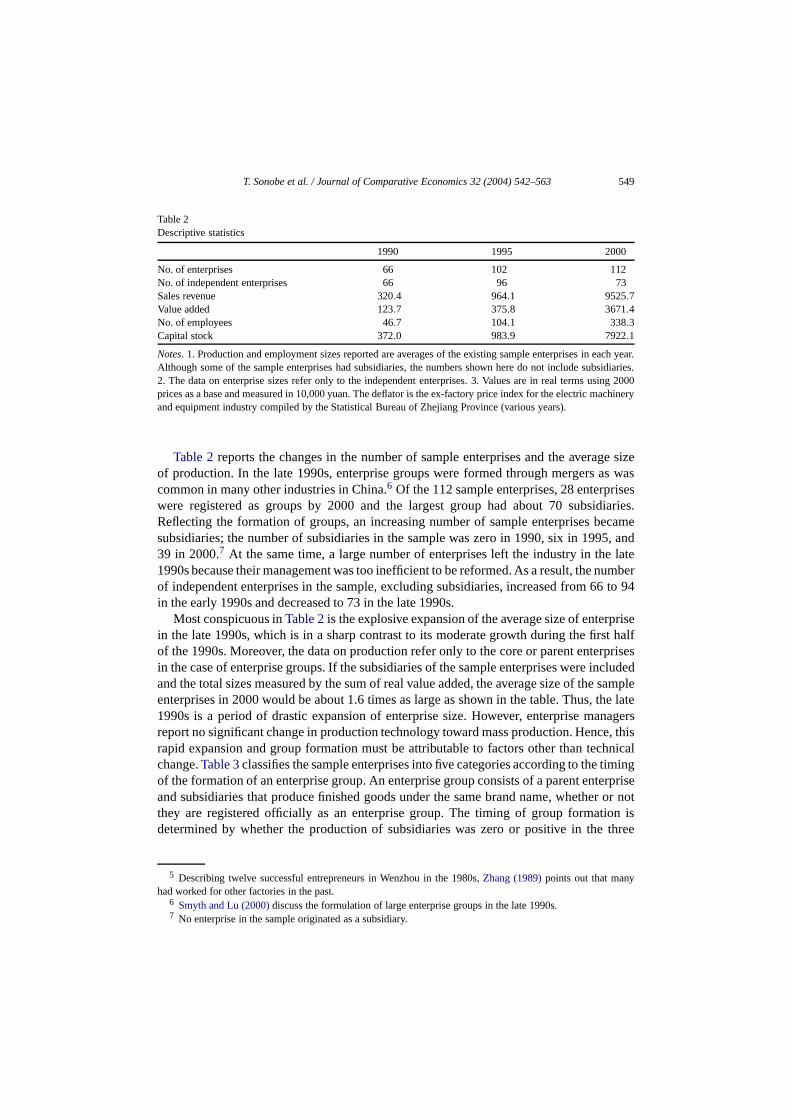
No. of enterprises 66 102 112No. of independent enterprises 66 96 73Sales revenue 320.4 964.1 9525.7Value added 123.7 375.8 3671.4No. of employees 46.7 104.1 338.3Capital stock 372.0 983.9 7922.1
Notes. 1. Production and employment sizes reported are averages of the existing sample enterprises in each yAlthough some of the sample enterprises had subsidiaries, the numbers shown here do not include subsidiar2. The data on enterprise sizes refer only to the independent enterprises. 3. Values are in real terms using 2prices as a base and measured in 10,000 yuan. The deflator is the ex-factory price index for the electric mand equipment industry compiled by the StatisticalBureau of Zhejiang Province (various years).
Table 2reports the changes in the number of sample enterprises and the averaof production. In the late 1990s, enterprise groups were formed through mergerscommon in many other industries in China.6 Of the 112 sample enterprises, 28 enterprwere registered as groups by 2000 and the largest group had about 70 subsiReflecting the formation of groups, an increasing number of sample enterprises becasubsidiaries; the number of subsidiaries in the sample was zero in 1990, six in 19939 in 2000.7 At the same time, a large number of enterprises left the industry in the1990s because their management was too inefficient to be reformed. As a result, the numbof independent enterprises in the sample, excluding subsidiaries, increased from 6in the early 1990s and decreased to 73 in the late 1990s.
Most conspicuous inTable 2is the explosive expansion of the average size of enterin the late 1990s, which is in a sharp contrast to its moderate growth during the firsof the 1990s. Moreover, the data on production refer only to the core or parent entein the case of enterprise groups. If the subsidiaries of the sample enterprises were inand the total sizes measured by the sum of real value added, the average size of theenterprises in 2000 would be about 1.6 times as large as shown in the table. Thus,1990s is a period of drastic expansion of enterprise size. However, enterprise mareport no significant change in production technology toward mass production. Hencrapid expansion and group formation must be attributable to factors other than tecchange.Table 3classifies the sample enterprises into five categories according to the timinof the formation of an enterprise group. An enterprise group consists of a parent entand subsidiaries that produce finished goods under the same brand name, whethethey are registered officially as an enterprise group. The timing of group formatidetermined by whether the production of subsidiaries was zero or positive in the
5 Describing twelve successful entrepreneurs in Wenzhou in the 1980s,Zhang (1989)points out that manyhad worked for other factories in the past.
6 Smyth and Lu (2000)discuss the formulation of large enterprise groups in the late 1990s.7 No enterprise in the sample originated as a subsidiary.

550 T. Sonobe et al. / Journal of Comparative Economics 32 (2004) 542–563
rise
95
et-
d-id notenter-Since
y,u.adingrpriserymentf theireet the
ractorss, theirtions.actingable
oto useps andeketplacel salesatof own
agencieson the
gistered
Table 3Enterprises group formation
Before1990
Early1990s
Late1990s
Not until2000
Merged by2000
No. of enterprises 1 5 20 47 39Established year 1986 1982 1987 1990 1990Years of schooling of managers 13 13.0 10.9 10.4 10.4
Note. Enterprises in the second-to-last columns were independent at least until 2000 and had not formed enterpgroups.
sample years, i.e., 1990, 1995, and 2000.8 Enterprises that formed groups before 19were long-established ones, operated by managers with relatively high education.
Since poor-quality products could be sold in the planned economy and new markplaces were thriving, many enterprise managers entered theindustry with little prior knowl-edge of manufacturing or marketing. Although specific information on the quality of proucts is unavailable, consumers bought faulty products and complained that they dfunction well. The managers of long-established enterprises report that none of theprises had even the simplest instrument for testing their products before shipping.the apparel and footwear products made in Wenzhou were notorious for their poor qualitconsumers were likely to have a low opinion of electric appliances made in Wenzho
The main determinant of the rapid growth of this industry in the 1990s is the upgrof product quality, which began in the mid-1980s when two partners founded an entewith the novel idea of shipping only after quality inspection. AsTable 4reports, the numbeof engineers as a proportion of workers increased steadily in the 1990s. The emploof engineers is important for two reasons; first, engineers can improve the quality oproducts and second, they can organize rapidly expanding production needed to mincreasing demand for products of improved quality. The average number of subcontalso increased rapidly in the late 1990s. Although parts suppliers existed in the 1980relationship with finished goods producers consisted of mainly arm’s length transacIn the 1990s, the two parties began to build more intimate and longer-term subcontrrelationships. Based on their accumulated experience, these subcontractors were capof producing high-quality parts.
The introduction of quality inspection drovethe upgrading of marketing activities. Tavoid intermingling inspected products with defective products, enterprises beganbrand names and developed new marketing channels using their own retail shosales agencies, which dealt only in their products. AsTable 4indicates, the importancof these new marketing channels increased throughout the 1990s whereas the marand local traders declined in importance, especially in the late 1990s. By using locaagencies, even a small enterprise could distribute its products to distant large cities so ththe proportion of business done by sales agencies increased more rapidly than thatretail shops during the 1990s. The largest enterprises had as many as 800 salesthroughout China by the late 1990s, even though these enterprises put higher priority
8 In most cases, the year of group formation is earlier than the year in which the enterprise was reofficially as a group.

T. Sonobe et al. / Journal of Comparative Economics 32 (2004) 542–563 551
e’sarketingpendent
ple
ociatedies arencosts
etingired theal
ct if itrstgroup.beginofby fiveearlyfirst
iesr areas
Table 4Characteristics of enterprises
1990 1995 2000
Proportion of workers that are engineers (%) 1.5 2.7 4.2No. of parts supplying subcontractors 0 2.8 34.8Composition of marketing channels(%)
Local wholesale market 23.5 20.4 3.6Wenzhou traders 26.5 23.8 5.7Sales agencies 22.0 30.7 50.6Own retail outlets 9.5 12.6 27.1Other channels 18.5 12.5 13.0
Notes. 1. The proportion of workers that are engineers is a weighted average with the share of each enterprisemployment in the total employment of the independent enterprises as weights. 2. The composition of mchannels is a weighted average with the ratios of each enterprise’s sale to the total sales of the indeenterprises as weights.
Table 5New marketing strategies
1990 1995 2000
Full-scale use of sales agencies 12.9 42.7 56.0Use of brand name 50.0 72.9 98.6Certification of national standard 43.5 72.9 91.8Certification of international standard 4.8 15.6 54.8
Notes. 1. The table reports the proportion of sample enterprises adopting the designated strategy. 2. This samdoes not include subsidiaries.
development of own retail networks. The enterprises solve the agency problem asswith sales agencies by using local community ties; almost all of their sales agencmerchants from Wenzhou who settled in large cities earlier.9 Thus, the enterprises iWenzhou took advantage of the tradition of out-migration to lower the transactionassociated with the use of sales agencies.
Table 5 shows the increasing proportions of enterprises adopting new markstrategies beginning in the late 1980s. The increasing use of sales agencies requestablishment of brand names. In addition, a certificate of national standard or internationstandard, which is granted by the central government body to an individual produsatisfies the appropriate quality standard, validates the high quality of the product. The fienterprise to adopt new market strategies was also the first to form an enterpriseIn this sense, the enterprise is an innovator, even though it was not the first toquality inspection. Consistent with merchant-led industrial development, the managerthis enterprise was a former salesman. New marketing strategies were adoptedrelatively long-established enterprises, which also formed enterprise groups in the1990s following the lead of the innovator. Among these five enterprises was the
9 The use of migrant merchants as sales agencies is common in garment, footwear, and many other industrin Wenzhou(Wang, 1996). However, this arrangement is not practiced by garment enterprises in some otheaccording to our interview with the sales manager of a garment enterprise in Wuhan in Hubei Province.

552 T. Sonobe et al. / Journal of Comparative Economics 32 (2004) 542–563
lus
andof
ts, thef salesandedct, the
groupfirst toof
but
Soment andrisesf thesimplyherrprises990sin this
eare
scussed
hprovee lowestprovedcreasedtworksber ofvarieday begore new
ptionto the
we
enterprise to introduce quality inspection, so that we consider these five enterprises pthe innovator to be the leaders of the industry.10
The leaders formed enterprise groups before other enterprises because the demfor their products increased dramatically with the increase in consumers’ recognitiontheir brand name. While many enterprises were still producing poor quality producleaders were selling high quality products under brand names through networks oagencies or in their own retail outlets. Moreover, they noticed the effect that their expscale of marketing activities had on increasing total sales. To exploit this size effeleaders began to form enterprise groups through mergers. A manager of a largereports that, among small enterprises, the relatively high-performing ones were therecognize the importance of size. Hence, these profitable ventures became subsidiarieslarger enterprises early, whereas many other small enterprises resisted mergers at firsteventually became subsidiariesafter suffering large losses.
Table 6classifies the other enterprises into followers, laggards, and converts.enterprises introduced original strategies regarding labor management, recruitmefactory operation in addition to quality improvement and marketing. Other enterpchose to stay in the low-quality segment of the market. However, the majority oenterprises adopted the leaders’ strategies, at least partially, and the followersimitated the leaders. Converts are defined as enterprises that became subsidiaries of otenterprises by 2000. Both the followers and the laggards were independent entein 2000, but they differ in that the followers formed enterprise groups in the late 1whereas the laggards did not have subsidiaries by 2000. Thus, the classificationtable is identical to that inTable 3in which enterprises are classified according to thtiming of group formation. AsTable 3reports, leaders operate for longer periods andfounded by more-educated managers, which is consistent with the case studies diin Section 2.
According to Table 6, except for the innovator, the leaders had a remarkably higproportion of workers that were engineers, especially in 1990. Engineers help improduct quality and upgrade production processes. In 1990, these enterprises had thaverage profit margin, defined as the ratio of operating profit to sales revenue, but imto record the highest averages in 1995 and 2000. In the early 1990s, the leaders intheir share of sales revenue earned both through agencies and in their own retail neand increased product variety more rapidly than any other enterprise type. The numproduct specifications was increased to attract sales agencies that had to satisfyconsumer preferences. Although data on the number of product specifications minaccurate because the method of counting specifications is likely to be different amonenterprises, the substantial increase in product variety indicates fierce competition fmarket share. In the late 1990s, the followers began to increase their share of thmarketing channels and the number of product specifications dramatically.
Figure 2plots the growth in average enterprise size of the leaders with the exceof the innovator, along with the followers, the laggards, and the converts relative
10 By 1990, the enterprise that first introduced quality inspection was separated into two enterprises so thatclassify both of these as leaders.

T. Sonobe et al. / Journal of Comparative Economics 32 (2004) 542–563 553
rts
symbolt columnot have
s,
Table 6Classification of enterprises
Leaders Followers Laggards Conve
Innovator Others
Proportion of workers that were engineers (%)1990 2.4 7.2 1.9 0.9 01995 2.7 5.7 2.1 2.1 1.62000 2.5 5.7 3.6 2.6 2.7Profit margin (%)1990 15.9 −0.02∗ 0.05 11.9 13.41995 16.1 18.9 10.3∗ 14.9 14.52000 16.1 20.2 16.6 11.9∗ 14.0Number of product specifications1990 50 25 79 22 701995 900 1424 405 48 842000 1500 7960 2840 156 182Share of the new marketing channels (%)1990 60 8 3.9 3.5 1.11995 55 58 16.4 6.2 5.52000 70 79 60 18.9 NA
Notes 1. Enterprises are classified according to the timing of the formation of an enterprise group. 2. The∗ indicates that the enterprise type had the lowest average in that particular year. 3. The average in the lasis taken over the converts that were independent in the particular year. By definition the converts did nsales networks because they were subsidiaries in 2000.
Fig. 2. Average value added by enterprise type relative to the innovator.Note: For enterprises with subsidiariethe total value added of the enterprise group is considered.

554 T. Sonobe et al. / Journal of Comparative Economics 32 (2004) 542–563
case ofilarorkersndrpassedctrichoutn,ive to
r anles
marketceiveduality
ded withfects ofeflectstotions.
tinge oferounded. In
and
d thefor the
ndprofits
iate
innovator. Enterprise size is measured by value added, including subsidiaries in theenterprise groups.11 Interestingly, all enterprises, except for the innovator, were of simsizes in 1990, despite the fact that the leaders had much higher proportions of wthat were engineers. Due to the efforts of the engineers to improve product quality aupgrade production processes, the leaders grew rapidly in the early 1990s and suthe innovator by 1995. Thus, a major innovation occurred in the low-voltage eleappliance industry in Wenzhou around 1990, which was followed by imitation througthe 1990s. Some imitators were successful, while others were not. In the next sectiowe will explore statistically the types of management strategies that were conducsuccessful performance.
4. The empirical specification
In our analysis of quality improvement, the profit margin falls immediately afteenterprise improves its product quality due to increased costs but without increased sarevenue initially. Indeed, these enterprises may cut prices to attempt to increaseshare and gain a reputation for product quality. Over time, the gap between the perquality and the actual quality narrows as the enterprise gains a reputation for high qproducts and sales revenues increases. We measure performance as value adsubsidiaries included in an enterprise group. We also consider the causes and efan increase in the share of the new marketing channels. Although this variable ran enterprise’s efforts to expand its marketing network, the share may also be relatedperformance in that potential sales agencies choose suppliers based on their reputa
We specify the following reduced-form equations:
(1)Vi = α0 + αV V ′i + αCC′
i + αMM ′i + αEE′
i + XiαX + ui,
(2)Ci = β0 + βV V ′i + βCC′
i + βMM ′i + βEE′
i + XiβX + vi,
(3)Mi = γ0 + γV V ′i + γCC′
i + γMM ′i + γEE′
i + XiγX + wi,
whereV is the logarithm of value added,C is the percentage share of the new markechannels, andM is the profit margin. The variables with primes on the right-hand sidthe equations are lagged by five years. In addition,E is the proportion of workers who werengineers,X is a vector of characteristics of the manager, e.g., occupational backgand schooling years, andu,v, andw are disturbance terms. These equations are estimatfor two periods separately because the coefficients are expected to change over timeAppendix A we report the results of regressions in which we pool the two periodscontrol for unobserved heterogeneity among enterprises.
Table 7 displays the expected effects of the lagged dependent variables anemployment of engineers separately for the leaders and other enterprise types andtwo periods. The leaders had hired more engineers to improve the quality of products aproduction processes by 1990, which should promote sales and contribute to high
11 Since some subsidiaries supplied parts to their parent enterprises, total sales revenue is an inapproprmeasure of size.

T. Sonobe et al. / Journal of Comparative Economics 32 (2004) 542–563 555
inketinghesign ofnotersinr
rowed
of newwever,us forno
eaderseirin theith an
dein
-leaderscts
isticallynt at
in the first period. Hence,αE,βE , andγE are expected to be positive. An initially thprofit margin should contribute to increases in value added, the share of new marchannels, and profit margin so thatαM,βM , andγM should be negative. An increase in tshare of the new marketing channels should increase value added, as the positiveαC indicates. Since the relative sizes of the leaders and their marketing channels dochange much from 1990 to 1995,αV andβC should be positive. Unlike the leaders, othenterprises did not act to improve product qualityin the first period. Their relative sizewere unchanged, new marketing channels werenot explored, and profit margins remaas before. Hence, the expected signs ofαV ,βC , and γM are all positive but no othecoefficients should be significant for the non-leaders.
By 1995, the gap between the perceived quality and the actual quality had narfor the leaders. In the second period, leaders are able to reap the benefits of theirquality reputation. Hence, the lagged effects of value-added and increased sharemarketing channels should have positive effects on all three dependent variables. Hothe effects of the lagged profit margin and the share of engineers are ambiguothe leaders because aggressively low pricing and the employment of engineers arelonger important strategies. The followers and some of the laggards imitated the lby improving product quality and upgradingboth their production processes and thmarketing strategies. Hence, the signs of the coefficients for the other enterprisessecond period should be the same as those for the leaders in the first period wimportant exception. The other enterprises could improve product quality and upgraproduction process through imitation without increasingE as much as the leader hadthe early 1990s. Hence, although positive, the significance ofαE,βE , andγE are expectedto be lower.
Although we cannot test these expected differences between leaders and nonbecause we have only six leaders in our sample, we can compare combined effe
Table 7Expected signs of coefficients
Equation Dependentvariable
Coefficient 1990–1995 1995–2000
Leaders(i)
Others(ii)
Leaders(iii)
Others(iv)
(1) Valueadded
αV + + + +αC + + +αM − −αE + (+)
(2) Share ofnewmarketing
βV +βC + + + +βM − −βE + (+)
(3) Profitmargin
γV +γC +γM − + −γE + (+)
Notes. 1. A positive (negative) sign indicates that the effect is expected to be positive (negative) and statsignificant. 2. The symbol(+) indicates that the effect is expected to be positive but only weakly significabest.
556 T. Sonobe et al. / Journal of Comparative Economics 32 (2004) 542–563
n-nts, theses.initialin the
ity
els inod.tion
xoge-ro-ntnd thesiderikely tod moreToari-
hongineerss haveseigh
f theins isrketingriablesrgeous
isence, no
between the two periods. Since the expected signs ofγM are opposite for leaders and noleaders, we assume the profit margin effect to be ambiguous. For the other coefficieexpected signs are clear fromTable 7. To summarize, we have three testable hypotheFirst, value added and the share of new marketing channels increased with theemployment of engineers in the early 1990s, but these effects became weakerlate 1990s because imitation reduced the importance of engineers in upgrading qualand improving production processes. Second,an initially thin profit margin contributedto growth in value added and increases in the share of new marketing channboth periods, but its contribution to profitmargin became stronger in the later periThird, the positive effects of value added increase over time because of the reputaeffect.
In the reduced-form equations, all explanatory variables are predetermined or enous so that endogeneity is not a concern. Althoughordinary least squares (OLS) is apppriate for estimatingEqs. (1) and (3), it is inappropriate forEq. (2)because the dependevariable is censored. Hence, we use the one-limit tobit method for the first period atwo-limit tobit method for the second period. In the tobit estimation, we must conpossible biases due to heteroskedasticity. The variance of the disturbance term is lbe greater for smaller enterprises, for which the dependent variable can be affecteeasily by even a slight change in the number of sales agencies and own retail outlets.cope with this problem, we adopt the multiplicative tobit method and assume that the vance takes the form denoted byσ 2
i = exp(δ0 + δ1V′i ), where the coefficientδ1 is expected
to be negative.12
5. Estimation results
Tables 8 and 9present the estimated coefficients for each period separately.13 In the firstperiod, the employment of engineers has apositive and highly significant effect in eacequation as expected. Profit margins do not have the expected negative effect eithervalue added or on the share of the new marketing channels if the employment of enis included in the regressions. However, without the engineer variable, profit marginnegative and significant effects, which may beattributable to correlation between thetwo variables. Perhaps low profit margins for the leaders are associated with the hemployment of engineers in 1990.
The effect of lagged profit margin is positive and significant on the profit margin iengineer variable is included but insignificant otherwise. The effect of profit margpositive due to the behavior of non-leaders. As expected, the share of the new machannels has a positive and significant effect on value added. Most dummy varepresenting the managers’ former occupations are insignificant indicating that prioexperience in commerce, which is the default category, was not particularly advanta
12 Greene (2000)provides details of this method.13 The condition number of the moments matrixX′X, whereX is the matrix of the explanatory variables,
much less than 20 for each period and for each set of explanatory variables used in the regressions. Hserious multicollinearity exists in the data.

T. Sonobe et al. / Journal of Comparative Economics 32 (2004) 542–563 557
he share
in theriencef thenizing
90 onall thefficientsprisesise
Table 8First-period regression analysis
Dependent variable ln(Value added)1995 New marketingchannel share1995 (%)
Profit margin1995 (%)
OLS Multiplicative tobit OLS
(i) (ii) (iii) (iv) (v) (vi)
ln(Value added)1990 0.555* 0.639** −2.800 0.033 −0.826 −0.469(3.98) (4.52) (−0.64) (0.00) (−1.16) (−0.66)
New marketingchannel share1990 (%)
0.019 0.027* 1.103** 1.172** 0.053 0.091(1.46) (1.95) (4.55) (3.14) (1.11) (1.47)
Profit margin1990 (%) −0.013 −0.036** −0.130 −0.627* 0.149* 0.031(−1.02) (−3.18) (−0.54) (−1.74) (1.76) (0.32)
Employment ofengineers1990 (%)
0.183** 3.797** 0.935**
(3.30) (4.01) (3.01)Farmer dummy 0.359 0.624 6.414 18.05 −2.227 −0.889
(0.76) (1.22) (0.57) (1.11) (−0.59) (−0.25)Factory worker dummy −0.112 −0.259 6.391 −6.916 −2.656 −3.349
(−0.26) (−0.58) (0.59) (−0.39) (−0.92) (−1.09)Engineer dummy −0.307 0.044 −27.01 13.81 −3.526 −1.821
(−0.52) (0.07) (−0.71) (0.35) (−1.01) (−0.51)Manager dummy −0.034 0.123 31.60** 36.17* −5.455 −4.702
(−0.06) (0.21) (2.85) (2.09) (−1.12) (−1.12)Other occupations
dummy0.036 0.147 11.04 30.97* −1.790 −0.709
(0.09) (0.34) (1.39) (2.11) (−0.68) (−0.29)Years of schooling 0.153** 0.120* 1.820 1.826 0.272 0.125
(3.09) (2.24) (1.63) (1.06) (0.71) (0.30)Years of top
management−0.048 0.016 −0.382 1.193 −0.331 −0.005
(−1.20) (0.40) (−0.44) (0.86) (−0.94) (−0.02)Constant 1.777* 1.532* −11.22 −36.63 16.18** 15.04**
(2.11) (1.68) (−0.40) (−0.83) (2.66) (2.43)Correction for heteroskedasticity
ln(Value added) in 1990 NA NA −1.044** −0.381 NA NA(−3.32) (−0.88)
R-squared 0.66 0.57 NA NA 0.20 0.11
Notes. 1. The sample size is 55. 2. In the tobit regressions, 27 observations are left-censored at zero for tof new marketing channels in 1995. 3. The numbers in parentheses aret-statistics.
* Significance at the 5% level, for a one-sided test.** Idem., 1%.
even though the majority of new entrants to the industry were former merchantsearly 1990s. The only meaningful exception is the positive effect of managerial expein developing new marketing channels. Finally, the positive and significant effect oyears of schooling on value added indicates the importance of education in orgaproduction efficiently.
The effects of value added and the share of the new marketing channels in 19the corresponding variables in 1995 are positive and significant as expected. Ifenterprises had grown at the same rate regardless of their initial sizes, these coewould have been unity. Since they are significantly smaller than unity, smaller entergrew faster than larger ones. FromFig. 2, the innovator was by far the largest enterpr

558 T. Sonobe et al. / Journal of Comparative Economics 32 (2004) 542–563
ns thatredbitrs in
y 1995., largeagers’
sect to
Table 9Second-period regression analysis
Dependent variable ln(Value added)2000 New marketingchannel share2000 (%)
Profit margin2000 (%)
OLS Multiplicative tobit OLS
(i) (ii) (iii) (iv) (v) (vi)
ln(Value added)1995 1.062** 1.105** 21.73** 10.49* 1.079** 1.362**
(13.38) (8.82) (3.86) (1.96) (3.37) (3.10)New marketing
channel share1995 (%)0.014** 0.014* 0.665* 0.725** 0.009 0.006
(2.38) (1.73) (1.91) (2.40) (0.37) (0.21)Profit margin1995 (%) −0.059** −0.059** −2.062** −1.520* −0.066 −0.118*
(−4.11) (−3.00) (−2.41) (−2.00) (−1.13) (−1.69)Employment of
engineers1995 (%)0.019 0.016 −0.120 −0.269 0.036 0.081
(0.77) (0.45) (0.08) (−0.18) (0.37) (0.66)Farmer dummy 0.364 0.563 10.97 5.200 0.553 1.374
(1.08) (1.27) (0.61) (0.35) (0.41) (0.88)Factory worker dummy −0.075 −0.267 −10.64 −8.071 0.122 −0.954
(−0.29) (−0.74) (−0.73) (−0.65) (0.12) (−0.75)Engineer dummy 0.698* 0.951 9.636 20.47 2.631 1.278
(1.76) (1.51) (0.39) (0.89) (1.65) (0.58)Manager dummy 0.352 0.616 24.32 13.33 −0.247 0.996
(0.97) (1.29) (1.44) (0.98) (−0.17) (0.59)Other occupations
dummy0.575* 0.757* 2.279 −2.823 1.276 0.920
(1.91) (1.75) (0.14) (−0.19) (1.05) (0.61)Years of schooling 0.021 0.063 −1.844 0.035 −0.069 0.022
(0.57) (1.21) (−1.04) (0.02) (−0.47) (0.12)Years of top
management−0.043* −0.045 −1.781 −1.094 0.016 −0.043
(−2.01) (−1.51) (−1.50) (−1.07) (0.18) (−0.41)Constant 1.869** 1.155 −49.41* −3.462 9.563** 8.200**
(3.32) (1.40) (−1.79) (−0.14) (4.21) (2.82)Correction for heteroskedasticity
ln(Value added) in 1995 NA NA −0.252* −0.409* NA NA(−1.73) (−2.08)
R-squared 0.82 0.81 NA NA 0.24 0.35No. of observations 95 62 95 62 95 62
Notes. 1. The sample size is 95. 2. For the regressions in columns (ii), (iv), and (vi), only the 62 observatiowere independent enterprises in 2000 are used. 3. In the tobit regression in (iii), 51 observations are left-censoat zero for the share of new channels in 2000, and 5 observations are right-censored at 100%. 4. In the toregression in (iv), 18 observations are left-censored and 5 observations are right-censored. 5. The numbeparentheses aret-statistics.
* Significance at the 5% level, for a one-sided test.** Idem., 1%.
in 1990 but the other leaders became larger and the followers began to catch up bTable 8provides three reasons for the leaders’ high growth during this period, namelyemployment of engineers relative to enterprise size, a low-price policy, and their manrelatively high education.
For the regressions in columns (i), (iii), and (v) ofTable 9, the full sample of enterpriseis used. However, the converts are not equivalent to other enterprises with resp

T. Sonobe et al. / Journal of Comparative Economics 32 (2004) 542–563 559
e,i), (iv),tion
ueare ofile theThesedue to
profithatf thelthough
longesmyd in thee
tancegeris
hed,tsecomeped theon
’sss thising onopingtation
beenction
ond theionies.ou.nd
selling products through the distribution channels of their principal enterprises. Hencthis table also reports regressions in which the converts are excluded in columns (iand (vi). Without the converts, thet-statistics are generally smaller due to the reducin the sample size but the qualitative results are similar. The coefficients inTable 9areconsiderably different from those inTable 8. The coefficient for value added in the valadded equation is equal to unity. The effects of initial value added on both the shthe new market channels and profit margins are now positive and significant, wheffect of new marketing channels on value added is also positive and significant.results support our third hypothesis that the positive effects of value added increasereputation effects in the later period. The negative and significant effects of initialmargins on the three dependent variables are consistent with our second hypothesis tpredicts a stronger effect of lower profit margin in the later period. The effects oemployment of engineers are no longer significant, as the first hypothesis asserts. Athe employment of engineers contributes to the improvement of product quality in therun, this contribution decreases over time as the imitation of high-quality products becomeasier. The other differences between periodsare the positive effect of the engineer dumand the negative and significant effect of the years of top management on value addelater period suggesting that engineering expertise and new management leadership becammore important as the industry developed.
To summarize our empirical results, the employment of engineers lost its imporand the contribution of initially thin profit margins to growth performance became stronover time. Hence, the imitation of productquality and of better production processesevident as is strategic pricing. Moreover, as the leaders’ reputations became establisthe reputation effect strengthened. Enterprises that failed to imitate high quality producor marketing strategies were forced to abandon their own brand names and to bsubsidiaries of large enterprises. As a result, enterprise groups grew rapidly and reareturns on their past investment in reputation.Our empirical results support this explanatiof the explosive expansion of industry in the late 1990s in Wenzhou.
6. Conclusion
Wenzhou had a unique set of initial conditions; hence, the replicability of Wenzhourapid industrial development in other poor rural areas is an important issue. To assepossibility, we investigate the basics characteristics of the Wenzhou model by focusthe evolutionary development of the low-voltage electric appliance industry. In develcountries, the evolutionary process of industrial development begins with the imiof easy-to-produce items rather than with product innovation, once a market hasidentified. Similarly, the entry of many small enterprises occurred after the construof a local marketplace in Wenzhou. However, as these enterprises expanded beylocal marketplace, marketing expertise became important because of the high transactcosts associated with these activities in all ofthe less-developed and transition economWe find that the ratio of former merchants among new entrants increased in WenzhTherefore, the Wenzhou experience confirms the critical roles of marketplaces amerchants in the early stage of industrial development.

560 T. Sonobe et al. / Journal of Comparative Economics 32 (2004) 542–563
arketeress in
seinn will
ategiesketing
formerth ofnzhou
tion of
iu,ents.d
among
ses, andeh weretsnsistent
s isketing
erts
As the number of enterprises producing poor-quality products increases, their mbecomes saturated so that improved productquality is profitable and inevitable. Wheththe major innovation requires engineeringknowledge or marketing expertise hingon the nature of the product of the industry. In technologically simple industrieremote areas, such as in Wenzhou, marketing expertise is particularly important becauimproving product quality is easier than marketing the improved product. Moreover,less developed areas, poor-quality products prevail so that asymmetric informatiobe a serious problem. Hence, investment in reputation and other marketing strwill be indispensable. Our paper demonstrates that the introduction of new marstrategies, such as the use of brand names and exclusive sales agencies by amerchant, and their imitation by a number of followers were crucial to the growthe industry. Therefore, merchant-led industrial development characterizes the Wemodel and can be replicated in other parts of the developing world that have a tradicommerce.
Acknowledgments
We thank Yujiro Hayami, Michiki Kikuchi, Justin Y. Lin, Scott Rozelle, Deqiang LMichael Kevane, John Bonin and four anonymous referees for very helpful commWe also thank Paul Kandasamy and Mayuko Tanaka for their editorial advice anassistance.
Appendix A. Panel regressions
To check the robustness of the estimation results reported inTables 8 and 9, we usepanel data to estimate regressions in which we control for unobserved heterogeneityenterprises. We modifyEqs. (1) through (3)in the following manner:
Yit = ρ0 + ρ1V′it + ρ2StV
′it + ρ3C
′t + ρ4M
′it + ρ5StM
′it + ρ6E
′it + ρ7StE
′it
+ λi + ρ8St + εit ,
whereYit is the dependent variable, i.e.,Vit ,Cit , orMit , the subscriptt indicates year 1995or 2000,St is a second-period dummy which is zero for 1995 and one for 2000,λi is theenterprise effect capturing both observed and unobserved characteristics of enterpriεit is an error term. Interaction terms, i.e.,SV ′, SM ′, andSE′, are included to capture thchanges in the effects of value added, profit margin, and engineer employment, whicpredicted by the hypotheses and confirmed inTables 8 and 9. We use both a fixed-effecestimator and a random-effects Generalized Least Squares estimator. Although coestimators for dynamic panel data are found in the literature, e.g.,Baltagi (1995), thesetechniques are not applicable to our data because the number of time-series observationtoo small. Furthermore, the limited nature of the dependent variable in the new marchannel equation must be ignored due to the small sample size.
The estimated coefficients are reported inTable A.1. The full sample is used in thfirst two columns for each dependent variable, but the sub-sample that excludes conve

T.Sonobeetal./JournalofC
omparative
Econom
ics32
(2004)542–563
561Table A.1Pooled regression analysis
el share (%) Profit margin (%)
Fixedeffect(vi)
Randomeffect(vii)
Fixedeffect(viii)
Fixedeffect(ix)
* 18.88** 0.299 1.798** 1.735**
(3.90) (0.51) (3.46) (3.44)4 2.933 0.669 0.436 0.812
(0.60) (1.14) (1.06) (1.61)6* −0.397 0.031 0.009 −0.013
(−1.64) (1.11) (0.36) (−0.52)9* −0.698* 0.079* −0.090* −0.051
(−2.09) (1.66) (−2.35) (−1.46)3** −0.795 −0.591** −1.051** −1.141**
(−1.32) (−7.14) (−16.44) (−18.25)7 −1.935 0.448* −0.008 0.038
(−1.23) (2.10) (−0.05) (0.23)7 −2.329 −0.306 0.216 0.292
(−1.13) (−1.29) (0.98) (1.37)1 38.33 4.874* 10.60** 9.327**
(1.59) (1.81) (5.34) (3.72)−51.07** 11.04** 7.848** 6.832**
(−2.53) (4.65) (4.06) (3.25)0.68 0.74 0.88 0.930.01 0.00 0.00
62 95 95 62100 150 150 100
Dependent variable ln(Value added) New marketing chann
Randomeffect(i)
Fixedeffect(ii)
Fixedeffect(iii)
Randomeffect(iv)
Fixedeffect(v)
ln(Value added)−5 0.703** 0.417** 0.500** 0.128 13.15*
(6.62) (3.18) (2.99) (0.05) (3.14)ln(Value added)−5 ×
Second period dummy0.150 −0.022 0.038 8.617** 3.93
(1.43) (−0.21) (0.23) (2.78) (1.19)New marketing−5
channel share0.018** 0.014* 0.011 0.615** −0.47
(3.52) (2.24) (1.33) (4.93) (−2.33)Profit margin−5 −0.026** −0.014 −0.015 −0.058 −0.59
(−2.99) (−1.50) (−1.31) (−0.25) (−1.93)Profit margin−5 ×
Second period dummy−0.040** −0.059** −0.072** −0.726* −1.40
(−2.71) (−3.67) (−3.48) (−1.76) (−2.72)Employment of
engineers−5
0.108** 0.030 0.043 3.287** −2.15(2.81) (0.64) (0.79) (3.23) (−1.43)
Engineer employment−5 ×Second period dummy
−0.079* 0.041 0.045 −3.339** −0.29(−1.86) (0.73) (0.64) (−2.89) (−0.17)
Second period dummy 0.292 1.635** 1.380 −22.03 4.78(0.60) (3.27) (1.66) (−1.56) (0.30)
Constant 2.257** 3.604** 3.581** 8.218 −25.60(6.02) (7.39) (5.14) (0.73) (−1.64)
R-squared 0.77 0.83 0.85 0.20 0.53p-value forF test that all
enterprise effect= 00.00 0.00 0.02
No. of enterprises 95 95 62 95 95No. of observations 150 150 100 150 150
Note. Numbers in parentheses aret-statistics.* Significance at the 5% level, for a one-sided test.
** Idem., 1%.

562 T. Sonobe et al. / Journal of Comparative Economics 32 (2004) 542–563
endentedor theargin
ver, themy isprofitmenthannel
ates of(i) and
rly
l of
ng,Books,
or
45–
ic
easure-
–
al
nal
mic
in
he
gxill,
is used in the third column. The effects of lagged value added on the three depvariables are positive and generally significant; the interaction term between value addand the second-period dummy is positive with one exception. Hence, support fthird hypothesis is confirmed. Consistent with the second hypothesis, the profit mhas negative effects on value added and the new marketing channel share. Moreocoefficient for the interaction term of the profit margin and the second-period dumnegative and highly significant, which supports the assertion that the effect of lowmargin is stronger in the later period. According to the first hypothesis, the employof engineers should have positive effects on value added and the new marketing cshare, but the interaction term should be negative. Although the fixed-effects estimthese effects are not statistically significant, the random-effect estimates in columns(iv) do support this hypothesis.
References
Akerlof, George A., 1970. The market for ‘lemons’: qualityuncertainty and the market mechanism. QuarteJournal of Economics 84 (3), 488–500.
Baltagi, Badi H., 1995. Econometric Analysis of Panel Data. Wiley, Chichester, UK.Chen, Kang, Jefferson, Gary H., Singh, Inderjit,1992. Lessons from China’s economic reform. Journa
Comparative Economics 16, 201–225.Dong, Fureng, 1990. The Wenzhou model for developing the rural commodity economy. In: Nolan, Peter, Fure
Dong (Eds.), Market Forces in China: Competition and Small Business—The Wenzhou Debate. ZedLondon, pp. 77–96.
Filson, Darren, 2002. Product and process innovations in the life of an industry. Journal of Economic Behaviand Organization 49 (1), 97–112.
Friedmann, John, 2003. China’s urbanization. International Journal of Urban and Regional Research 27 (3), 7758.
Gort, Michael, Klepper, Steven, 1982. Time paths in the diffusion of product innovations. EconomJournal 92 (367), 630–653.
Greene, William H., 2000. Econometric Analysis, 4th Edition. Prentice-Hall, New Jersey.Jefferson, Gary H., Rawski, Thomas G., Zheng, Yuxin, 1996. Chinese industrial productivity: trends, m
ment, and recent developments. Journal of Comparative Economics 23 (2), 146–180.Jovanovic, Boyan, MacDonald, Glenn, 1994a. Competitivediffusion. Journal of Political Economy 102 (1), 24
52.Jovanovic, Boyan, MacDonald, Glenn, 1994b. The life cycle of a competitive industry. Journal of Politic
Economy 102 (2), 322–347.Klein, Benjamin, Leffler, Keith B., 1981. The role of market force in assuring contractual performance. Jour
of Political Economy 89 (4), 615–641.Klepper, Steven, 1996. Entry exit growth and innovation over the product life cycle. American Econo
Review 86 (3), 562–583.Klepper, Steven, 2002. Firm survival and the evolution of oligopoly. RAND Journal of Economics 33, 37–61.Klepper, Steven, Simons, Kenneth L., 2000. The making of oligopoly: Firm survival and technological change
the evolution of the US tire Industry. Journal of Political Economy 108 (4), 728–760.Landes, David S., 1969. The Unbound Prometheus. Cambridge Univ. Press, Cambridge, UK.Li, Dingfu, 1997. Wenzhou zhi Mi: Zhongguo Tuopinzhifude Chenggong Moshi (The Enigma of Wenzhou: T
Successful Model of the Transition from Poverty to Affluence in China). Gaige Chubanshe, Beijing.Murphy, Rachel, 2002. Return migration, entrepreneurship, and state-sponsored urbanization in the Jian
countryside. In: Logan, John R. (Ed.), The New Chinese City: Globalization and Market Reform. BlackweOxford, UK.

T. Sonobe et al. / Journal of Comparative Economics 32 (2004) 542–563 563
In:enzhou
en,
re
of
azama
l
.),
-2),
of
nultural
ew
ss,
n,
al(1),
a’s
ic
Nolan, Peter, 1990. Petty commodity production in a socialist economy: Chinese rural development post-Mao.Nolan, Peter, Dong, Fureng (Eds.), Market Forces in China: Competition and Small Business—The WDebate. Zed Books, London.
Otsuka, Keijiro, 1998. Rural industrialization in East Asia. In: Hayami, Yujiro, Aoki, Masahiko (Eds.), ThInstitutional Foundations of East Asian Economic Development. Palgrave Macmillan, Basingstoke/Londopp. 447–475.
Otsuka, Keijiro, Liu, Deqiang, Murakami, Naoki, 1998. Industrial Reform in China: Past Performance and FutuProspects. Clarendon Press, Oxford.
Schumpeter, Joseph A., 1912. The Theory of Economic Development. Oxford University Press, New York.Shapiro, Carl, 1983. Premiums for high quality productsas returns to reputations. Quarterly Journal
Economics 98 (4), 659–679.Shiba, Yoshinobu, 1968. So-dai Shogyo-shi Kenkyu (Commercial Activities during the Sung Dynasty). K
Shobo, Tokyo.Shiba, Yoshinobu, 1977. Ningpo and its hinterland. In: Skinner, G. William (Ed.), The City in Late Imperia
China. Stanford Univ. Press, Stanford.Skinner, G. William, 1977. Introduction: urban social structure in Ch’ing China. In: Skinner, G. William (Ed
The City in Late Imperial China. Stanford Univ. Press, Stanford, CA.Smyth, Russell, Lu, Zeng-Hua, 2000. A model formalising the trade-offs between collective learning and spe
cialisation in the collective township and village enterprises sector in China. Asian Economic Review 42 (263–278.
Sonobe, Tetsushi, Hu, Dinghuan, Otsuka, Keijiro, 2002. Dynamic process of cluster formation and the roletraders: a case study of a garment town in China. Journal of Development Studies 39 (1), 118–139.
Sonobe, Tetsushi, Kawakami, Momoko, Otsuka, Keijiro, 2003. Changing role of innovation and imitatioin development: the case of the machine tool industry in Taiwan. Economic Development and CChange 52 (1), 103–128.
State Statistical Bureau, 2002. China Statistical Yearbook. China Statistics Press, Beijing.Statistical Bureau of Zhejiang Province, 2000. Comprehensive Statistical Data and Materials on 50 years of N
Zhejiang. China Statistics Press, Beijing.Statistical Bureau of Zhejiang Province, various years. Zhejiang Statistical Yearbook. China Statistics Pre
Beijing.Wang, Ruliang, 1996. Wenzhou Cangnan Gaige Kaifang Jishi (The Chronicle of the Reform in Cangna
Wenzhou). Xinhua Chubanshe, Beijing.Yamamura, Eiji, Sonobe, Tetsushi, Otsuka, Keijiro, 2003. Human capital, cluster formation, and internation
relocation: the case study of the garment industry in Japan, 1968–98. Journal of Economic Geography 337–56.
Zhang, Liz, 2001. Strangers in the City: Reconfigurationsof Space, Power, and Social Networks within ChinFloating Population. StanfordUniv. Press, Stanford, CA.
Zhang, Renshou, 1999. Zhejiang Nongcun Jingji Gaige Tixi Yanjiu (The Systematic Review of EconomTransition in Zhejiang Rural Area). Zhejiang Renming Chubanshe, Hangzhou.
Zhang, Zhiren, 1989. Wenzhou Chao (Wenzhou Tide). Wenhua Yishu Chubanshe, Beijing.