from images to answers a basic understanding of digital imaging and analysis
TRANSCRIPT

From Images to Answers
A Basic Understanding of Digital Imaging and Analysis

What is an Image?
Computers store data and understand data in numerical form. We can say that a digital image is a numerical representation of a “picture” – a set of numbers interpreted by the computer which creates a visual representation that is understood by humans.
255 255 199143 97 18732 12 3423 22 11
244 198 179123 94 19532 43 5213 32 11
253 217 23468 185 9713 12 2711 14 26

Pixels are identified by their position in a grid (two-dimensional array), referenced by its row (x), and column (y).
The Pixel Array
Pixel- A “picture element”.Each element contains spatialand intensity information.

Bitmaps
At each pixel position the image is sampled and quantified. An integer representing the brightness or darkness of the image is generated for each pixel This integer. A collection of these gray values is called a bitmap.
255 250 200 220 253 254
249 180 0 0 167 254
220 0 0 0 0 240
210 104 0 0 123 234
243 239 160 190 240 251

Resolution
Image Resolution- Overall image qualitySpatial Resolution- Pixel size, image magnificationBrightness Resolution- Pixel depthOptical Resolution- Lens characteristics
How Big Is a Pixel?
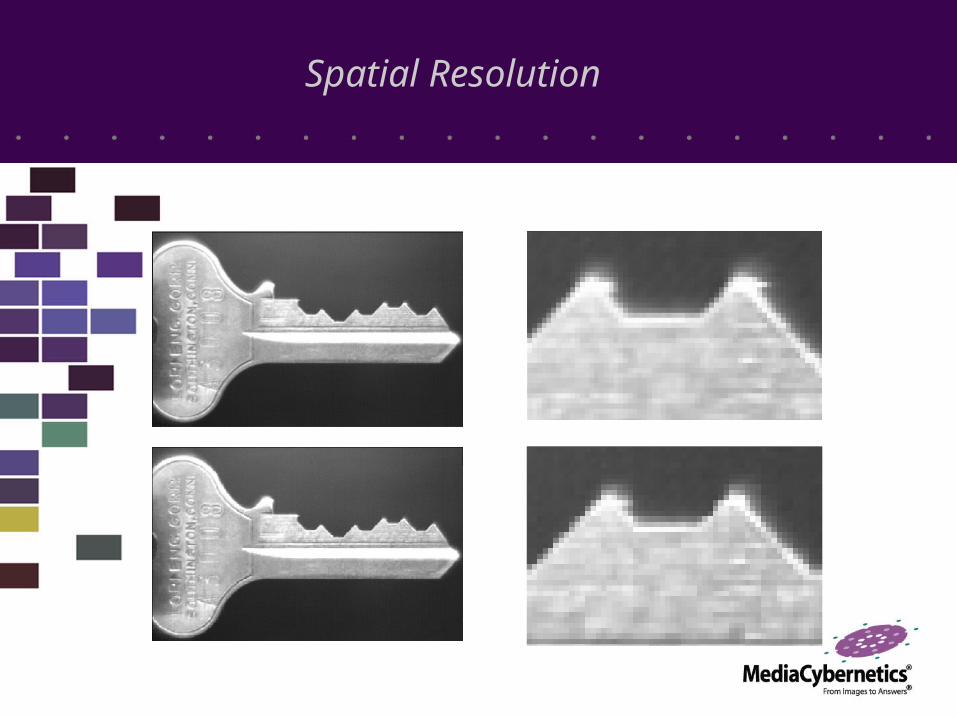
Spatial Resolution

Dynamic Range
How many gray levels between the darkest and brightest areas
8-bit 28 = 256 gray values
12-bit 212 = 4,096 gray values
16-bit 216 = 65,536 gray values

Dynamic Range
5 Gray Levels 256 Gray Levels
8-bit gray scale 28 = 256 gray values

Limitations of Our Eyes
5 Gray Levels 10 Gray Levels
20 Gray Levels 40 Gray Levels
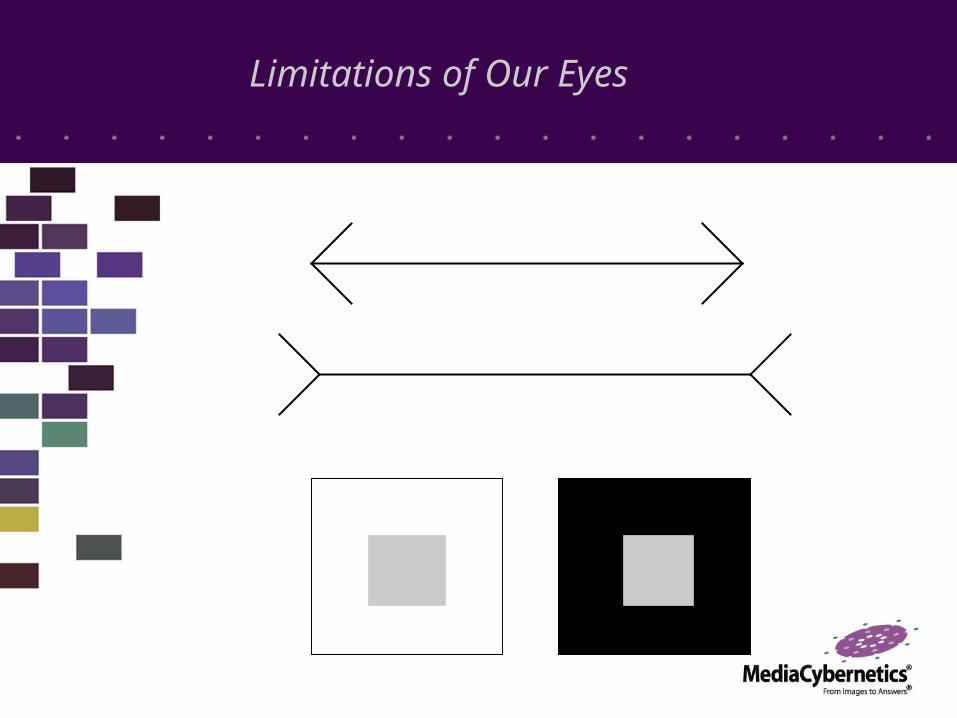
Limitations of Our Eyes
What components are involved in imaging?
Input device- the source of the images; camera, microscope, etc.
Interface hardware- the connection between the input device and the computer.
Imaging software- the user interface to all the imaging components.
Output devices- printers, image storage devices, monitors.

The Analytical Imaging Process
Sample Preparation- Sectioning, staining, labeling, etc.
Acquisition- how do we acquire an image into the computer?
Enhancement- how do we make it look better to extract information?
Identification- which attributes of the image are we interested in?
Measurement- what information can we obtain?
Report Generation- how can we present this information?
Archive- how can we store the information?

Acquisition
After sample preparation, acquisition is the most importantaspect of image analysis.
Has the specimen been prepared properly?
Is the imaging apparatus properly set up?• Kohler Illumination for Microscopes• Clean Optics• Color cameras should be color-balanced• Monochrome cameras should have dark-field subtraction• Good dynamic range should be established in the image• For fluorescence images- turn OFF autoexposure

Image Enhancement
There are basic ways to enhance an image: • Modify its intensity index: brightness, contrast, gamma• Background correction• Apply a spatial filter or arithmetic operation
And advanced enhancement methods:• Manipulate the image frequencies: fast fourier transform• Morphological transformations: erode, dilate

0 72.8571 182.143
0
10000
20000
30000
0 72.8571 182.143
0
10000
20000
30000
Histogram Stretch
Low Dynamic Range- Medium Contrast
Full Dynamic Range- Good Contrast

Automatic Best-fit Equalization Background Flattening
Background Correction
Original

Spatial filters change the look of an image and are divided into two categories.
Convolution Filters:
• Low-pass- Blurs or smoothes an object
• Sharpen- Enhances all intensity transitions
• Median- Removes random impulse noise
Morphological Filters:
• Edge Detection- highlights edges
• Erosion- Makes objects smaller
• Dilation- Makes objects larger
Spatial Filtering
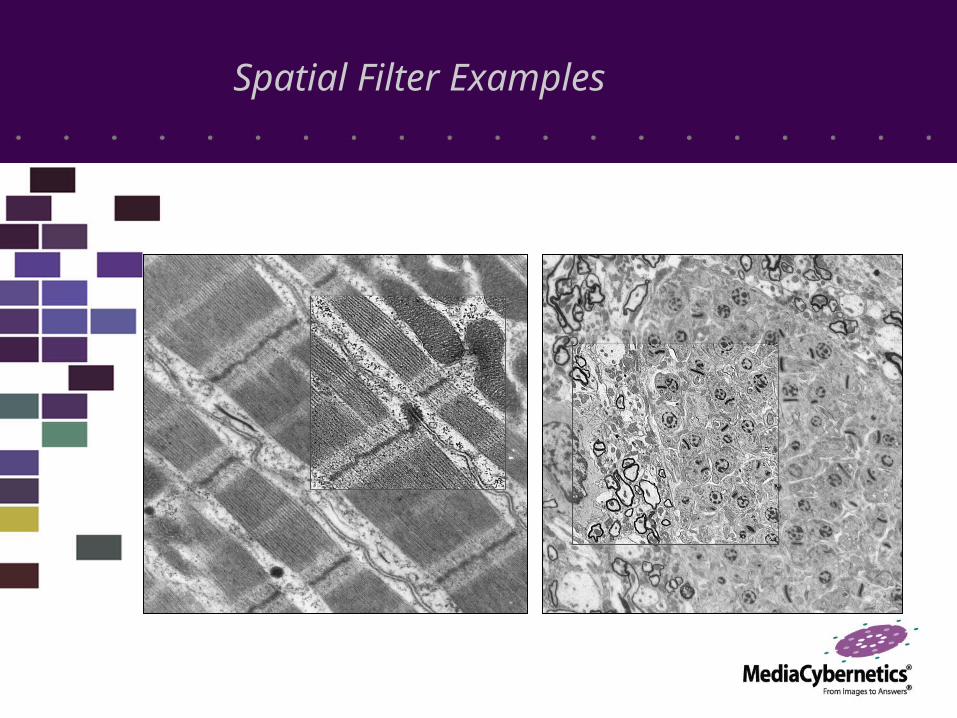
Spatial Filter Examples

Merge Images

Red
Green
Blue
Extracting Color Channels

Once the attributes of an image are enhanced and clearly visible, identification can be done as follows:
• Thresholding techniques- allowing the software to identify objects, based on intensity variations from background or other objects using either grayscale or color intensities
• Area of Interest (AOI)- manually defining the objects
Object Identification

Grey Scale Threshold
The overall objective of thresholding is to extract the objects of interest- to distinguish them from other objects or background.
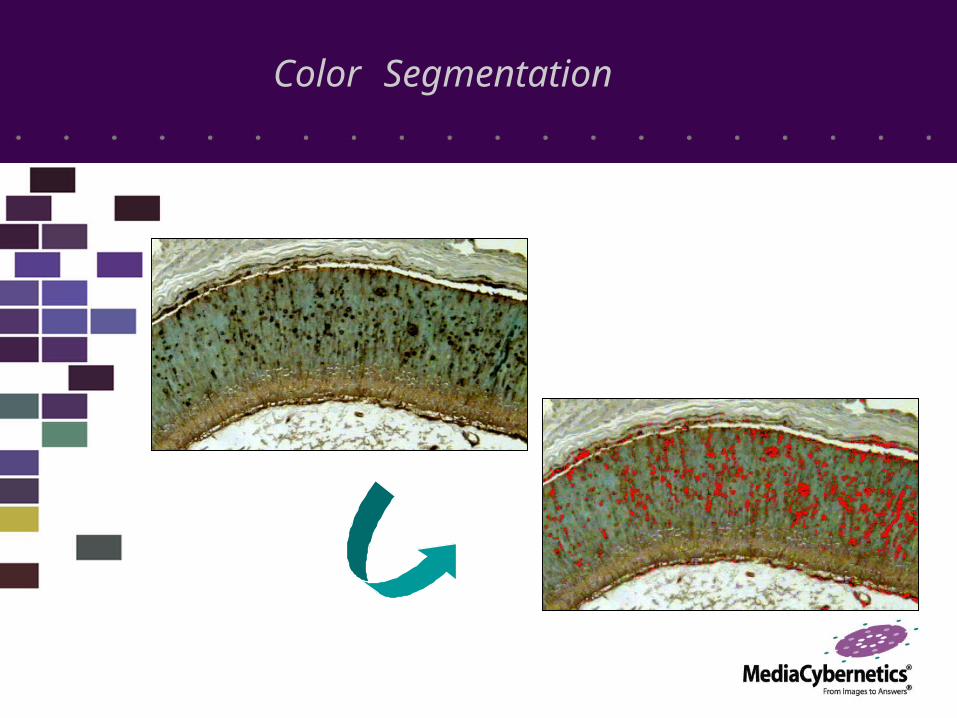
Color Segmentation

• Size
• Shape
• Intensity/Integrated Optical Density
• Populations
• Statistics
Once objects are identified, we are dealing with a set of pixels, which are a set of numbers. We are then able to measure anything we need such as
Measurement Parameters

Area Percentages
How much area is covered by the different intensities?

Statistical Summaries

Using intensity transitions it is possible to measure thicknesses of objects. Edge tracing tools may be employed to do this:
Thickness Measurements
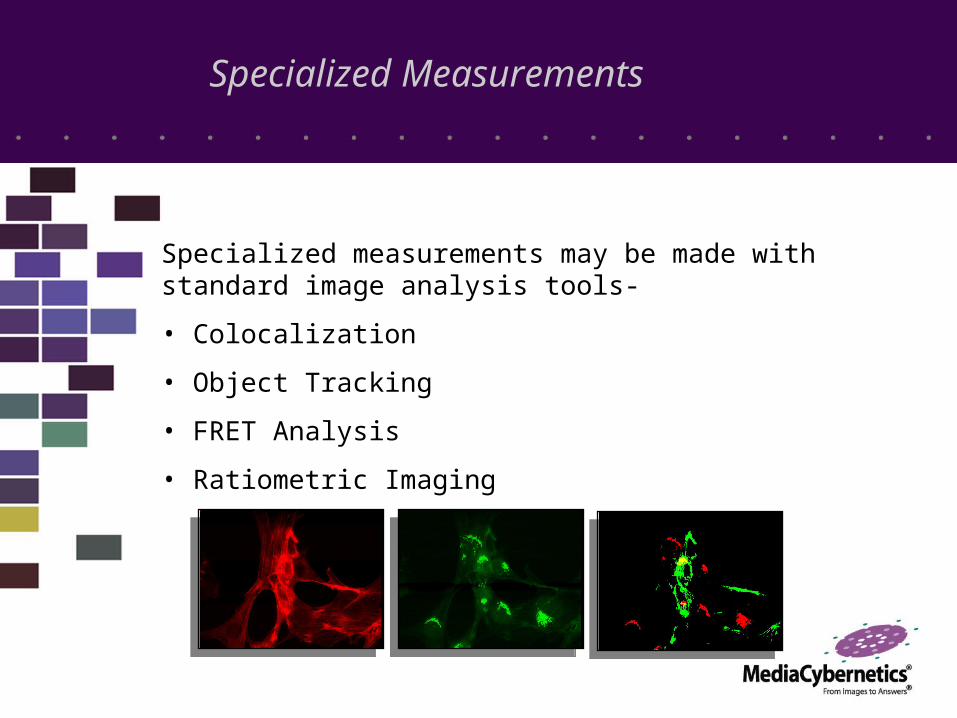
Specialized Measurements
Specialized measurements may be made with standard image analysis tools-
• Colocalization
• Object Tracking
• FRET Analysis
• Ratiometric Imaging
Dynamic Data Exchange (DDE)- Sending data to Excel for further statistical analysis
Data Collection- Collection of analysis data from multiple images into a single space, which can then be sent elsewhere or used to create reports
Report Generation- Custom templates used to create standardized reports.
Data Output

MEDIA CYBERNETICS Inc.8484 Georgia Avenue, Suite 200Silver Spring, MD 20910301.495 [email protected]
Leiden, The NetherlandsSan Diego, CaliforniaPittsburgh, PennsylvaniaShanghai, ChinaSingaporeWokingham, United Kingdom