from “hindu growth”to productivity surge: the … · from “hindu growth”to productivity...
TRANSCRIPT

193
IMF Staff PapersVol. 52, Number 2
© 2005 International Monetary Fund
From “Hindu Growth” to Productivity Surge: The Mystery of the Indian Growth Transition
DANI RODRIK and ARVIND SUBRAMANIAN*
This paper explores the causes of India’s productivity surge around 1980, more thana decade before serious economic reforms were initiated. Trade liberalization, expan-sionary demand, a favorable external environment, and improved agricultural per-formance did not play a role. We find evidence that the trigger may have been anattitudinal shift by the government in the early 1980s that, unlike the reforms of the1990s, was probusiness rather than promarket in character, favoring the interestsof existing businesses rather than new entrants or consumers. A relatively small shiftelicited a large productivity response, because India was far away from its income-possibility frontier. Registered manufacturing, which had been built up in previousdecades, played an important role in determining which states took advantage ofthe changed environment. [JEL O11, O47, O53]
India’s economic performance during the first three decades after independencein 1947 was christened the “Hindu” rate of growth, a term connoting a disap-
pointing but not disastrous outcome and the acquiescence in the present that thereligion supposedly imbues, because of its greater emphasis on the hereafter.
This term is gradually lapsing into disuse thanks to India’s remarkable trans-formation during the past two decades. Since 1980, its per capita economic growth
*Dani Rodrik is a professor at Harvard University, and Arvind Subramanian is in the IMF’s ResearchDepartment. The authors thank, without implicating, Montek Ahluwalia, Swaminathan S. Aiyar, AadityaMattoo, Raghuram Rajan, Shakti Sinha, T. N. Srinivasan, John Williamson, and seminar participants atHarvard University, the IMF, the University of Maryland, the NBER workshop on India, and the Centerfor Policy Research, New Delhi for helpful feedback; Devesh Kapur for his insights and assistance; andMagali Junowicz and Bakar Ould-Abdallah for research assistance.
Dani Rodrik and Arvind Subramanian
194
rate has more than doubled, rising from 1.7 percent in 1950–80 to 3.8 percent in1980–2000. Shackled by the socialist policies and the “license-permit–quota raj”(to use C. Rajaji’s memorable phrase) of the past, India used to exemplify devel-opment strategies gone wrong. It has now become the latest poster child for effortsto unleash economic growth with a turn toward free markets and open trade. Indiahas yet to catch up to China’s growth rates (or even to China’s level of income),1 butthanks to its solid democratic institutions and impressive performance in informa-tion technology (IT), the country is, in the eyes of many knowledgeable observers,increasingly vying with, if not displacing, China as the country of the future.2
The improvement in India’s economic performance is obviously good newsfor its one billion people. But equally important, this transformation holds outhope for other poor countries around the world, insofar as it sends the messagethat rapid economic growth is attainable under appropriate policies.
But what exactly are those “appropriate” policies that made the Indian miraclepossible? Any number of policy-oriented papers and newspaper articles describe thefollowing conventional story about India. Until 1991, India’s policymakers followedmisguided policies that closed the economy to international trade, erected inefficientindustries under state guidance, riddled the private sector with extraordinarilycumbersome and detailed regulations, and suffocated private economic activity withcontrols and bureaucratic impediments. Then, in 1991, the big breakthrough hap-pened. Spurred by a balance of payments crisis, Indian policymakers turned to tech-nocrats such as Manmohan Singh, who promptly began liberalizing the economy.Trade barriers were slashed, foreign investment was welcomed, the license raj wasdismantled, and privatization began. The economy started to boom, with softwareexports and call centers leading the way.
Like all caricatures, the above story has elements of truth in it. It is indeedthe case that, until recently, India had one of the most overregulated and closedeconomies in the world. It is also true that the economic liberalization of 1991 con-stituted a watershed event for the Indian economy. But the main difficulty with thestandard account, as summarized here, is that the pickup in India’s economic growthprecedes the 1991 liberalization by a full decade. Even a cursory glance at thegrowth record reveals that the more-than-doubling of India’s growth rate took placesometime around 1980, with very little discernible change in trend after 1991. Infact, some indicators, such as economywide total factor productivity (TFP), even goin the “wrong” direction, showing a deceleration after 1991. Therefore, the strikingpost-1980 improvement in performance cannot be attributed to the liberalization of1991. The latter may well have played a role in sustaining and deepening an ongoingprocess of growth, but we need to look elsewhere to understand how India made thetransition to high growth. A related implication is that more recent phenomena, suchas the boom in information technology and related services, cannot have been theoriginal source of India’s economic growth.
1According to The Penn World Tables (PWT 6.1), India’s purchasing-power-adjusted per capita GDPstood at $2,479 in 2000, compared with $3,747 for China. However, there are reasons to believe India’spurchasing power parity level of income is understated (see Deaton, Friedman, and Atlas, 2004).
2See Huang and Khanna (2003).
THE MYSTERY OF THE INDIAN GROWTH TRANSITION
195
We present in this paper a somewhat different interpretation of India’s experi-ence. We argue that the trigger for India’s economic growth was an attitudinal shifton the part of the national government in 1980 in favor of private business. Until thattime, the rhetoric of the reigning Congress Party had been all about socialism andpro-poor policies. When Indira Gandhi returned to power in 1980, she realigned her-self politically with the organized private sector and dropped her previous rhetoric.The national government’s attitude toward business went from being outright hos-tile to supportive. Indira Gandhi’s switch was further reinforced, in a more explicitmanner, by Rajiv Gandhi, following his rise to power in 1984. This, in our view, wasthe key change that unleashed the animal spirits of the Indian private sector in theearly 1980s.
It is important to characterize appropriately the attitudinal change that tookplace in the early 1980s. We draw a distinction here between a promarket and aprobusiness orientation. The former focuses on removing impediments to marketsand aims to achieve this through economic liberalization. It favors new entrantsand consumers. A probusiness orientation, in contrast, focuses on raising the prof-itability of the established industrial and commercial establishments. It tends tofavor incumbents and producers. Easing restrictions on capacity expansion forincumbents, removing price controls, and reducing corporate taxes (all of whichtook place during the 1980s) are examples of probusiness policies, while trade lib-eralization (which did not take place in any significant form until the 1990s) is thearchetypal market-oriented policy. This distinction can be observed, for example, inthe contrasting approaches toward reform in East Asia and Latin America. Korea’sreforms in the 1960s and 1970s were primarily probusiness rather than promarket.Latin America’s reforms in the 1990s were primarily promarket.
The changes in India in the early 1980s are accordingly best described as pro-business rather than promarket. True liberalization was, by and large, anathema toorganized business at the time. Indira Gandhi was far less interested in opening upthe economy and removing impediments to competition than in garnering politicalsupport from existing business groups. Rajiv Gandhi, who was somewhat moreprone to liberalize, had to step back when he stepped too far out of line and whenthe Bofors scandal undermined his effectiveness. The primary beneficiaries of growthwere therefore incumbents and preexisting activities rather than new entrants andactivities. Nevertheless, we view this shift toward a probusiness orientation as theessential trigger that set off the boom of the 1980s. That this was a powerful triggercan be deduced from the fact that the genuine liberalization after 1991 added verylittle to aggregate economic performance. Apparently, this attitudinal shift was, initself, a very powerful stimulant for economic growth, even in the presence of priceand other market distortions.
That an attitudinal change on the part of the national leadership could have sucha strong impact on growth is, in turn, grounded in India’s initial conditions. India hasvery strong political and economic institutions for a country at its income level. It isa democracy where the rule of law generally prevails and property rights are pro-tected adequately. Judged by cross-country norms, it ought to have a level of incomethat is several times higher. The implication is that relatively minor changes in thepolicy environment can produce a large growth impact. We interpret the suspension
Dani Rodrik and Arvind Subramanian
196
of the national government’s hostility to the private sector as one of these changes,something that did not leave much of a paper trail in actual policies but had animportant impact on investors’ psychology.
We begin this paper by documenting India’s growth transition in the 1980sand placing this experience in comparative context. We show that this transition isgrounded in an impressive increase in productivity (rather than in factor accumula-tion). We also show that India has moved from being a global underperformer before1980 to a strong overperformer since then.
We next present a series of possible explanations for this shift and show thatnone of them can satisfactorily account for the boom of the early 1980s. There wasnot much liberalization in the 1980s, and the little that took place happened duringthe second half of the decade. The Indian economy remained closed to world tradeand in some ways was more protected than ever. The Green Revolution is unlikelyto have been the source of the boom in nonagricultural activity, because we do notobserve the requisite changes in the internal terms of trade. Demand-side explana-tions are inadequate to explain the rise in productivity. Public sector investment isunlikely to have been the explanation either, unless we make demanding assump-tions on time lags.
We then lay out our own explanation and provide some empirical evidence insupport of it. We show, in particular, that post-1980 growth was strongest in activi-ties and states that were most advantaged by the national government’s attitudinalshift—namely in the formal manufacturing sector built up under the earlier policyregime. Hence, to some extent, the learning generated under the earlier policy regimeand the modern manufacturing base created thereby provided a permissive environ-ment for eventual takeoff once the policy stance softened vis-à-vis the private sec-tor. So, unlike what one may have otherwise expected, from accounts of how costlyimport-substituting industrialization (ISI) was, growth occurred where the earlierinvestments had been made.
Our analysis focuses on the transition to high growth in the 1980s, and we havelittle to say about the 1991 reforms and the experience of the 1990s. We take theview that igniting growth and sustaining it are distinct challenges, requiring differ-ent sets of policies and approaches (Rodrik, 2003; Hausmann, Pritchett, and Rodrik,2004). This paper is concerned exclusively with the challenge of igniting growth andthe story of how India seems to have met it.
I. The Facts
A key fact that we establish at the outset of this paper is that the turnaround in thisperformance—the decisive break with the Hindu past—occurred around 1980 andnot in the 1990s as most accounts have it. We are not the first to make this point:Williamson and Zagha (2002) and De Long (2003) have both emphasized that theapproximate doubling of India’s growth rate took place a full decade before the1991 reforms. Nonetheless, it is impossible to read the standard policy-orientedaccounts and not leave with the impression that it was the reforms of the 1990s thatbrought superlative economic performance to India (Ahluwalia, 2002; Srinivasanand Tendulkar, 2003).
THE MYSTERY OF THE INDIAN GROWTH TRANSITION
197
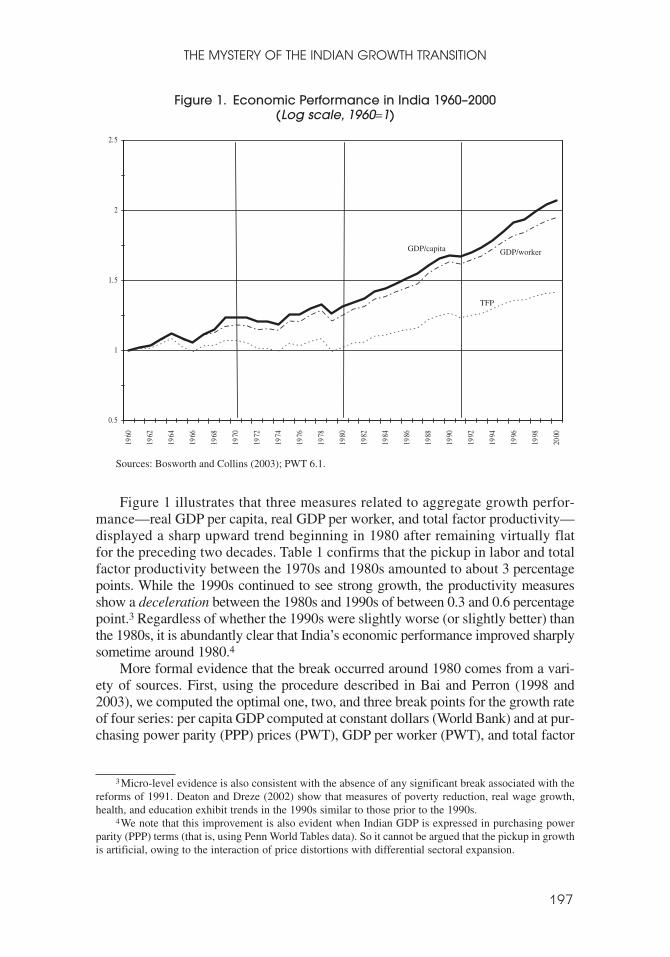
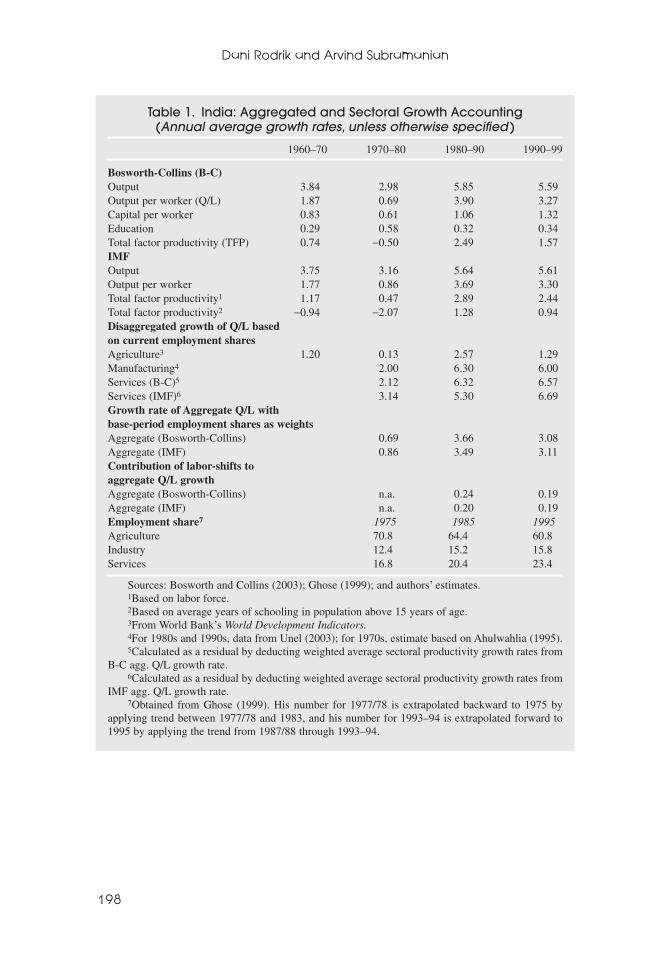
Figure 1 illustrates that three measures related to aggregate growth perfor-mance—real GDP per capita, real GDP per worker, and total factor productivity—displayed a sharp upward trend beginning in 1980 after remaining virtually flatfor the preceding two decades. Table 1 confirms that the pickup in labor and totalfactor productivity between the 1970s and 1980s amounted to about 3 percentagepoints. While the 1990s continued to see strong growth, the productivity measuresshow a deceleration between the 1980s and 1990s of between 0.3 and 0.6 percentagepoint.3 Regardless of whether the 1990s were slightly worse (or slightly better) thanthe 1980s, it is abundantly clear that India’s economic performance improved sharplysometime around 1980.4
More formal evidence that the break occurred around 1980 comes from a vari-ety of sources. First, using the procedure described in Bai and Perron (1998 and2003), we computed the optimal one, two, and three break points for the growth rateof four series: per capita GDP computed at constant dollars (World Bank) and at pur-chasing power parity (PPP) prices (PWT), GDP per worker (PWT), and total factor
3Micro-level evidence is also consistent with the absence of any significant break associated with thereforms of 1991. Deaton and Dreze (2002) show that measures of poverty reduction, real wage growth,health, and education exhibit trends in the 1990s similar to those prior to the 1990s.
4We note that this improvement is also evident when Indian GDP is expressed in purchasing powerparity (PPP) terms (that is, using Penn World Tables data). So it cannot be argued that the pickup in growthis artificial, owing to the interaction of price distortions with differential sectoral expansion.
0.5
1
1.5
2
2.5
1960
1962
1964
1966
1968
1970
1972
1974
1976
1978
1980
1982
1984
1986
1988
1990
1992
1994
1996
1998
2000
GDP/capita GDP/worker
TFP
Sources: Bosworth and Collins (2003); PWT 6.1.
Figure 1. Economic Performance in India 1960–2000 (Log scale, 1960=1)
Dani Rodrik and Arvind Subramanian
198
Table 1. India: Aggregated and Sectoral Growth Accounting(Annual average growth rates, unless otherwise specified )
1960–70 1970–80 1980–90 1990–99
Bosworth-Collins (B-C)Output 3.84 2.98 5.85 5.59Output per worker (Q/L) 1.87 0.69 3.90 3.27Capital per worker 0.83 0.61 1.06 1.32Education 0.29 0.58 0.32 0.34Total factor productivity (TFP) 0.74 −0.50 2.49 1.57IMFOutput 3.75 3.16 5.64 5.61Output per worker 1.77 0.86 3.69 3.30Total factor productivity1 1.17 0.47 2.89 2.44Total factor productivity2 −0.94 −2.07 1.28 0.94Disaggregated growth of Q/L based on current employment sharesAgriculture3 1.20 0.13 2.57 1.29Manufacturing4 2.00 6.30 6.00Services (B-C)5 2.12 6.32 6.57Services (IMF)6 3.14 5.30 6.69Growth rate of Aggregate Q/L with base-period employment shares as weightsAggregate (Bosworth-Collins) 0.69 3.66 3.08Aggregate (IMF) 0.86 3.49 3.11Contribution of labor-shifts to aggregate Q/L growthAggregate (Bosworth-Collins) n.a. 0.24 0.19Aggregate (IMF) n.a. 0.20 0.19Employment share7 1975 1985 1995Agriculture 70.8 64.4 60.8Industry 12.4 15.2 15.8Services 16.8 20.4 23.4
Sources: Bosworth and Collins (2003); Ghose (1999); and authors’ estimates.1Based on labor force.2Based on average years of schooling in population above 15 years of age.3From World Bank’s World Development Indicators.4For 1980s and 1990s, data from Unel (2003); for 1970s, estimate based on Ahulwahlia (1995).5Calculated as a residual by deducting weighted average sectoral productivity growth rates from
B-C agg. Q/L growth rate.6Calculated as a residual by deducting weighted average sectoral productivity growth rates from
IMF agg. Q/L growth rate.7Obtained from Ghose (1999). His number for 1977/78 is extrapolated backward to 1975 by
applying trend between 1977/78 and 1983, and his number for 1993–94 is extrapolated forward to1995 by applying the trend from 1987/88 through 1993–94.
THE MYSTERY OF THE INDIAN GROWTH TRANSITION
199
productivity (Bosworth and Collins, 2003).5 In all four cases, we find that the singlebreak occurs in 1979.6 Second, Hausmann, Pritchett, and Rodrik (2004) have ana-lyzed transitions to high growth in a large cross-national sample and date the Indiangrowth transition to 1982.7 Finally, Wallack (2003) has analyzed GDP and its dis-aggregated components for structural breaks. She finds evidence for a break in theGDP growth rate in the early to mid-1980s. The highest value of the F-statistic asso-ciated with the existence of a break is reached in 1980 (Wallack, 2003, p. 4314).8
Was this improved aggregate productivity performance since the 1980s simplya consequence of reallocating resources from low productivity (agriculture) tohigher productivity (manufacturing and services), or was there a trend improvementin the performance of individual sectors? There has been a substantial structuralchange in the composition of the labor force employed in the three major sectors,with the most pronounced one being the decline of about 10 percentage points inagriculture’s share between 1975 and 1995, offset by an increase in the share of ser-vices (about 7.5 percentage points) and industry (2.5 percentage points). But thisshift explains a very small fraction (less than 10 percent) of the improvement ineconomywide productivity. For example, when the aggregate labor productivitygrowth is computed with fixed (base-period) employment shares, the pickup in the1980s is between 2.6 and 2.9 percentage points, and the deceleration in the 1990s isabout 0.4 to 0.6 percentage point (Table 1).
A number of studies have argued that manufacturing experienced a surge in pro-ductivity in the 1980s (Ahluwalia, 1995; and Unel, 2003), although some of theseestimates have been contested (Hulten and Srinivasan, 1999; and Balakrishnanand Pushpagandan, 1994).9 For example, Ahluwalia’s (1995) figures suggest thatthe increase in TFP growth from 1981 to 1989 over the previous two decades was3.2 percentage points.
A break in growth performance is also suggested by the evidence on economicgrowth at the level of the Indian states. Figure 2 plots per capita GDP for all states
5We thank Andy Berg and Marcos Souto for suggesting and estimating this procedure. For the case ofa single break, the Bai and Perron (1998) procedure minimizes the sum of squared deviations of the growthrate around the means of the two resulting subsamples. For multiple breaks, we use the method describedin Bai and Perron (2003), which employs a dynamic programming algorithm to compare all possible com-binations, so that a minimum global sum of squared residuals is achieved. Details are available from theauthors upon request.
6The two breaks occurred in 1970 and 1979, and the three breaks occurred in 1970, 1979, and 1994(with the procedure suggesting that there was a trend decline after 1994).
7 The Hausmann, Pritchett, and Rodrik (2004) filter looks for a year whose growth rate in the sevenyears following it is at least 2 or more percentage points higher than the growth rate in the seven yearspreceding it.
8She finds less evidence for a break in growth rates in specific sectors (such as manufacturing andagriculture), attributing the post-1980 growth to the changing composition of GDP. Note that Wallack’sstudy focuses on value added and not productivity.
9Hulten and Srinivasan (1999) make the point that conventional TFP measures understate the truecontribution of productivity performance by ignoring the additional capital formation induced by anincrease in productivity. Balakrishnan and Pushpagandan’s (1994) critique is based on the failure of con-ventional measures to use separate deflators for gross output and intermediates in arriving at TFP mea-sures. Another study (Reserve Bank of India, 2004), using the double-deflation methodology, however,shows that manufacturing TFP grew by 3.9 percent in the 1980s and by 2.1 percent in the 1990s.

Dani Rodrik and Arvind Subramanian
200
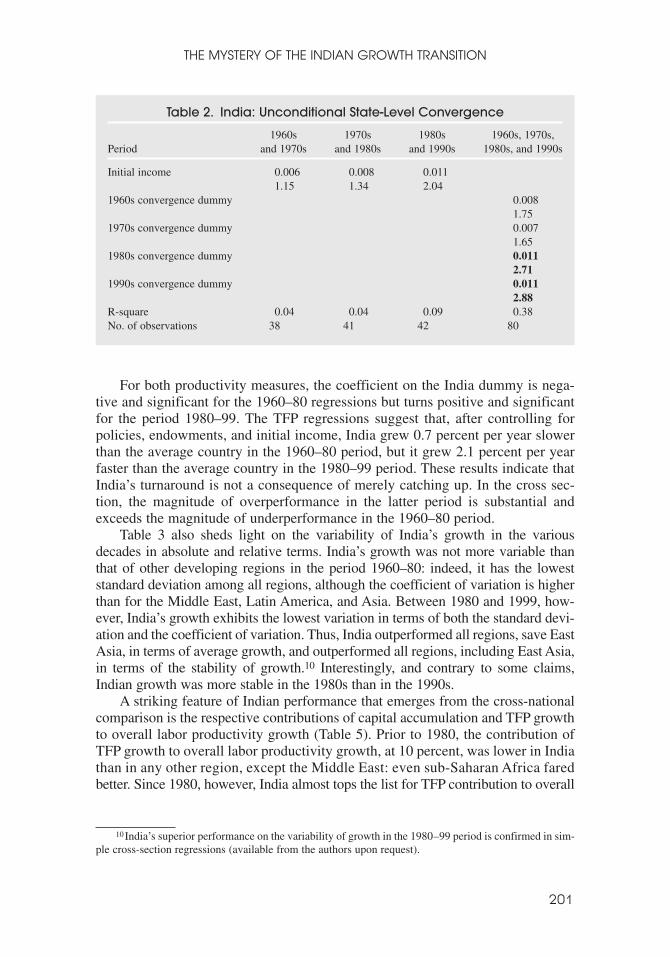
for every 10 years beginning in 1960. Beginning in 1980, there is both an upwardtrend in the average and a wider spread in the distribution of incomes. A more for-mal test of (unconditional) convergence among states for the four decades confirmsthis break (Table 2). For the 1960s and 1970s, the convergence coefficient is positiveand insignificant. For the 1980s and 1990s, this coefficient increases and becomesstatistically significant. The magnitude of the coefficient suggests that in the lattertwo decades, states are diverging at an annual rate of about 1.2 percent a year, verymuch a case of “Divergence, Big Time” (Pritchett, 1997).
The surge in India’s performance since the 1980s is also confirmed by cross-national evidence. Table 3 provides basic data on the average growth rates and theirvolatility for the four decades since the 1960s for India, China, and the other regionalgroupings (Bosworth and Collins, 2003). For the period 1960–80, India’s growthrate of output per worker, at 1.3 percent per year, is the lowest in the world exceptfor sub-Saharan Africa. For the next two decades, however, its average growthexceeds, by a substantial margin, all other regions, except East Asia.
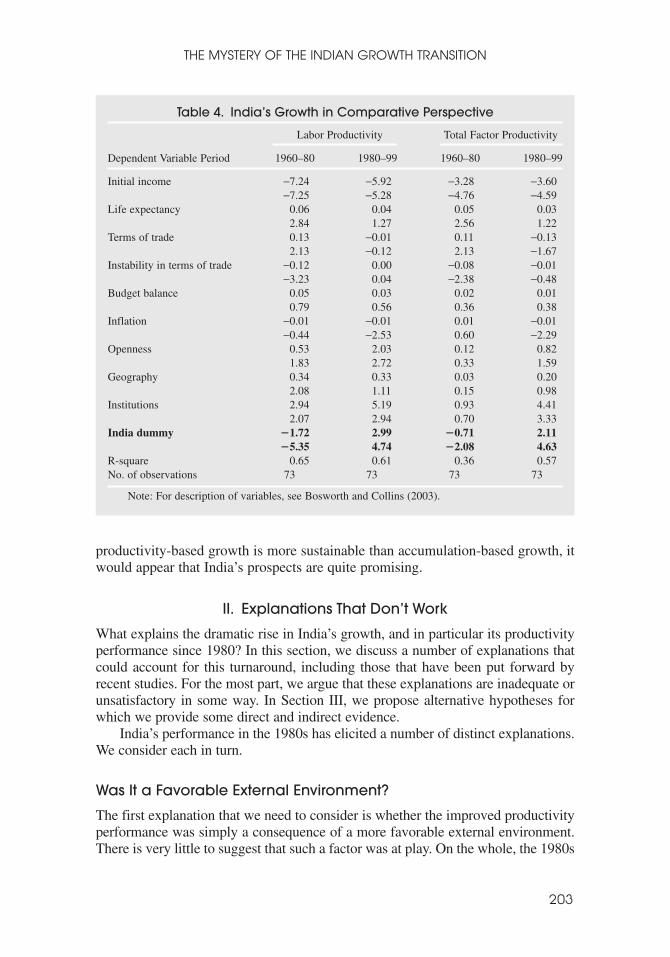
Table 4 presents simple Barro-type cross-country growth regressions for theperiods 1960–80 and 1980–99, using the data in Bosworth and Collins (2003). Twomeasures of growth performance—labor productivity and total factor productiv-ity—are regressed on a standard set of controls, including the convergence term. Weintroduce an India dummy in all these regressions to capture India’s performancerelative to the average country in the sample.
APAP
AP
AP
AP
ASAS
AS
ASAS
BH BHBH
BH BH
DL
DL
DL
DL
DL
GJ
GJGJ
GJ
GJ
HY
HY
HY
HY
HY
HPHP
HP
HP
JKJK
JK JK
JK
KK
KKKK
KK
KK
KL
KL KL
KL
KL
MP MPMP
MPMP
MP
MNMN
MN
MN
MN
NG
NG
OR OR OR
ORPJ
PJ
PJ
PJ
PJ
RJ
RJ
RJ
RJ
RJ
TN TN TN
TN
TN
TP TP
TP
TP
TP
UPUP
UP
UP
UP
WB WBWB
WB
WB
33.
54
4.5
55.
5ln
pcgd
p2
60 70 80 90 100Period
Figure 2. Real Per Capita Net State Domestic Product, 1960–2000 (At 1993–94 prices)
THE MYSTERY OF THE INDIAN GROWTH TRANSITION
201
For both productivity measures, the coefficient on the India dummy is nega-tive and significant for the 1960–80 regressions but turns positive and significantfor the period 1980–99. The TFP regressions suggest that, after controlling forpolicies, endowments, and initial income, India grew 0.7 percent per year slowerthan the average country in the 1960–80 period, but it grew 2.1 percent per yearfaster than the average country in the 1980–99 period. These results indicate thatIndia’s turnaround is not a consequence of merely catching up. In the cross sec-tion, the magnitude of overperformance in the latter period is substantial andexceeds the magnitude of underperformance in the 1960–80 period.
Table 3 also sheds light on the variability of India’s growth in the variousdecades in absolute and relative terms. India’s growth was not more variable thanthat of other developing regions in the period 1960–80: indeed, it has the loweststandard deviation among all regions, although the coefficient of variation is higherthan for the Middle East, Latin America, and Asia. Between 1980 and 1999, how-ever, India’s growth exhibits the lowest variation in terms of both the standard devi-ation and the coefficient of variation. Thus, India outperformed all regions, save EastAsia, in terms of average growth, and outperformed all regions, including East Asia,in terms of the stability of growth.10 Interestingly, and contrary to some claims,Indian growth was more stable in the 1980s than in the 1990s.
A striking feature of Indian performance that emerges from the cross-nationalcomparison is the respective contributions of capital accumulation and TFP growthto overall labor productivity growth (Table 5). Prior to 1980, the contribution ofTFP growth to overall labor productivity growth, at 10 percent, was lower in Indiathan in any other region, except the Middle East: even sub-Saharan Africa faredbetter. Since 1980, however, India almost tops the list for TFP contribution to overall
Table 2. India: Unconditional State-Level Convergence
1960s 1970s 1980s 1960s, 1970s, Period and 1970s and 1980s and 1990s 1980s, and 1990s
Initial income 0.006 0.008 0.0111.15 1.34 2.04
1960s convergence dummy 0.0081.75
1970s convergence dummy 0.0071.65
1980s convergence dummy 0.0112.71
1990s convergence dummy 0.0112.88
R-square 0.04 0.04 0.09 0.38No. of observations 38 41 42 80
10India’s superior performance on the variability of growth in the 1980–99 period is confirmed in sim-ple cross-section regressions (available from the authors upon request).

Dani Rodrik and Arvind Subramanian
202
growth. Nearly 60 percent of overall growth was accounted for by TFP, a featurematched only by China. Amazingly, the Indian TFP performance in 1980–99 sur-passes that of East Asia even in the first 20 years of the East Asian miracle.Evidently, India has relied less on deferred gratification and more on productivityto drive its growth, even compared with the fast-growing countries of East Asia. If
Table 3. India in the Cross-Section: Mean and Volatility of Growth Rate of Output per Worker, 1960–20001
1990– 1980– 1960–1960–70 1970–80 1980–90 2000 1960–80 2000 2000
Industrial countriesMean 4.12 2.12 1.54 1.47 3.12 1.51 2.34Standard deviation 2.26 2.61 1.98 2.06 2.71 2.08 2.63Coefficient of 0.55 1.23 1.29 1.41 0.87 1.38 1.13
variationEast Asia (including China)Mean 4.19 4.11 4.15 3.98 4.15 4.07 4.11Standard deviation 3.99 2.80 3.24 3.91 3.69 3.74 3.98Coefficient of 0.95 0.68 0.78 0.98 0.89 0.92 0.97
variationChinaMean 1.66 2.82 6.86 8.85 2.24 7.85 5.05Standard deviation 12.45 3.40 3.59 2.37 8.90 3.13 7.17Coefficient of 7.50 1.20 0.52 0.27 3.97 0.40 1.42
variationLatin AmericaMean 2.38 1.69 (1.65) 0.83 2.03 (0.48) 0.81Standard deviation 3.47 4.00 4.40 3.03 4.07 4.17 4.43Coefficient of 1.46 2.36 (2.66) 3.66 2.00 (8.70) 5.47
variationIndiaMean 1.91 0.77 3.91 3.22 1.34 3.57 2.45Standard deviation 3.24 4.16 1.87 2.05 3.68 1.94 3.11Coefficient of 1.69 5.40 0.48 0.64 2.74 0.54 1.27
variationAfricaMean 1.87 0.69 (0.47) (0.03) 1.28 (0.26) 0.53Standard deviation 5.41 5.25 4.48 4.48 5.54 4.89 5.55Coefficient of 2.90 7.56 (9.53) (170.29) 4.33 (18.85) 10.47
variationMiddle East2
Mean 4.61 3.47 1.81 1.19 4.04 1.51 2.81Standard deviation 5.83 6.64 3.42 2.77 6.55 3.21 5.44Coefficient of 1.26 1.91 1.89 2.33 1.62 2.12 1.94
variation
Sources: Bosworth and Collins (2003); and authors’ calculations.1All regional aggregates are unweighted averages.2Excludes Jordan.
THE MYSTERY OF THE INDIAN GROWTH TRANSITION
203
productivity-based growth is more sustainable than accumulation-based growth, itwould appear that India’s prospects are quite promising.
II. Explanations That Don’t Work
What explains the dramatic rise in India’s growth, and in particular its productivityperformance since 1980? In this section, we discuss a number of explanations thatcould account for this turnaround, including those that have been put forward byrecent studies. For the most part, we argue that these explanations are inadequate orunsatisfactory in some way. In Section III, we propose alternative hypotheses forwhich we provide some direct and indirect evidence.
India’s performance in the 1980s has elicited a number of distinct explanations.We consider each in turn.
Was It a Favorable External Environment?
The first explanation that we need to consider is whether the improved productivityperformance was simply a consequence of a more favorable external environment.There is very little to suggest that such a factor was at play. On the whole, the 1980s
Table 4. India’s Growth in Comparative Perspective
Labor Productivity Total Factor Productivity
Dependent Variable Period 1960–80 1980–99 1960–80 1980–99
Initial income −7.24 −5.92 −3.28 −3.60−7.25 −5.28 −4.76 −4.59
Life expectancy 0.06 0.04 0.05 0.032.84 1.27 2.56 1.22
Terms of trade 0.13 −0.01 0.11 −0.132.13 −0.12 2.13 −1.67
Instability in terms of trade −0.12 0.00 −0.08 −0.01−3.23 0.04 −2.38 −0.48
Budget balance 0.05 0.03 0.02 0.010.79 0.56 0.36 0.38
Inflation −0.01 −0.01 0.01 −0.01−0.44 −2.53 0.60 −2.29
Openness 0.53 2.03 0.12 0.821.83 2.72 0.33 1.59
Geography 0.34 0.33 0.03 0.202.08 1.11 0.15 0.98
Institutions 2.94 5.19 0.93 4.412.07 2.94 0.70 3.33
India dummy 21.72 2.99 20.71 2.1125.35 4.74 22.08 4.63
R-square 0.65 0.61 0.36 0.57No. of observations 73 73 73 73
Note: For description of variables, see Bosworth and Collins (2003).

Dani Rodrik and Arvind Subramanian
204
Tab
le5.
Co
ntri
bu
tion
sto
Gro
wth
:In
dia
inth
eC
ross
-Se
ctio
n,1
960–
99
Con
trib
utio
nof
:
Phys
ical
Fact
orFa
ctor
Phys
ical
Out
putp
erca
pita
led
ucat
ion
prod
uctiv
itypr
oduc
tivity
capi
tal
Reg
ion/
Peri
odO
utpu
tW
orke
rIn
perc
enta
gepo
ints
Inpe
rcen
tof
tota
l
Indu
stri
alC
ount
ries
1960
–80
4.42
3.05
1.22
1.61
1.30
4040
1980
–99
2.68
1.60
0.78
0.98
0.64
4049
1960
–99
3.57
2.34
1.01
1.30
0.98
4243
Eas
tAsi
a(i
ncl.
Chi
na)
1960
–80
5.64
2.98
1.45
1.93
0.96
3249
1980
–99
8.03
6.02
2.44
2.85
3.25
5441
1960
–99
6.80
4.45
1.93
2.38
2.07
4643
Chi
na19
60–8
04.
041.
830.
760.
430.
6435
4119
80–9
99.
757.
852.
630.
364.
7160
3319
60–9
96.
784.
721.
660.
392.
6055
35L
atin
Am
eric
a19
60–8
06.
102.
901.
081.
421.
4550
3719
80–9
92.
20−0
.54
0.09
0.48
−1.0
218
9−1
719
60–9
94.
181.
210.
600.
960.
2420
49In
dia
1960
–80
3.41
1.28
0.72
0.43
0.12
956
1980
–99
5.73
3.60
1.18
0.33
2.05
5733
1960
–99
4.53
2.40
0.95
0.38
1.06
4439
Afr
ica
1960
–80
4.36
1.78
1.06
1.21
0.66
3759
1980
–99
2.02
−0.7
0−0
.12
0.25
−0.9
313
418
1960
–99
3.21
0.57
0.48
0.74
−0.1
2−2
185
Mid
dle
Eas
t19
60–8
05.
713.
142.
743.
250.
289
8719
80–9
93.
680.
850.
200.
81−0
.08
−923
1960
–99
4.71
2.02
1.50
2.06
0.11
574
Sour
ce:B
osw
orth
and
Col
lins
(200
3).
THE MYSTERY OF THE INDIAN GROWTH TRANSITION
205
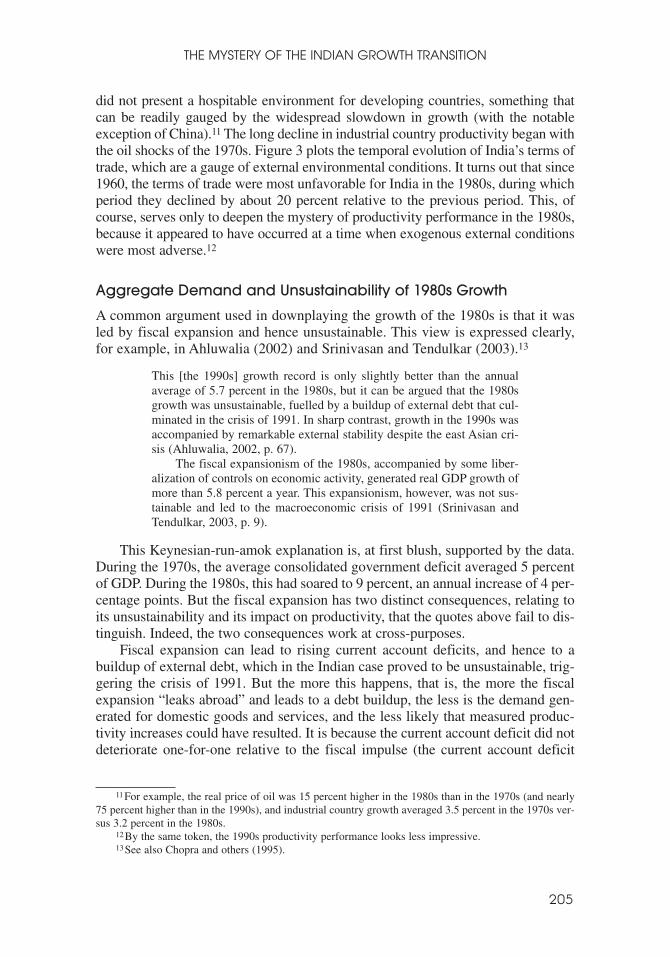
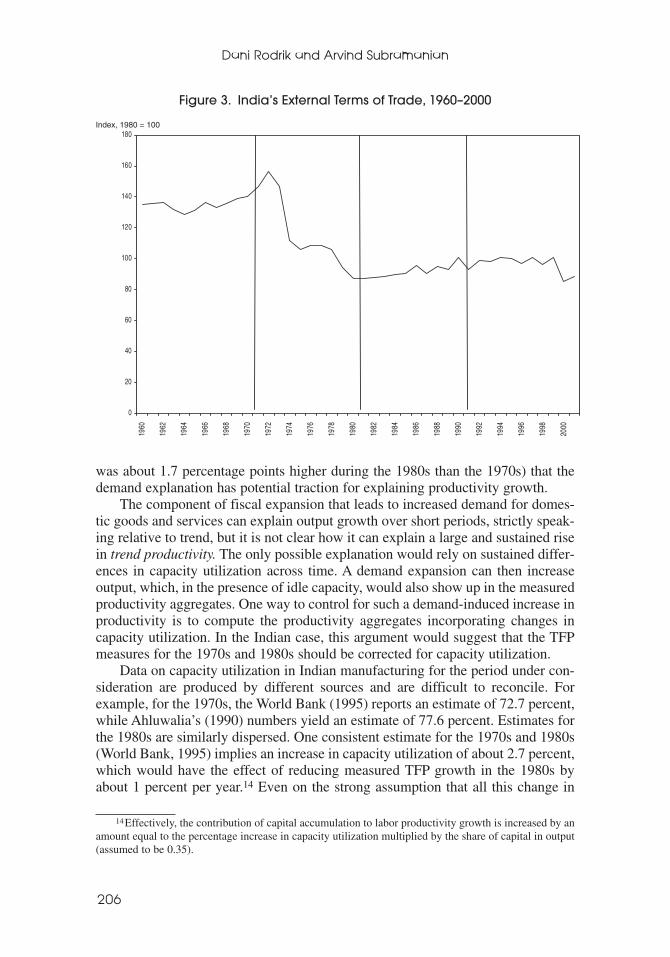
did not present a hospitable environment for developing countries, something thatcan be readily gauged by the widespread slowdown in growth (with the notableexception of China).11 The long decline in industrial country productivity began withthe oil shocks of the 1970s. Figure 3 plots the temporal evolution of India’s terms oftrade, which are a gauge of external environmental conditions. It turns out that since1960, the terms of trade were most unfavorable for India in the 1980s, during whichperiod they declined by about 20 percent relative to the previous period. This, ofcourse, serves only to deepen the mystery of productivity performance in the 1980s,because it appeared to have occurred at a time when exogenous external conditionswere most adverse.12
Aggregate Demand and Unsustainability of 1980s Growth
A common argument used in downplaying the growth of the 1980s is that it wasled by fiscal expansion and hence unsustainable. This view is expressed clearly,for example, in Ahluwalia (2002) and Srinivasan and Tendulkar (2003).13
This [the 1990s] growth record is only slightly better than the annualaverage of 5.7 percent in the 1980s, but it can be argued that the 1980sgrowth was unsustainable, fuelled by a buildup of external debt that cul-minated in the crisis of 1991. In sharp contrast, growth in the 1990s wasaccompanied by remarkable external stability despite the east Asian cri-sis (Ahluwalia, 2002, p. 67).
The fiscal expansionism of the 1980s, accompanied by some liber-alization of controls on economic activity, generated real GDP growth ofmore than 5.8 percent a year. This expansionism, however, was not sus-tainable and led to the macroeconomic crisis of 1991 (Srinivasan andTendulkar, 2003, p. 9).
This Keynesian-run-amok explanation is, at first blush, supported by the data.During the 1970s, the average consolidated government deficit averaged 5 percentof GDP. During the 1980s, this had soared to 9 percent, an annual increase of 4 per-centage points. But the fiscal expansion has two distinct consequences, relating toits unsustainability and its impact on productivity, that the quotes above fail to dis-tinguish. Indeed, the two consequences work at cross-purposes.
Fiscal expansion can lead to rising current account deficits, and hence to abuildup of external debt, which in the Indian case proved to be unsustainable, trig-gering the crisis of 1991. But the more this happens, that is, the more the fiscalexpansion “leaks abroad” and leads to a debt buildup, the less is the demand gen-erated for domestic goods and services, and the less likely that measured produc-tivity increases could have resulted. It is because the current account deficit did notdeteriorate one-for-one relative to the fiscal impulse (the current account deficit
11For example, the real price of oil was 15 percent higher in the 1980s than in the 1970s (and nearly75 percent higher than in the 1990s), and industrial country growth averaged 3.5 percent in the 1970s ver-sus 3.2 percent in the 1980s.
12By the same token, the 1990s productivity performance looks less impressive.13See also Chopra and others (1995).
Dani Rodrik and Arvind Subramanian
206
was about 1.7 percentage points higher during the 1980s than the 1970s) that thedemand explanation has potential traction for explaining productivity growth.
The component of fiscal expansion that leads to increased demand for domes-tic goods and services can explain output growth over short periods, strictly speak-ing relative to trend, but it is not clear how it can explain a large and sustained risein trend productivity. The only possible explanation would rely on sustained differ-ences in capacity utilization across time. A demand expansion can then increaseoutput, which, in the presence of idle capacity, would also show up in the measuredproductivity aggregates. One way to control for such a demand-induced increase inproductivity is to compute the productivity aggregates incorporating changes incapacity utilization. In the Indian case, this argument would suggest that the TFPmeasures for the 1970s and 1980s should be corrected for capacity utilization.
Data on capacity utilization in Indian manufacturing for the period under con-sideration are produced by different sources and are difficult to reconcile. Forexample, for the 1970s, the World Bank (1995) reports an estimate of 72.7 percent,while Ahluwalia’s (1990) numbers yield an estimate of 77.6 percent. Estimates forthe 1980s are similarly dispersed. One consistent estimate for the 1970s and 1980s(World Bank, 1995) implies an increase in capacity utilization of about 2.7 percent,which would have the effect of reducing measured TFP growth in the 1980s byabout 1 percent per year.14 Even on the strong assumption that all this change in
0
20
40
60
80
100
120
140
160
18Index, 1980 = 100
019
60
1962
1964
1966
1968
1970
1972
1974
1976
1978
1980
1982
1984
1986
1988
1990
1992
1994
1996
1998
2000
Figure 3. India’s External Terms of Trade, 1960–2000
14Effectively, the contribution of capital accumulation to labor productivity growth is increased by anamount equal to the percentage increase in capacity utilization multiplied by the share of capital in output(assumed to be 0.35).

THE MYSTERY OF THE INDIAN GROWTH TRANSITION
207
capacity is demand-induced, the turnaround in TFP growth between the 1970sand 1980s would remain substantial (2 to 2.2 percent per year). Of course, theturnaround in labor productivity growth would remain unaffected by changes incapacity utilization.
More broadly, however, the explanation of increased demand is likely to beunsatisfactory or incomplete because the break in the 1980s that we have presented(i) related to a number of productivity aggregates, and not just in aggregate but alsoat the level of the states; (ii) appeared to hold not just in a time-series context forIndia but also in the cross section; and (iii) even on the most favorable interpreta-tion, cannot account for a large share of the turnaround. A lot remains unexplained.
External Liberalization
Was the pickup in India’s trend productivity growth in the 1980s caused by exter-nal liberalization? We present evidence below—relating to trade policies and tradeoutcomes—that paints a remarkably consistent picture of little, if any, liberaliza-tion taking place during the 1980s and significant liberalization taking place in the1990s, with its full effects being felt in the late 1990s.
Table 6 below, based on Das (2003), presents data on the actual trade policyreform carried out since the early 1980s. We can see that during the early 1990s,trade protection declined unambiguously and markedly. However, during the 1980s,protection through tariffs (measured in terms of effective protection) increased, andprotection through quantitative restrictions (measured in terms of the coverage ofthese restrictions) declined only marginally. This is true for manufacturing as a
Table 6. India: Measures of Trade Protection, 1980–2000(In percent )
1980–85 1986–90 1991–95 1996–2000
All industriesAverage effective rate of protection 115.1 125.9 80.2 40.4Import coverage ratio 97.6 91.6 38.0 24.8Import penetration rate 10.0 11.0 12.0 16.0Intermediate goodsAverage effective rate of protection 147.0 149.2 87.6 40.1Import coverage ratio 98.3 98.3 41.8 27.6Import penetration rate 11.0 13.0 15.0 18.0Capital goodsAverage effective rate of protection 62.8 78.5 54.2 33.3Import coverage ratio 95.1 77.2 20.5 8.2Import penetration rate 12.0 12.0 12.0 19.0Consumer goodsAverage effective rate of protection 101.5 111.6 80.6 48.3Import coverage ratio 98.7 87.9 45.7 33.4Import penetration rate 4.0 4.0 4.0 10.0
Source: Das (2003).

Dani Rodrik and Arvind Subramanian
208
whole and for the different use-based sectors. It is important to note here that thesenumbers likely understate the increase in effective protection for final/consumergoods for much of the 1980s and 1990s stemming from the liberalization, albeit lim-ited, of the capital goods sector.
This broad pattern of trade policy reform is confirmed by the data on tariff col-lections and by data related to trade outcomes. Figure 4 illustrates that duties col-lected as a share of imports and GDP rose substantially during the 1980s, peaking inthe early 1990s. Duty collection as a share of imports rose from more than 30 per-cent in the early 1980s to nearly 45 percent in the late 1980s. As a share of GDP,duty collections declined steadily only after the mid-1990s. Figure 4 also computesa broader measure of trade protection—the antiexport bias—which incorporates theexport subsidies granted to manufacturing under various schemes. Incorporatingexport subsidies reduces the level of protection but confirms the pattern of sharplyrising protection during the 1980s. In 1991, the important export subsidies wereeliminated, which imparted a one-off increase to the level of overall protection.
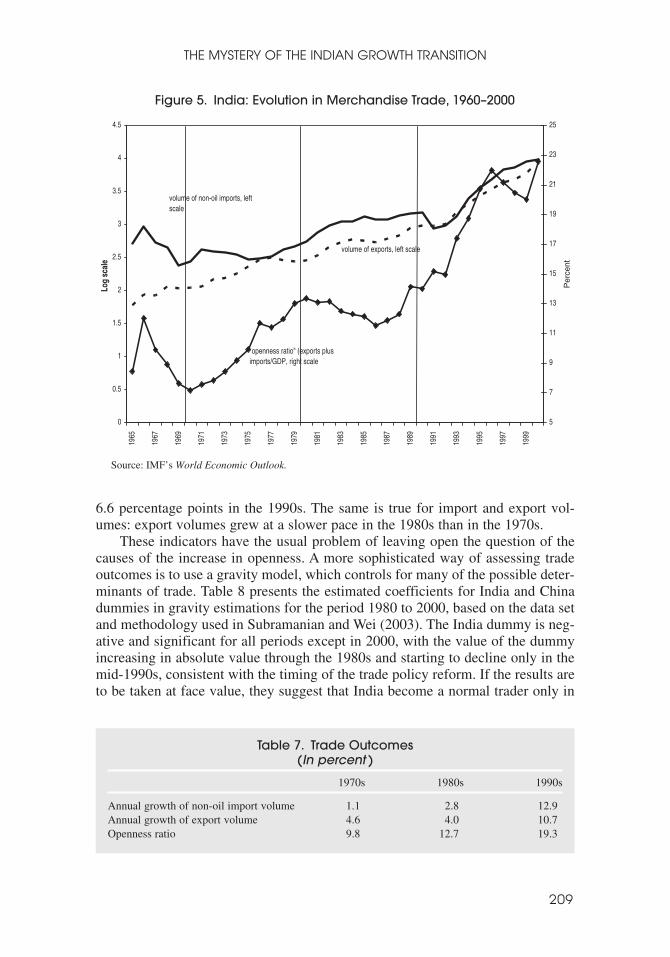
The pattern of trade outcomes is also consistent with the pattern of trade pro-tection (see Figure 5 and Table 7).
Crude outcome indicators such as the openness ratio tell a story of modestincreases in openness during the 1970s and 1980s of 1.5 and 2.2 percentage points,respectively, over the preceding decades, followed by a more dramatic increase of
15
20
25
30
35
40
45
50
1974
1976
1978
1980
1982
1984
1986
1988
1990
1992
1994
1996
1998
2000
1.5
2
2.5
3
3.5
4
duties as percent of imports, left scaleduties as percent of GDP, right scale
anti-export bias in percent,left scale
Sources: Duties (World Bank, World Development Indicators); Imports (IMF, World Economic Outlook),Export subsidies (Joshi and Little, 1994).
Figure 4. India: Customs Duties Collections and Anti-Export Bias,1974–2001
THE MYSTERY OF THE INDIAN GROWTH TRANSITION
209
6.6 percentage points in the 1990s. The same is true for import and export vol-umes: export volumes grew at a slower pace in the 1980s than in the 1970s.
These indicators have the usual problem of leaving open the question of thecauses of the increase in openness. A more sophisticated way of assessing tradeoutcomes is to use a gravity model, which controls for many of the possible deter-minants of trade. Table 8 presents the estimated coefficients for India and Chinadummies in gravity estimations for the period 1980 to 2000, based on the data setand methodology used in Subramanian and Wei (2003). The India dummy is neg-ative and significant for all periods except in 2000, with the value of the dummyincreasing in absolute value through the 1980s and starting to decline only in themid-1990s, consistent with the timing of the trade policy reform. If the results areto be taken at face value, they suggest that India become a normal trader only in
0
0.5
1
1.5
2
2.5
3
3.5
4
4.519
65
1967
1969
1971
1973
1975
1977
1979
1981
1983
1985
1987
1989
1991
1993
1995
1997
19
Per
cent
99
Log
scal
e
5
7
9
11
13
15
17
19
21
23
25
volume of non-oil imports, left scale
volume of exports, left scale
"openness ratio" (exports plus imports/GDP, right scale
Source: IMF’s World Economic Outlook.
Figure 5. India: Evolution in Merchandise Trade, 1960–2000
Table 7. Trade Outcomes(In percent )
1970s 1980s 1990s
Annual growth of non-oil import volume 1.1 2.8 12.9Annual growth of export volume 4.6 4.0 10.7Openness ratio 9.8 12.7 19.3

Dani Rodrik and Arvind Subramanian
210
2000. In contrast, the China dummy is positive and significant for most of the1980–2000 period.
External liberalization could also encompass exchange rate changes that couldhave an impact on trade and productivity. Figure 6 depicts the movement in India’sreal exchange rate since 1968. After remaining broadly unchanged during the firsthalf of the 1980s, the rupee experienced a large real depreciation of more than 40 percent in the second half of the 1980s. Could this have caused the productivityspurt? In terms of timing, the real depreciation followed the pickup in productivity
Table 8. Gravity Model Results of Trade Outcome for India and China
1980 1985 1990 1995 2000
India −0.39 −0.49 −0.82 −0.68 0.040.13 0.13 0.15 0.12 0.10
China 0.52 0.39 0.39 −0.30 0.710.15 0.12 0.14 0.13 0.12
Source: Based on data in Subramanian and Wei (2003).Note: Standard errors below coefficients. Coefficient estimates for the standard covariates not
reported.
4.2
4.4
4.6
4.8
5.0
5.2
5.4
1968
1970
1972
1974
1976
1978
1980
1982
1984
1986
1988
1990
1992
1994
1996
1998
2000
Log
scal
e without export subsidy
with export subsidy
Source: IMF’s Information Notice System.
Figure 6. India: Real Effective Exchange Rate, 1968–2000
THE MYSTERY OF THE INDIAN GROWTH TRANSITION
211
growth in the early 1980s. But could it have contributed to sustaining this spurt inthe late 1980s?
We argue that exchange rate changes are an unlikely candidate. First, a realdepreciation boosts aggregate demand, and while it could have increased outputgrowth in the short term, its consequences for raising long-run productivity growthare less clear. Of course, a real depreciation could have an effect on overall produc-tivity through an import-substitution-induced reallocation effect: if tradables aregenerally more productive than the rest of the economy, raising the share of tradablegoods in overall GDP can result in an economywide productivity increase. In India,the share of manufacturing in GDP is small, and, more important, the increase in thisshare in the aftermath of the real depreciation was too small to help explain overallproductivity growth.15
Was It the Green Revolution?
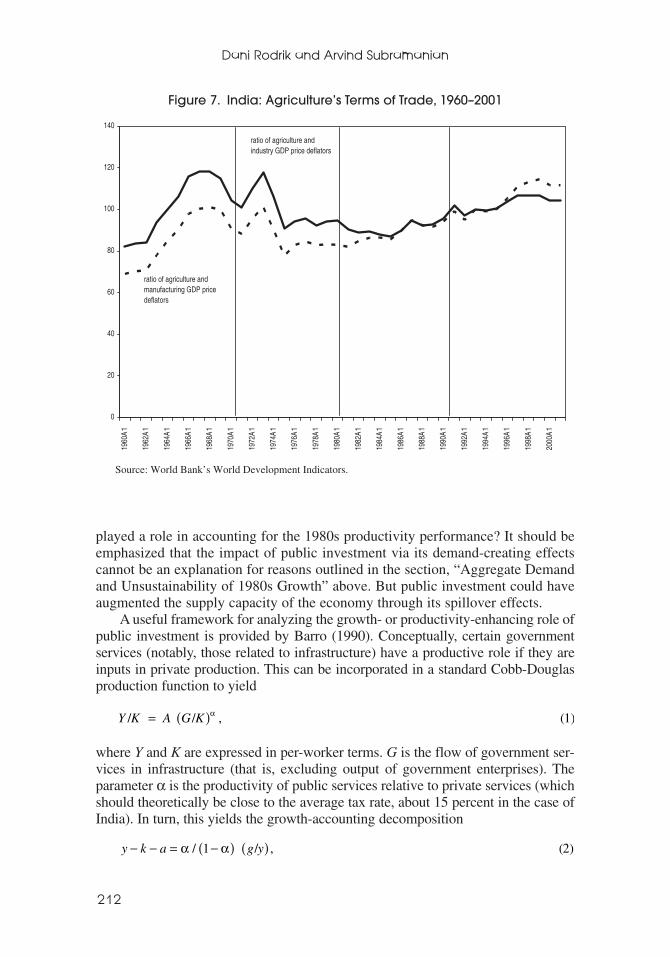
Another possible explanation for the growth pickup in the 1980s is agriculture,which witnessed an increase in labor productivity growth from 0.1 percent in the1970s to 2.6 percent in the 1980s. The difficulty with agriculture as the source ofthe improvement in overall performance is fourfold. First, in quantitative terms, theturnaround in agriculture’s performance was actually less impressive than that inmanufacturing and services, where the acceleration in productivity growth wasactually larger. Second, if rising agricultural productivity were the underlying causefor improved productivity performance elsewhere in the economy, a necessary con-dition that would have to be met is a deterioration in the agricultural terms of trade.This classic “Preobrazhensky effect” relies on improved productivity driving downagricultural prices and releasing resources for use in manufacturing. But as Figure 7illustrates, quite the converse happened. During the 1980s, the terms of trade of agri-culture with respect to industry and manufacturing actually improved. Moreover,as we showed above, the sectoral reallocation brought about by improved agricul-tural productivity performance would be too small to explain improvements inoverall productivity. Third, recent work by Burgess and Venables (2004) and Fosterand Rosenzweig (2003) shows that agricultural productivity plays a comparativelysmall role in explaining the interstate variation in total, urban, and, surprisingly,even rural poverty.16 It is nonfarm productivity that appears to be the driver ofaggregate outcomes. Finally, in our econometric analysis described below, wetoo found no evidence of a role for agriculture in explaining the overall produc-tivity improvement.
Was It Public Investment?
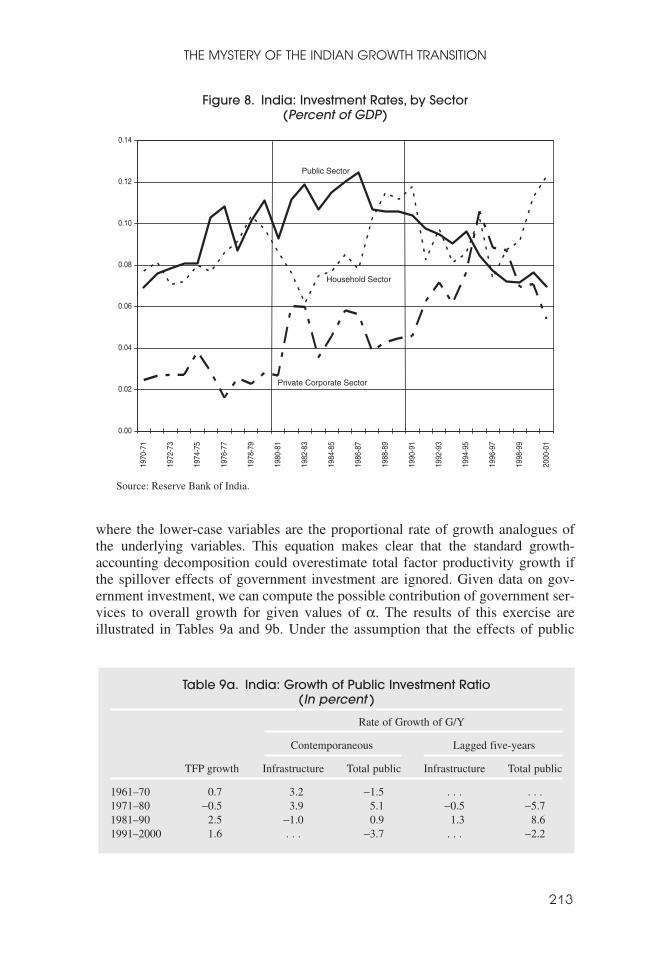
The period between the late 1970s and the late 1980s witnessed a marked rise inpublic investment of about 4 percentage points of GDP (Figure 8). Could this have
15Between 1986 and 1992, the share of manufacturing in GDP remained unchanged at about 16 percent.16At the level of the states, agricultural growth and overall growth are negatively correlated.
Dani Rodrik and Arvind Subramanian
212
played a role in accounting for the 1980s productivity performance? It should beemphasized that the impact of public investment via its demand-creating effectscannot be an explanation for reasons outlined in the section, “Aggregate Demandand Unsustainability of 1980s Growth” above. But public investment could haveaugmented the supply capacity of the economy through its spillover effects.
A useful framework for analyzing the growth- or productivity-enhancing role ofpublic investment is provided by Barro (1990). Conceptually, certain governmentservices (notably, those related to infrastructure) have a productive role if they areinputs in private production. This can be incorporated in a standard Cobb-Douglasproduction function to yield
where Y and K are expressed in per-worker terms. G is the flow of government ser-vices in infrastructure (that is, excluding output of government enterprises). Theparameter α is the productivity of public services relative to private services (whichshould theoretically be close to the average tax rate, about 15 percent in the case ofIndia). In turn, this yields the growth-accounting decomposition
y k a g y− − = −( ) ( )α α/ ,1 / (2)
Y K A G K/ / (1)= ( )α ,
0
20
40
60
80
100
120
14019
60A
1
1962
A1
1964
A1
1966
A1
1968
A1
1970
A1
1972
A1
1974
A1
1976
A1
1978
A1
1980
A1
1982
A1
1984
A1
1986
A1
1988
A1
1990
A1
1992
A1
1994
A1
1996
A1
1998
A1
2000
A1
ratio of agriculture andmanufacturing GDP price deflators
ratio of agriculture and industry GDP price deflators
Source: World Bank’s World Development Indicators.
Figure 7. India: Agriculture’s Terms of Trade, 1960–2001
where the lower-case variables are the proportional rate of growth analogues ofthe underlying variables. This equation makes clear that the standard growth-accounting decomposition could overestimate total factor productivity growth ifthe spillover effects of government investment are ignored. Given data on gov-ernment investment, we can compute the possible contribution of government ser-vices to overall growth for given values of α. The results of this exercise areillustrated in Tables 9a and 9b. Under the assumption that the effects of public
THE MYSTERY OF THE INDIAN GROWTH TRANSITION
213
Table 9a. India: Growth of Public Investment Ratio(In percent )
Rate of Growth of G/Y
Contemporaneous Lagged five-years
TFP growth Infrastructure Total public Infrastructure Total public
1961–70 −0.7 −3.2 −1.5 . . . . . .1971–80 −0.5 −3.9 −5.1 −0.5 −5.71981–90 −2.5 −1.0 −0.9 −1.3 −8.61991–2000 −1.6 . . . −3.7 . . . −2.2
0.00
0.02
0.04
0.06
0.08
0.10
0.12
0.1419
70-7
1
1972
-73
1974
-75
1976
-77
1978
-79
1980
-81
1982
-83
1984
-85
1986
-87
1988
-89
1990
-91
1992
-93
1994
-95
1996
-97
1998
-99
2000
-01
Household Sector
Private Corporate Sector
Public Sector
Source: Reserve Bank of India.
Figure 8. India: Investment Rates, by Sector (Percent of GDP)

Dani Rodrik and Arvind Subramanian
214
investment are contemporaneous or that only the infrastructure component of pub-lic investment enhances productivity, we estimate that the contribution of publicinvestment to overall growth is quite small (0.2–0.3 percent). If, on the other hand,the effects are lagged (by, say, five years), public infrastructure investment, andespecially total public spending, could explain a substantial part of overall growth(1.5–2.9 percent). The bottom line is that the surge in public investment could inprinciple explain India’s growth in the 1980s, but only if we make an appropriateassumption about the nature of the lags between public investment and its pro-ductivity-enhancing effects.
Was It “Internal” Liberalization?
A promising candidate for explaining the 1980s turnaround is what in India iscalled “internal liberalization.” This relates to the dismantling of the vast controlson domestic investment and competition implemented through a Kafkaesque arrayof licenses, regulations, and other forms of control.
We discuss these in greater detail below, but for the purposes of our narrative itis enough to note at this stage that the timing and magnitude of internal liberaliza-tion are not quite compatible with a productivity takeoff in the early 1980s. Indeed,contemporaneous accounts of these internal reforms make clear the limited range ofliberalization that was attempted. In what is probably the best account of this period,Joshi and Little (1994, pp. 71–2) express this sentiment as follows:
In summary, liberalization in our period [1964/65–1990/91] consisted oflittle more than the piecemeal deregulation of industrial licensing and the
Table 9b. Estimates of Contribution of Public Capital to Total FactorProductivity Growth, 1960–2000
Contribution of Public Capital to TFP Growth
Contemporaneous Lagged five-years
TFP Total Total Total Total Growth Infr.1 Public2 Infr.1 Public2 Infr.1 Public2 Public2
Bosworth-Collins Alpha=0.25 Alpha=0.15 Alpha=0.25 Alpha=0.15
1961–70 0.7 1.1 −0.5 0.6 −0.31971–80 −0.5 1.3 1.7 0.7 0.9 −0.2 −1.9 −0.1 −1.01981–90 2.5 −0.3 0.3 −0.2 0.2 0.4 2.9 0.2 1.51991–2000 1.6 −1.2 −0.7 −0.7 −0.4
Sources: Authors’ calculations. Infrastructure spending data are from Joshi and Little, (1994,Table 13.7).
Note: Data on total public investment are from Joshi and Little (1994) for 1961–70 and WorldEconomic Outlook for 1971–2000. Infr. = Infrastructure.
1Government spending on infrastructure.2Total public spending.
THE MYSTERY OF THE INDIAN GROWTH TRANSITION
215
introduction of a measure of exchange rate flexibility. These changes werenot trivial and did improve economic performance. But ideology andvested interests prevented any significant action in the more difficult areassuch as trade liberalization, financial liberalization, and reform of the labormarket and public sector enterprises.
Srinivasan and Tendulkar (2003, p. 2) imply the same when they talk of the“shift in 1991 from an inward-oriented, state-led development strategy to a policyof active reintegration with the world economy” (our italics).
Others have, however, drawn attention to the important steps taken between 1985and 1988, under Rajiv Gandhi, to dismantle the industrial licensing system in India.We describe these in greater detail below, but a rough idea of the importance of thesesteps can be gauged by the assessment that in 1991, prior to the sweeping deregulatoryeffort, between 60 percent and 80 percent of industry was still subject to licensing andcontrols.17 Thus, the magnitude of the reform effort not only seems modest, but it alsolags behind the turnaround in the productivity surge.
III. Possible Explanation
So what explains the Indian growth takeoff in the early 1980s? In this section, we pro-pose an alternative explanation and offer in support some econometric evidence.First, a few points on our data set and approach, which rely largely on exploiting vari-ations in performance among the 21 states for which we have data. Accordingly, weuse state-level data for the period 1960–2000, which is disaggregated by 17 sectorsin the national income accounts. For one of these sectors—manufacturing—data arealso available for the output of the registered and unregistered sectors. These datawere compiled and recently released by the Economic and Political Weekly ResearchFoundation.
We created a panel data set with variables defined for four decades: the 1960s,1970s, 1980s, and 1990s. Because we are interested in changes in impact across thesedecades, particularly in the 1980s, we interacted the explanatory variables with theappropriate decadal dummies. Data on the political variables were gathered from thewebsite of the Election Commission of India (http://www.eci.gov.in/ElectionResults/ElectionResults_fs.htm) and supplemented by state-level sources.
Our explanation comprises four elements. First, there was an attitudinal changeon the part of the government in the 1980s, signaling a shift in favor of the privatesector, with this shift validated in a very haphazard and gradual manner throughactual policy changes. Second, this shift and the limited policy changes were pro-business rather than procompetition, aimed primarily at benefiting incumbents in theformal industrial and commercial sectors. Third, these small shifts elicited a largeproductivity response because India was far away from its income-possibility fron-tier. Finally, manufacturing, which was built up through previous efforts, played akey role in determining the responses to the shifts.
17The 60 percent estimate is from Chopra and others (1995, Table 7.6, p. 60), while the 80 percentestimate is from Hasan (1997, p. 27). Also, data compiled by Balakrishnan and Babu (2003) suggest thatgross margins in industry did not decline in the 1980s relative to the 1970s.
Dani Rodrik and Arvind Subramanian
216
We posit that sometime in the early 1980s there was a significant attitudinalchange toward the private sector on the part of the national government, led byIndira Gandhi’s Congress Party. Congress went from being hostile to private busi-ness18 to mildly supportive and, eventually, quite supportive. This change was in-augurated with the return of a much-chastened Indira Gandhi to political power inthe 1980s after a three-year rule by the Janata party. It gathered momentum (afterher assassination) under Rajiv Gandhi. The transformation has some antecedentsin the 1970s, as reflected for example in the appointment of high-level committeesto propose changes to the trade regime and to industrial licensing. One importantmanifestation of this change, noted by Joshi and Little (1994), was the fact thatimport controls were not tightened in the wake of the balance of payments crisisin 1979–80.
But the attitudinal change was grounded primarily in political calculation andnot in a desire to enhance the efficiency of the economic regime. As Kohli (1989)notes, Indira Gandhi’s main objective was to counter the perceived threat posed bythe Janata party, which had trounced Congress in the Hindi heartland in the 1977elections. Her political rhetoric consequently became less secular and populist andmore communal and private sector oriented. In Kohli’s words, “in India’s politicalculture . . . the two packages of secularism and socialism and Hindu chauvinism andprobusiness have tended to offer two alternative legitimacy formulae for mobilizingpolitical support” (Kohli, 1989, p. 308). After 1980, Indira Gandhi dropped the firstpackage in favor of the second. From our perspective, what is particularly importantis that she now actively sought to woo the business and industrial establishment.
As we have already noted, there were few significant policy changes in theearly 1980s, and the changes later on (beginning in 1985) were restricted largely tosome internal liberalization relating to the relaxation of industrial licensing. Thelimited nature of these changes, as well as the form that they took, is best under-stood by appreciating the political logic of Indira Gandhi’s (and later Rajiv Gandhi’s)efforts. These were aimed at gathering support from the business establishmentrather than alienating them. Hence there was more action where business supportexisted (for example, in reducing taxes, easing access to imported capital inputs,and liberalizing capacity restrictions) than where it did not (for example, in externalliberalization).
As we have noted, most observers agree that the actual policy framework didnot change significantly until 1991. That is why we describe the shift as an “atti-tudinal” one, having to do with the government’s attitude toward business and theprivate sector, rather than as policy reform per se. This shift had more to do withcurrying favor with existing business interests (essentially large, politically influ-ential firms in the formal manufacturing sector) than with liberalizing the systemas a whole.
We explore the implications of the first two elements of our explanation: if thecausal mechanism is a shift in the attitudes of the national government, we should
18Basu (2003) describes the general attitude of mistrust toward business in post-colonial India, trac-ing it back to India’s experience with the East India Company and the trader mentality of the colonialrulers.
THE MYSTERY OF THE INDIAN GROWTH TRANSITION
217
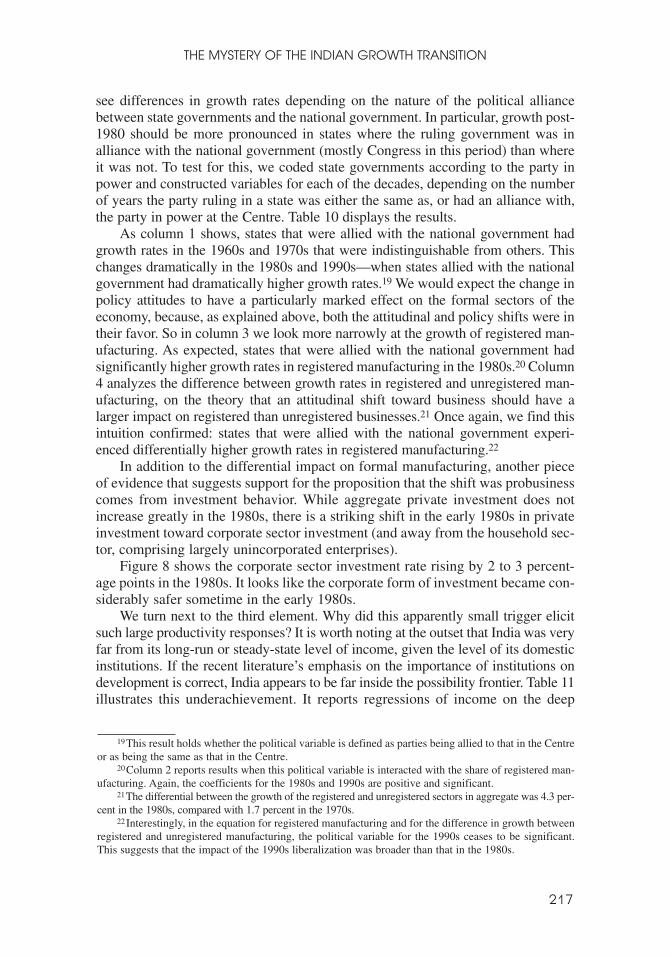
see differences in growth rates depending on the nature of the political alliancebetween state governments and the national government. In particular, growth post-1980 should be more pronounced in states where the ruling government was inalliance with the national government (mostly Congress in this period) than whereit was not. To test for this, we coded state governments according to the party inpower and constructed variables for each of the decades, depending on the numberof years the party ruling in a state was either the same as, or had an alliance with,the party in power at the Centre. Table 10 displays the results.
As column 1 shows, states that were allied with the national government hadgrowth rates in the 1960s and 1970s that were indistinguishable from others. Thischanges dramatically in the 1980s and 1990s—when states allied with the nationalgovernment had dramatically higher growth rates.19 We would expect the change inpolicy attitudes to have a particularly marked effect on the formal sectors of theeconomy, because, as explained above, both the attitudinal and policy shifts were intheir favor. So in column 3 we look more narrowly at the growth of registered man-ufacturing. As expected, states that were allied with the national government hadsignificantly higher growth rates in registered manufacturing in the 1980s.20 Column4 analyzes the difference between growth rates in registered and unregistered man-ufacturing, on the theory that an attitudinal shift toward business should have alarger impact on registered than unregistered businesses.21 Once again, we find thisintuition confirmed: states that were allied with the national government experi-enced differentially higher growth rates in registered manufacturing.22
In addition to the differential impact on formal manufacturing, another pieceof evidence that suggests support for the proposition that the shift was probusinesscomes from investment behavior. While aggregate private investment does notincrease greatly in the 1980s, there is a striking shift in the early 1980s in privateinvestment toward corporate sector investment (and away from the household sec-tor, comprising largely unincorporated enterprises).
Figure 8 shows the corporate sector investment rate rising by 2 to 3 percent-age points in the 1980s. It looks like the corporate form of investment became con-siderably safer sometime in the early 1980s.
We turn next to the third element. Why did this apparently small trigger elicitsuch large productivity responses? It is worth noting at the outset that India was veryfar from its long-run or steady-state level of income, given the level of its domesticinstitutions. If the recent literature’s emphasis on the importance of institutions ondevelopment is correct, India appears to be far inside the possibility frontier. Table 11illustrates this underachievement. It reports regressions of income on the deep
19This result holds whether the political variable is defined as parties being allied to that in the Centreor as being the same as that in the Centre.
20Column 2 reports results when this political variable is interacted with the share of registered man-ufacturing. Again, the coefficients for the 1980s and 1990s are positive and significant.
21The differential between the growth of the registered and unregistered sectors in aggregate was 4.3 per-cent in the 1980s, compared with 1.7 percent in the 1970s.
22Interestingly, in the equation for registered manufacturing and for the difference in growth betweenregistered and unregistered manufacturing, the political variable for the 1990s ceases to be significant.This suggests that the impact of the 1990s liberalization was broader than that in the 1980s.

Dani Rodrik and Arvind Subramanian
218
Tab
le10
.In
dia
:Atti
tud
ina
lSh
ift1
Dif
fere
nce
inG
row
thG
row
thR
ate
ofPe
rC
apita
Gro
wth
Rat
eof
Reg
iste
red
Bet
wee
nR
egis
tere
dan
dD
epen
dent
Var
iabl
eD
omes
ticPr
oduc
tM
anuf
actu
ring
Unr
egis
tere
dM
anuf
actu
ring
Initi
alin
com
e0.
011
0.00
92.
531.
92St
ate
part
yal
lied
with
Cen
tre
600.
000
0.02
90.
027
0.01
1.51
1.40
Stat
epa
rty
allie
dw
ithC
entr
e70
−0.0
060.
015
−0.0
02−0
.85
0.57
−0.0
8St
ate
part
yal
lied
with
Cen
tre
800.
021
0.09
70.
058
2.68
3.07
2.09
Stat
epa
rty
allie
dw
ithC
entr
e90
0.02
70.
004
−0.0
352.
480.
102
1.17
Initi
alle
velo
fre
gist
ered
man
ufac
turi
ng−0
.005
−0.0
08−1
.28
−1.9
8Pa
rty
shar
eof
regi
ster
edm
anuf
actu
ring
60*
−0.0
77−0
.94
Part
ysh
are
ofre
gist
ered
man
ufac
turi
ng70
*−0
.151
−1.7
3Pa
rty
shar
eof
regi
ster
edm
anuf
actu
ring
80*
0.26
62.
48Pa
rty
shar
eof
regi
ster
edm
anuf
actu
ring
90*
0.24
13.
04R
squa
re0.
410.
400.
230.
29N
o.of
obse
rvat
ions
5858
5959
Sour
ces:
Unl
ess
othe
rwis
esp
ecif
ied,
data
are
from
the
Eco
nom
ican
dPo
litic
alW
eekl
yR
esea
rch
Foun
datio
n.N
ote:
Dat
aon
polit
ical
part
ies
com
pile
dfr
om(h
ttp://
ww
w.e
ci.g
ov.in
/info
eci/k
ey_s
tat/k
eyst
at_f
s.ht
m)
and
supp
lem
ente
dby
stat
e-le
vel
sour
ces.
T-st
atis
tics
repo
rted
belo
wco
effi
cien
test
imat
e.1 A
ster
isks
indi
cate
that
the
unde
rlyi
ngva
riab
leha
sbe
enin
tera
cted
with
the
appr
opri
ate
deca
dald
umm
y.

THE MYSTERY OF THE INDIAN GROWTH TRANSITION
219
determinants of income (based on Acemoglu, Johnson, and Robinson, 2001; andRodrik, Subramanian, and Trebbi, 2002) with an India dummy.
The first four columns report results where the institutional variable is eco-nomic, while the last four columns contain political institutions as the relevant deter-minant of long-run income. The estimated coefficient on the India dummy in bothsets of regressions is negative and significant, suggesting that India is an outlier. Themagnitude of the dummy coefficient is large: for example, column 1 suggests that in1980, India’s level of income was about one-fourth of what it should have been,given the strength of its economic institutions. On the other hand, if political insti-tutions are the true long-run determinants of income, India’s income is about 15 per-cent of what it should be. India has thus been a significant underachiever in the sensethat it has not exploited the potential created by having done the really hard work ofbuilding institutions.
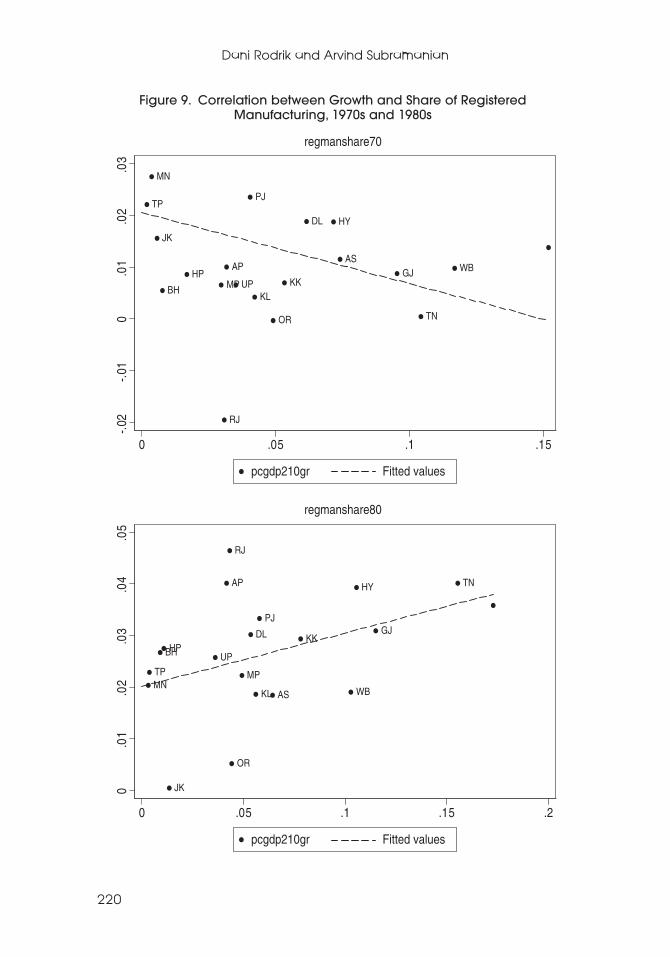
Next we turn to the role of manufacturing, and in particular registered (or for-mal) manufacturing, in mediating the changes. We begin by noting a very strongregularity in the data: starting in the 1980s, it is states with the largest formal man-ufacturing base (“registered manufacturing”) that take off. Figure 9 shows how thesimple correlation between growth and the share of registered manufacturing intotal output, which is weakly negative in the 1970s (rho = −0.08), turns signifi-cantly positive in the 1980s (rho = 0.42). Table 12 tests this more formally. Whenwe introduce state-level registered manufacturing shares in the growth regressionand allow the coefficients to vary by decade, not only are the shares for the 1980sand 1990s highly positive and significant, but these variables can “knock out” the
Table 11. How Far Below Its Steady-State Income Is India?
Period 1980 1999 1980 1999 1980 1999 1980 1999
Geography 0.04 −0.07 0.03 −0.01 0.02 0.00 0.01 0.035.19 −1.51 2.74 −0.93 1.72 0.21 1.23 4.55
Openness 0.27 −0.89 0.43 −0.54 −0.10 −0.54 −0.04 0.011.07 −1.18 0.66 −2.03 −0.28 −0.71 −0.17 0.03
Economic institutions 0.51 2.60 1.53 1.474.32 3.05 1.36 6.80
Political institutions 0.38 0.65 0.46 0.453.24 2.90 5.39 5.92
India dummy 21.36 21.40 21.06 21.33 22.61 22.34 22.61 21.6924.61 22.36 21.28 24.92 24.59 23.27 26.82 25.95
Instrument for Settler mortality EURFRAC, ENGFRAC Settler mortality EURFRAC, ENGFRACinstitutions
No. of observations 48 66 76 114 58 58 91 91
Notes: For description of geography and openness variables and the instruments for institutions, seeRodrik, Subramanian, and Trebbi (2002).
For 1980, economic institutions measured as the protection against expropriation in 1982 from ICRGE.For 1999, economic institutions measured as in Rodrik, Subramanian, and Trebbi (2002).Political institutions are measured as the constraint on the executive.T-statistics reported below coefficient estimates.
220
Figure 9. Correlation between Growth and Share of RegisteredManufacturing, 1970s and 1980s
APAS
BH
DL
GJ
HY
HP
JK
KKKL
MP
MN
OR
PJ
RJ
TN
TP
UP
WB
-.02
-.01
0.0
1.0
2.0
3
0 .05 .1 .15
regmanshare70
pcgdp210gr Fitted values
AP
AS
BH
DL GJ
HY
HP
JK
KK
KL
MPMN
OR
PJ
RJ
TN
TP
UP
WB
0.0
1.0
2.0
3.0
4.0
5
0 .05 .1 .15 .2
regmanshare80
pcgdp210gr Fitted values
Dani Rodrik and Arvind Subramanian

THE MYSTERY OF THE INDIAN GROWTH TRANSITION
221
pure period dummies (see columns 1–2).23 In other words, whatever happened inthe early 1980s, it stimulated growth primarily in states with high levels of formalmanufacturing activities.
We note also that this is not simply an artifact of the fact that it is the richerstates that take off after 1980 (the richer ones also having, in general, larger man-ufactures shares). Column 4 shows that manufacturing shares are still significant
Table 12. Role of Manufacturing in Productivity Surge1
Initial income 0.010 0.008 0.009 0.007 0.007 0.019 0.0072.64 1.84 2.27 1.87 1.54 3.86 1.27
1970s dummy −0.003 −0.002−0.78 −0.30
1980s dummy 0.014 0.0073.85 1.14
1990s dummy 0.013 0.0052.61 0.51
Initial income 70 −0.001−0.37
Initial income 80 0.0020.94
Initial income 90 0.0010.51
Share of registered −0.046 −0.079 −0.050 −0.030manufacturing 60 −0.73 −1.70 −0.73 −0.45
Share of registered −0.050 −0.104 −0.044 −0.046manufacturing 70 −0.94 −2.43 −0.81 −1.01
Share of registered 0.076 0.119 0.080 0.170manufacturing 80 1.79 3.37 1.78 3.76
Share of registered 0.100 0.113 0.096 0.157manufacturing 90 1.44 2.64 1.31 2.81
Labor regulation 60 0.004 −0.0010.73 −0.23
Labor regulation 70 0.012 0.0082.14 1.45
Labor regulation 80 −0.008 −0.008−2.21 −3.56
Labor regulation 90 0.000 0.0000.05 0.11
R square 0.38 0.42 0.40 0.43 0.42 0.34 0.55No. of observations 80.00.. 78.00.. 78.00. 80.00.. 78.00. 59.00... 59.00..
Sources: Unless otherwise specified, data are from the Economic and Political Weekly ResearchFoundation.
Note: T-statistics are reported below coefficient estimates. Data on labor regulation from Besleyand Burgess (2002).
Dependent variable is annual per capita growth of state net domestic product.1Suffixes indicate that the underlying variable has been interacted with the appropriate decadal
dummy.
23To minimize endogeneity-related problems, the beginning-period value of the share of registeredmanufacturing is used as the regressor.

Dani Rodrik and Arvind Subramanian
222
in the 1980s, when period-specific convergence terms are added to the regression(while the latter are insignificant).
The importance of the registered manufacturing sector in the productivity surgeis confirmed in the robustness checks that we report in Table 13. In columns 1–4,we check whether agriculture or infrastructure, which account for a larger share ofoutput than registered manufacturing, play a similarly important role. Not only arethese variables insignificant on their own, they are also unable to “knock down” thesignificance of the decadal dummies. In columns 5–7, we undertake a different kindof check on the role of manufacturing. If the mechanism by which manufacturingwas affecting overall GDP growth was spillovers, for example, in the form ofhuman and managerial capital built up in industry and applied elsewhere in theeconomy, it seems plausible that these spillovers should occur more in relation toservices than agriculture. To test this, we change the dependent variable in columns5–7 to per capita nonagricultural GDP growth. In all these specifications, the reg-istered manufacturing variable for the 1980s is highly significant. Interestingly, themagnitude of this coefficient is more than twice its value in the specification withoverall GDP as the dependent variable (Table 13, col. 3), suggesting that any spill-over benefits from manufacturing are greater in the nonagricultural than in the agri-cultural sector.
What do these registered manufacturing shares capture about the nature of thechange that occurred? We interpret these findings in the following way. It is reason-able to suppose that an antibusiness attitude on the part of top political leaders entailsa disproportionate “tax” on formally registered entities. That is because these firms’operations are intensive in transactions with the government (paying taxes, comply-ing with regulations, seeking licenses, and so on). When political attitudes becomemore probusiness, it is formal firms that should receive a particularly strong boost.That is exactly how we read the results with respect to registered manufacturing.
We also show evidence that the labor regulation data recently compiled byBesley and Burgess (2002) has some traction for the turnaround in the 1980s. Weinterpret this index as a measure of how prolabor (and antibusiness) the environ-ment in different states was. We find that the nature of these regulations in differ-ent states plays a role in explaining differential performance in the crucial decadeof the 1980s (whether manufacturing shares are controlled or not—see columns 5and 6 of Table 12). This once again is consistent with our hypothesis that whatmade the difference in the 1980s was a shift toward a more probusiness stance.
To sum up, the evidence points to an unleashing of the organized and incumbentprivate sector sometime in the early 1980s. While it is impossible to pinpoint exactlythe source for this, there is circumstantial evidence that the trigger was a shift in thenational government’s attitude toward the private sector. This evidence also indi-cates that the beneficiary of this attitudinal shift was the formal sector built up underthe earlier policy regime. Hence, to some extent, the lessons learned under the ear-lier policy regime and the modern manufacturing base created thereby provided apermissive environment for eventual takeoff once the policy stance softened vis-à-vis the private sector. So, unlike what one may have otherwise expected (fromaccounts of how costly ISI was), growth occurred where the earlier investmentshad been made. This is, of course, in contrast to the experience of the transition
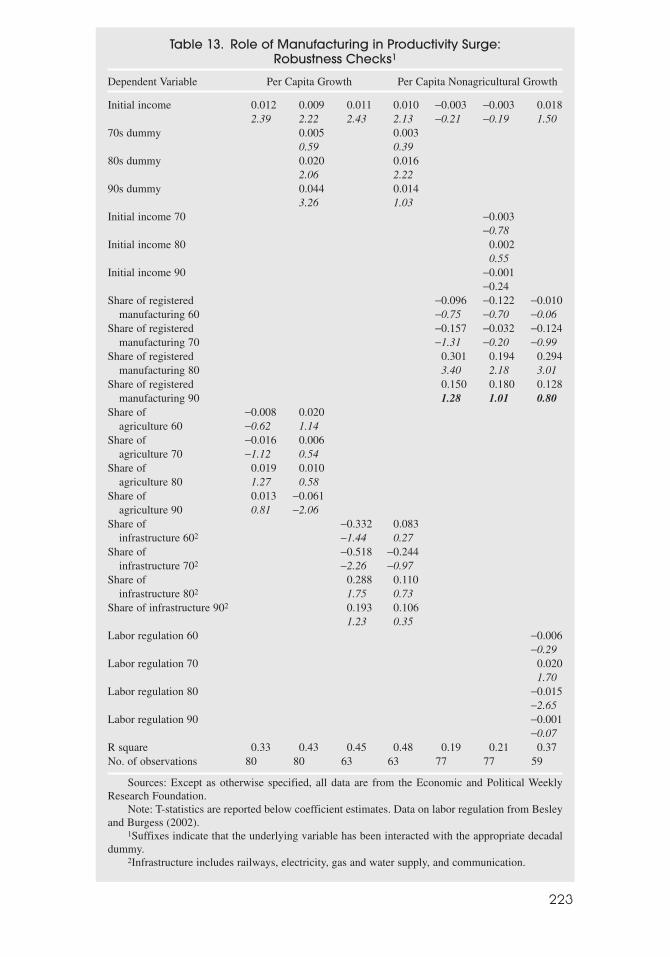
223
Table 13. Role of Manufacturing in Productivity Surge: Robustness Checks1
Dependent Variable Per Capita Growth Per Capita Nonagricultural Growth
Initial income 0.012 0.009 0.011 0.010 −0.003 −0.003 0.0182.39 2.22 2.43 2.13 −0.21 −0.19 1.50
70s dummy 0.005 0.0030.59 0.39
80s dummy 0.020 0.0162.06 2.22
90s dummy 0.044 0.0143.26 1.03
Initial income 70 −0.003−0.78
Initial income 80 0.0020.55
Initial income 90 −0.001−0.24
Share of registered −0.096 −0.122 −0.010manufacturing 60 −0.75 −0.70 −0.06
Share of registered −0.157 −0.032 −0.124manufacturing 70 −1.31 −0.20 −0.99
Share of registered 0.301 0.194 0.294manufacturing 80 3.40 2.18 3.01
Share of registered 0.150 0.180 0.128manufacturing 90 1.28 1.01 0.80
Share of −0.008 0.020agriculture 60 −0.62 1.14
Share of −0.016 0.006agriculture 70 −1.12 0.54
Share of 0.019 0.010agriculture 80 1.27 0.58
Share of 0.013 −0.061agriculture 90 0.81 −2.06
Share of −0.332 0.083infrastructure 602 −1.44 0.27
Share of −0.518 −0.244infrastructure 702 −2.26 −0.97
Share of 0.288 0.110infrastructure 802 1.75 0.73
Share of infrastructure 902 0.193 0.1061.23 0.35
Labor regulation 60 −0.006−0.29
Labor regulation 70 0.0201.70
Labor regulation 80 −0.015−2.65
Labor regulation 90 −0.001−0.07
R square 0.33 0.43 0.45 0.48 0.19 0.21 0.37No. of observations 80 80 63 63 77 77 59
Sources: Except as otherwise specified, all data are from the Economic and Political WeeklyResearch Foundation.
Note: T-statistics are reported below coefficient estimates. Data on labor regulation from Besleyand Burgess (2002).
1Suffixes indicate that the underlying variable has been interacted with the appropriate decadaldummy.
2Infrastructure includes railways, electricity, gas and water supply, and communication.

Dani Rodrik and Arvind Subramanian
224
countries, where post-transition growth was greatest in countries where the dragexerted by the previous state sector was smallest.24
IV. Concluding Remarks
We believe that our findings raise a number of issues related to growth and, in par-ticular, growth transitions. We summarize them as follows.
India’s growth transition began in the early 1980s, rather than after the crisisof 1991. The performance of the 1980s cannot be explained by Keynesian pumppriming, because there is a variety of time-series and cross-section evidence point-ing to trend improvements in productivity indicators. Equally, this transition wasnot triggered by implementing the conventional litany of Washington Consensusreforms, because the transition occurred a full decade before such reforms were ini-tiated. It appears to have been triggered by a perception on the part of the privatesector that the government’s attitude toward it had changed, a perception that wassubsequently (in the mid- to late 1980s) mildly validated by piecemeal reforms ofthe industrial licensing system. The attitudinal shift signaled by the Congress Partygovernments in the 1980s elicited a large productivity response, a phenomenon facil-itated by the fact that India was far away from its income-possibility frontier.
Manufacturing, and in particular registered manufacturing, which had beenbuilt up in the previous decades, appears to have played an important role in deter-mining which states took advantage of the changed attitude of the private sector.Thus, although the costs associated with these investments may have been high,they may have generated some spillover benefits in the post-1980s period.
Most observers, focusing on the 1990s and, to some extent, the 1980s, haveemphasized gradualism as the hallmark of the Indian approach to reforms in contrastto the shock therapy employed in some of the transition countries and the ambitiousliberalization in Latin America since the mid-1980s (Ahluwalia, 2002). Equallyimportant but somewhat neglected has been the approach to reforms adopted byIndia in the 1980s, which arguably has less to do with their pace than with their man-ner and sequencing.
We stress that our characterization of the 1980s reform is not about whether lib-eralization took place but about how it happened. Some accounts of the 1980s pointto the easing of access to foreign technology, to foreign capital goods, and to foreigndirect investment (with the entry of Suzuki into the domestic car market as the mosttelling example) as examples of liberalization. To us, these reforms in the 1980swere not proliberalization but probusiness in the important sense that they boostedthe profits of existing businesses without threatening them with real competition,because external barriers remained largely in place. Allowing a single foreign firm,Suzuki, to enter the domestic car market under existing conditions of limited exter-nal liberalization (and subject to local-content requirements) is very different from
24Sachs and Woo (1997) argue that this drag was important in explaining the differential performanceof China and the East European countries in the wake of liberalization.
THE MYSTERY OF THE INDIAN GROWTH TRANSITION
225
opening the domestic car market to all foreign producers, which is the normal liber-alization strategy and the approach adopted in the 1990s.25
This probusiness rather than promarket/procompetition orientation manifesteditself in the greater focus on internal rather than external reforms. In addition, eventhe internal reforms that favored business were slanted more toward bolsteringpreexisting activities than facilitating new businesses (that is, facilitating entry bydomestic firms).26 This approach had the political economy merit of avoiding thecreation of losers. And it appears that the economic impact of favoring existingactivities, which must have entailed some inefficiency, was not only not negative, itwas actually positive. This is reflected in the fact that the growth in the 1990s alsoappears to have taken place in states with a large initial share of registered manu-facturing, some of it built up during the 1980s. Thus, India’s “reforms” in the 1980s,which essentially amounted to more import substitution, were attractive from apolitical economy perspective because they created virtually no losers. This is rem-iniscent of China’s reforms, although they took on a very different form.
But, just as in China, economic dynamism created a fertile environment not onlyfor incumbents but also for new entrants and activities. It is perhaps not a coinci-dence that some of the IT powerhouses that would begin to fuel India’s growth adecade or so later got established in the early 1980s, just as the economic environ-ment was turning more business friendly. For example, Wipro first ventured into ITin 1980, and Infosys was founded in 1981. Once the policy environment turned per-missive, these firms were able to reap handsome benefits from India’s prior publicinvestment in higher education (the Indian Institutes of Technology in particular).Their story is in many ways similar to the one we have laid out for the more tradi-tional activities during the 1980s: preexisting strengths were unleashed by moreprobusiness policy attitudes.
What about the reforms of the 1990s? It may well be that the performance of the1980s would have run out of steam and that the “true” reforms of the 1990s wereessential to keep productivity growth alive. The reforms of the 1990s were, of course,triggered by the crisis of 1991. The quick rebound from the crisis has been almostentirely attributed to the decisive break from the dirigiste past. But if the 1980s expe-rience was as successful as we think it might have been in creating a strong base ofmanufacturing and productivity growth, it is hard not to draw the conclusion that the
25Guaranteed profits were arguably why Suzuki accepted the onerous conditions—including a jointventure with the public sector and the requirement to fulfill local-content requirements—associated withits entry.
26The four major internal liberalization measures that were implemented in 1985 and 1986 involved(i) eliminating the licensing of 25 categories of industries subject to certain fairly onerous conditions,(ii) extending delicensing to large companies in 22 industries that were previously restricted by theMonopolies and Trade Restrictive Practices Act and Foreign Exchange Regulation Act, (iii) allowing com-panies in 28 industries to expand the scope of their operations into related activities, and (iv) allowingcompanies that had reached 80 percent capacity utilization to expand their capacity up to 133 percent ofthat reached in any of the previous years. Apart from the first, all the remaining measures essentiallyallowed incumbents to operate more freely rather than facilitating the entry of new domestic firms and pro-moting competition. Even the limited reduction in protection of capital goods industries increased theeffective protection of incumbents in final goods industries.
Dani Rodrik and Arvind Subramanian
226
quick rebound was also rendered possible by the strength of the 1980s performance.27
In some ways, although India was reforming in response to a macroeconomic crisis,it was reforming from a position of strength in the real sector of the economy. Thatmight explain why the response to the reforms in India in the 1990s was so dif-ferent from the response to reforms in Latin America or in sub-Saharan Africa.
Finally, one consequence of the conventional story that we sketched out at thebeginning—that the 1990s marked a watershed for India—has been the unfortu-nate neglect of research on policies and performance in the 1980s. We hope that thispaper will kindle research interest in a number of fascinating issues relating to the1980s, which could be important in deriving broader lessons for growth transitionsacross the world.
REFERENCES
Acemoglu, Daron, Simon Johnson, and James A. Robinson, 2001, “The Colonial Origins ofComparative Development: An Empirical Investigation,” American Economic Review,Vol. 91, No. 5, pp. 1369–1401.
Ahluwalia, I. J., 1990, Productivity and Growth in Indian Manufacturing (New Delhi: OxfordUniversity Press).
———, 1995, India: Industrial Development Review (London: The Economist Intelligence Unit;Vienna: UNIDO).
———, 2002, “Economic Reforms in India Since 1991: Has Gradualism Worked?” Journal ofEconomic Perspectives, Vol. 16, No. 3, pp. 67–88.
Bai, Jushan, and Pierre Perron, 1998, “Estimating and Testing Linear Models with MultipleStructural Changes,” Econometrica, Vol. 66, No. 1, pp. 47–78.
———, 2003, “Computation and Analysis of Multiple Structural Change Models,” Journal ofApplied Econometrics, Vol. 18, No. 1, pp. 1–22.
Balakrishnan, P., and M. S. Babu, 2003, “Growth and Distribution in Indian Industry in theNineties,” Economic and Political Weekly (September), pp. 3997–4005.
Balakrishnan, P., and K. Pushpagandan, 1994, “Manufacturing Industry: A Fresh Look,” Economicand Political Weekly (October), pp. 2028–35.
Barro, R., 1990, “Government Spending in a Simple Model of Endogenous Growth,” Journalof Political Economy, Vol. 98, No. 5, pp. S103–26.
Basu, Kaushik, 2003, “The Indian Economy: Up to 1991 and Since,” BREAD Working PaperNo. 052 (New Delhi: Bureau for Research in Economic Analysis of Development).
Besley, T., and R. Burgess, 2002, “Can Labor Regulation Hinder Economic Performance?Evidence from India,” CEPR Discussion Paper No. 3260 (London: Centre for EconomicPolicy Research).
Bosworth, B., and S. Collins, 2003, “The Empirics of Growth: An Update,” Brookings Paperson Economic Activity: 2, Brookings Institution, pp. 113–206.
Burgess, R., and A. J. Venables, 2004, “Towards a Microeconomics of Growth,” World BankPolicy Research Paper No. 3257 (Washington: World Bank).
27This is supported by cross-industry studies, which show that the positive impact of liberalization onproductivity in the 1990s is small (Topalova, 2004).
THE MYSTERY OF THE INDIAN GROWTH TRANSITION
227
Chopra, A., C. Collyns, R. Hemming, and K. Parker, with W. Chu and O. Fratzcher, 1995,India: Economic Reform and Growth, IMF Occasional Paper No. 134 (Washington:International Monetary Fund).
Das, D. K., 2003, “Quantifying Trade Barriers: Has Protection Declined Substantially in IndianManufacturing?” Indian Council for Research on International Economic RelationsWorking Paper No. 105 (New Delhi: Indian Council for Research on InternationalEconomic Relations).
Deaton, Angus, and Jean Dreze, 2002, “Poverty and Inequality in India: A Re-Examination,”Economic and Political Weekly (September), pp. 3729–48.
Deaton, A., J. Friedman, and V. Atlas, 2004, “Purchasing Power Exchange Rates fromHousehold Survey Data: India and Indonesia” (unpublished; Princeton, New Jersey: PrincetonUniversity).
De Long, B., 2003, “India Since Independence: An Analytic Growth Narrative,” in In Searchof Prosperity: Analytic Narratives on Economic Growth, ed. by Dani Rodrik (Princeton,New Jersey: Princeton University Press).
Foster, A. D., and M. R. Rosenzweig, 2003, “Agricultural Development, Industrialization andRural Inequality” (unpublished; Cambridge, Massachusetts: Harvard University).
Ghose, A. K., 1999, “Current Issues of Employment Policy in India,” Economic and PoliticalWeekly, Vol. 4 (September), pp. 2592–608.
Hasan, R., 1997, “Productivity Growth and Technological Progress in a Reforming Economy:Evidence from India” (Ph.D. dissertation; College Park, Maryland: University of Maryland).
Hausmann, Ricardo, Lant Pritchett, and Dani Rodrik, 2004, “Growth Accelerations,” NBERWorking Paper No. 10566 (Cambridge, Massachusetts: National Bureau of EconomicResearch).
Huang, Y, and T. Khanna, 2003, “Can India Overtake China?” Foreign Policy (July/August).
Hulten, C., and S. Srinivasan, 1999, “Indian Manufacturing Industry: Elephant or Tiger? NewEvidence on the Asian Miracle,” NBER Working Paper No. 7441 (Cambridge,Massachusetts: National Bureau of Economic Research).
Joshi, V., and I. M. D. Little, 1994, India: Macroeconomics and Political Economy, 1964–1991(Washington: World Bank).
Kohli, A., 1989, “Politics of Economic Liberalization in India,” World Development, Vol. 17,No. 3, pp. 305–28.
Pritchett, L., 1997, “Divergence, Big Time,” Journal of Economic Perspectives, Vol. 11, No. 3,pp. 3–17.
Reserve Bank of India, 2004, Report on Currency and Finance, 2002–03 (New Delhi).
Rodrik, D., 2003, “Growth Strategies,” NBER Working Paper No. 10050 (Cambridge,Massachusetts: National Bureau of Economic Research).
———, A. Subramanian, and F. Trebbi, 2002, “Institutions Rule: The Primacy of Institutionsover Integration and Geography in Development,” NBER Working Paper No. 9305(Cambridge, Massachusetts: National Bureau of Economic Research).
Sachs, J., and W. T. Woo, 1997, “Understanding China’s Economic Performance,” NBER WorkingPaper No. 5935 (Cambridge, Massachusetts: National Bureau of Economic Research).
Srinivasan, T. N., and S. Tendulkar, 2003, Reintegrating India with the World Economy(Washington: Institute for International Economics).
Subramanian, A., and Shang-Jin Wei, 2003, “The WTO Promotes Trade Strongly, but Unevenly,”NBER Working Paper No. 10024 (Cambridge, Massachusetts: National Bureau of EconomicResearch).

Dani Rodrik and Arvind Subramanian
228
Topalova, P., 2004, “Trade Liberalization and Firm Productivity: The Case of India,” IMFWorking Paper 04/28 (Washington: International Monetary Fund).
Unel, B., 2003, “Productivity Trends in India’s Manufacturing Sectors in the Last Two Decades,”IMF Working Paper 03/22 (Washington: International Monetary Fund).
Wallack, Jessica Seddon, 2003, “Structural Breaks in Indian Macroeconomic Data,” Economicand Political Weekly (October) pp. 4312–15.
Williamson, John, and Roberto Zagha, 2002, “From Slow Growth to Slow Reform” (Washington:Institute for International Economics).
World Bank, 1995, India: Recent Economic Developments and Prospects (Washington).