from grain to glass: assessing opportunities for craft …€¦ · · 2015-08-20from grain to...
TRANSCRIPT
From Grain to Glass: Assessing Opportunities for Craft Brewers to Use Locally Grown Agricultural Ingredients
FY 2011
Craft brewing across America is becoming popular. The Brewers Association reports that there are more than 2,500 breweries operating in the United States, with more than 1,500 other breweries in the planning stage. The Massachusetts craft brewery industry has seen rapid growth over the past decade also. As of December 2013, there were 71 establishments in operation throughout the state. Interest in sourcing ingredients locally has grown in recent years. Environmentally and socially conscious craft brewers find that using local ingredients can lower the environmental impact while supporting a stronger socio-economic fabric in the state. Brewers are also noticing the marketing potential of using local ingredients to capitalize on the interest of consumers and farm-to-table style restaurants in the ‘buy local’ cause. Massachusetts growers produce a wide variety of specialty ingredients, and as brewers experiment and differentiate their product, they can explore diverse ingredients such as cranberries, oysters, pumpkins, honey, herbs and spruce tips. This study provided an ‘economic snapshot’ of the Massachusetts craft beer industry to determine the varieties of ingredients being used, as well as the volume and value of ingredients being sourced locally vs. non-locally. This economic snapshot provides information to growers, brewers, and agencies regarding demand for brewing ingredients, average ingredient prices and overall opportunities for sourcing more local ingredients. The information fills a gap in knowledge to describe this opportunity. Best practices for brewers and growers who aspire to take advantage of this market are identified. FINAL REPORT Contact: Bonita Oehlke Massachusetts Department of Agricultural Resources 617-626-1753 [email protected]
1
Grain to Glass Final Report
Grant start/ending dates: September 1, 2011 to December 31, 2013
Introduction Craft brewing across America has grown at an astonishing rate. The Brewers Association reports that there are currently more than 2,500 breweries operating in the United States, with more than 1,500 other breweries in planning. Over the first six months of 2013, craft beer dollar sales were up 15%, with similar growth for the previous three years. Paul Gatza, director of the Brewers Association says ‘Demand for beer produced by small and independent brewers has never been higher, as evidenced by increased production and the hundreds of new breweries joining the playing field each year… beer drinkers nationwide are responding positively to high-quality, full-flavored, diverse offerings from American craft brewing companies that continue to innovate and push the envelope’[1]. Similarly, the Massachusetts craft brewery industry has seen rapid growth over the past decade. Adding more than a dozen breweries in the past year, there are 71 establishments operating as of December 2013. The value of ingredients being used by local breweries represents a sizeable portion of agricultural products imported from other states. While Massachusetts has always had the capacity to provide brewing ingredients, the interest in sourcing ingredients locally has grown in recent years. Craft brewers who are environmentally and socially conscious realize the many benefits to using local ingredients, as local food systems typically have lower environmental impacts and support a stronger socio-economic fabric in the state. Brewers are also noticing the marketing potential of using local ingredients. As awareness in sustainability continues to rise throughout the populace, many consumers and farm-to-table style restaurants are supporting the ‘buy local’ cause
2
through purchasing beers made using locally grown ingredients. Massachusetts has a wide variety of specialty ingredients available for brewers, and as brewers seek to experiment and differentiate their product, they are more likely to explore ingredients, such as cranberries, oysters, pumpkins, honey, herbs and spruce tips. Sourcing local ingredients also appeals to brewers who are seeking sustainable initiatives for both ecological and marketing purposes. Due to the small size of the businesses, using local ingredients helps to display regional pride and therefore reach out to the surrounding customer base. In 2010, the Vermont Agency of Agriculture Food and Markets alongside the MDAR commissioned a hops feasibility study (found here), which researched the viability of commercial hop production in New England. The report found that there is enough demand from the local brewing community to support a minimum of 100 acres of production, equivalent to 150,000 lb. or $1,500,000 of dried hops. This is significant enough to support several small scale (1-10 acre) hop farms [2] The report also investigated the nature of the local craft brewing industry; it found that the local industry is built on product differentiation, innovation, quality and community. These qualities translate into brewers’ desire for freshness and quality, support of local economies, and interest in uniqueness of beer style, all of which lend well to supporting local ingredients. The report also found that the size and scale of Massachusetts craft breweries positions them well for working with small to medium-sized local farms. While this study focused on hop production, these insights can confidently be applied to specialty ingredients as well. Massachusetts’ prices for farmland is among the highest in the United States; in 2013, the average value per acre in Massachusetts was $10,600, compared to $2,900 for the national average [3]. This, alongside the fact that Massachusetts farms are much smaller than the national average, means that growers must have diversified production and customers for economic viability. The average size for a farm in Mass is 68 acres, while the average size for farms in the Midwest and Northwestern US are 537 acres and 1,225 acres respectively [4]. Identifying a new market opportunity and providing best practices for brewers and growers to work together can support the development of this marketing sector. The strong growth in the craft brewing industry, the expanded interest in using local ingredients and the findings from the hops study are all key factors that lead to the conclusion that demand for local ingredients will grow through the next several years. In order to make the most of this opportunity, an ‘economic snapshot’ of the Massachusetts craft beer industry was developed to determine the varieties of
3
ingredients being used, as well as the volume and value of ingredients being sourced locally vs. non-locally. This economic snapshot would provide information to growers, brewers, and agencies regarding demand for brewing ingredients, average ingredient prices and overall opportunities for sourcing more local ingredients. The information provided fills a gap in knowledge to describe this opportunity. Using locally grown ingredients can have varying implications for the brewing process. One of the most pervasive examples is the use of local hops. While most commercial brewing processes use pelletized hops, local hops are preserved in the whole flower form, which is either fresh or dried. Therefore, the processes by which local and non-local hops are used in the brewing process widely differ. Likewise, using locally grown and malted grains poses problems in quality and consistency. Using specialty ingredients also require special attention in the brewing process. These series of challenges, both in traditional and specialty brewing ingredients, may act as a limiting factor in brewers using local ingredients. By examining specific cases of brewers who have successfully implemented procedures for overcoming these challenges, the MDAR can disseminate this information. [1] http://www.brewersassociation.org/pages/media/press-releases/show?title=brewers-association-reports-continued-growth-for-u-s-craft-brewers [2] http://www.uvm.edu/extension/cropsoil/wp-content/uploads/hops-feasibility-study.pdf [3] http://www.nass.usda.gov/Publications/Todays_Reports/reports/land0813.pdf [4] http://usda01.library.cornell.edu/usda/current/FarmLandIn/FarmLandIn-02-19-2013.pdf Description of how issue/problem was approached via the project Survey
Referencing the objectives laid out in the proposal, the work plan follows: 1) A survey was developed by MDAR with input from the staff agricultural
economist Bill Gillmeister whose background includes survey design. MDAR distributed the survey to all the craft brewers in Massachusetts and worked to achieve a 100% return rate. Close to a 50% response rate was achieved. The
4
information will be analyzed and summarized by MDAR and results shared with the Massachusetts Brewers Guild. The types of specialty ingredients required, amounts and estimated value will be included, and a database established.
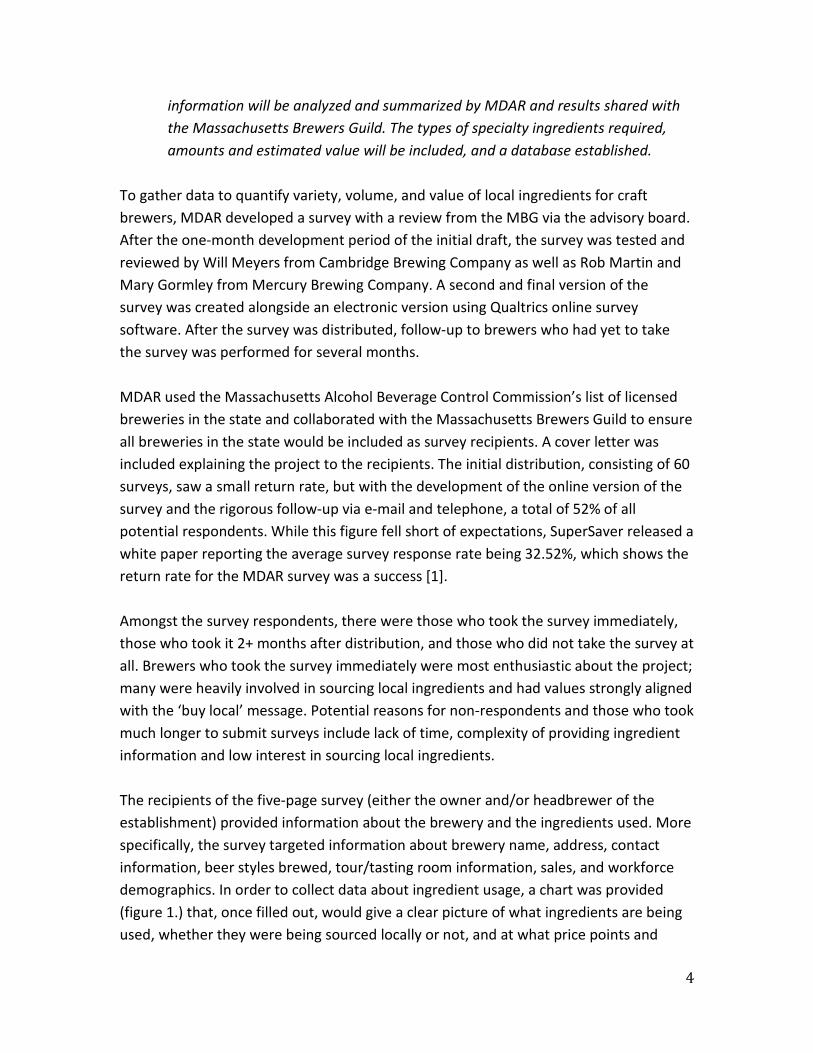
To gather data to quantify variety, volume, and value of local ingredients for craft brewers, MDAR developed a survey with a review from the MBG via the advisory board. After the one-month development period of the initial draft, the survey was tested and reviewed by Will Meyers from Cambridge Brewing Company as well as Rob Martin and Mary Gormley from Mercury Brewing Company. A second and final version of the survey was created alongside an electronic version using Qualtrics online survey software. After the survey was distributed, follow-up to brewers who had yet to take the survey was performed for several months. MDAR used the Massachusetts Alcohol Beverage Control Commission’s list of licensed breweries in the state and collaborated with the Massachusetts Brewers Guild to ensure all breweries in the state would be included as survey recipients. A cover letter was included explaining the project to the recipients. The initial distribution, consisting of 60 surveys, saw a small return rate, but with the development of the online version of the survey and the rigorous follow-up via e-mail and telephone, a total of 52% of all potential respondents. While this figure fell short of expectations, SuperSaver released a white paper reporting the average survey response rate being 32.52%, which shows the return rate for the MDAR survey was a success [1]. Amongst the survey respondents, there were those who took the survey immediately, those who took it 2+ months after distribution, and those who did not take the survey at all. Brewers who took the survey immediately were most enthusiastic about the project; many were heavily involved in sourcing local ingredients and had values strongly aligned with the ‘buy local’ message. Potential reasons for non-respondents and those who took much longer to submit surveys include lack of time, complexity of providing ingredient information and low interest in sourcing local ingredients. The recipients of the five-page survey (either the owner and/or headbrewer of the establishment) provided information about the brewery and the ingredients used. More specifically, the survey targeted information about brewery name, address, contact information, beer styles brewed, tour/tasting room information, sales, and workforce demographics. In order to collect data about ingredient usage, a chart was provided (figure 1.) that, once filled out, would give a clear picture of what ingredients are being used, whether they were being sourced locally or not, and at what price points and
5
volumes they were being sourced at. Information and data from the survey were pulled from paper and online surveys and compiled into a series of spreadsheet in preparation for analysis. Figure 1:
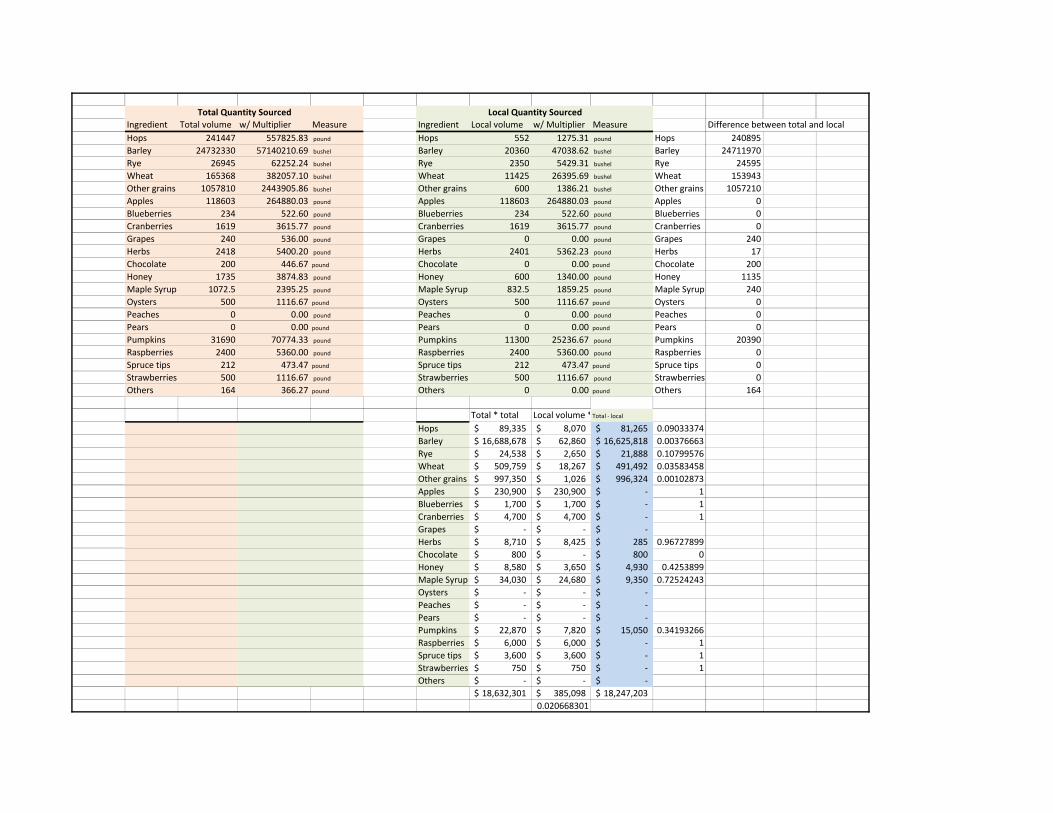
Analysis Account for Unresponsive Brewers After collecting the survey responses and organizing them into spreadsheets, significant data cleanup was conducted to organize the information in more manageable formats. The next step was to account for all the brewers who did not respond to the survey, in order to create a comprehensive ‘snapshot’ of the entire Massachusetts craft beer economy. This was done using a ‘multiplier’; a calculated figure that, when applied to the reported ingredient usage, would come to represent 100% of Massachusetts breweries. To give a basic example of how this might work, if half of all breweries responded, the multiplier would be 2. Since 50% of breweries responded, multiplying each reported ingredient by 2 would account for the unresponsive brewers. However,
6
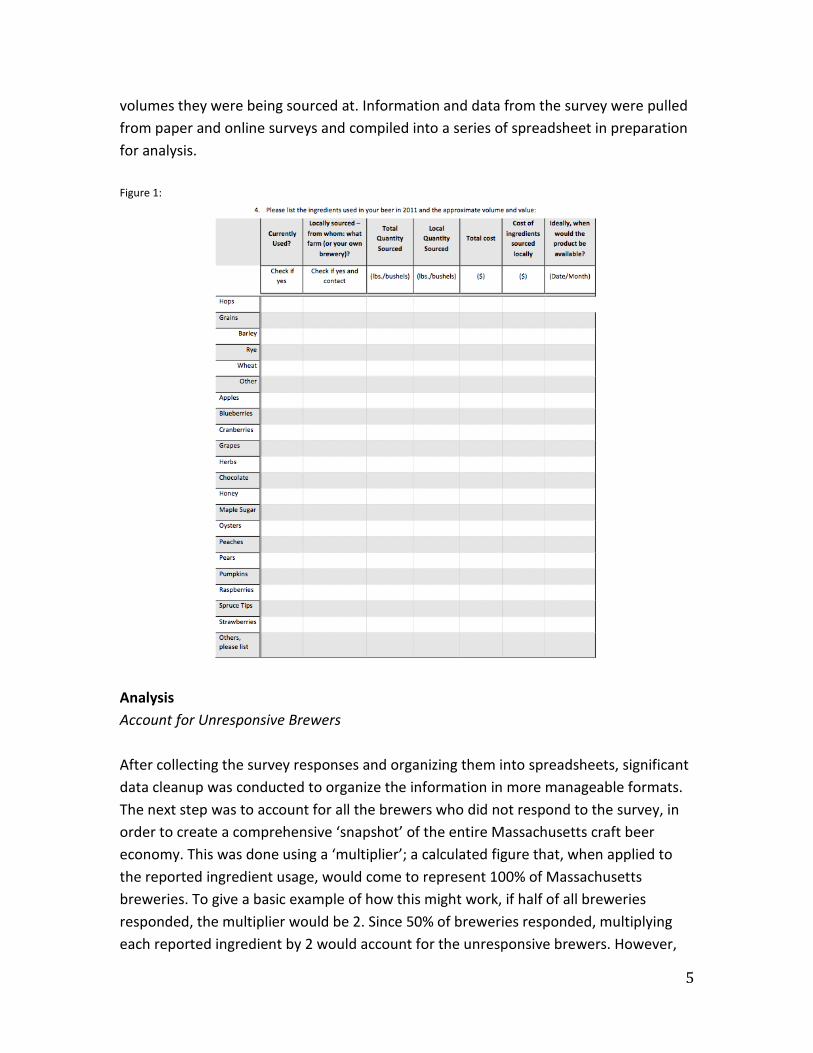
when carrying out the analysis, the calculation of the actual ‘multiplier’ and resulting ingredient totals was much more complicated. Instead of grouping all the breweries together (as the previous example did), the breweries were put into one of four categories, arranged by size, and each category was given a separate multiplier. Using information provided by the Massachusetts Department of Revenue, the list of breweries by size was created, along with their respective size categories. Putting a large microbrewery in a different category than a small microbrewery would make the results more accurate, as the two breweries have different purchasing habits.
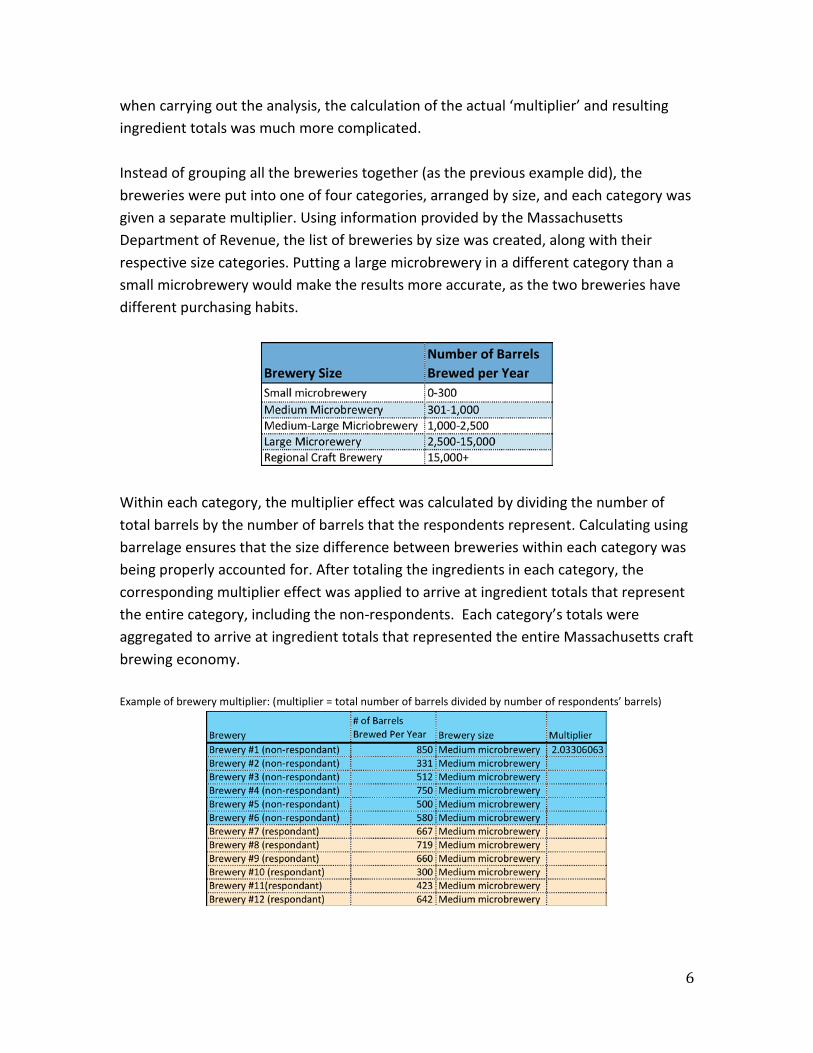
Within each category, the multiplier effect was calculated by dividing the number of total barrels by the number of barrels that the respondents represent. Calculating using barrelage ensures that the size difference between breweries within each category was being properly accounted for. After totaling the ingredients in each category, the corresponding multiplier effect was applied to arrive at ingredient totals that represent the entire category, including the non-respondents. Each category’s totals were aggregated to arrive at ingredient totals that represented the entire Massachusetts craft brewing economy. Example of brewery multiplier: (multiplier = total number of barrels divided by number of respondents’ barrels)
7
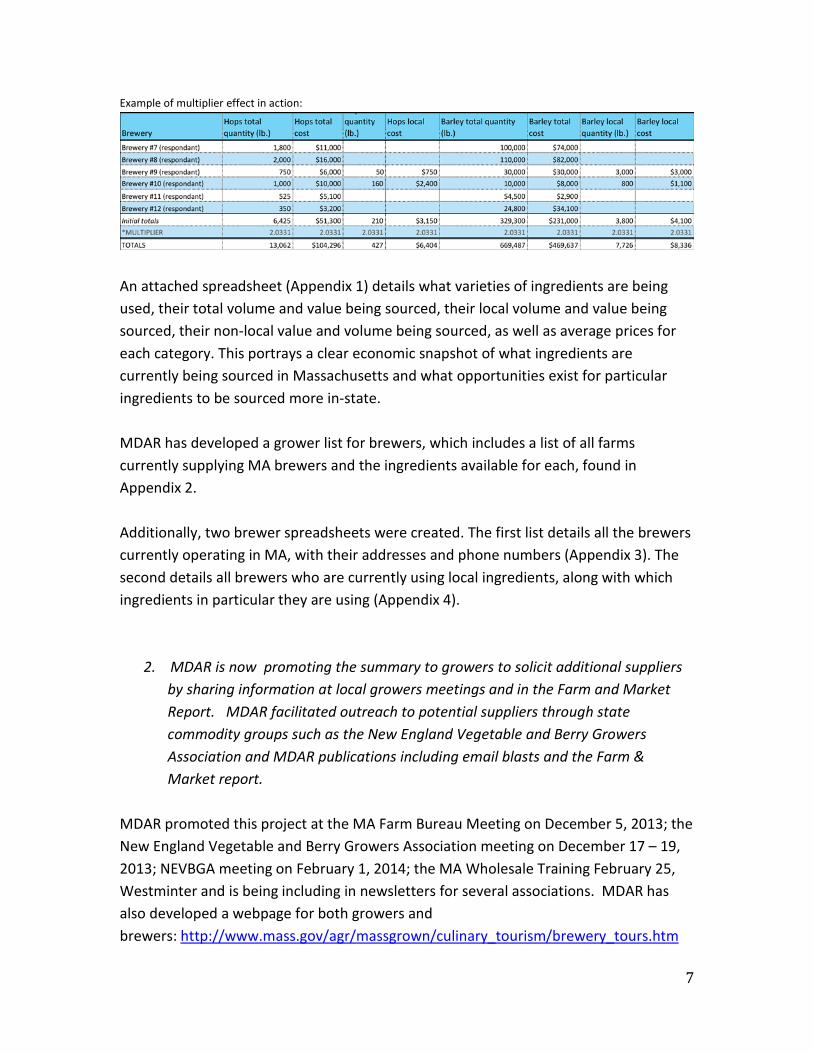
Example of multiplier effect in action:
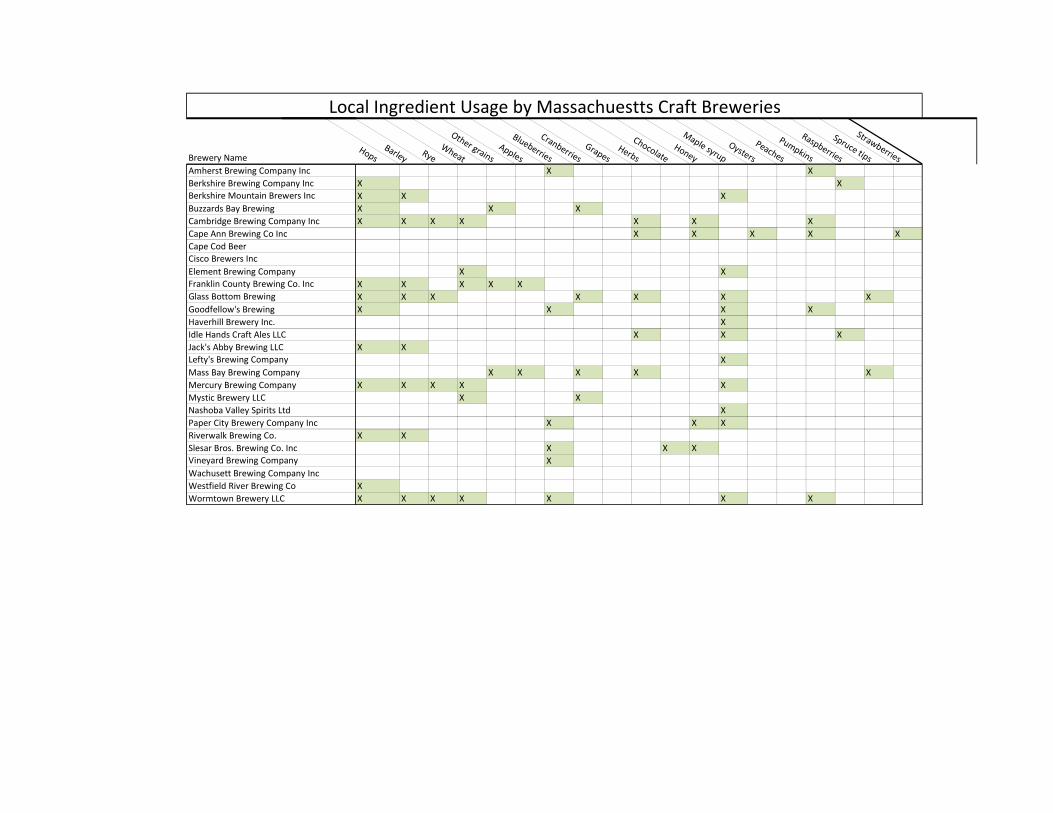
An attached spreadsheet (Appendix 1) details what varieties of ingredients are being used, their total volume and value being sourced, their local volume and value being sourced, their non-local value and volume being sourced, as well as average prices for each category. This portrays a clear economic snapshot of what ingredients are currently being sourced in Massachusetts and what opportunities exist for particular ingredients to be sourced more in-state. MDAR has developed a grower list for brewers, which includes a list of all farms currently supplying MA brewers and the ingredients available for each, found in Appendix 2. Additionally, two brewer spreadsheets were created. The first list details all the brewers currently operating in MA, with their addresses and phone numbers (Appendix 3). The second details all brewers who are currently using local ingredients, along with which ingredients in particular they are using (Appendix 4).
2. MDAR is now promoting the summary to growers to solicit additional suppliers by sharing information at local growers meetings and in the Farm and Market Report. MDAR facilitated outreach to potential suppliers through state commodity groups such as the New England Vegetable and Berry Growers Association and MDAR publications including email blasts and the Farm & Market report.
MDAR promoted this project at the MA Farm Bureau Meeting on December 5, 2013; the New England Vegetable and Berry Growers Association meeting on December 17 – 19, 2013; NEVBGA meeting on February 1, 2014; the MA Wholesale Training February 25, Westminter and is being including in newsletters for several associations. MDAR has also developed a webpage for both growers and brewers: http://www.mass.gov/agr/massgrown/culinary_tourism/brewery_tours.htm
8
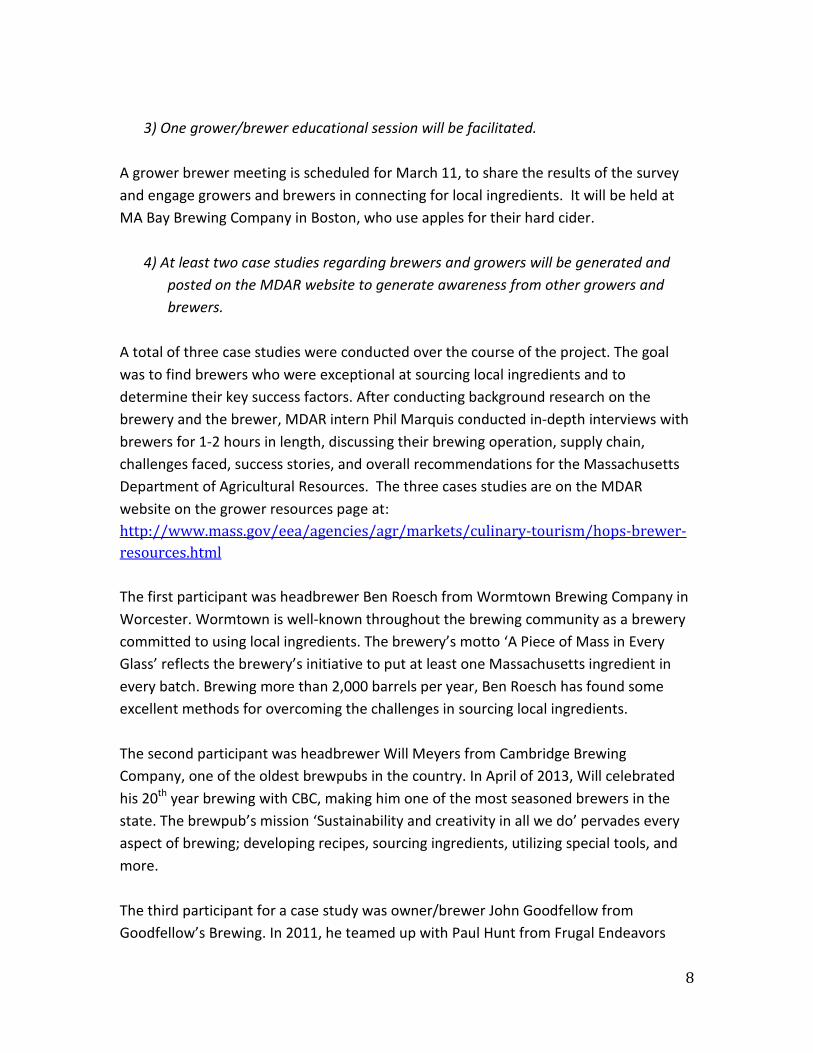
3) One grower/brewer educational session will be facilitated.
A grower brewer meeting is scheduled for March 11, to share the results of the survey and engage growers and brewers in connecting for local ingredients. It will be held at MA Bay Brewing Company in Boston, who use apples for their hard cider.
4) At least two case studies regarding brewers and growers will be generated and posted on the MDAR website to generate awareness from other growers and brewers.
A total of three case studies were conducted over the course of the project. The goal was to find brewers who were exceptional at sourcing local ingredients and to determine their key success factors. After conducting background research on the brewery and the brewer, MDAR intern Phil Marquis conducted in-depth interviews with brewers for 1-2 hours in length, discussing their brewing operation, supply chain, challenges faced, success stories, and overall recommendations for the Massachusetts Department of Agricultural Resources. The three cases studies are on the MDAR website on the grower resources page at: http://www.mass.gov/eea/agencies/agr/markets/culinary-tourism/hops-brewer-resources.html The first participant was headbrewer Ben Roesch from Wormtown Brewing Company in Worcester. Wormtown is well-known throughout the brewing community as a brewery committed to using local ingredients. The brewery’s motto ‘A Piece of Mass in Every Glass’ reflects the brewery’s initiative to put at least one Massachusetts ingredient in every batch. Brewing more than 2,000 barrels per year, Ben Roesch has found some excellent methods for overcoming the challenges in sourcing local ingredients. The second participant was headbrewer Will Meyers from Cambridge Brewing Company, one of the oldest brewpubs in the country. In April of 2013, Will celebrated his 20th year brewing with CBC, making him one of the most seasoned brewers in the state. The brewpub’s mission ‘Sustainability and creativity in all we do’ pervades every aspect of brewing; developing recipes, sourcing ingredients, utilizing special tools, and more. The third participant for a case study was owner/brewer John Goodfellow from Goodfellow’s Brewing. In 2011, he teamed up with Paul Hunt from Frugal Endeavors
9
farm to create an authentic and unique brewer-grower partnership. The brewery itself sits upon a plot of the farm, and all ingredients grown by the farm, including hops, blackberries, and pumpkins get put into the beer. This creates an excellent microcosm of a ‘closed loop’ of money and ingredients that could one day come to represent the Massachusetts craft brewing economy. Each case study provided unique and useful insights, which are detailed in later sections.
5) Information relevant to the project will be posted on the MDAR website as well as made available to the MBG.
A new webpage was developed on the MDAR website http://www.mass.gov/agr/massgrown/culinary_tourism/brewery_tours.htm
6) A follow up evaluation survey will be coordinated, project summarized, and results shared with the agriculture industry through commodity group and MDARs newsletter and website, as well as shared the MBG.
Due to the slow response rate from brewers getting the survey complete and analyzing the results, it was not possible to conduct an evaluation during the timeframe of this project. [1] http://www.supersurvey.com/papers/supersurvey_white_paper_response_rates.pdf Description of contribution of public or private agency partners in terms of the work performed MDAR staff member, Lisa Damon, Program Coordinator, worked as the liaison to FSMIP for this project. MDAR staff member, Bonita Oehlke was the Marketing Specialist, MDAR Project Coordinator, and liaison to MBG. MDAR staff member Catherine DeRonde, analysis based on her economics background. MDAR intern Phil Marquis provided project assistance including collection of survey response, tabulation, case studies, evaluation and the draft development of final report and web pages. Simmons Dietetic Intern Annette Jochum assisted in the final report write-up. Sarah Ryan, MDAR staff assisted with case study edits prior to posting on the MDAR website. MDAR worked with the Massachusetts Brewers Guild (MBG) as an advisory group member. MBG is a 501(c)(6) non-profit corporation, organized for the purposes of promoting craft brewing and protecting the interests of craft brewers in Massachusetts. Membership is open to
10
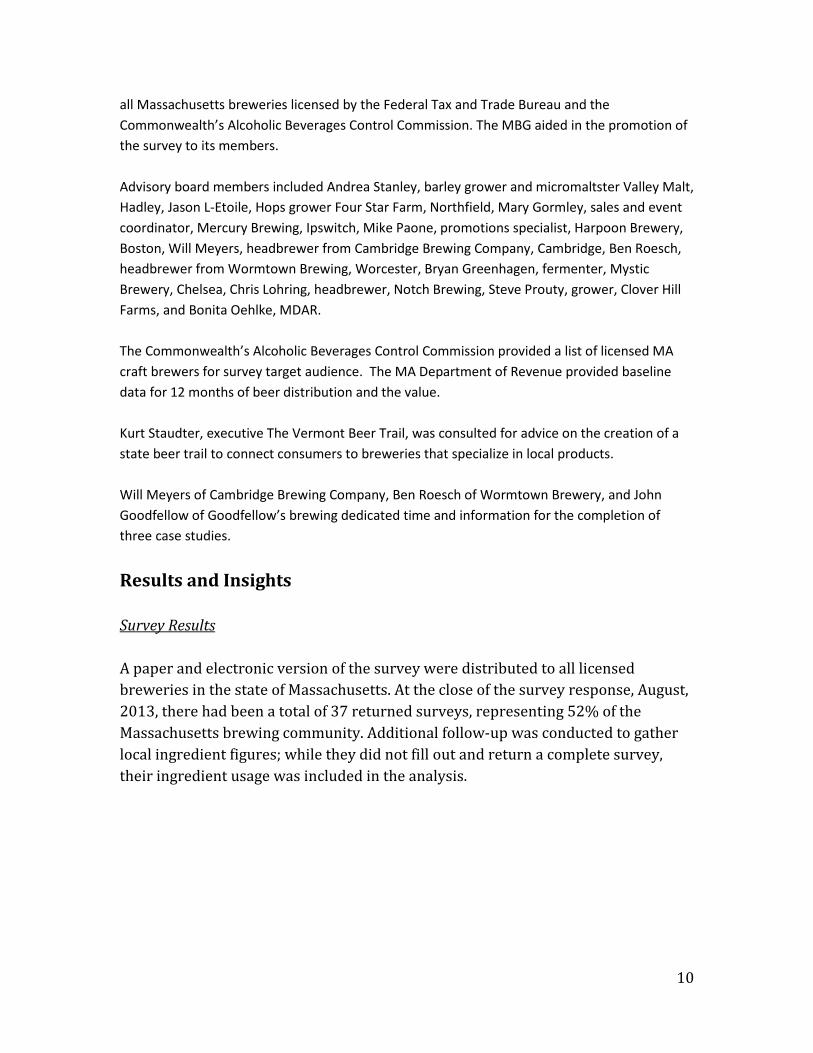
all Massachusetts breweries licensed by the Federal Tax and Trade Bureau and the Commonwealth’s Alcoholic Beverages Control Commission. The MBG aided in the promotion of the survey to its members. Advisory board members included Andrea Stanley, barley grower and micromaltster Valley Malt, Hadley, Jason L-Etoile, Hops grower Four Star Farm, Northfield, Mary Gormley, sales and event coordinator, Mercury Brewing, Ipswitch, Mike Paone, promotions specialist, Harpoon Brewery, Boston, Will Meyers, headbrewer from Cambridge Brewing Company, Cambridge, Ben Roesch, headbrewer from Wormtown Brewing, Worcester, Bryan Greenhagen, fermenter, Mystic Brewery, Chelsea, Chris Lohring, headbrewer, Notch Brewing, Steve Prouty, grower, Clover Hill Farms, and Bonita Oehlke, MDAR. The Commonwealth’s Alcoholic Beverages Control Commission provided a list of licensed MA craft brewers for survey target audience. The MA Department of Revenue provided baseline data for 12 months of beer distribution and the value. Kurt Staudter, executive The Vermont Beer Trail, was consulted for advice on the creation of a state beer trail to connect consumers to breweries that specialize in local products. Will Meyers of Cambridge Brewing Company, Ben Roesch of Wormtown Brewery, and John Goodfellow of Goodfellow’s brewing dedicated time and information for the completion of three case studies. Results and Insights Survey Results A paper and electronic version of the survey were distributed to all licensed breweries in the state of Massachusetts. At the close of the survey response, August, 2013, there had been a total of 37 returned surveys, representing 52% of the Massachusetts brewing community. Additional follow-up was conducted to gather local ingredient figures; while they did not fill out and return a complete survey, their ingredient usage was included in the analysis.
11
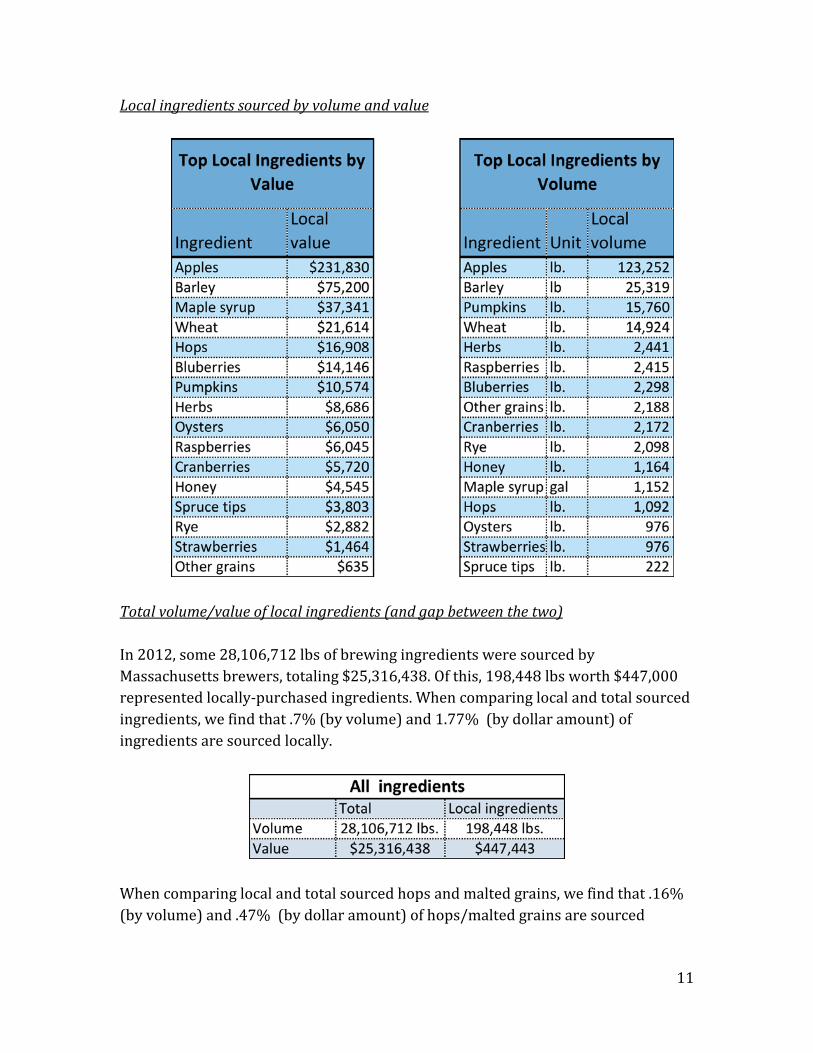
Local ingredients sourced by volume and value
Total volume/value of local ingredients (and gap between the two) In 2012, some 28,106,712 lbs of brewing ingredients were sourced by Massachusetts brewers, totaling $25,316,438. Of this, 198,448 lbs worth $447,000 represented locally-purchased ingredients. When comparing local and total sourced ingredients, we find that .7% (by volume) and 1.77% (by dollar amount) of ingredients are sourced locally.
When comparing local and total sourced hops and malted grains, we find that .16% (by volume) and .47% (by dollar amount) of hops/malted grains are sourced
12
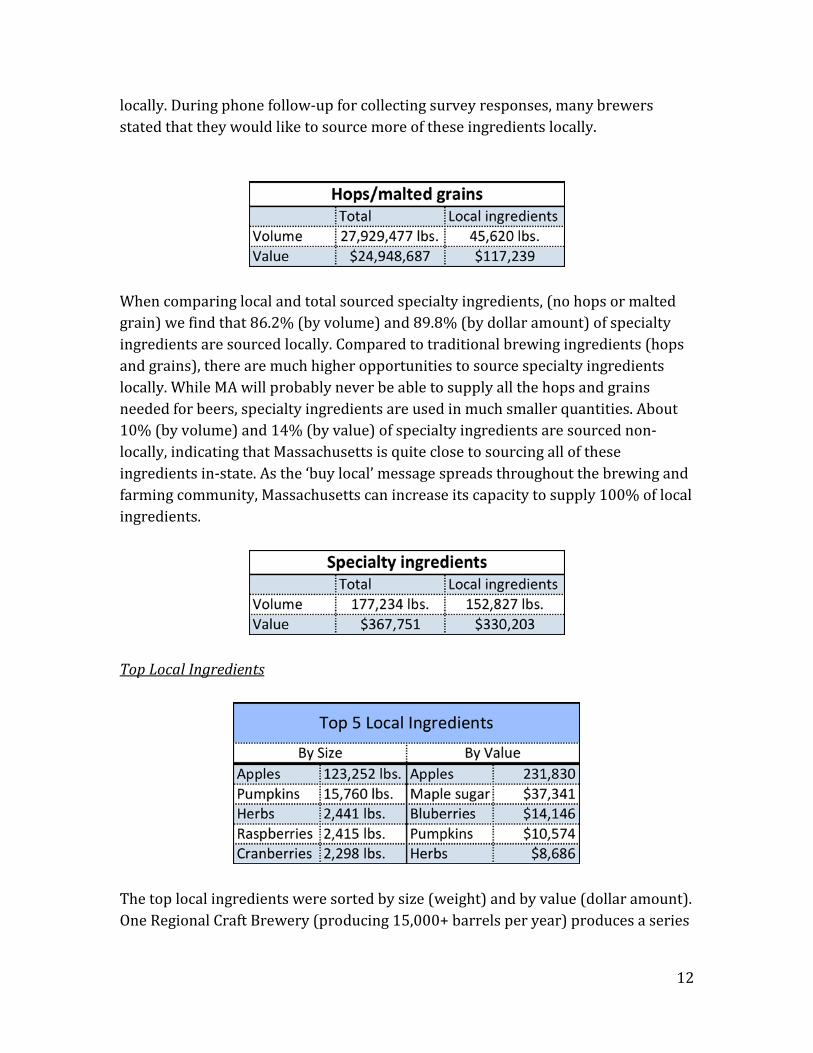
locally. During phone follow-up for collecting survey responses, many brewers stated that they would like to source more of these ingredients locally.
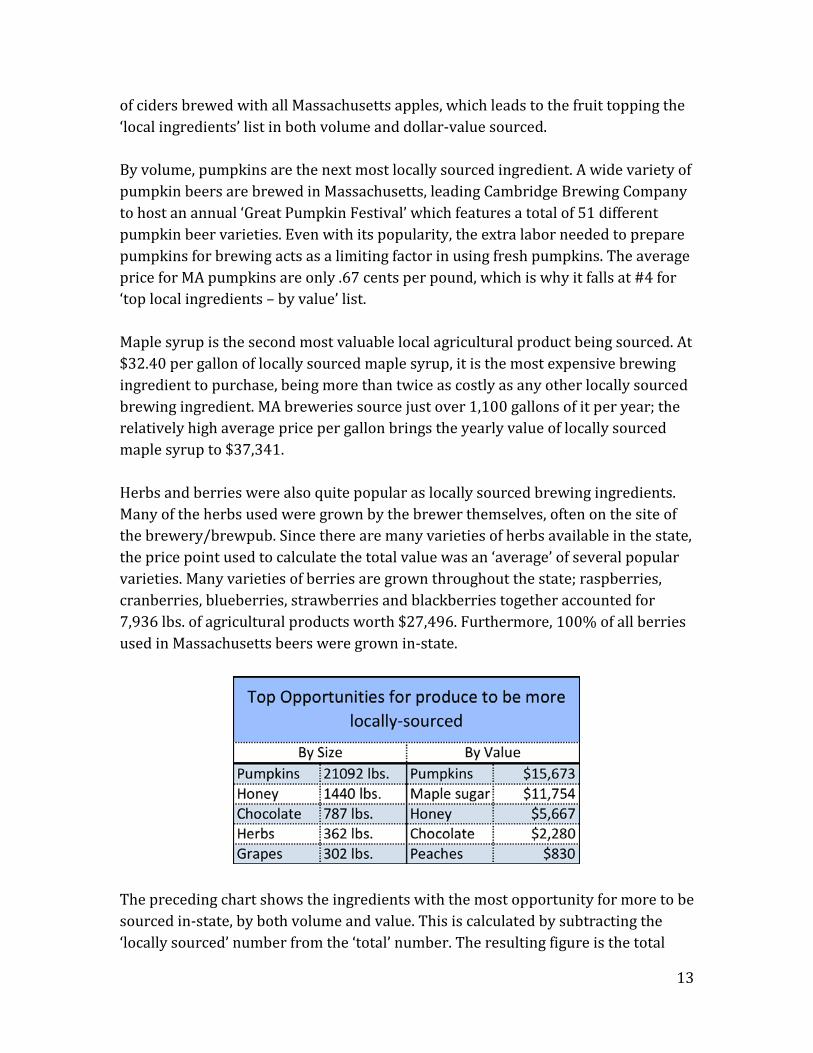
When comparing local and total sourced specialty ingredients, (no hops or malted grain) we find that 86.2% (by volume) and 89.8% (by dollar amount) of specialty ingredients are sourced locally. Compared to traditional brewing ingredients (hops and grains), there are much higher opportunities to source specialty ingredients locally. While MA will probably never be able to supply all the hops and grains needed for beers, specialty ingredients are used in much smaller quantities. About 10% (by volume) and 14% (by value) of specialty ingredients are sourced non-locally, indicating that Massachusetts is quite close to sourcing all of these ingredients in-state. As the ‘buy local’ message spreads throughout the brewing and farming community, Massachusetts can increase its capacity to supply 100% of local ingredients.
Top Local Ingredients
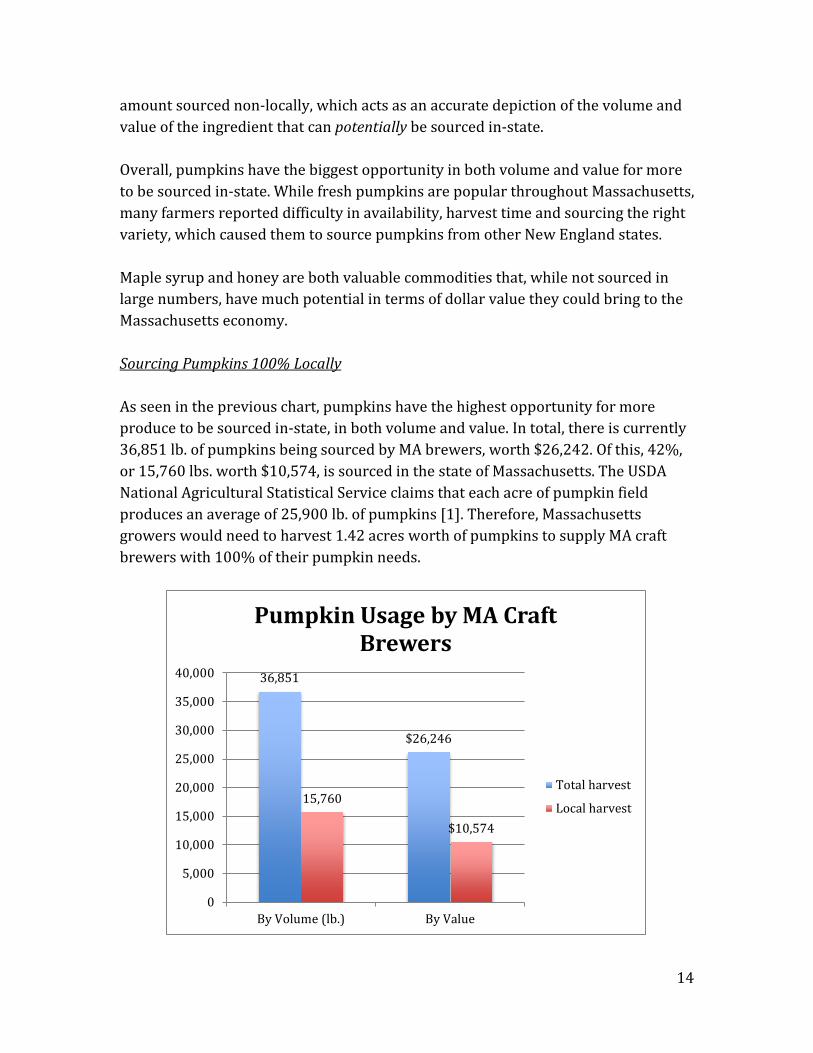
The top local ingredients were sorted by size (weight) and by value (dollar amount). One Regional Craft Brewery (producing 15,000+ barrels per year) produces a series
13
of ciders brewed with all Massachusetts apples, which leads to the fruit topping the ‘local ingredients’ list in both volume and dollar-value sourced. By volume, pumpkins are the next most locally sourced ingredient. A wide variety of pumpkin beers are brewed in Massachusetts, leading Cambridge Brewing Company to host an annual ‘Great Pumpkin Festival’ which features a total of 51 different pumpkin beer varieties. Even with its popularity, the extra labor needed to prepare pumpkins for brewing acts as a limiting factor in using fresh pumpkins. The average price for MA pumpkins are only .67 cents per pound, which is why it falls at #4 for ‘top local ingredients – by value’ list. Maple syrup is the second most valuable local agricultural product being sourced. At $32.40 per gallon of locally sourced maple syrup, it is the most expensive brewing ingredient to purchase, being more than twice as costly as any other locally sourced brewing ingredient. MA breweries source just over 1,100 gallons of it per year; the relatively high average price per gallon brings the yearly value of locally sourced maple syrup to $37,341. Herbs and berries were also quite popular as locally sourced brewing ingredients. Many of the herbs used were grown by the brewer themselves, often on the site of the brewery/brewpub. Since there are many varieties of herbs available in the state, the price point used to calculate the total value was an ‘average’ of several popular varieties. Many varieties of berries are grown throughout the state; raspberries, cranberries, blueberries, strawberries and blackberries together accounted for 7,936 lbs. of agricultural products worth $27,496. Furthermore, 100% of all berries used in Massachusetts beers were grown in-state.
The preceding chart shows the ingredients with the most opportunity for more to be sourced in-state, by both volume and value. This is calculated by subtracting the ‘locally sourced’ number from the ‘total’ number. The resulting figure is the total
14
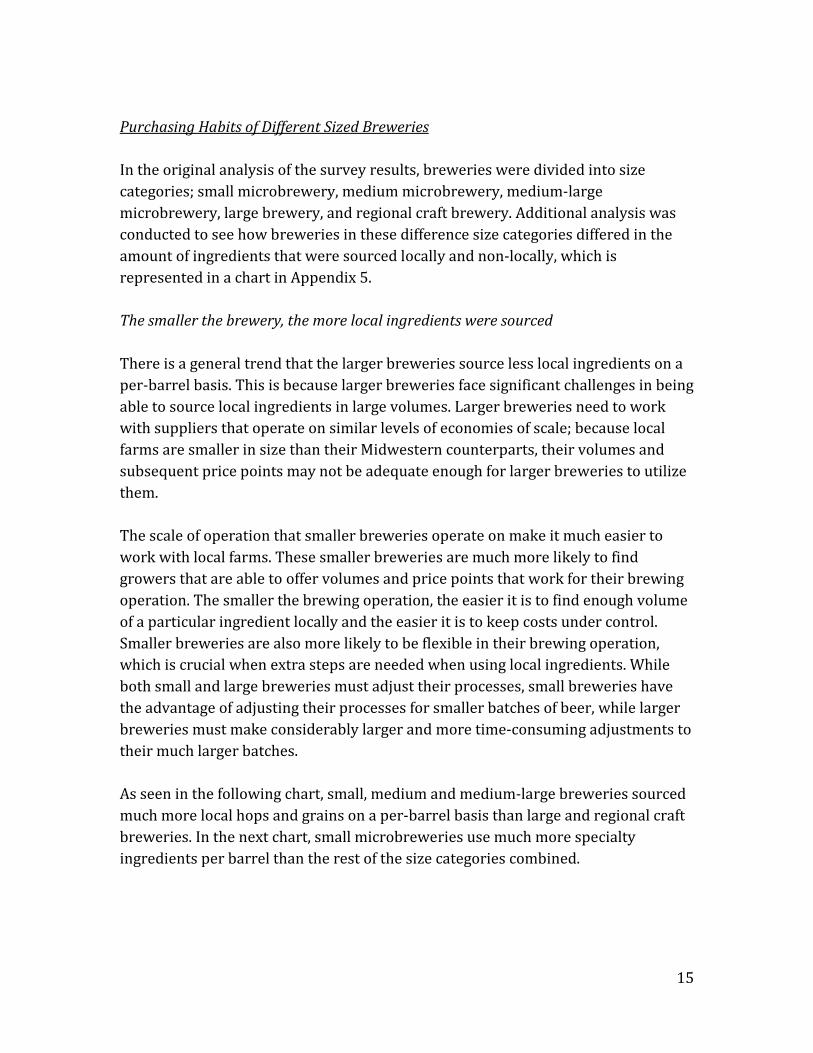
amount sourced non-locally, which acts as an accurate depiction of the volume and value of the ingredient that can potentially be sourced in-state. Overall, pumpkins have the biggest opportunity in both volume and value for more to be sourced in-state. While fresh pumpkins are popular throughout Massachusetts, many farmers reported difficulty in availability, harvest time and sourcing the right variety, which caused them to source pumpkins from other New England states. Maple syrup and honey are both valuable commodities that, while not sourced in large numbers, have much potential in terms of dollar value they could bring to the Massachusetts economy. Sourcing Pumpkins 100% Locally As seen in the previous chart, pumpkins have the highest opportunity for more produce to be sourced in-state, in both volume and value. In total, there is currently 36,851 lb. of pumpkins being sourced by MA brewers, worth $26,242. Of this, 42%, or 15,760 lbs. worth $10,574, is sourced in the state of Massachusetts. The USDA National Agricultural Statistical Service claims that each acre of pumpkin field produces an average of 25,900 lb. of pumpkins [1]. Therefore, Massachusetts growers would need to harvest 1.42 acres worth of pumpkins to supply MA craft brewers with 100% of their pumpkin needs.
36,851
$26,246
15,760
$10,574
0
5,000
10,000
15,000
20,000
25,000
30,000
35,000
40,000
By Volume (lb.) By Value
Pumpkin Usage by MA Craft Brewers
Total harvest
Local harvest
15
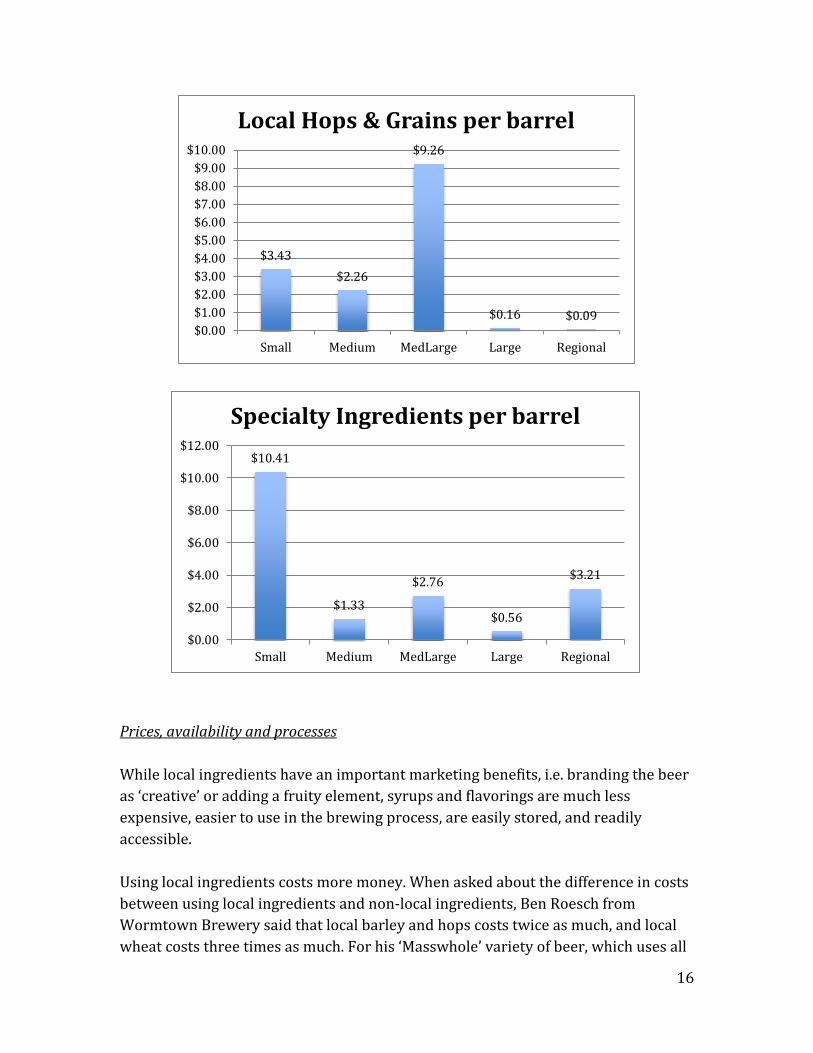
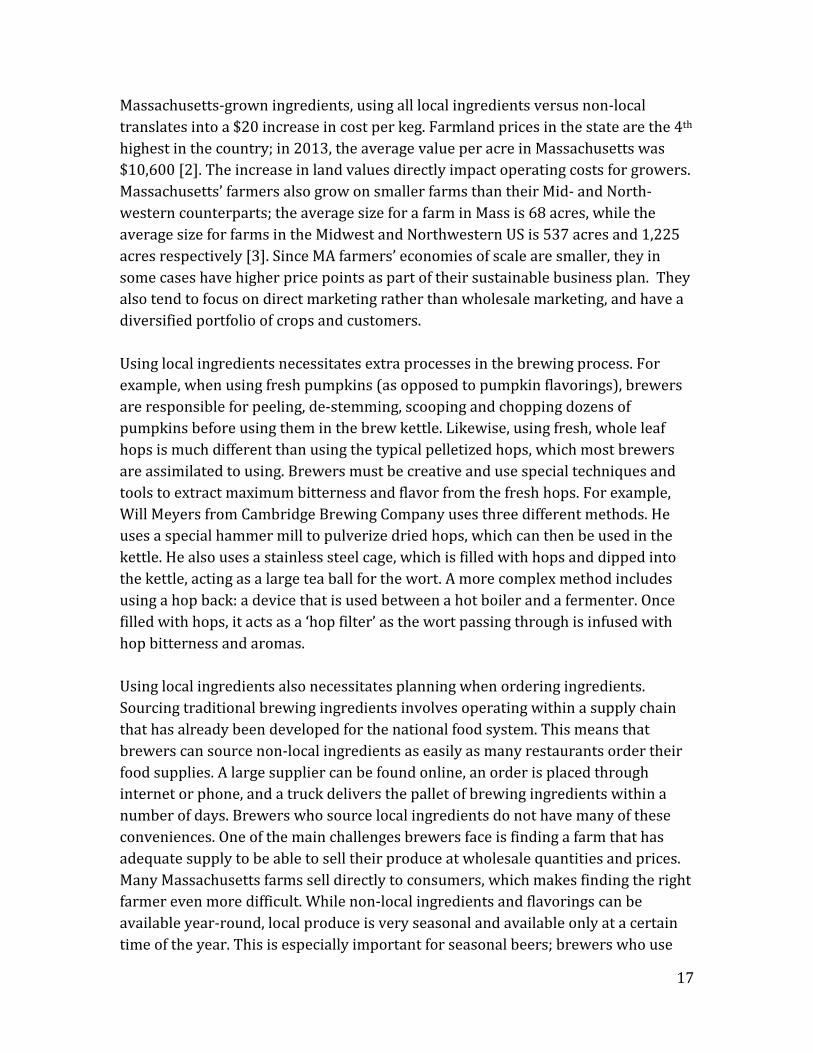
Purchasing Habits of Different Sized Breweries In the original analysis of the survey results, breweries were divided into size categories; small microbrewery, medium microbrewery, medium-large microbrewery, large brewery, and regional craft brewery. Additional analysis was conducted to see how breweries in these difference size categories differed in the amount of ingredients that were sourced locally and non-locally, which is represented in a chart in Appendix 5. The smaller the brewery, the more local ingredients were sourced There is a general trend that the larger breweries source less local ingredients on a per-barrel basis. This is because larger breweries face significant challenges in being able to source local ingredients in large volumes. Larger breweries need to work with suppliers that operate on similar levels of economies of scale; because local farms are smaller in size than their Midwestern counterparts, their volumes and subsequent price points may not be adequate enough for larger breweries to utilize them. The scale of operation that smaller breweries operate on make it much easier to work with local farms. These smaller breweries are much more likely to find growers that are able to offer volumes and price points that work for their brewing operation. The smaller the brewing operation, the easier it is to find enough volume of a particular ingredient locally and the easier it is to keep costs under control. Smaller breweries are also more likely to be flexible in their brewing operation, which is crucial when extra steps are needed when using local ingredients. While both small and large breweries must adjust their processes, small breweries have the advantage of adjusting their processes for smaller batches of beer, while larger breweries must make considerably larger and more time-consuming adjustments to their much larger batches. As seen in the following chart, small, medium and medium-large breweries sourced much more local hops and grains on a per-barrel basis than large and regional craft breweries. In the next chart, small microbreweries use much more specialty ingredients per barrel than the rest of the size categories combined.
16
Prices, availability and processes While local ingredients have an important marketing benefits, i.e. branding the beer as ‘creative’ or adding a fruity element, syrups and flavorings are much less expensive, easier to use in the brewing process, are easily stored, and readily accessible. Using local ingredients costs more money. When asked about the difference in costs between using local ingredients and non-local ingredients, Ben Roesch from Wormtown Brewery said that local barley and hops costs twice as much, and local wheat costs three times as much. For his ‘Masswhole’ variety of beer, which uses all
$3.43 $2.26
$9.26
$0.16 $0.09 $0.00$1.00$2.00$3.00$4.00$5.00$6.00$7.00$8.00$9.00
$10.00
Small Medium MedLarge Large Regional
Local Hops & Grains per barrel
$10.41
$1.33
$2.76
$0.56
$3.21
$0.00
$2.00
$4.00
$6.00
$8.00
$10.00
$12.00
Small Medium MedLarge Large Regional
Specialty Ingredients per barrel
17
Massachusetts-grown ingredients, using all local ingredients versus non-local translates into a $20 increase in cost per keg. Farmland prices in the state are the 4th highest in the country; in 2013, the average value per acre in Massachusetts was $10,600 [2]. The increase in land values directly impact operating costs for growers. Massachusetts’ farmers also grow on smaller farms than their Mid- and North-western counterparts; the average size for a farm in Mass is 68 acres, while the average size for farms in the Midwest and Northwestern US is 537 acres and 1,225 acres respectively [3]. Since MA farmers’ economies of scale are smaller, they in some cases have higher price points as part of their sustainable business plan. They also tend to focus on direct marketing rather than wholesale marketing, and have a diversified portfolio of crops and customers. Using local ingredients necessitates extra processes in the brewing process. For example, when using fresh pumpkins (as opposed to pumpkin flavorings), brewers are responsible for peeling, de-stemming, scooping and chopping dozens of pumpkins before using them in the brew kettle. Likewise, using fresh, whole leaf hops is much different than using the typical pelletized hops, which most brewers are assimilated to using. Brewers must be creative and use special techniques and tools to extract maximum bitterness and flavor from the fresh hops. For example, Will Meyers from Cambridge Brewing Company uses three different methods. He uses a special hammer mill to pulverize dried hops, which can then be used in the kettle. He also uses a stainless steel cage, which is filled with hops and dipped into the kettle, acting as a large tea ball for the wort. A more complex method includes using a hop back: a device that is used between a hot boiler and a fermenter. Once filled with hops, it acts as a ‘hop filter’ as the wort passing through is infused with hop bitterness and aromas. Using local ingredients also necessitates planning when ordering ingredients. Sourcing traditional brewing ingredients involves operating within a supply chain that has already been developed for the national food system. This means that brewers can source non-local ingredients as easily as many restaurants order their food supplies. A large supplier can be found online, an order is placed through internet or phone, and a truck delivers the pallet of brewing ingredients within a number of days. Brewers who source local ingredients do not have many of these conveniences. One of the main challenges brewers face is finding a farm that has adequate supply to be able to sell their produce at wholesale quantities and prices. Many Massachusetts farms sell directly to consumers, which makes finding the right farmer even more difficult. While non-local ingredients and flavorings can be available year-round, local produce is very seasonal and available only at a certain time of the year. This is especially important for seasonal beers; brewers who use
18
syrups and flavorings have the advantage of being first to market, while brewers who are dedicated to using local ingredients must heed to Mother Nature’s timing. For example, Will Meyers from Cambridge Brewing Company insists on his pumpkin beers being seasonally appropriate. While his beers made with local pumpkins are kegged in mid-September, beers made with pumpkin flavorings are able to make it to market by early to mid-summer in preparation for the early demand of the fall-style beers. With seasonality and availability being a concern, brewers who were most successful at sourcing local ingredients maintained contact with the farmer several months before harvesting to check on timing and ‘reserve’ a portion of the crop ahead of time. Despite the numerous challenges faced when sourcing local ingredients, there remains a committed group of Massachusetts breweries who are doing all they can to source ingredients from the local food system. Their dedication to the local economy shows through their willingness to pay more for local ingredients, put extra work into the brewing process, and plan ahead. Furthermore, while this may not be a huge opportunity, it is important for the right grower to add new channels of revenue to their existing base. Local farms could add customers through the consideration of increasing the production of some crops such as pumpkins, or deciding to sell their produce wholesale. Likewise, the local craft beer economy depends on growers who continue to support the infrastructure for hops and specialty malted grains in Massachusetts as well as overall connections with brewers. Best Practices for Brewers Use the tools provided in this report For brewers who are finding difficulty sourcing local ingredients, this report contains a few essential tools that brewers can use to further their local sourcing initiatives. The most crucial of these tools is the list of local farmers that are currently supplying Massachusetts farms, found in Appendix 2. The list of growers and ingredients is an excellent reference for brewers who are having difficulty with availability/finding a source. Another tool that brewers can use is the list of brewers using local ingredients, found in Appendix 4. This list can be used as a reference for brewers who are looking to network within their line of expertise and can assist with finding a grower, processing challenges, and other difficulties unique to brewers using local ingredients. Brewers can also use the ingredient spreadsheet, found in Appendix 1, to find which local ingredients are being used most frequently
19
as well as their respective price points. This fills a crucial gap in information that can settle any uncertainties brewers have about using particular local ingredients. Keep in contact with growers Brewers who are most successful at sourcing local ingredients plan well in advanced. They check in early and often with growers, in order to be knowledgeable of harvest dates, as well as to ‘reserve’ a portion of the harvest to avoid issues in availability. For example, Will Meyers from Cambridge Brewing Company was in contact with local pumpkin growers in March and April, well ahead of the August/September harvest dates. This enabled Will to plan his brew schedule far in advance and ensure that he would have enough pumpkins to process and brew when the time came. Be willing to experiment Using local ingredients may necessitate extra processes. Brewers who are most successful at sourcing local ingredients are willing to step outside the traditional bounds of brewing. This may include harvesting the ingredient yourself, using an ingredient that is rarely used in brewing, or including extra processes in the brewing. Supplement local ingredients with non-local While Massachusetts clearly does not have the capacity to supply 100% of ingredients needed in Massachusetts breweries, establishments with strong local sourcing initiatives have not let this act as an impediment. When having difficulty with sourcing enough local volume (and in particular hops and grains), many brewers see this as an opportunity to blend local and non-local ingredients to create a ‘hybrid’ flavor profile that includes at least a portion of Mass-grown ingredients. Utilize a pilot batch system Using local ingredients presents the unique challenge of determining the flavor impact on the brew. Sourcing from small, local farms means ingredients may have unique characteristics, which are determined by growing conditions and ‘terroir’. This makes many brewers reluctant to use local ingredients, however a pilot batch system acts as a ‘tester’ to eliminate the uncertainty. For example, John Goodfellow from Goodfellow’s Brewing uses a custom made 1-barrel pilot batch system. This was used to test the strength and effect locally-grown blackberries would have on a
20
much larger batch of beer. After determining the right quantities, he scaled his recipe for his 30-barrel system. Best Practices for Growers Use the tools provided in this report For growers who are looking to supply local brewers, this report contains informative tools that can be used for research and business decision making in the Massachusetts craft beer economy. Growers should be mindful of nearby brewers; a list of Massachusetts brewers with their addresses (Appendix 3) can help growers find brewers which are closest to them or operate in the region. Additionally, a separate list details exactly which brewers are using exactly which local ingredients, can help growers identify potential customers (Appendix 4). The ingredient spreadsheet, found in Appendix 1, informs growers which local ingredients are most popular with brewers, what market opportunities are yet to be filled, and what the average price points for each ingredient are. Work with brewers to customize solutions Growers who can bring ingredients further along in the supply chain, either through processing or transporting, make it much easier for brewers to source local ingredients. Ben Roesch from Wormtown Brewing Company in Worcester worked with a farmer to combine manual and machine labor to process pumpkins at a manageable cost. The grower also delivers regionally to school districts, allowing him to deliver the processed pumpkins directly to Wormtown Brewery. The processing and delivery of ingredients makes sourcing local ingredients much easier and less costly for brewers. Adjust volume and price point for farm-to-brewery business model 89% of specialty ingredients used by Massachusetts brewers can be sourced in Massachusetts. Many growers that produce specialty ingredients sell directly to consumers with small packaging sizes and high per-unit prices. Brewers, on the other hand, need large volumes that reduce their per-unit prices in order to financially afford using local ingredients. Growers who are looking to supply breweries need to consider wholesale pricing.
21
Insights from Case Studies Wormtown Brewing Company Ben Roesch, headbrewer of Wormtown Brewing Company, has found success is overcoming many of the challenges in sourcing local ingredients. Through fostering relationships with growers, he is able to bring ingredients further along in the preparation process. For example, his blueberry grower packages and freezes blueberries in 6 lb bags, which caters to the exact weight Ben needs for brewing. The freezing not only protects the freshness, but breaks down the cell wall so the blueberries can be used whole without crushing or maceration. Additionally, Ben has found a pumpkin grower who owns a large food processor that has the capacity to process pumpkins very quickly in large quantities. Since the grower delivers to Western MA school districts, Ben often has his pumpkins delivered for free. Ben has also found that his beers, which include at least one locally-grown ingredient, are popular with farm-to-table restaurants, which are looking to supplement their local menus with local beers made with local ingredients. Cambridge Brewing Company Will Meyers, headbrewer of Cambridge Brewing Company is one of the state’s most seasoned commercial brewers with over 20 years of experience. Throughout his tenure at CBC, he has found a myriad of solutions to working with local ingredients. Where quality and consistency are issues, particularly in using local grains, Will carefully blends local grains with non-local grains to keep his brews within a certain beer style. In order to ensure availability when using specialty ingredients, such as pumpkins, berries, or even heather flowers, Will stays in contact early and often with his growers to check on harvest dates and ‘reserve’ a portion of the crop far in advance. Since local hops come in a fresh, whole flower form (as opposed to pelletized), Will has experimented with creative and unique methods of incorporating them in his beers. After drying the hop flowers, he uses a hammer mill to crush the hops into a powder, which is then used in the kettle. He has also used a large stainless steel cage, which is filled with hops and dipped into the kettle, acting as a large tea ball. Finally, Will has used a hop back, which is a closed extraction system where wort gets pumped through a ‘hop filter’.
22
[1] http://quickstats.nass.usda.gov/results/5C4F5BCE-F792-3DA1-B564-87953BA82CE0?pivot=short_desc [2] http://www.nass.usda.gov/Publications/Todays_Reports/reports/land0813.pdf [3] http://usda01.library.cornell.edu/usda/current/FarmLandIn/FarmLandIn-02-19-2013.pdf Current/future benefits derived from the project Brewer/grower materials This project has created a variety of tools and materials that will inform brewers and growers about the supply and demand of Massachusetts grown ingredients, as well as facilitate relations between the two. These materials include a list of growers supplying local ingredients, a list of brewers using local ingredients as well as a list of agricultural products detailing their average price points and the total volume sourced in state/out of state. List of growers A list of growers was developed through gathering survey responses (Appendix 2). The list serves as a contact sheet of growers supplying brewing ingredients to brewers in Massachusetts. The list is widely recommended amongst the brewing community; all three case study participants recommended a list of growers be created to help brewers source more local ingredients. When asked ‘What challenges do you face when sourcing local ingredients?’, 65% of respondents said sourcing (finding a farm), and 78% of respondents said volume/availability. Furthermore, one of the lengthiest tasks in sourcing local ingredients is finding a grower. Two of the case study participants described the process of calling several farms across the state as lengthy, tiresome and at times, discouraging. The list of growers is an important tool that can help brewers overcome both of these challenges. Once brewers responded ‘yes’ to using a particular local ingredient, they were asked which farm the produce was from. 64% of responses that said ‘yes’ to using a particular local ingredient included information about the grower they were using; brewers who didn’t provide the name of the farm may have done so to protect the identity of their sources for quality or availability purposes.
23
List of brewers A list of brewers using local ingredients was collected through gathering survey responses. A spreadsheet was developed (Appendix 1) that details which brewers are using which local ingredients. This list is very helpful for growers, who will then know who to reach out for if they have particular ingredients in supply or are interested in developing a brewer-grower connection. A list of brewers would similarly benefit the brewing community. The list serves as a reference sheet for developing a ‘local brewing network’ in Massachusetts, through which brewers can share grower contacts, share brewing methods and collaborate on brews. Agricultural products A comprehensive list of agricultural products currently being used by Massachusetts craft brewers was developed, found in Appendix 1. The list details all ingredients, (including hops, grains and specialty ingredients) the volumes sourced locally and non-locally, and the value of locally and non-locally sourced ingredients. This tool is beneficial to both growers and brewers. Growers have the ability to see which agricultural products are highest in demand amongst MA brewers, which ingredients have the highest potential to be sourced in state, as well as the average price points for each ingredient. This list provides growers with the information necessary to make key business decisions regarding their ability to supply the MA craft brewing industry. Brewers can use this list to see what brewing ingredients are available in Massachusetts, as well as what price they can expect to pay for said ingredients. Similar to growers, this information helps brewers determine the feasibility of working with local ingredients. 70% of survey respondents claimed that cost was one of their biggest concerns when sourcing local ingredients. This list of ingredients can help manage brewers’ cost expectations and hopefully alleviate some of the price concerns of working with local ingredients. Building awareness in the growing and brewing community This project has and will continue to build awareness about Massachusetts farms connecting with Massachusetts brewers. Through project outreach, many more farmers and growers are knowledgeable about the ‘buy local’ activity happening in the state, which develops their interest in using local ingredients that may lead brewers to conduct a ‘feasibility study’ of using local ingredients in their operation.
24
With dozens of brewers going through this process and joining the local sourcing trend, local farmers are sure to see more brewers as customers. Increase in local grown and used crops, leading to supply chain creation and lower prices As more brewers engage in sourcing ingredients locally boosting demand, growers have another option for the sale of their products and if profitable, can increase production. Additionally, as recommended in ‘Best Practices for Growers’, some farmers may start portioning their offerings in a form that brewers need; in larger quantities and lower per-unit costs. Also in the ‘Best Practices’ section, some growers may begin offering processing and/or delivery services, which makes sourcing local ingredients much more feasible for brewers. The combination of increased demand leading to increased supply and streamlining the craft beer supply chain could have a ‘snowball’ effect; as these practices continue to be implemented, awareness increases and local sourcing will continue to increase. The bottom line of course is how the sales of these products fits into the overall diversified farm plan. Increased networking in local agriculture and brewing industries The list of brewers using local ingredients and growers supplying MA brewers, alongside the promotion of local ingredients through newsletters, the MDAR website and including this information at both grower and craft beer meetings will increase awareness of this opportunity. In addition, MDAR has developed a consumer Craft Beer Trail highlighting those that use local ingredients, to build awareness and sales for craft brewers. Recommendations for Future Research and Next Steps Expanded list of farmers supplying brewers As detailed in the ‘Brewer/grower materials’ under the ‘Current/future benefits’ section, a list of MA farmers supplying the state’s craft brewing industry was developed. While we were able to gather a list of 17 growers for 13 of the 19 ingredients, there is much opportunity for this list to be expanded. While some brewers may be protecting their sources for quality/availability reasons, other brewers may be willing to share their sources to expand business opportunities for these growers.
25
‘Online marketplace’ An ‘online marketplace’ for local ingredients would be an excellent tool for providing brewers and growers with information about real-time supply and demand. For instance, brewers could use the marketplace to enter a post asking for certain local ingredients, in the volume and price needed. Similarly, growers who have ingredients available could enter a post describing their produce and the volume and price point available. If brewers are unable to find a farmer to work with from the ‘Grower List’, the online marketplace would act as a second resource for finding local ingredients without investing a great deal of time and resources in the process. While not particularly geared towards brewing ingredients, many of these online marketplaces exist in other parts of the country. Vista Marketplace (http://vista.locallygrown.net/), operating in South Carolina, allows growers to display their goods online by describing what is available and providing photos and prices. The marketplace is currently operated by volunteers. Red Hills Online Market (http://www.localfoodmarketplace.com ), out of Tallahassee, Florida, works similarly to Vista Marketplace, however charges a yearly $25 ‘stall fee’ plus 15% of sales, which funds the website and delivery of produce from Tallahassee to customers. Grower representative Since much of the effort to source locally is initiated on the ‘demand’ side (brewers), the supply side (growers) need to find additional ways to market their products to the brewing community. This can be done through a paid advocate for farmers. This representative would act for several growers; the representative would keep an up-to-date catalogue of ingredients available from growers, who would then be able to perform marketing and sales duties that growers aren’t capable of. These advocates could build and maintain relations with smaller buyers and expand the horizons of the ‘buy local’ movement. Description of Project Beneficiaries Brewing establishments At the close of the project, December 2013, there was a total of 71 brewing establishments operating in the state of Massachusetts. Of this, 14 were contract
26
brewers; that is, they brew beer at another brewery’s establishment. The full list of brewers can be found in Appendix 3. Local farms and processing businesses Any farm in the state of Massachusetts growing hops, grains or specialty ingredients (found in Appendix 1) may benefit from this project. Through survey responses, a list of farms currently supplying the MA craft brewing industry was developed, found in Appendix 2. Valley Malt, a micromaltster out of Hadley opened in September 2010, becoming the first of its kind on the East Coast. Valley Malt’s operation is central to the MA craft brewing industry; without them, brewers in the state would not be able to source local malt. In 2011, they malted about 30 tons of grains, and as demand grows for their product, they continue to expand their capacity. While prices for local malt are much higher than their ‘malting factory’ counterparts, there remains a dedicated group of brewers who are willing to pay the price premium for the fresher, earthier ingredients that Valley Malt produces. With the ‘buy local’ initiative growing throughout the state, Valley Malt will surely see an increase in purchases from MA craft breweries.
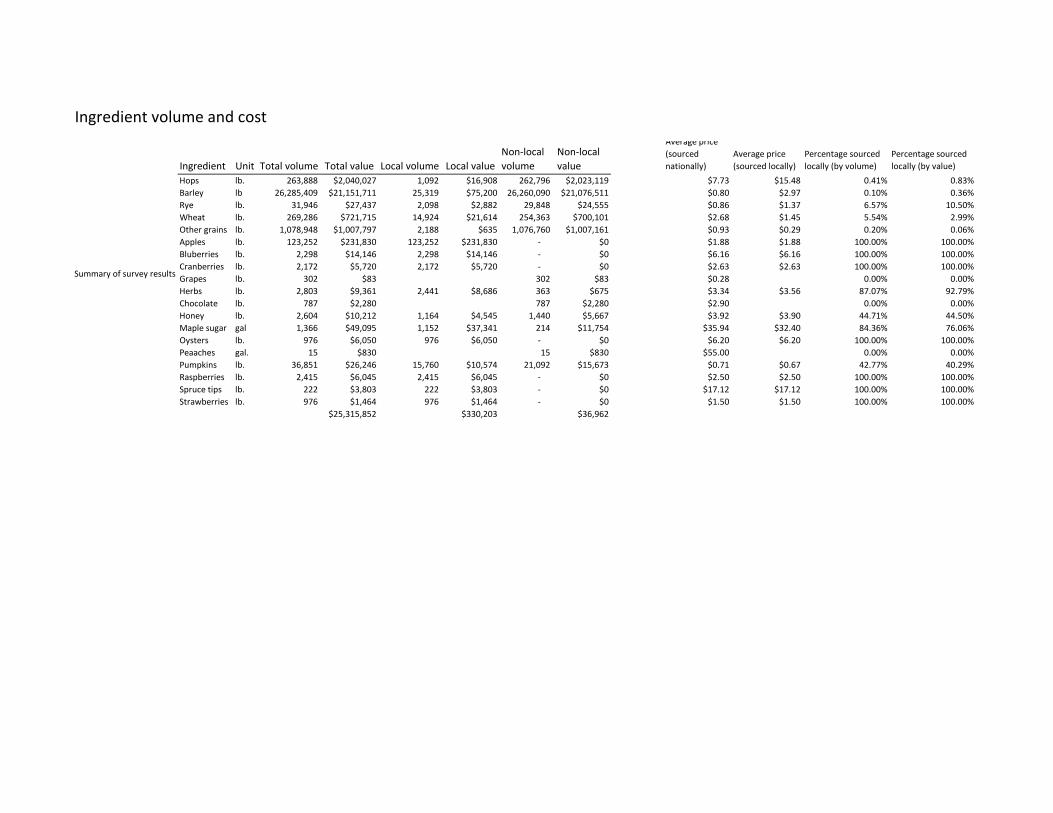
Ingredient volume and cost
Ingredient Unit Total volume Total value Local volume Local valueNon-local volume
Non-local value
Average price (sourced nationally)
Average price (sourced locally)
Percentage sourced locally (by volume)
Percentage sourced locally (by value)
Hops lb. 263,888 $2,040,027 1,092 $16,908 262,796 $2,023,119 $7.73 $15.48 0.41% 0.83%Barley lb 26,285,409 $21,151,711 25,319 $75,200 26,260,090 $21,076,511 $0.80 $2.97 0.10% 0.36%Rye lb. 31,946 $27,437 2,098 $2,882 29,848 $24,555 $0.86 $1.37 6.57% 10.50%Wheat lb. 269,286 $721,715 14,924 $21,614 254,363 $700,101 $2.68 $1.45 5.54% 2.99%Other grains lb. 1,078,948 $1,007,797 2,188 $635 1,076,760 $1,007,161 $0.93 $0.29 0.20% 0.06%Apples lb. 123,252 $231,830 123,252 $231,830 - $0 $1.88 $1.88 100.00% 100.00%Bluberries lb. 2,298 $14,146 2,298 $14,146 - $0 $6.16 $6.16 100.00% 100.00%Cranberries lb. 2,172 $5,720 2,172 $5,720 - $0 $2.63 $2.63 100.00% 100.00%Grapes lb. 302 $83 302 $83 $0.28 0.00% 0.00%Herbs lb. 2,803 $9,361 2,441 $8,686 363 $675 $3.34 $3.56 87.07% 92.79%Chocolate lb. 787 $2,280 787 $2,280 $2.90 0.00% 0.00%Honey lb. 2,604 $10,212 1,164 $4,545 1,440 $5,667 $3.92 $3.90 44.71% 44.50%Maple sugar gal 1,366 $49,095 1,152 $37,341 214 $11,754 $35.94 $32.40 84.36% 76.06%Oysters lb. 976 $6,050 976 $6,050 - $0 $6.20 $6.20 100.00% 100.00%Peaaches gal. 15 $830 15 $830 $55.00 0.00% 0.00%Pumpkins lb. 36,851 $26,246 15,760 $10,574 21,092 $15,673 $0.71 $0.67 42.77% 40.29%Raspberries lb. 2,415 $6,045 2,415 $6,045 - $0 $2.50 $2.50 100.00% 100.00%Spruce tips lb. 222 $3,803 222 $3,803 - $0 $17.12 $17.12 100.00% 100.00%Strawberries lb. 976 $1,464 976 $1,464 - $0 $1.50 $1.50 100.00% 100.00%
$25,315,852 $330,203 $36,962
Summary of survey results
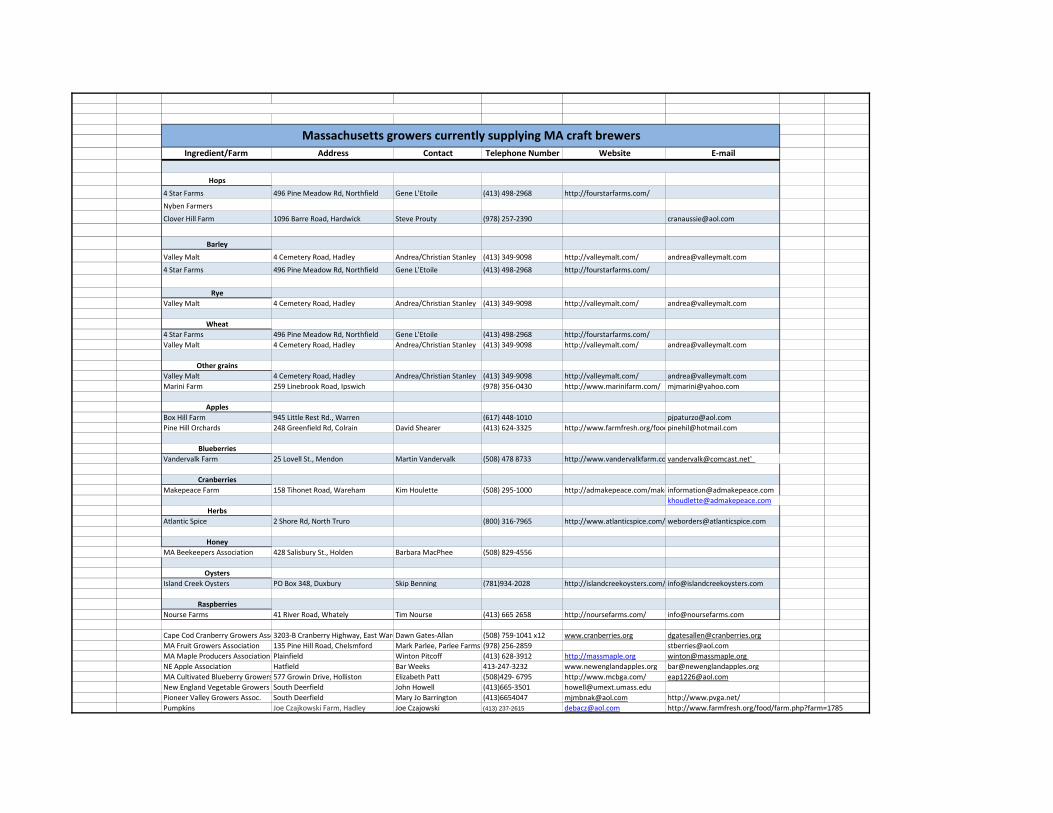
Ingredient/Farm Address Contact Telephone Number Website E-mail
Hops
4 Star Farms 496 Pine Meadow Rd, Northfield Gene L'Etoile (413) 498-2968 http://fourstarfarms.com/
Nyben Farmers
Clover Hill Farm 1096 Barre Road, Hardwick Steve Prouty (978) 257-2390 [email protected]
Barley
Valley Malt 4 Cemetery Road, Hadley Andrea/Christian Stanley (413) 349-9098 http://valleymalt.com/ [email protected]
4 Star Farms 496 Pine Meadow Rd, Northfield Gene L'Etoile (413) 498-2968 http://fourstarfarms.com/
RyeValley Malt 4 Cemetery Road, Hadley Andrea/Christian Stanley (413) 349-9098 http://valleymalt.com/ [email protected]
Wheat4 Star Farms 496 Pine Meadow Rd, Northfield Gene L'Etoile (413) 498-2968 http://fourstarfarms.com/Valley Malt 4 Cemetery Road, Hadley Andrea/Christian Stanley (413) 349-9098 http://valleymalt.com/ [email protected]
Other grainsValley Malt 4 Cemetery Road, Hadley Andrea/Christian Stanley (413) 349-9098 http://valleymalt.com/ [email protected] Farm 259 Linebrook Road, Ipswich (978) 356-0430 http://www.marinifarm.com/ [email protected]
ApplesBox Hill Farm 945 Little Rest Rd., Warren (617) 448-1010 [email protected] Hill Orchards 248 Greenfield Rd, Colrain David Shearer (413) 624-3325 http://www.farmfresh.org/[email protected]
BlueberriesVandervalk Farm 25 Lovell St., Mendon Martin Vandervalk (508) 478 8733 http://www.vandervalkfarm.co [email protected]'
CranberriesMakepeace Farm 158 Tihonet Road, Wareham Kim Houlette (508) 295-1000 http://admakepeace.com/[email protected]
Atlantic Spice 2 Shore Rd, North Truro (800) 316-7965 http://www.atlanticspice.com/ [email protected]
HoneyMA Beekeepers Association 428 Salisbury St., Holden Barbara MacPhee (508) 829-4556
OystersIsland Creek Oysters PO Box 348, Duxbury Skip Benning (781)934-2028 http://islandcreekoysters.com/ [email protected]
RaspberriesNourse Farms 41 River Road, Whately Tim Nourse (413) 665 2658 http://noursefarms.com/ [email protected]
Cape Cod Cranberry Growers Asso3203-B Cranberry Highway, East WareDawn Gates-Allan (508) 759-1041 x12 www.cranberries.org [email protected] Fruit Growers Association 135 Pine Hill Road, Chelsmford Mark Parlee, Parlee Farms (978) 256-2859 [email protected] Maple Producers Association Plainfield Winton Pitcoff (413) 628-3912 http://massmaple.org [email protected] NE Apple Association Hatfield Bar Weeks 413-247-3232 www.newenglandapples.org [email protected] Cultivated Blueberry Growers 577 Growin Drive, Holliston Elizabeth Patt (508)429- 6795 http://www.mcbga.com/ [email protected] England Vegetable Growers South Deerfield John Howell (413)665-3501 [email protected] Valley Growers Assoc. South Deerfield Mary Jo Barrington (413)6654047 [email protected] http://www.pvga.net/Pumpkins Joe Czajkowski Farm, Hadley Joe Czajowski (413) 237-2615 [email protected] http://www.farmfresh.org/food/farm.php?farm=1785
Massachusetts growers currently supplying MA craft brewers
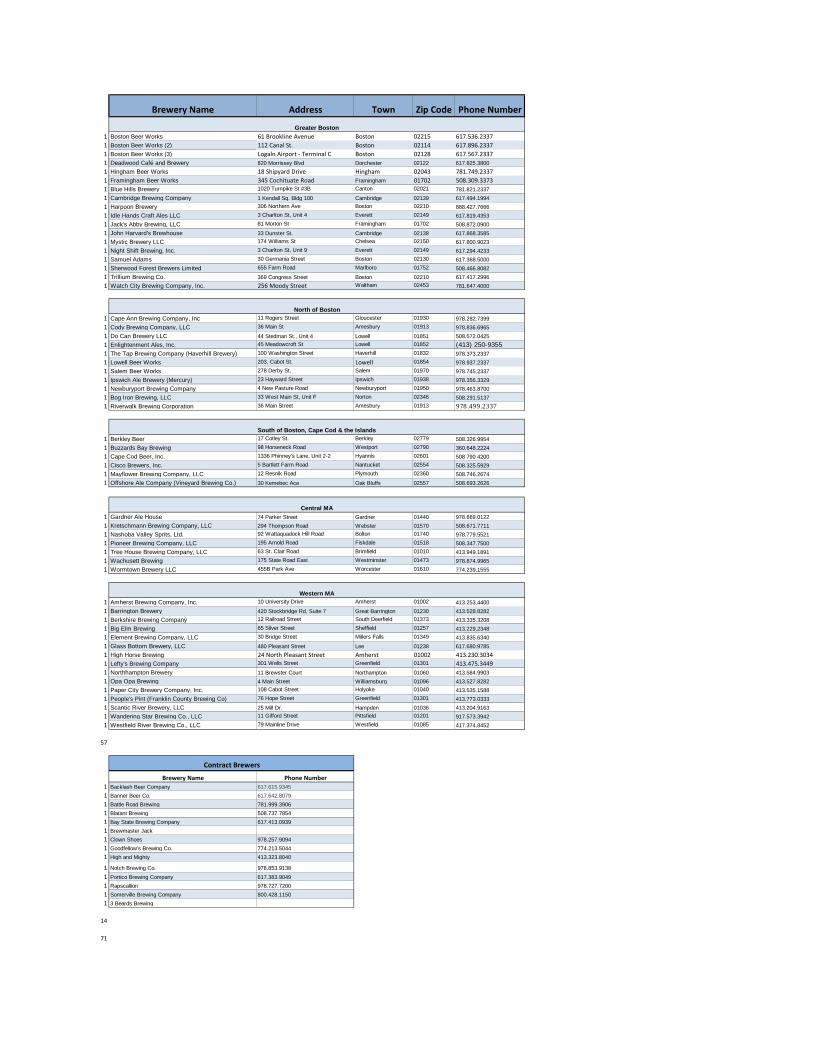
Brewery Name Address Town Zip Code Phone Number
1 Boston Beer Works 61 Brookline Avenue Boston 02215 617.536.23371 Boston Beer Works (2) 112 Canal St. Boston 02114 617.896.23371 Boston Beer Works (3) Logaln Airport - Terminal C Boston 02128 617.567.23371 Deadwood Café and Brewery 820 Morrissey Blvd Dorchester 02122 617.825.38001 Hingham Beer Works 18 Shipyard Drive Hingham 02043 781.749.23371 Framingham Beer Works 345 Cochituate Road Framingham 01702 508.309.33731 Blue Hills Brewery 1020 Turnpike St #3B Canton 02021 781.821.23371 Cambridge Brewing Company 1 Kendall Sq. Bldg 100 Cambridge 02139 617.494.19941 Harpoon Brewery 306 Northern Ave Boston 02210 888.427.76661 Idle Hands Craft Ales LLC 3 Charlton St, Unit 4 Everett 02149 617.819.43531 Jack's Abby Brewing, LLC 81 Morton St Framingham 01702 508.872.09001 John Harvard's Brewhouse 33 Dunster St. Cambridge 02138 617.868.35851 Mystic Brewery LLC 174 Williams St Chelsea 02150 617.800.90231 Night Shift Brewing, Inc. 3 Charlton St, Unit 9 Everett 02149 617.294.42331 Samuel Adams 30 Germania Street Boston 02130 617.368.50001 Sherwood Forest Brewers Limited 655 Farm Road Marlboro 01752 508.466.80821 Trillium Brewing Co. 369 Congress Street Boston 02210 617.417.29961 Watch City Brewing Company, Inc. 256 Moody Street Waltham 02453 781.647.4000
1 Cape Ann Brewing Company, Inc 11 Rogers Street Gloucester 01930 978.282.73991 Cody Brewing Company, LLC 36 Main St Amesbury 01913 978.836.69651 Do Can Brewery LLC 44 Stedman St., Unit 4 Lowell 01851 508.572.04251 Enlightenment Ales, Inc. 45 Meadowcroft St Lowell 01852 (413) 250-93551 The Tap Brewing Company (Haverhill Brewery) 100 Washington Street Haverhill 01832 978.373.23371 Lowell Beer Works 203, Cabot St. Lowell 01854 978.937.23371 Salem Beer Works 278 Derby St. Salem 01970 978.745.23371 Ipswich Ale Brewery (Mercury) 23 Hayward Street Ipswich 01938 978.356.33291 Newburyport Brewing Company 4 New Pasture Road Newburyport 01950 978.463.87001 Bog Iron Brewing, LLC 33 West Main St, Unit F Norton 02346 508.291.51371 Riverwalk Brewing Corporation 36 Main Street Amesbury 01913 978.499.2337
1 Berkley Beer 17 Cotley St. Berkley 02779 508.326.99541 Buzzards Bay Brewing 98 Horseneck Road Westport 02790 360.648.22241 Cape Cod Beer, Inc. 1336 Phinney's Lane, Unit 2-2 Hyannis 02601 508 790 42001 Cisco Brewers, Inc. 5 Bartlett Farm Road Nantucket 02554 508.325.59291 Mayflower Brewing Company, LLC 12 Resnik Road Plymouth 02360 508.746.26741 Offshore Ale Company (Vineyard Brewing Co.) 30 Kemebec Ace Oak Bluffs 02557 508.693.2626
1 Gardner Ale House 74 Parker Street Gardner 01440 978.669.01221 Kretschmann Brewing Company, LLC 294 Thompson Road Webster 01570 508.671.77111 Nashoba Valley Sprits, Ltd. 92 Wattaquadock Hill Road Bolton 01740 978.779.55211 Pioneer Brewing Company, LLC 195 Arnold Road Fiskdale 01518 508.347.75001 Tree House Brewing Company, LLC 63 St. Clair Road Brimfield 01010 413.949.18911 Wachusett Brewing 175 State Road East Westminster 01473 978.874.99651 Wormtown Brewery LLC 455B Park Ave Worcester 01610 774.239.1555
1 Amherst Brewing Company, Inc. 10 University Drive Amherst 01002 413.253.44001 Barrington Brewery 420 Stockbridge Rd, Suite 7 Great Barrington 01230 413.528.82821 Berkshire Brewing Company 12 Railroad Street South Deerfield 01373 413.335.3208 1 Big Elm Brewing 65 Silver Street Sheffield 01257 413.229.23481 Element Brewing Company, LLC 30 Bridge Street Millers Falls 01349 413.835.63401 Glass Bottom Brewery, LLC 480 Pleasant Street Lee 01238 617.680.97851 High Horse Brewing 24 North Pleasant Street Amherst 01002 413.230.30341 Lefty's Brewing Company 301 Wells Street Greenfield 01301 413.475.34491 Northhampton Brewery 11 Brewster Court Northampton 01060 413.584.99031 Opa Opa Brewing 4 Main Street Williamsburg 01096 413.527.82821 Paper City Brewery Company, Inc. 108 Cabot Street Holyoke 01040 413.535.15881 People's Pint (Franklin County Brewing Co) 76 Hope Street Greenfield 01301 413.773.03331 Scantic River Brewery, LLC 25 Mill Dr. Hampden 01036 413.204.91631 Wandering Star Brewing Co., LLC 11 Gifford Street Pittsfield 01201 917.573.39421 Westfield River Brewing Co., LLC 79 Mainline Drive Westfield 01085 417.374.8452
57
Brewery Name Phone Number1 Backlash Beer Company 617.615.93451 Banner Beer Co. 617.642.80791 Battle Road Brewing 781.999.39061 Blatant Brewing 508.737.78541 Bay State Brewing Company 617.413.09391 Brewmaster Jack1 Clown Shoes 978.257.90941 Goodfellow's Brewing Co. 774.213.50441 High and Mighty 413.323.8040
1 Notch Brewing Co. 978.853.91381 Portico Brewing Company 617.383.90491 Rapscallion 978.727.72001 Somerville Brewing Company 800.428.11501 3 Beards Brewing
14
71
Greater Boston
Contract Brewers
Western MA
Central MA
South of Boston, Cape Cod & the Islands
North of Boston
Local Ingredient Usage by Massachuestts Craft Breweries
Brewery NameHops
Barley RyeWheat
Other grainsApples
Blueberries
CranberriesGrapes
Herbs
ChocolateHoney
Maple syrupOysters
Peaches
Pumpkins
Raspberries
Spruce tips
StrawberriesAmherst Brewing Company Inc X XBerkshire Brewing Company Inc X XBerkshire Mountain Brewers Inc X X XBuzzards Bay Brewing X X XCambridge Brewing Company Inc X X X X X X XCape Ann Brewing Co Inc X X X X XCape Cod BeerCisco Brewers IncElement Brewing Company X XFranklin County Brewing Co. Inc X X X X XGlass Bottom Brewing X X X X X X XGoodfellow's Brewing X X X XHaverhill Brewery Inc. XIdle Hands Craft Ales LLC X X XJack's Abby Brewing LLC X XLefty's Brewing Company XMass Bay Brewing Company X X X X XMercury Brewing Company X X X X XMystic Brewery LLC X XNashoba Valley Spirits Ltd XPaper City Brewery Company Inc X X XRiverwalk Brewing Co. X XSlesar Bros. Brewing Co. Inc X X XVineyard Brewing Company XWachusett Brewing Company IncWestfield River Brewing Co XWormtown Brewery LLC X X X X X X X
Ingredient Total volume w/ Multiplier Measure Ingredient Local volume w/ Multiplier Measure Difference between total and local Hops 241447 557825.83 pound Hops 552 1275.31 pound Hops 240895Barley 24732330 57140210.69 bushel Barley 20360 47038.62 bushel Barley 24711970Rye 26945 62252.24 bushel Rye 2350 5429.31 bushel Rye 24595Wheat 165368 382057.10 bushel Wheat 11425 26395.69 bushel Wheat 153943Other grains 1057810 2443905.86 bushel Other grains 600 1386.21 bushel Other grains 1057210Apples 118603 264880.03 pound Apples 118603 264880.03 pound Apples 0Blueberries 234 522.60 pound Blueberries 234 522.60 pound Blueberries 0Cranberries 1619 3615.77 pound Cranberries 1619 3615.77 pound Cranberries 0Grapes 240 536.00 pound Grapes 0 0.00 pound Grapes 240Herbs 2418 5400.20 pound Herbs 2401 5362.23 pound Herbs 17Chocolate 200 446.67 pound Chocolate 0 0.00 pound Chocolate 200Honey 1735 3874.83 pound Honey 600 1340.00 pound Honey 1135Maple Syrup 1072.5 2395.25 pound Maple Syrup 832.5 1859.25 pound Maple Syrup 240Oysters 500 1116.67 pound Oysters 500 1116.67 pound Oysters 0Peaches 0 0.00 pound Peaches 0 0.00 pound Peaches 0Pears 0 0.00 pound Pears 0 0.00 pound Pears 0Pumpkins 31690 70774.33 pound Pumpkins 11300 25236.67 pound Pumpkins 20390Raspberries 2400 5360.00 pound Raspberries 2400 5360.00 pound Raspberries 0Spruce tips 212 473.47 pound Spruce tips 212 473.47 pound Spruce tips 0Strawberries 500 1116.67 pound Strawberries 500 1116.67 pound Strawberries 0Others 164 366.27 pound Others 0 0.00 pound Others 164
Total * total Local volume * Total - local
Hops 89,335$ 8,070$ 81,265$ 0.09033374Barley 16,688,678$ 62,860$ 16,625,818$ 0.00376663Rye 24,538$ 2,650$ 21,888$ 0.10799576Wheat 509,759$ 18,267$ 491,492$ 0.03583458Other grains 997,350$ 1,026$ 996,324$ 0.00102873Apples 230,900$ 230,900$ -$ 1Blueberries 1,700$ 1,700$ -$ 1Cranberries 4,700$ 4,700$ -$ 1Grapes -$ -$ -$ Herbs 8,710$ 8,425$ 285$ 0.96727899Chocolate 800$ -$ 800$ 0Honey 8,580$ 3,650$ 4,930$ 0.4253899Maple Syrup 34,030$ 24,680$ 9,350$ 0.72524243Oysters -$ -$ -$ Peaches -$ -$ -$ Pears -$ -$ -$ Pumpkins 22,870$ 7,820$ 15,050$ 0.34193266Raspberries 6,000$ 6,000$ -$ 1Spruce tips 3,600$ 3,600$ -$ 1Strawberries 750$ 750$ -$ 1Others -$ -$ -$
18,632,301$ 385,098$ 18,247,203$ 0.020668301
Local Quantity SourcedTotal Quantity Sourced
2012 Massachusetts Economic Snapshot of the Craft Brewery Industry and Passport Program
Thank you for your time to complete the following survey, which will be aggregated as a total for the industry. Individual company information will not be shared. Contact information, businesses description and tour details will be included in the MA Craft Brewery Passport/Trail program.
1. Business name:
Contact: Title:
Address:
City: State: MA Zip:
Production Address:
City: State: MA Zip:
Telephone: FAX:
Company email: Contact email:
Website:
2. Business description: Feel free to include your mission statement.
3. What do you produce – check all that apply:
Lager Wheat beer
Pale ale Belgian Style (Triple, Double, Etc)
IPA Saison/Farmhouse Ale
Stout Porter
Other ales What else do you produce (please list):
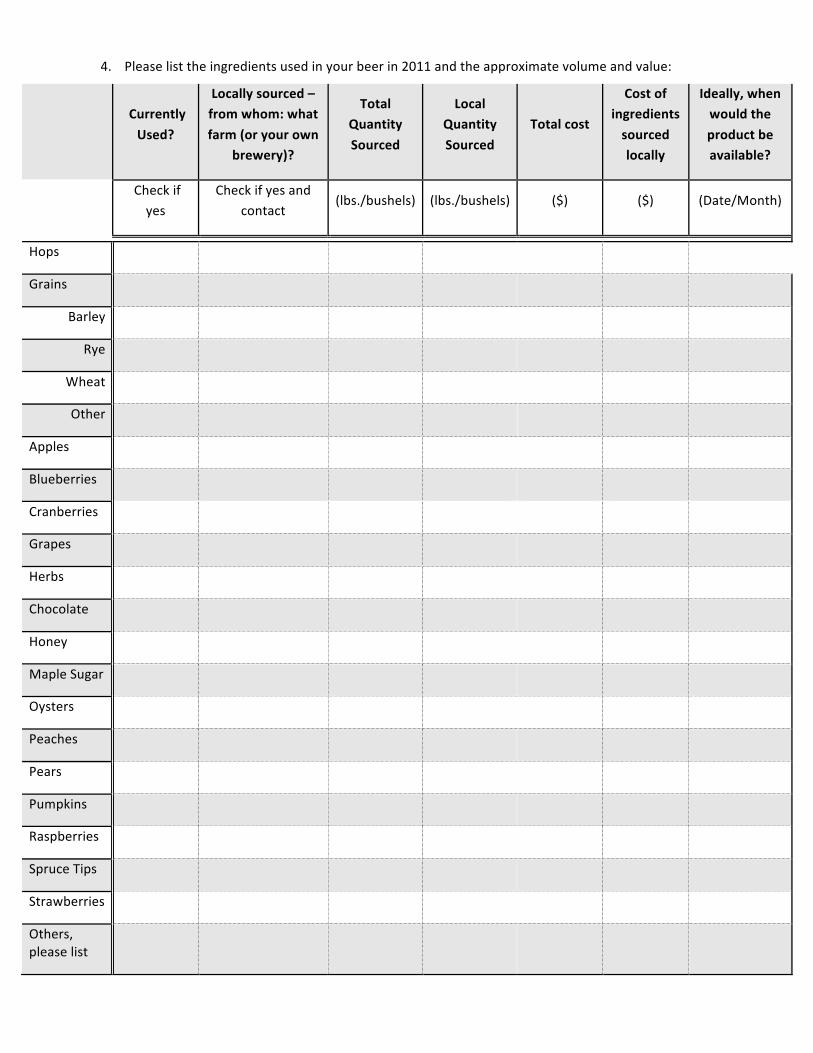
4. Please list the ingredients used in your beer in 2011 and the approximate volume and value:
Currently Used?
Locally sourced – from whom: what farm (or your own
brewery)?
Total Quantity Sourced
Local Quantity Sourced
Total cost
Cost of ingredients sourced locally
Ideally, when would the product be available?
Check if
yes Check if yes and
contact (lbs./bushels) (lbs./bushels) ($) ($) (Date/Month)
Hops
Grains
Barley
Rye
Wheat
Other
Apples
Blueberries
Cranberries
Grapes
Herbs
Chocolate
Honey
Maple Sugar
Oysters
Peaches
Pears
Pumpkins
Raspberries
Spruce Tips
Strawberries
Others, please list
5. Do you have other relationship with growers – for example – collaboration for the removal of spent grain? Please describe and the volume/lbs.
6. How many employees do you have?
Full Time ____ Part Time ____ Volunteer/intern ____
7. Do you conduct tours (or plan to in the future, please describe)?
Yes ____ No ____
What, if any, are the hours/ days during the week for the tours?
Do you offer tastings?
8. Do you want to be included on the Massachusetts Craft Brewery Passport/Trail?
Yes___ No ___
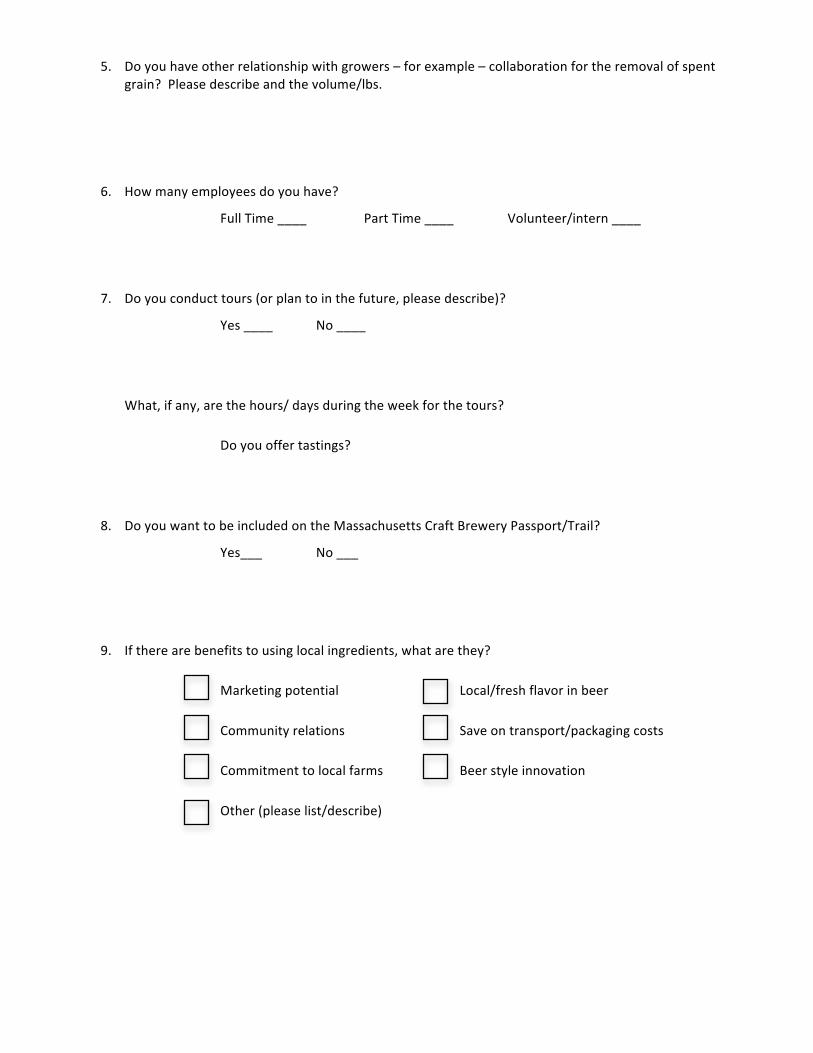
9. If there are benefits to using local ingredients, what are they?
Marketing potential Local/fresh flavor in beer
Community relations Save on transport/packaging costs
Commitment to local farms Beer style innovation
Other (please list/describe)
10. What challenges do you face when sourcing local ingredients?
Cost Product quality
Logistics Storage
Sourcing (finding a farm) Timing/harvest
Volume/availability Other (please list/describe)
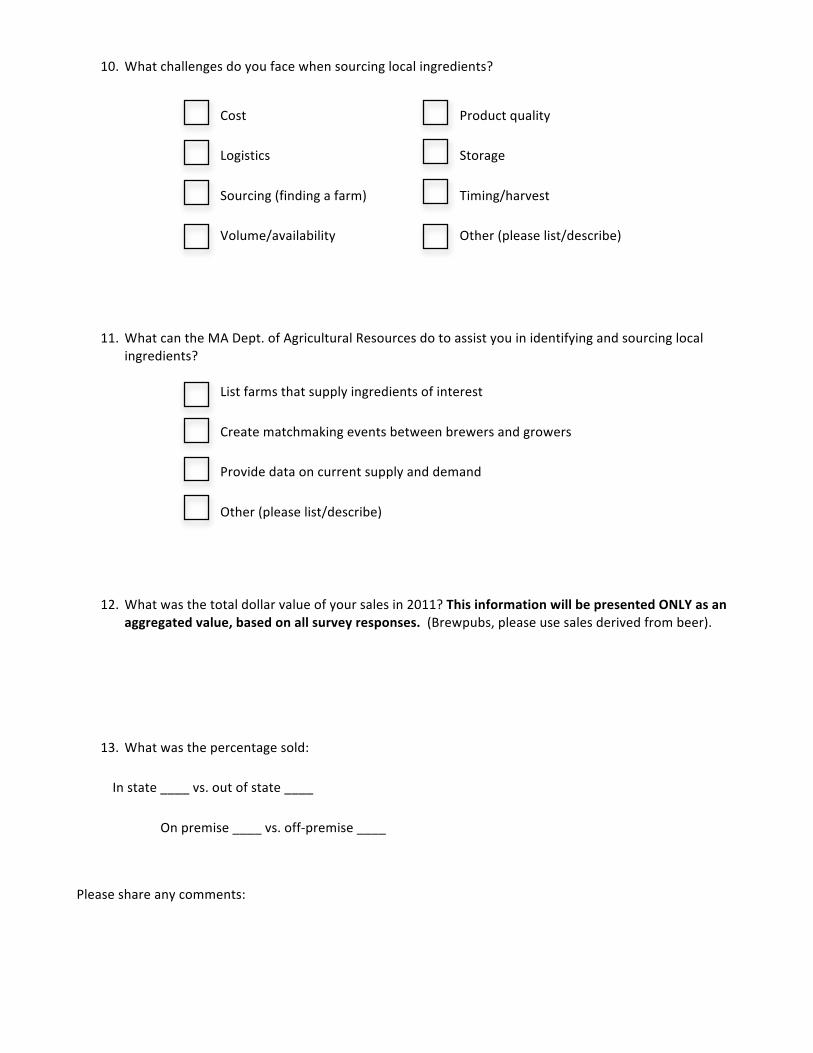
11. What can the MA Dept. of Agricultural Resources do to assist you in identifying and sourcing local ingredients?
List farms that supply ingredients of interest
Create matchmaking events between brewers and growers
Provide data on current supply and demand
Other (please list/describe)
12. What was the total dollar value of your sales in 2011? This information will be presented ONLY as an aggregated value, based on all survey responses. (Brewpubs, please use sales derived from beer).
13. What was the percentage sold:
In state ____ vs. out of state ____
On premise ____ vs. off-‐premise ____
Please share any comments:
Thank you for your time! If you have any questions/comments, please contact [email protected], 617.626.1753 or Phil Marquis [email protected], 860.597.9039
Return by email [email protected] or mail to: Bonita Oehlke, Massachusetts Department of Agricultural Resources 251 Causeway Street, Suite 500 , Boston, MA 02114 This project is coordinated by the MDAR and the MA Brewers Guild with funding support from USDA, Agricultural Marketing Service, Federal-‐State Marketing Improvement Program, and USDA Rural Development.
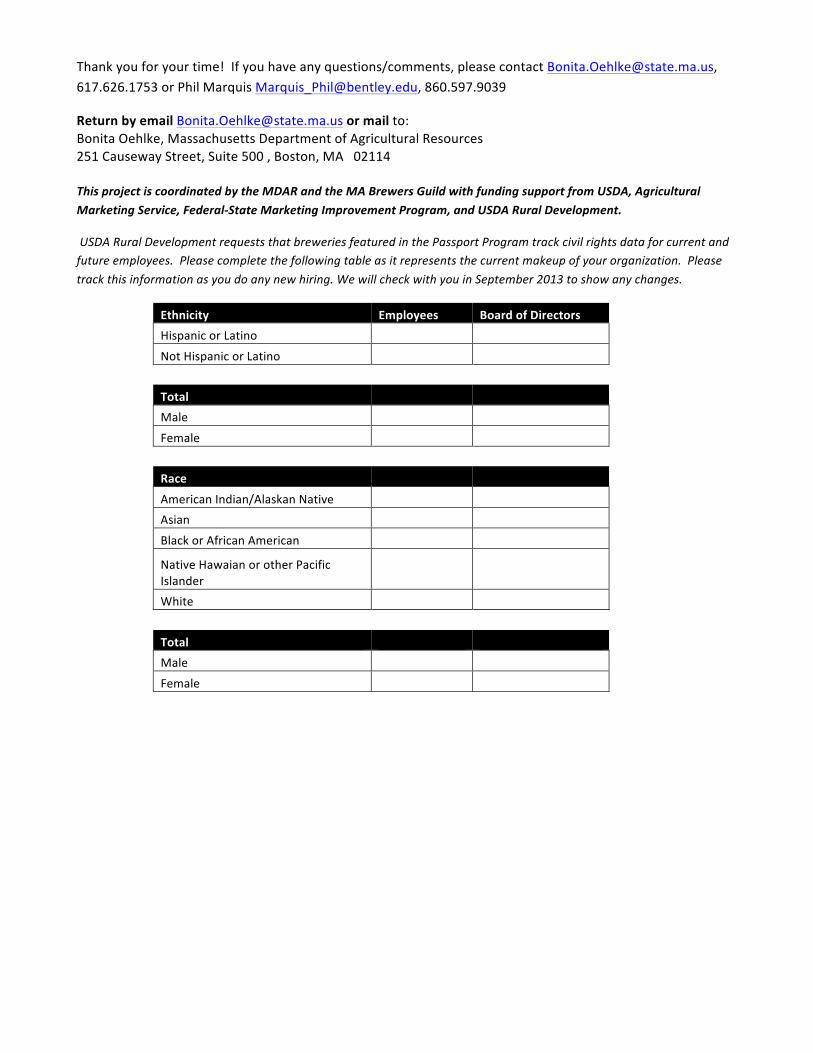
USDA Rural Development requests that breweries featured in the Passport Program track civil rights data for current and future employees. Please complete the following table as it represents the current makeup of your organization. Please track this information as you do any new hiring. We will check with you in September 2013 to show any changes.
Ethnicity Employees Board of Directors Hispanic or Latino
Not Hispanic or Latino
Total Male
Female
Race
American Indian/Alaskan Native Asian
Black or African American
Native Hawaian or other Pacific Islander White
Total Male
Female