from exclusion to destitution: race, affordable housing ... · blacks also reported less income...
TRANSCRIPT

33Cityscape: A Journal of Policy Development and Research • Volume 13, Number 1 • 2011U.S. Department of Housing and Urban Development • Office of Policy Development and Research
Cityscape
From Exclusion to Destitution: Race, Affordable Housing, and HomelessnessGeorge R. Carter IIIU.S. Census Bureau
Abstract
Since the 1980s, Blacks have been overrepresented in the homeless population with respect to their share of the national population and the poverty population, but little research has emerged to explain why this overrepresentation exists. Previous researchers have suggested that residential segregation and a declining supply of affordable housing push low-income Blacks into homelessness and that greater access to homeless shelters pulls low-income Blacks into homelessness at greater rates than Whites. These hypoth-eses have not been tested, because longitudinal data linking housing characteristics, service accessibility, and the homeless population do not exist. For these reasons, the study in this article presents analyses of housed and homeless populations separately. The first set of analyses focuses on the segment of the housed population most at risk of becoming homeless: those living in inadequate and overcrowded housing. Using data from the 1990 and 2000 Decennial Censuses and the 1997 American Housing Survey, this study tests the relationship between residential segregation, affordable housing supply, and the extent to which Blacks live in inadequate and overcrowded housing. The study found that high rates of residential segregation and lower affordable housing supply were associated with inadequate housing quality and overcrowding in Black households. Working under the assumption that closer proximity to homeless services decreases migration for such services, in the second set of analyses, this study examines racial differences in migration for homeless services. Using data from the 1996 National Survey of Homeless Assistance Providers and Clients, this study reveals that Black homeless clients were less likely than White homeless clients to have migrated for home-less services. Black homeless clients were more likely than White homeless clients to both start their homeless spell in a large central-city location and end up using services in that location or in another large central city. Homeless spells were longer for Black homeless clients but were more transient for White homeless clients, who were more likely to stay in three or more towns during their spell. The study addresses implications for fair housing policy, affordable housing policy, and homeless-services provision; discusses limitations of the research; and proposes areas for future research.

34 Discovering Homelessness
Carter
IntroductionBlacks1 are overrepresented in the homeless population, but little research has emerged to explain why this overrepresentation exists. Since the 1980s, studies on homelessness have consistently found that the homeless population is now much more racially diverse than it was before the 1980s, when it was composed primarily of White middle-aged men (Hopper, 2003; Rossi, 1989a; Rossi, 1989b). After 1980, Blacks became overrepresented in the homeless population with respect to their share of the national population and the poverty population.
Explanations for the Black overrepresentation can be grouped into push and pull factors. Major push factors examined in the literature include poverty, declines in affordable housing supply, increases in affordable housing demand, housing discrimination, residential segregation, and lack of access to mental health and substance-abuse services. The major pull factor examined in the literature is access to shelter space. Some studies of the homeless population have found significant negative associations between affordable housing supply and the size of the homeless population and positive associations between increasing housing prices and the size of the homeless population (Bohanon, 1991; Burt, 1992; Eliot and Krivo, 1991; Honig and Filer, 1993). These studies, however, do not explain how housing influences Black homelessness differently than White homelessness.
Some researchers have speculated that residential segregation may be a reason for the overrepre-sentation of Blacks in the homeless population (Baker, 1994; Shinn and Gillespie, 1993; Wright, 1989; Wright, Rubin, and Devine, 1998). Regardless of the causes of residential segregation, its presence is theorized to limit housing opportunities for Blacks by shrinking the market in which they make housing choices. Thus, segregation may limit access to affordable housing and put Blacks at greater risk of becoming homeless. Although such theories have been proposed, they have never been empirically tested.
Other researchers have addressed shelter access, the main pull factor in the literature. Baker (1994) found that shelters were more likely to be placed in communities with high percentages of Blacks, and Lee and Farrell (2004) found that shelters were more likely to be placed in communities with high percentages of minorities. Some researchers have argued that homeless shelters perpetuate long-term homelessness and pull people out of inadequate substandard housing into homelessness (Gounis, 1990; Jencks, 1994). Thus, if poor Blacks have greater access to shelter space, they may be pulled out of their housing at greater rates than poor Whites, assuming equal preferences for using homeless services.
One reason why few researchers have addressed these push and pull factors empirically is that appropriate data to analyze the factors are not publicly available. Ideally, a researcher would need to link data on housing segregation, affordable housing supply, homeless shelter locations, and the racial composition of the homeless population in the United States to analyze these factors. If such data were available, a researcher could examine whether changes in segregation, affordable housing supply, and access to shelter space are correlated with Black homelessness rates. Because such linked data are not available, this study examines the housed and homeless populations separately.
1 In this article, “Blacks” should be understood to refer to “non-Hispanic Blacks” and “Whites” should be understood to refer to “non-Hispanic Whites.”
35Cityscape
From Exclusion to Destitution: Race, Affordable Housing, and Homelessness
Part I of this study’s analyses focuses on the segment of the housed population most at risk of becoming homeless (Ringheim, 1990; Rosenbaum, 1996; Stacey, 1972): those people who live in inadequate and overcrowded housing. Using data from the 1990 and 2000 Decennial Censuses and the 1997 American Housing Survey (AHS), this study examines the relationships between residential segregation, affordable housing supply, and the extent to which Blacks live in inad-equate and overcrowded housing.
Working under the assumption that closer proximity to homeless services decreases the need to migrate for such services, Part II of this study’s analyses examines racial differences in migration for homeless services. Using client data from the 1996 National Survey of Homeless Assistance Providers and Clients (NSHAPC), this study examines the migration of Black and White homeless people for homeless services.2
Literature ReviewThis section discusses research on the overrepresentation of Blacks in the homeless population. First, a review of historical research examines trends in Black representation in the homeless population over time. Second, explanations for the overrepresentation of Blacks in the homeless population since the 1980s are examined. Explanations for the overrepresentation are grouped into factors that are hypothesized to push and pull low-income Blacks into homelessness at greater rates than Whites.
The Existence of the OverrepresentationStudies on homelessness after 1980 have consistently found the population to be much more racially diverse than it was before 1980 (Hopper, 2003; Rossi, 1989a; Rossi, 1989b). Before the 1980s, the homeless population was primarily composed of White middle-aged men.3 After 1980, Blacks became overrepresented in the homeless population with respect to their share of the national population (12.8 percent) and their share of the poverty population (28.4 percent of individuals and 26.1 percent of families).4 In one of the most reliable studies of the homeless population, Burt (1992) found 41 percent of the homeless population to be Black and 56 percent of the adult female homeless population to be Black. Shlay and Rossi (1992), in their review of 52 national and local studies of the homeless, found, on average, that 44 percent of the homeless were Black, with percentages ranging from 6 to 90 percent across the studies. According to the Census S-Night5 count, in cities with more than 5 million people, 47.9 per 10,000 Black men and 24.4 per 10,000 Black
2 The NSHAPC is a representative sample of the service-using homeless population. As such, the study tests the broader pull of homeless services, rather than just the pull of homeless shelters.3 Kusmer (2002) argues that this finding is biased, because most studies of the homeless population prior to 1980 were of skid row homeless people, who were disproportionately White.4 March 1997 Current Population Survey.5 As part of the 1990 Decennial Census, the U.S. Census Bureau “conducted a ‘Shelter and Street-Night’ (S-Night) operation to count selected components of the homeless population in preidentified emergency shelters and open locations in the streets and other places not intended for habitation” (Martin 1992: 2).

36 Discovering Homelessness
Carter
women were homeless in 1990. These statistics compare with a rate of 14.1 for White males and 5.6 for White females (Hudson, 1998).
Explanations of the OverrepresentationExplanations for the Black overrepresentation in the homeless population have focused on factors thought to push Blacks out of housing or pull Blacks into homelessness at higher rates than Whites. As stated previously, the major push factors examined include poverty, declines in affordable housing supply, increases in affordable housing demand, housing discrimination, residential segregation, and lack of access to mental health and substance-abuse services; the main pull factor examined is access to shelter space. There is little evidence that access to mental health and substance-abuse services is responsible for the overrepresentation, although the lack of these services may be respon-sible for increasing homelessness in general (National Academy of Sciences, 1988; HHS, 1989).
Push Factor 1: PovertyBecause landlords require rent in exchange for housing, a household’s income could be considered a factor in the risk of losing housing. Thus, if we hold housing prices constant, we can hypoth-esize that the lowest income groups have the highest risk of being pushed out of housing into homelessness. If Blacks are represented at greater rates than Whites in the poverty population, we can expect their risk of homelessness to be greater. As mentioned previously, Blacks are over-represented in both the homeless and poverty populations, although they are overrepresented to a greater degree in the homeless population. Among the homeless population, in the late 1980s, Blacks also reported less income from working than did Whites and Hispanics (Burt, 1992; Burt and Cohen, 1990; Burt and Cohen, 1989). This disparity perhaps places Blacks at greater risk of longer homeless spells once they become homeless.
Since they were developed in the early 1960s, official poverty thresholds have not been adjusted to account for area differences in housing costs. Although the original poverty measure may have been a valid indicator at the time it was developed, as rental-housing costs increased during the 1980s and 1990s, the proportion of poverty income spent on housing increased. For this reason, income must be analyzed in relation to its purchasing power in the housing marketplace. This study analyzes affordable housing supply in relation to the size of the population below 50 percent of the poverty threshold in order to take into account both the size of this population and the number of affordable rental units available to them.
Push Factor 2: Declines in Affordable Housing Supply and Increases in Affordable Housing DemandAlthough explaining homelessness in terms of the availability of affordable housing may seem tautological, housing is but one of many possible explanations, including poverty, mental health problems, drug abuse, and disaffiliation, as to why people become homeless (Hopper, 2003). Even if affordable housing supply is high, individuals may be evicted from their homes into homelessness if their income, mental health problems, or drug abuse make it difficult to make rent payments. Conversely, if affordable housing supply is low, then income, mental health, and drug abuse problems may play less of a role than housing supply in pushing people into homelessness.

37Cityscape
From Exclusion to Destitution: Race, Affordable Housing, and Homelessness
Many studies of the homeless population have found significant positive associations between the lack of available affordable housing, increasing housing prices, and the size of the homeless population (Burt, 1992; Bohanon, 1991; Eliot and Krivo, 1991; Honig and Filer, 1993). These studies evaluated the relative importance of affordable housing supply on the size of the homeless population using the U.S. Department of Housing and Urban Development’s (HUD’s) 1984 home-less survey (HUD, 1984). Eliot and Krivo (1991) found availability of affordable housing, along with access to mental health care, to be the strongest predictors of lower levels of homelessness. Areas with higher poverty rates, higher concentrations of Blacks, and more female-headed families had higher rates of homelessness.
Trend studies examining the structural causes of homelessness take it as a given that homelessness increased in the 1980s and use historical trend data to assess the effects of historical factors. Shinn and Gillespie (1994) found that a small surplus of the least expensive units existed in 1970. A gap between the supply of these units and the demand for these units by low-income individuals devel-oped after 1970. In 1985, a gap of 4.54 million units existed between the number of low-income units and the number of low-income households, which became a 5.22-million-unit gap by 1991. Four million affordable units were lost from the housing market between 1970 and 1990 when the units were upgraded, converted to condos, or demolished. The shortage of affordable units was greatest in central cities. As affordable housing supply declines were followed by income declines in the 1980s and 1990s, rent burdens grew among unsubsidized renters, putting some at greater risk of becoming homeless (Jencks, 1994). Although affordable housing supply studies have made great progress exploring the link between affordable housing and the homeless problem, they tend to assume that all groups have equal access to the affordable housing that is available. These studies do not explain how access to housing may influence Black homelessness differently than White homelessness.
Push Factor 3: Housing Discrimination and Residential SegregationResidential segregation has been associated with negative outcomes for Blacks. Massey and Denton (1988) argued that residential segregation has been the missing factor in explaining the existence of the urban underclass and the concentration of poverty in central cities. Other segregation researchers have focused on negative outcomes for Blacks at the neighborhood level and the individual level. For instance, segregation has been found to lead to lower high school graduation rates, idleness, lower earnings, and single motherhood among Blacks (Cutler and Glaeser, 1997). Although this research has examined a multitude of negative outcomes, it has not focused on the individual housing outcomes of Blacks.
Some researchers have pointed to residential segregation as a reason for the overrepresentation of Blacks in the homeless population (Baker, 1994; Shinn and Gillespie, 1994; Wright, 1989; Wright, Rubin, and Devine, 1998). Some have argued that the racial composition of the homeless population is a function of the racial composition of the communities in which homeless people are found. Because homelessness rates are higher in inner-city areas, the homeless population will be Black––if such areas are inhabited primarily by Blacks (Hudson, 1998; Rossi, 1989a; Rossi, 1989b). Thus, residential segregation may play a key role in Black homelessness. Theories about the role of housing discrimination and residential segregation in the overrepresentation, however, have never been tested.

38 Discovering Homelessness
Carter
Research exists on the connection between segregation and people most at risk of becoming homeless: those living in inadequate and overcrowded housing. Housing quality has been identi-fied as a risk factor for homelessness (Ringheim, 1990; Rosenbaum, 1996; Stacey, 1972). Because data linking segregation to racial composition of the homeless population are not available, this study examines the link between segregation and the probability of Blacks living in substandard housing conditions. Mounting evidence indicates that Blacks do not have equal access to good-quality housing (Grigsby, 1994). Previous cross-sectional and trend studies have linked residential segregation to increased rents and decreased housing quality for Blacks (Massey and Denton, 1988; Rosenbaum, 1996). Rosenbaum (1996) found that living in a highly segregated city (New York) and being Black were positively related to living in inadequate, dilapidated housing.
To date, studies that address segregation in analyzing housing outcomes have focused on indi-vidual cities rather than on the national level. Using data from the 1997 AHS, the 1990 Decennial Census, and the 2000 Decennial Census, this study is the first national study to examine the effects of Black headship and residential segregation on two measures of housing quality: housing inadequacy and overcrowding. I contend that residential segregation limits housing opportunities for Blacks by shrinking the market in which they make housing choices. In this sense, residential segregation leads to reduced housing opportunities for Blacks. Because of the high demand among Blacks for housing in neighborhoods with high proportions of Blacks, it should be expected that Blacks will be more crowded than Whites in their housing units and will be more likely to encounter landlords lacking the incentive to maintain properties. These patterns can be expected to increase as Blacks are increasingly separated from the White housing market.
An alternative explanation for the discrepancies in housing quality between Blacks and Whites is provided by Johnston (1982), who argued that increasing nationwide levels of homeownership, supported by Federal policies favorable to homeownership, have had detrimental effects on renters, who are disproportionately Black, poor, and young. He contends that the rents these groups can afford “are insufficient to provide a reasonable return to landlords, let alone cover the rising costs of maintenance” (Johnston, 1982: 184). Thus, as homeownership increases, the quality of rental housing diminishes for Blacks, because there is less incentive for landlords to maintain the rental properties that are available. In this way, it is reasonable to expect increasing levels of homeownership at the city level to also increase housing inadequacy for Blacks.
Pull Factor: Access to Shelter SpaceSome researchers have argued that homeless shelters perpetuate long-term homelessness and pull people out of inadequate, substandard housing into homelessness (Gounis, 1990; Jencks, 1994). Although Blacks have less access to high-quality affordable housing, they have greater access to shelter space. Baker (1994) found that shelters were more likely to be placed in communities with high percentages of Blacks, and Lee and Farrell (2004) found that shelters were more likely to be placed in communities with high percentages of minorities. Assuming equal preferences for the use of homeless services, closer proximity to homeless services can be hypothesized to increase the use of those services.
Because Blacks on average are located closer to homeless services, it is logical to hypothesize that precariously housed Blacks will use those services more and will be more likely to become part

39Cityscape
From Exclusion to Destitution: Race, Affordable Housing, and Homelessness
of the service-using homeless population than will precariously housed Whites. Whites who use homeless services will be more likely than Blacks using homeless services to have to move to use services or may end up not using any services because no services are available near where they became homeless. Distance barriers may serve to keep precariously housed White people doubled-up in the homes of friends and family or on the streets out of view of surveys of the service-using homeless population.
Data on prior residences, service locations, and socioeconomic characteristics of precariously housed and currently homeless people are needed to determine the causal effect of service location on service utilization. Unfortunately, such data do not exist. Working under the assumption that close proximity to homeless services decreases the need to migrate for such services, this study examines racial differences in migration for homeless services using data from the 1996 NSHAPC.
Data and MethodologyThis section addresses hypotheses, data, and methods used in Parts I and II of the research. Part I of the study, using data from the 1990 and 2000 Decennial Censuses and the 1997 AHS, analyzes the relationship between residential segregation and two measures of housing quality: housing inadequacy and overcrowding. Part II of the study, using data from the 1996 NSHAPC, analyzes the migration of Black and White homeless clients for homeless services.
Part I: Analysis of the Relation Between Residential Segregation and Blacks at Risk of HomelessnessPart I of the study analyzes the relationship between residential segregation and two housing out-comes thought to be risk factors for homelessness: housing inadequacy and overcrowding. It tests the effects of segregation on housing outcomes for Blacks through the following four hypotheses:
Hypothesis 1: As segregation increases, Blacks will be more likely than Whites to live in housing of inadequate quality.
Hypothesis 2: As segregation increases, Blacks will be more likely than Whites to live in housing that is crowded.
Hypothesis 3: As the affordable housing supply increases at the city level, housing inadequacy and crowding will decrease.
Hypothesis 4: As homeownership increases at the city level, Blacks living in more highly segre-gated areas will live in more inadequate and crowded housing than will Whites.
Controlling for affordable housing supply in testing hypothesis 3 and controlling for homeowner-ship rates in testing hypothesis 4 provide an opportunity to evaluate how policies targeted at increasing affordable housing supply and homeownership may influence the relationship between segregation and housing quality for Blacks.
Data for Part I come from three sources: the 1997 AHS National Public Use File, the 1990 Decen-nial Census, and the 2000 Decennial Census. The AHS (formerly the Annual Housing Survey)
40 Discovering Homelessness
Carter
began collecting data on the nation’s housing in 1973. Since 1981, it has collected national data every odd-numbered year. The U.S. Census Bureau conducts the survey for HUD. It returns to the same housing units every other year until a new sample is selected.
Most of the data for Part I of the study come from the AHS, including information on the adequacy and crowding of housing units and information on the household and household head, who is referred to as the householder in the AHS. Data from the AHS were merged by standard metropolitan statistical area (SMSA), with a common segregation index—the index of dissimilarity, affordable housing measures, and measures of homeownership calculated from the 1990 and 2000 Decennial Censuses and linearly interpolated to 1997 values.
A series of nested logistic regression models were run to test the four hypotheses predicting the log odds that a householder is living in an inadequate housing unit or an overcrowded housing unit. The dependent variables in the analyses are measures of housing inadequacy and overcrowding.
Housing Inadequacy. The housing inadequacy measure is constructed from the HUD housing inadequacy recode provided in the AHS Public Use File. A “1” on the housing inadequacy measure indicates that the housing unit is declared either severely inadequate or moderately inadequate by HUD standards and a “0” indicates that the housing unit is adequate. HUD defines a housing unit as severely inadequate if any of the following conditions exist:
1. The unit lacks complete plumbing facilities.
2. Three or more heating equipment breakdowns occurred lasting 6 hours or more in the last 90 days.
3. The unit has no electricity.
4. The electrical wiring is not concealed, working wall outlets are not present in every room, and fuses and breakers blew three or more times in the last 90 days.
5. Five or more of the following exist: outside water leaks, inside water leaks, holes in the floor, cracks wider than a dime in the walls, areas of peeling paint or plaster larger than 8 ½ x 11 inches, rodents seen recently in the unit.
6. All of the following exist: no working light fixtures or no light fixtures at all in public hallways; loose, broken or missing steps in common stairways; stair railing not firmly attached or no stair railings on stairs at all; three or more floors exist between the unit and the main entrance to the building and the building has no elevator.
A unit is moderately inadequate if it is not severely inadequate and any of the following conditions exist:
1. The unit lacks kitchen facilities.
2. Three or more toilet breakdowns occurred, lasting 6 hours or more in the last 90 days.
3. An unvented room heater is the main heating equipment.
41Cityscape
From Exclusion to Destitution: Race, Affordable Housing, and Homelessness
4. Three or four of the following exist: outside water leaks, inside water leaks, holes in the floor, cracks wider than a dime in the walls, areas of peeling paint or plaster larger than 8 ½ x 11 inches, rodents seen recently in unit.
5. Three of the following exist: no working fixtures or no light fixtures at all in public hallways; loose, broken, or missing steps in common stairways; stair railings not firmly attached; no stair railing on stairs at all.
6. Three or more floors exist between the unit and the main entrance to the building and the building has no elevator.
The unit is deemed adequate if it is neither severely nor moderately inadequate (ICF International, 1997).
Overcrowding. The overcrowding measure is a standard measure of housing density: the number of people per room.6 A unit is overcrowded if there is more than one person per room in the hous-ing unit (Ringheim, 1990). In the analyses, a housing unit is classified as “1” if it is overcrowded and as “0” if it is not.
The following independent variables from the AHS were used in the analyses: central-city location; rental status of the unit; public housing status; the race, age, and sex of the householder; the householder’s highest level of education; the household income; whether the household receives welfare income; and three region dummy variables (Northeast, Midwest, and South, with West serving as the reference group).
Residential segregation is measured by the index of dissimilarity at the metropolitan area level. In calculating the index of the dissimilarity, census tracts were used as proxies for neighborhoods. Massey and Denton (1993) identify the index as the standard measure of segregation. The index of dissimilarity “captures the degree to which blacks and whites are evenly spread among neighbor-hoods in a city…[and]… gives the percentage of blacks who would have to move to achieve an ‘even’ residential pattern—one where every neighborhood replicates the racial composition of the city” (Massey and Denton, 1993: 20). Indices of dissimilarity were obtained from the 1990 and 2000 Decennial Censuses at www.census.gov. Dissimilarity values for 1997 were estimated by linear interpolation, using the 1990 and 2000 Decennial Census data. The index of dissimilarity for the 132 SMSAs in this study range from a low of .23 to a high of .86 with a mean value of .64. The index was split into quartiles (Dissimilarity1, Dissimilarity2, Dissimilarity3, and Dissimilarity4) with the first dissimilarity quartile (Dissimilarity1) serving as the reference group in the analyses. The dissimilarity quartiles were interacted with the Black householder dummy variable to create the main variables of interest in the analyses (Black*Dissimilarity2, Black*Dissimilarity3, and Black*Dissimilarity4, with the interaction of Black with the first dissimilarity quartile serving as the reference group). The interaction terms represent the independent effect of Black headship compared with White headship within metropolitan areas with different levels of Black and White segregation.
6 Rooms include all finished rooms in the housing unit, including bedrooms, living rooms, dining rooms, kitchens, recreation rooms, permanently enclosed porches, lodgers’ rooms, and offices. Dining rooms must be separate to be counted. Bathrooms, laundry rooms, utility rooms, pantries, and other unfinished rooms are not counted.
42 Discovering Homelessness
Carter
Two housing costs measures are included in the analyses. The first measure is an indicator of rent burdens: the proportion of renters in the metropolitan area making under $10,000 who pay more than 35 percent of their income on rent. Housing is considered affordable when no more than 30 percent of income is spent on housing costs. This measure estimates the extent to which the lowest income renters have high housing burdens in a given metropolitan area. The measure was inter-polated for 1997 using data from the 1990 and 2000 Decennial Censuses. Although $10,000 was worth more in 1989 than it was in 1999, the $10,000 cutoff was used in both the 1990 and 2000 Decennial Censuses as the lowest income category for which rent-to-income ratios were calculated.
The second housing cost measure used in the analyses is the ratio of lowest rent units to lowest income households at the metropolitan area level. Such measures have been used in other research to indicate the extent of the affordable housing crunch (Jencks, 1994; Wright, 1989). With this measure, this study estimates the low-income-housing ratio for those most at risk of becoming homeless—those living below 50 percent of the poverty threshold. In 1990, affordable rents for a family of three living below 50 percent of the poverty threshold were approximately $150 a month or less. In 2000, affordable rents for a family of three living below 50 percent of the poverty threshold were approximately $200 a month or less. To estimate the number of households living below 50 percent of the poverty threshold, the number of individuals living below 50 percent of the poverty threshold was divided by 3. This approach is similar to that used by Wright (1989) to construct affordable housing ratios for households at the poverty line. To calculate the affordability measure, the number of lowest rent units was divided by the number of households living below 50 percent of the poverty threshold. Higher values on the measure indicate larger numbers of affordable units in relation to households below 50 percent of the poverty threshold, and lower values on the measure indicate fewer numbers of units in relation to households below 50 percent of the poverty threshold. The measure was calculated for both 1990 and 2000 and interpolated to estimate a value for 1997.
Homeownership was measured using the proportion of homeowners in each metropolitan area in 1997. The proportion was interpolated from proportions reported in the 1990 and 2000 Decennial Censuses.
Most of the independent variables in the analysis are dummy variables. The central city variable is coded “1” for households in the central city and “0” for those in suburbs or rural areas. The rental status variable is coded “1” for households who rent their units and “0” for households who own their units. The public housing variable is coded “1” if the housing unit is public housing and “0” if it is privately owned or rented. The Black headship variable is coded “1” if the householder (otherwise known as the household head) is Black and “0” if the householder is White. The female headship variable is coded “1” if the householder is female and “0” if the householder is male. The welfare recipiency variable is coded “1” if the householder receives welfare and “0” if the householder does not receive welfare. The highest level of education attained by the householder is split into five dummy variables: 8th Grade or Less, 9th to 12th Grade, High School, Some College, College, and More than College (with More than College serving as the reference group). Region is split into four dummy variables: Northeast, Midwest, South, and West, with West serving as the reference group. Age is a continuous variable measured in years, and household income is a categorical variable with $125,000 or more serving as the reference category.
43Cityscape
From Exclusion to Destitution: Race, Affordable Housing, and Homelessness
Part II: Analysis of Migration for Homeless ServicesPart II of the research tests the following hypothesis.
Hypothesis 5: Black homeless clients are less likely than White homeless clients to migrate for homeless services.
Data from the NSHAPC were used to test this hypothesis. The NSHAPC, conducted in 1996, was designed to be a nationally representative sample of both homeless programs and the clients who use them. Included in the NSHAPC were 76 primary sampling areas, including “the 28 largest met-ropolitan statistical areas in the United States; 24 small and medium-sized metropolitan statistical areas, selected at random to be representative of geographical regions (Northeast, South, Midwest, West) and size; and 24 rural areas (groups of counties)” (Burt et al., 1999: 3). The study collected information on programs within these sampling areas and sampled homeless clients within these programs. A homeless program had to have a focus on serving homeless people (although, not necessarily only homeless people), have direct service, and be within the geographical boundaries of the sampling area (Burt et al., 1999).
Homeless clients were sampled from within a sample of the homeless programs, taking into account program type and size (Burt et al., 1999). A client is defined as someone who uses a program and thus includes both homeless and nonhomeless clients. Between 6 and 8 clients were selected randomly at around 700 site visits, resulting in a total of 4,207 client interviews. Interviews were conducted by trained Census interviewers and, in most cases, the interview was held at the program location. Clients received $10 for participating in the study (Burt et al., 1999).
To assess the effect of differential access to homeless services, this study compares the migration patterns of the Blacks homeless clients to the patterns of White homeless clients. The NSHAPC contains data on migration patterns. If access to homeless services is more of a factor in Black homelessness, we should expect Black homeless people (especially within the inner city) to migrate less than White homeless people for homeless services, assuming equal preferences for the use of homeless services. Nested logistic regression models were run to test hypothesis 5. The dependent variable in the analysis is the log odds that a homeless client has migrated for homeless services. Independent variables in the analysis include race, education, age, present mental health problems, present alcohol problems, present drug problems, incarceration at some point during lifetime, first-time homelessness, and central-city origin location.
Findings
This section addresses major findings from Parts I and II of the study. Part I discusses descriptive statistics from the AHS on differences in housing quality for Blacks and Whites and then presents multivariate models predicting housing inadequacy and overcrowding. Part II discusses descrip-tive statistics on geographic location of the Black homeless population, the migration pattern of homeless clients, and the duration and transiency of homeless spells and then presents multivariate models predicting migration for homeless services.
AHS Descriptive Statistics
Before turning to the multivariate analyses, it is necessary to have a sense of the general patterns present in our variables of interest. Exhibit 1 presents descriptive statistics by race for the full sample
44 Discovering Homelessness
Carter
and for those living in central cities. Hispanic householders and householders who identified their race as something other than Black or White were excluded from the analyses because (1) the segregation indices used in the analyses represent Black and White segregation, not Hispanic and White non-Hispanic segregation; (2) research suggests that the relationship between segregation and housing quality is different for Hispanics (Baker, 1994); and (3) this study’s primary aim was the analysis of the relationship between segregation and housing outcomes for Blacks. Regarding Blacks and Whites overall, housing inadequacy, overcrowding, and homeownership results mirror those found in previous studies. More than the majority of both Blacks and Whites live in adequate housing. Although 13 percent of Blacks live in inadequate housing, only 5.9 percent of Whites live in similar conditions. Blacks are more likely than Whites to live in overcrowded housing (4.5 percent for Blacks compared with 2.3 percent for Whites). Whites are also more likely to own their homes (69.4 percent) than are Blacks (43.1 percent). Although more than one-half (55.9 percent) of Blacks live in central-city areas, only a little more than one-fourth (25.9 percent) of Whites live in the central city. More than one-half (53.9 percent) of Black householders are female, but only 31.1 percent of White householders are female. The percentage of Blacks on welfare is more than three times the percentage of Whites on welfare (14.3 percent versus 4 percent). Blacks have higher percentages of householders whose highest educational attainment is less than college. White householders are almost two times as likely as Blacks to attain college as the highest level of education (17 percent compared with 9.9 percent, respectively). In the overall sample, households with White householders have a mean income of $46,855, and those with Black householders have a mean income of $30,123. The mean age of White householders is 48.7 years, and the mean age of Black householders is 45.2 years.
There is reason to expect housing quality to be worse in central-city locations than outside central-city locations due to the concentration of poverty within inner city areas. Because Blacks are more likely than Whites to live in central-city areas, we might expect them to be more likely to live in lower quality housing. Do Whites living in similar areas also experience the same housing quality problems? Focusing on the central city section of exhibit 1, we see that both Blacks and Whites have higher percentages living in inadequate housing, but Blacks still have higher percentages in inadequate housing than Whites have (13.3 percent versus 8.2 percent). The crowding measure is very similar for Blacks and Whites in the central city, with 4.6 percent of Blacks in crowded hous-ing and 3.6 percent of Whites in housing that is crowded. Smaller percentages of both Blacks and Whites own homes in the central city, but Whites maintain their lead over Blacks with more than one-half (53.8 percent) owning homes compared with only 34.8 percent of Blacks. Still, more than one-half of Black householders are female (56.8 percent), but only 36.5 percent of White house-holders are female. The percentage of Blacks and Whites receiving welfare in the central city is almost the same as in the overall sample. The percentage of Blacks living in public housing is four times the percentage of Whites living in public housing (9.1 versus 1.9 percent). Much like in the overall sample, Blacks have higher percentages than Whites who have finished less than college, but more than two times the percentage of Whites attain college as their highest level of education compared with Blacks (19.5 versus 9.3 percent). In the central city, households headed by White householders have a mean income of $43,152 and households headed by Black householders have a mean income of $27,452. The mean age of White householders is 47 years and the mean age of Black householders is 45.2 years.

45Cityscape
From Exclusion to Destitution: Race, Affordable Housing, and Homelessness
In both the overall sample and in the central city sample, Blacks experience housing inadequacy and overcrowding at higher levels than Whites do. Socioeconomically, Black householders are less likely than their White counterparts to receive college degrees and are more likely to earn less. Blacks are more likely than Whites to live in public housing, be on welfare, and live in female-headed households. Although they do suggest racial differences in housing quality, these descrip-tive analyses do not explain the relationship between segregation and race in determining housing outcomes for Blacks. The next section of this article examines these relationships.
AHS Multivariate Analyses
This section discusses the results of logistic regression models predicting housing inadequacy (exhibit 2) and overcrowding (exhibit 4). The exhibits present models for Black and White owners and renters in the 1997 AHS national sample. All models were significant at p < .001 and all
Exhibit 1
Race White Black
Descriptive Statistics by Race and Central-City Location (weighted percentages)
Full SampleLiving in inadequate housing 5.9 13.0Living in overcrowded housing 2.3 4.5Homeowner 69.4 43.1Central city 25.9 55.9In public housing 1.1 6.9Female householder 31.1 53.9On welfare 4.0 14.3
EducationLess than 8th grade 6.7 9.09th grade to 12th grade 10.1 17.6High school 30.0 31.0Some college 26.8 28.1College 17.0 9.9Household income (mean) $46,855 $30,123Age of householder (mean) 48.7 45.2
Central CityLiving in inadequate housing 8.2 13.3Living in overcrowded housing 3.6 4.6Homeowner 53.8 34.8In public housing 1.9 9.1Female householder 36.5 56.8On welfare 5.4 16.7
EducationLess than 8th grade 7.8 8.89th grade to 12th grade 10.1 18.7High school 23.8 31.1Some college 27.8 28.9College 19.5 9.3Household income (mean) $43,152 $27,452Age of householder (mean) 47.0 45.2
Source: 1997 American Housing Survey

46 Discovering Homelessness
CarterE
xhib
it 2
Pre
dic
tor
Mo
del
1M
od
el 2
Mo
del
3M
od
el 4
Mo
del
5M
od
el 6
Mo
del
7
Co
- ef
fici
ent
Od
ds
Rat
ioC
o-
effi
cien
tO
dd
s R
atio
Co
- ef
fici
ent
Od
ds
Rat
ioC
o-
effi
cien
tO
dd
s R
atio
Co
- ef
fici
ent
Od
ds
Rat
ioC
o-
effi
cien
tO
dd
s R
atio
Co
- ef
fici
ent
Od
ds
Rat
io
Res
ults
of L
ogis
tic R
egre
ssio
n M
odel
s P
red
ictin
g H
ousi
ng In
adeq
uacy
(1 o
f 4)
Ho
useh
old
er
Cha
ract
eris
tics
Bla
ck (v
ersu
s W
hite
).3
64
(.001
)***
1.43
9.0
71
(.002
)***
1.07
4.0
74
(.004
)***
1.07
7.0
74
(.004
)***
1.07
7.0
77
(.004
)***
1.08
0.0
27
(.004
)***
1.02
7.0
20
(.004
)***
1.02
0
Age
– .0
11
(.00
0)**
*.9
89–
.012
(.0
00)**
*.9
88–
.012
(.0
00)**
*.9
88–
.012
(.0
00)**
*.9
88–
.012
(.0
00)**
*.9
88–
.012
(.0
00)**
*.9
88–
.012
(.0
00)**
*.9
88
Fem
ale
– .0
27
(.001
)***
.973
.076
(.0
01)**
*1.
079
.077
(.0
01)**
*1.
080
.077
(.0
01)**
*1.
080
.076
(.0
01)**
*1.
079
.072
(.0
01)**
*1.
075
.071
(.0
01)**
*1.
074
So
cio
eco
nom
ic S
tatu
s
Hou
seho
lder
’s
educ
atio
n (v
ersu
s m
ore
than
col
lege
)
8th
grad
e or
less
.905
(.0
02)**
*2.
472
.655
(.0
03)**
*1.
925
.655
(.0
03)**
*1.
925
.655
(.0
03)**
*1.
925
.648
(.0
03)**
*1.
912
.669
(.0
03)**
*1.
952
.667
(.0
03)**
*1.
948
9th
to 1
2th
grad
e.4
694
(.002
)***
1.59
9.3
25
(.003
)***
1.38
4.3
24
(.003
)***
1.38
3.3
24
(.003
)***
1.38
3.3
20
(.003
)***
1.37
7.3
71
(.003
)***
1.44
9.3
68
(.003
)***
1.44
5
Hig
h sc
hool
.078
(.0
02)**
*1.
081
– .0
10
(.003
)***
.990
– .0
11
(.003
)***
.989
– .0
11
(.003
)***
.989
– .0
13
(.003
)***
.987
.028
(.0
03)**
*1.
028
.025
(.0
03)**
*1.
025
Som
e co
llege
.123
(.0
02)**
*1.
131
.022
(.0
03)**
*1.
022
.019
(.0
03)**
*1.
019
.019
(.0
03)**
*1.
019
.019
(.0
03)**
*1.
019
.042
(.0
03)**
*1.
043
.040
(.0
03)**
*1.
041
Col
lege
– .1
58
(.002
)***
.854
– .3
26
(.003
)***
.722
– .3
28
(.003
)***
.720
– .3
28
(.003
)***
.720
– .3
28
(.003
)***
.720
– .3
11
(.003
)***
.733
– .3
12
(.003
)***
.732

47Cityscape
From Exclusion to Destitution: Race, Affordable Housing, and Homelessness
Exh
ibit
2
Pre
dic
tor
Mo
del
1M
od
el 2
Mo
del
3M
od
el 4
Mo
del
5M
od
el 6
Mo
del
7
Co
- ef
fici
ent
Od
ds
Rat
ioC
o-
effi
cien
tO
dd
s R
atio
Co
- ef
fici
ent
Od
ds
Rat
ioC
o-
effi
cien
tO
dd
s R
atio
Co
- ef
fici
ent
Od
ds
Rat
ioC
o-
effi
cien
tO
dd
s R
atio
Co
- ef
fici
ent
Od
ds
Rat
io
Res
ults
of L
ogis
tic R
egre
ssio
n M
odel
s P
red
ictin
g H
ousi
ng In
adeq
uacy
(2 o
f 4)
Hou
seho
ld in
com
e (v
ersu
s $1
25,0
00+
)
Less
tha
n $5
,000
.794
(.0
04)**
*2.
212
.538
(.0
05)**
*1.
713
.533
(.0
05)**
*1.
704
.533
(.0
05)**
*1.
704
.536
(.0
05)**
*1.
709
.574
(.0
05)**
*1.
775
.572
(.0
05)**
*1.
772
$5,0
00–$
9,99
9.8
40
(.004
)***
2.31
6.3
56
(.005
)***
1.42
8.3
55
(.005
)***
1.42
6.3
55
(.005
)***
1.42
6.3
58
(.005
)***
1.43
0.3
89
(.005
)***
1.47
6.3
87
(.005
)***
1.47
3
$10,
000–
$14,
999
.733
(.0
04)**
*2.
081
.507
(.0
05)**
*1.
660
.506
(.0
05)**
*1.
659
.506
(.0
05)**
*1.
659
.508
(.0
05)**
*1.
662
.534
(.0
05)**
*1.
706
.530
(.0
05)**
*1.
699
$15,
000–
$19,
999
.568
(.0
04)**
*1.
765
.372
(.0
05)**
*1.
451
.368
(.0
05)**
*1.
445
.368
(.0
05)**
*1.
445
.371
(.0
05)**
*1.
449
.392
(.0
05)**
*1.
480
.388
(.0
05)**
*1.
474
$20,
000–
$29,
999
.477
(.0
04)**
*1.
611
.240
(.0
05)**
*1.
271
.239
(.0
05)**
*1.
270
.239
(.0
05)**
*1.
270
.242
(.0
05)**
*1.
274
.277
(.0
05)**
*1.
319
.273
(.0
05)**
*1.
314
$30,
000–
$39,
999
.398
(.0
04)**
*1.
489
.259
(.0
05)**
*1.
296
.256
(.0
05)**
*1.
292
.256
(.0
05)**
*1.
292
.259
(.0
05)**
*1.
296
.261
(.0
05)**
*1.
298
.259
(.0
05)**
*1.
296
$40,
000–
$49,
999
.271
(.0
04)**
*1.
311
– .0
88
(.005
)***
.916
– .0
90
(.005
)***
.914
– .0
90
(.005
)***
.914
– .0
88
(.005
)***
.916
– .0
83
(.005
)***
.920
– .0
87
(.005
)***
.917
$50,
000–
$74,
999
.106
(.0
04)**
*1.
112
.048
(.0
05)**
*1.
049
.046
(.0
05)**
*1.
047
.046
(.0
05)**
*1.
047
.047
(.0
05)**
*1.
048
.050
(.0
05)**
*1.
051
.047
(.0
05)**
*1.
048
$75,
000–
$99,
999
.223
(.0
04)**
*1.
250
.302
(.0
05)**
*1.
353
.298
(.0
05)**
*1.
347
.298
(.0
05)**
*1.
347
.298
(.0
05)**
*1.
347
.302
(.0
05)**
*1.
353
.298
(.0
05)**
*1.
347
$100
,000
–$12
4,99
9–
.112
(.0
04)**
*.8
94–
.201
(.0
06)**
*.8
18–
.205
(.0
06)**
*.8
15–
.205
(.0
06)**
*.8
15.2
05
(.006
)***
1.22
8–
.226
(.0
06)**
*.7
98–
.229
(.0
06)**
*.7
95
Rec
eive
s w
elfa
re.2
15
(.002
)***
1.24
0.1
61
(.002
)***
1.17
5.1
64
(.002
)***
1.17
8.1
64
(.002
)***
1.17
8.1
64
(.002
)***
1.17
8.1
66
(.002
)***
1.18
1.1
68
(.002
)***
1.18
3

48 Discovering Homelessness
Carter
Loca
tio
n (v
ersu
s su
bur
b a
nd r
ural
)
Cen
tral
city
.209
(.0
01)**
*1.
232
.481
(.0
01)**
*1.
618
.477
(.0
01)**
*1.
611
.476
(.0
01)**
*1.
610
.476
(.0
01)**
*1.
610
.312
(.0
01)**
*1.
366
.311
(.0
01)**
*1.
365
Typ
e o
f U
nit
Ow
ned
(ver
sus
rent
ed o
r no
ren
t)–
.719
(.0
01)**
*.4
87–
.891
(.0
02)**
*.4
10–
.890
(.0
02)**
*.4
11–
.890
(.0
02)**
*.4
11–
.890
(.0
02)**
*.4
11–
.802
(.0
02)**
*.4
48–
.803
(.0
02)**
*.4
48
Pub
lic–
.507
(.0
03)**
*.6
02–
.116
(.0
03)**
*.8
90–
.123
(.0
03)**
*.8
84–
.123
(.0
03)**
*.8
84–
.119
(.0
03)**
*.8
88–
.151
(.0
03)**
*.8
60–
.147
(.0
03)**
*.8
63
Reg
ion
(ver
sus
Wes
t)
Nor
thea
st.1
71
(.001
)***
1.18
6.1
64
(.002
)***
1.17
8.1
64
(.002
)***
1.17
8.1
70
(.003
)***
1.18
5.2
45
(.003
)***
1.27
8.1
95
(.003
)***
1.21
5.2
68
(.003
)***
1.30
7
Mid
wes
t–
.064
(.0
01)**
*.9
38–
.120
(.0
02)**
*.8
87–
.123
(.0
02)**
*.8
84–
.116
(.0
03)**
*.8
90–
.049
(.0
03)**
*.9
52.4
67
(.003
)***
1.59
5.5
28
(.003
)***
1.69
6
Sou
th.3
22
(.001
)***
1.38
0.0
22
(.002
)***
1.02
2.0
33
(.002
)***
1.03
4.0
35
(.002
)***
1.03
6.0
68
(.002
)***
1.07
0.2
70
(.002
)***
1.31
0.2
96
(.002
)***
1.34
4
Seg
reg
atio
n (v
ersu
s D
issi
mila
rity
1)
Dis
sim
ilarit
y2–
.023
(.0
02)**
*.9
77.0
09
(.002
)***
1.00
9.0
09
(.002
)***
1.00
9.0
06
(.002
)***
1.00
6–
.192
(.0
02)**
*.8
25–
.174
(.0
02)**
*.8
40
Dis
sim
ilarit
y3.0
68
(.002
)***
1.07
0.0
83
(.002
)***
1.08
7.0
82
(.002
)***
1.08
5.0
57
(.002
)***
1.05
9–
.144
(.0
02)**
*.8
66–
.136
(.0
02)**
*.8
73
Dis
sim
ilarit
y4.2
30
(.003
)***
1.25
9.1
86
(.003
)***
1.20
4.1
83
(.003
)***
1.20
1.1
32
(.003
)***
1.14
1–
.395
(.0
03)**
*.6
74–
.412
(.0
03)**
*.6
62
Exh
ibit
2
Pre
dic
tor
Mo
del
1M
od
el 2
Mo
del
3M
od
el 4
Mo
del
5M
od
el 6
Mo
del
7
Co
- ef
fici
ent
Od
ds
Rat
ioC
o-
effi
cien
tO
dd
s R
atio
Co
- ef
fici
ent
Od
ds
Rat
ioC
o-
effi
cien
tO
dd
s R
atio
Co
- ef
fici
ent
Od
ds
Rat
ioC
o-
effi
cien
tO
dd
s R
atio
Co
- ef
fici
ent
Od
ds
Rat
io
Res
ults
of L
ogis
tic R
egre
ssio
n M
odel
s P
red
ictin
g H
ousi
ng In
adeq
uacy
(3 o
f 4)

49Cityscape
From Exclusion to Destitution: Race, Affordable Housing, and Homelessness
Exh
ibit
2
Pre
dic
tor
Mo
del
1M
od
el 2
Mo
del
3M
od
el 4
Mo
del
5M
od
el 6
Mo
del
7
Co
- ef
fici
ent
Od
ds
Rat
ioC
o-
effi
cien
tO
dd
s R
atio
Co
- ef
fici
ent
Od
ds
Rat
ioC
o-
effi
cien
tO
dd
s R
atio
Co
- ef
fici
ent
Od
ds
Rat
ioC
o-
effi
cien
tO
dd
s R
atio
Co
- ef
fici
ent
Od
ds
Rat
io
Res
ults
of L
ogis
tic R
egre
ssio
n M
odel
s P
red
ictin
g H
ousi
ng In
adeq
uacy
(4 o
f 4)
*p <
.05.
**p
< .0
1. *
**p
< .0
01.
Not
es: C
oeffi
cien
t = R
egre
ssio
n C
oeffi
cien
t. S
tand
ard
erro
rs a
re in
par
enth
eses
.
Sou
rce:
199
7 A
mer
ican
Hou
sing
Sur
vey;
199
0 D
ecen
nial
Cen
sus;
200
0 D
ecen
nial
Cen
sus
Bla
ck*D
issi
mila
rity2
– .1
32
(.005
)***
.876
– .1
31
(.005
)***
.877
– .1
38
(.005
)***
.871
– .0
47
(.005
)***
.954
– .0
36
(.005
)***
.965
Bla
ck*D
issi
mila
rity3
– .0
57
(.005
)***
.945
– .0
56
(.005
)***
.946
– .0
60
(.005
)***
.942
.094
(.0
05)**
*1.
099
.098
(.0
05)**
*1.
103
Bla
ck*D
issi
mila
rity4
.131
(.0
05)**
*1.
140
.132
(.0
05)**
*1.
141
.128
(.0
05)**
*1.
137
.184
(.0
05)**
*1.
202
.193
(.0
05)**
*1.
213
Cit
y Le
vel H
ous
ing
C
hara
cter
isti
cs
Pro
por
tion
of lo
w-
inco
me
resi
den
ts w
ith
high
ren
t b
urd
en
.061
(.0
16)**
*1.
063
– 1.
142
(.016
)***
.319
Ext
rem
e lo
w-i
ncom
e ho
usin
g ra
tio–
.539
(.0
11)**
*.5
83.2
71
(.011
)***
1.31
1
Pro
por
tion
owne
r–
3.47
1 (.0
08)**
*.0
31–
3.39
6 (.0
08)**
*.0
34
Con
stan
t–
2.62
3 (.0
03)**
*.0
73–
2.36
8 (.0
05)**
*.0
94–
2.36
4 (.0
05)**
*.0
94–
2.41
6 (.0
14)**
*.0
89–
2.28
1 (.0
05)**
*.1
02.7
50
(.016
)***
2.11
7–
.317
(.0
07)**
*.7
28
– 2
log
likel
ihoo
d40
,049
,277
18,5
19,3
3618
,514
,371
18,5
14,3
5518
,511
,999
18,3
27,6
7918
,332
,095
Mod
el c
hi-s
qua
re3,
308,
855.
601
1,64
7,65
4.91
31,
652,
620.
388
1,65
2,63
5.51
11,
654,
992.
017
1,83
9,31
1.61
71,
834,
896.
138
Deg
rees
of f
reed
om25
2831
3232
3333
Tota
l cas
es35
,007
15,7
0015
,700
15,7
0015
,700
15,7
0015
,700

50 Discovering Homelessness
Carter
coefficients were significant at p < .05 (most were significant at p < .001). Regression coefficients are presented in the exhibits along with standard errors and odds ratios. Odds ratios, which are exponentiated regression coefficients, are discussed in the text.
Exhibit 2 shows that Black householders were 1.439 times more likely than White householders to live in inadequate housing, after controlling for other factors (model 1). Those living in central-city areas were 1.232 times more likely to live in an inadequate unit than were those living outside central-city areas. Housing inadequacy declines with increases in education, with householders who have an eighth grade education or less being 2.472 times more likely to live in an inadequate unit than householders with more than a college education. Owners are about one-half as likely as renters to live in an inadequate unit. Model 2 introduces the dummy dissimilarity measures into the model. Higher segregation rates are associated with higher levels of housing inadequacy. Units in the highest segregation quartile are 1.259 times more likely be inadequate compared with units in the lowest segregation quartile.
Black segregation interaction terms are added to model 3. At ever-increasing levels of segregation, housing inadequacy increases for the overall sample. In exhibit 3, coefficients from model 3 were used to graph the predicted probability of living in an inadequate unit for Blacks and Whites. As we see, at low and medium levels of segregation, Blacks and Whites have similar predicted probabilities of living in inadequate units. In the highest segregation quartile, Blacks are more likely than Whites to live in inadequate units, providing some support to hypothesis 1 that high levels of segregation decrease Black housing quality. After controlling for background factors, we find that being a Black householder, living in a more segregated metropolitan area, and being a Black householder living in a highly segregated metropolitan area increase the odds that of living
0
0.005
0.01
0.015
0.02
0.025
0.03
Low Segregation Level Medium Segregation Level High Segregation Level
Black White
Exhibit 3
Predicted Probability of Living in an Inadequate Unit
Note: In calculating the predicted probabilities, means were used where possible. Modal values were used for dichotomous control variables. This method likely produces conservative estimates, because Blacks are more likely than Whites to rent, live in central cities, and have lower incomes, characteristics that put them at greater risk of living in inadequate units.

51Cityscape
From Exclusion to Destitution: Race, Affordable Housing, and Homelessness
in an inadequate dwelling. This finding suggests that segregation does not affect Black and White differences in housing adequacy until segregation rates are in the highest quartile.
Living in the central city also increases the odds of living in an inadequate dwelling as does renting the housing unit. This finding suggests that those renting units may have less control over the maintenance of their units, thus resulting in a greater likelihood of inadequately maintained units. Householders receiving welfare were more likely to live in inadequate units, as were householders with less than a high school education. Compared with those living in the West, those living in the Northeast were more likely to live in inadequate units and those in the Midwest and South were less likely. Older householders had lower odds than younger householders of living in inadequate dwellings. Households with incomes of less than $5,000 were most likely to live in inadequate housing. Income had a nonlinear effect on housing inadequacy. The nonlinear effect of income is perhaps due to cost-of-living differences in different metropolitan areas not accounted for in the models. Across different metropolitan areas, the same income has different purchasing power, dependent on differences in housing costs.
In models 4 and 5, affordability measures are introduced into the models, testing the first part of hypothesis 3. As expected, high rent burdens increase the likelihood of living in an inadequate unit and a higher ratio of lowest rent units to lowest income households decreases the likelihood of living in an inadequate unit. Adding the ratio measure reduces, but does not erase, the effects of segregation on housing inadequacy for the overall sample or for Blacks in particular. This finding suggests that increasing the supply of affordable housing will mitigate but not remove the effects of segregation on the individual housing situations of poor Blacks living in the most segregated metropolitan areas.
In models 6 and 7, the effects of increasing metropolitan area homeownership on housing inadequacy are tested, the first part of hypothesis 4. Findings indicate that householders living in metropolitan areas are less likely to live in an inadequate unit if area homeownership rates are high. Adding homeownership rates to the model reverses the effects of segregation on housing inadequacy. The addition of homeownership rates reduces the effect of Black headship on housing inadequacy, but it does not erase the effect. The coefficient for Black headship decreases from .077 to .027 when homeownership rates are added. The addition of homeownership rates reduces the odds of a Black-headed housing unit being inadequate from 1.08 times to 1.027 times the odds of a White-headed housing unit being inadequate. This finding suggests that policies that promote homeownership may decrease the likelihood of living in an inadequate unit for the overall popula-tion, but this effect may not carry over to the Black population to the same extent it affects the White population. Surprisingly, controlling for homeownership rates reverses the effects of higher affordable housing supply on housing inadequacy.
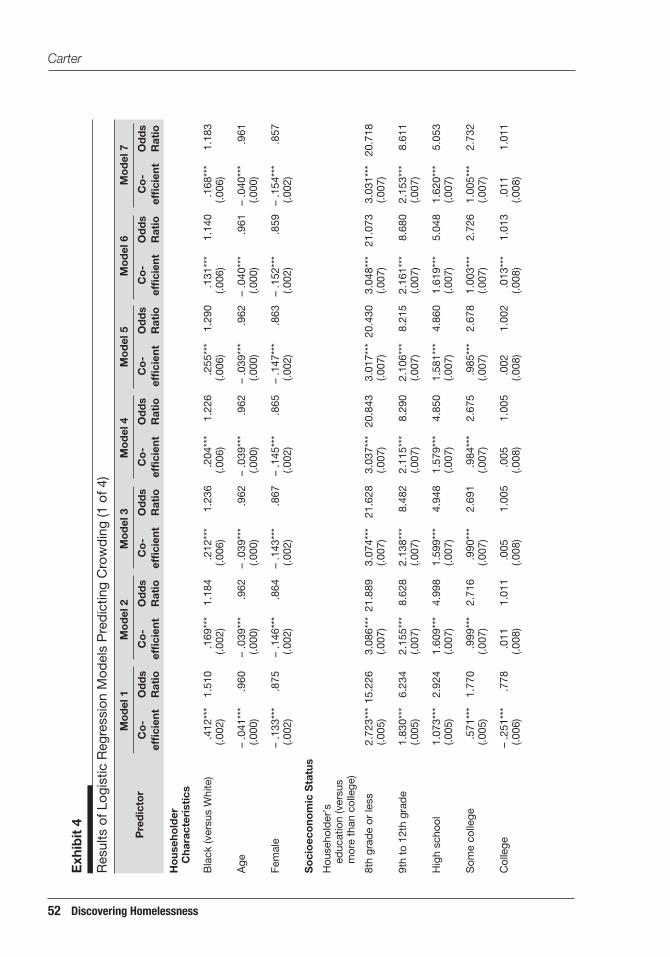
Regarding overcrowding, model 1 (in exhibit 4) shows that Black householders are 1.51 times more likely than White householders to live in crowded units, even after controlling for other factors. Increasing education level greatly decreases the likelihood of living in crowded housing, with householders who have an 8th grade education or less being 15.226 times more likely to live in a crowded housing unit compared with householders with more than a college education. Owners were about one-half times as likely as renters to live in a crowded unit. Those living in public housing were .752 times as likely as those not living in public housing to be living in
52 Discovering Homelessness
Carter
Ho
useh
old
er
Cha
ract
eris
tics
Bla
ck (v
ersu
s W
hite
).4
12
(.002
)***
1.51
0.1
69
(.002
)***
1.18
4.2
12
(.006
)***
1.23
6.2
04
(.006
)***
1.22
6.2
55
(.006
)***
1.29
0.1
31
(.006
)***
1.14
0.1
68
(.006
)***
1.18
3
Age
– .0
41
(.000
)***
.960
– .0
39
(.000
)***
.962
– .0
39
(.000
)***
.962
– .0
39
(.000
)***
.962
– .0
39
(.000
)***
.962
– .0
40
(.000
)***
.961
– .0
40
(.000
)***
.961
Fem
ale
– .1
33
(.002
)***
.875
– .1
46
(.002
)***
.864
– .1
43
(.002
)***
.867
– .1
45
(.002
)***
.865
– .1
47
(.002
)***
.863
– .1
52
(.002
)***
.859
– .1
54
(.002
)***
.857
So
cio
eco
nom
ic S
tatu
s
Hou
seho
lder
’s
educ
atio
n (v
ersu
s m
ore
than
col
lege
)
8th
grad
e or
less
2.72
3 (.0
05)**
*15
.226
3.08
6 (.0
07)**
*21
.889
3.07
4 (.0
07)**
*21
.628
3.03
7 (.0
07)**
*20
.843
3.01
7 (.0
07)**
*20
.430
3.04
8 (.0
07)**
*21
.073
3.03
1 (.0
07)**
*20
.718
9th
to 1
2th
grad
e1.
830
(.005
)***
6.23
42.
155
(.007
)***
8.62
82.
138
(.007
)***
8.48
22.
115
(.007
)***
8.29
02.
106
(.007
)***
8.21
52.
161
(.007
)***
8.68
02.
153
(.007
)***
8.61
1
Hig
h sc
hool
1.07
3 (.0
05)**
*2.
924
1.60
9 (.0
07)**
*4.
998
1.59
9 (.0
07)**
*4.
948
1.57
9 (.0
07)**
*4.
850
1.58
1 (.0
07)**
*4.
860
1.61
9 (.0
07)**
*5.
048
1.62
0 (.0
07)**
*5.
053
Som
e co
llege
.571
(.0
05)**
*1.
770
.999
(.0
07)**
*2.
716
.990
(.0
07)**
*2.
691
.984
(.0
07)**
*2.
675
.985
(.0
07)**
*2.
678
1.00
3 (.0
07)**
*2.
726
1.00
5 (.0
07)**
*2.
732
Col
lege
– .2
51
(.006
)***
.778
.011
(.0
08)
1.01
1.0
05
(.008
)1.
005
.005
(.0
08)
1.00
5.0
02
(.008
)1.
002
.013
(.0
08)**
*1.
013
.011
(.0
08)
1.01
1
Exh
ibit
4
Pre
dic
tor
Mo
del
1M
od
el 2
Mo
del
3M
od
el 4
Mo
del
5M
od
el 6
Mo
del
7
Co
- ef
fici
ent
Od
ds
Rat
ioC
o-
effi
cien
tO
dd
s R
atio
Co
- ef
fici
ent
Od
ds
Rat
ioC
o-
effi
cien
tO
dd
s R
atio
Co
- ef
fici
ent
Od
ds
Rat
ioC
o-
effi
cien
tO
dd
s R
atio
Co
- ef
fici
ent
Od
ds
Rat
io
Res
ults
of L
ogis
tic R
egre
ssio
n M
odel
s P
red
ictin
g C
row
din
g (1
of 4
)

53Cityscape
From Exclusion to Destitution: Race, Affordable Housing, and Homelessness
Exh
ibit
4
Pre
dic
tor
Mo
del
1M
od
el 2
Mo
del
3M
od
el 4
Mo
del
5M
od
el 6
Mo
del
7
Co
- ef
fici
ent
Od
ds
Rat
ioC
o-
effi
cien
tO
dd
s R
atio
Co
- ef
fici
ent
Od
ds
Rat
ioC
o-
effi
cien
tO
dd
s R
atio
Co
- ef
fici
ent
Od
ds
Rat
ioC
o-
effi
cien
tO
dd
s R
atio
Co
- ef
fici
ent
Od
ds
Rat
io
Res
ults
of L
ogis
tic R
egre
ssio
n M
odel
s P
red
ictin
g C
row
din
g (2
of 4
)
Hou
seho
ld in
com
e (v
ersu
s $1
25,0
00+
)
Less
tha
n $5
,000
– .0
84
(.007
)***
.919
.550
(.0
13)**
*1.
733
.544
(.0
13)**
*1.
723
.540
(.0
13)**
*1.
716
.564
(.0
13)**
*1.
758
.566
(.0
13)**
*1.
761
.584
(.0
13)**
*1.
793
$5,0
00–$
9,99
9–
.135
(.0
07)**
*.8
74.2
74
(.013
)***
1.31
5.2
88
(.013
)***
1.33
4.2
83
(.013
)***
1.32
7.3
11
(.013
)***
1.36
5.3
05
(.013
)***
1.35
7.3
25
(.013
)***
1.38
4
$10,
000–
$14,
999
.213
(.0
07)**
*1.
237
.942
(.0
13)**
*2.
565
.939
(.0
12)**
*2.
557
.931
(.0
12)**
*2.
537
.954
(.0
12)**
*2.
596
.949
(.0
12)**
*2.
583
.966
(.0
12)**
*2.
627
$15,
000–
$19,
999
.322
(.0
07)**
*1.
380
1.28
8 (.0
12)**
*3.
626
1.27
6 (.0
12)**
*3.
582
1.27
0 (.0
12)**
*3.
561
1.30
6 (.0
12)**
*3.
691
1.28
0 (.0
12)**
*3.
597
1.30
6 (.0
12)**
*3.
691
$20,
000–
$29,
999
.525
(.0
07)**
*1.
690
1.36
1 (.0
12)**
*3.
900
1.36
2 (.0
12)**
*3.
904
1.35
6 (.0
12)**
*3.
881
1.38
7 (.0
12)**
*4.
003
1.39
2 (.0
12)**
*4.
023
1.41
5 (.0
12)**
*4.
116
$30,
000–
$39,
999
.630
(.0
07)**
*1.
878
1.39
0 (.0
12)**
*4.
015
1.39
4 (.0
12)**
*4.
031
1.39
7 (.0
12)**
*4.
043
1.41
7 (.0
12)**
*4.
125
1.40
5 (.0
12)**
*4.
076
1.42
0 (.0
12)**
*4.
137
$40,
000–
$49,
999
.447
(.0
07)**
*1.
564
1.30
7 (.0
12)**
*3.
695
1.31
4 (.0
12)**
*3.
721
1.30
3 (.0
12)**
*3.
680
1.33
4 (.0
12)**
*3.
796
1.29
9 (.0
12)**
*3.
666
1.32
3 (.0
12)**
*3.
755
$50,
000–
$74,
999
.561
(.0
07)**
*1.
752
1.17
1 (.0
12)**
*3.
225
1.16
7 (.0
12)**
*3.
212
1.16
3 (.0
12)**
*3.
200
1.18
3 (.0
12)**
*3.
264
1.16
8 (.0
12)**
*3.
216
1.18
3 (.0
12)**
*3.
264
$75,
000–
$99,
999
.357
(.0
08)**
*1.
429
.995
(.0
13)**
*2.
705
.992
(.0
13)**
*2.
697
.977
(.0
13)**
*2.
656
1.00
1 (.0
13)**
*2.
721
.975
(.0
13)**
*2.
651
.993
(.0
13)**
*2.
699
$100
,000
–$12
4,99
9–
.229
(.0
09)**
*.7
95.6
63
(.014
)***
1.94
1.6
23
(.014
)***
1.86
5.6
08
(.014
)***
1.83
7.6
28
(.014
)***
1.87
4.5
82
(.014
)***
1.79
0.5
96
(.014
)***
1.81
5
Rec
eive
s w
elfa
re.7
99
(.002
)***
2.22
31.
011
(.003
)***
2.74
81.
026
(.003
)***
2.79
01.
030
(.003
)***
2.80
11.
028
(.003
)***
2.79
51.
038
(.003
)***
2.82
41.
035
(.003
)***
2.81
5

54 Discovering Homelessness
CarterE
xhib
it 4
Pre
dic
tor
Mo
del
1M
od
el 2
Mo
del
3M
od
el 4
Mo
del
5M
od
el 6
Mo
del
7
Co
- ef
fici
ent
Od
ds
Rat
ioC
o-
effi
cien
tO
dd
s R
atio
Co
- ef
fici
ent
Od
ds
Rat
ioC
o-
effi
cien
tO
dd
s R
atio
Co
- ef
fici
ent
Od
ds
Rat
ioC
o-
effi
cien
tO
dd
s R
atio
Co
- ef
fici
ent
Od
ds
Rat
io
Res
ults
of L
ogis
tic R
egre
ssio
n M
odel
s P
red
ictin
g C
row
din
g (3
of 4
)
Loca
tio
n (v
ersu
s su
bur
b a
nd r
ural
)
Cen
tral
city
.261
(.0
02)**
*1.
298
.337
(.0
02)**
*1.
401
.329
(.0
02)**
*1.
390
.323
(.0
02)**
*1.
381
.330
(.0
02)**
*1.
391
.192
(.0
02)**
*1.
212
.198
(.0
02)**
*1.
219
Typ
e o
f U
nit
Ow
ned
(ver
sus
rent
ed o
r no
ren
t)–
.657
(.0
02)**
*.5
18–
.609
(.0
02)**
*.5
44–
.603
(.0
02)**
*.5
47–
.608
(.0
02)**
*.5
44–
.608
(.0
02)**
*.5
44–
.519
(.0
03)**
*.5
95–
.520
(.0
03)**
*.5
95
Pub
lic–
.285
(.0
04)**
*.7
52–
.087
(.0
05)**
*.9
17–
.127
(.0
05)**
*.8
81–
.107
(.0
05)**
*.8
99–
.108
(.0
05)**
*.8
98–
.122
(.0
05)**
*.8
85–
.120
(.0
05)**
*.8
87
Reg
ion
(ver
sus
Wes
t)
Nor
thea
st–
.794
(.0
02)**
*.4
52–
1.35
3 (.0
04)**
*.2
58–
1.31
0 (.0
04)**
*.2
70–
.873
(.0
04)**
*.4
18–
.807
(.0
05)**
*.4
46–
.800
(.0
05)**
*.4
49–
.750
(.0
05)**
*.4
72
Mid
wes
t–
1.00
(.0
02)**
*.3
68–
1.88
3 (.0
04)**
*.1
52–
1.87
2 (.0
04)**
*.1
54–
1.42
5 (.0
05)**
.241
– 1.
406
(.005
)***
.245
– .6
59
(.006
)***
.517
– .6
39
(.006
)***
.528
Sou
th–
.795
(.0
02)**
*.4
52–
1.11
9 (.0
03)**
*.3
27–
1.06
0 (.0
03)**
*.3
46–
.869
(.0
03)**
*.4
19–
.829
(.0
03)**
*.4
36–
.591
(.0
03)**
*.5
54–
.567
(.0
03)**
*.5
67
Seg
reg
atio
n (v
ersu
s D
issi
mila
rity
1)
Dis
sim
ilarit
y2.1
19
(.003
)***
1.12
6.1
37
(.004
)***
1.14
7.1
86
(.004
)***
1.20
4.1
18
(.004
)***
1.12
5–
.057
(.0
04)**
*.9
45–
.116
(.0
04)**
*.8
90
Dis
sim
ilarit
y3.4
66
(.003
)***
1.59
4.5
74
(.003
)***
1.77
5.5
20
(.003
)***
1.68
2.3
89
(.003
)***
1.47
6.1
58
(.003
)***
1.17
1.0
54
(.003
)***
1.05
5
Dis
sim
ilarit
y41.
122
(.004
)***
3.07
1.8
89
(.005
)***
2.43
3.6
93
(.005
)***
2.00
0.5
64
(.005
)***
1.75
8–
.056
(.0
06)**
*.9
46–
.156
(.0
06)**
*.8
56

55Cityscape
From Exclusion to Destitution: Race, Affordable Housing, and Homelessness
*p <
.05.
**p
< .0
1. *
**p
< .0
01.
Not
es: C
oeffi
cien
t = R
egre
ssio
n C
oeffi
cien
t. S
tand
ard
erro
rs a
re in
par
enth
eses
.
Sou
rce:
199
7 A
mer
ican
Hou
sing
Sur
vey;
199
0 D
ecen
nial
Cen
sus;
200
0 D
ecen
nial
Cen
sus
Exh
ibit
4
Pre
dic
tor
Mo
del
1M
od
el 2
Mo
del
3M
od
el 4
Mo
del
5M
od
el 6
Mo
del
7
Co
- ef
fici
ent
Od
ds
Rat
ioC
o-
effi
cien
tO
dd
s R
atio
Co
- ef
fici
ent
Od
ds
Rat
ioC
o-
effi
cien
tO
dd
s R
atio
Co
- ef
fici
ent
Od
ds
Rat
ioC
o-
effi
cien
tO
dd
s R
atio
Co
- ef
fici
ent
Od
ds
Rat
io
Res
ults
of L
ogis
tic R
egre
ssio
n M
odel
s P
red
ictin
g C
row
din
g (4
of 4
)
Bla
ck*D
issi
mila
rity2
– .1
74
(.008
)***
.840
– .1
44
(.008
)***
.866
– .2
33
(.008
)***
.792
– .0
43
(.008
)***
.958
– .1
04
(.008
)***
.901
Bla
ck*D
issi
mila
rity3
– .5
49
(.007
)***
.578
– .5
38
(.007
)***
.584
– .5
83
(.007
)***
.558
– .3
62
(.007
)***
.696
– .3
93
(.007
)***
.675
Bla
ck*D
issi
mila
rity4
.467
(.0
07)**
*1.
595
.481
(.0
07)**
*1.
618
.422
(.0
07)**
*1.
525
.542
(.0
07)**
*1.
719
.499
(.0
07)**
*1.
647
Cit
y Le
vel H
ous
ing
C
hara
cter
isti
cs
Pro
por
tion
of lo
w-
inco
me
resi
den
ts w
ith
high
ren
t b
urd
en
4.49
0 (.0
27)**
*89
.121
3.24
2 (.0
27)**
*25
.585
Ext
rem
e lo
w-i
ncom
e ho
usin
g ra
tio–
3.30
4 (.0
20)**
*.0
37–
2.42
6 (.0
20)**
*.0
88
Pro
por
tion
owne
r–
3.74
1 (.0
13)**
*.0
24–
3.75
0 (.0
13)**
*.0
24
Con
stan
t–
2.59
9 (.0
08)**
*.0
74–
3.82
9 (.0
14)**
*.0
22–
3.83
7 (.0
14)**
*.0
22–
7.71
0 (.0
27)**
*.0
004
– 3.
348
(.014
)***
.035
– 4.
312
(.030
)***
.013
– 1.
144
(.016
)***
.319
– 2
log
likel
ihoo
d17
,071
,192
8,98
3,26
2.2
8,95
1,19
4.8
8,92
2,02
08,
920,
654.
28,
839,
970.
68,
837,
846.
9M
odel
chi
-sq
uare
3,51
5,55
0.82
12,
435,
585.
547
2,46
7,65
2.99
82,
496,
827.
772
2,49
8,19
3.61
82,
578,
877.
122
2,58
1,00
0.86
1D
egre
es o
f fre
edom
2528
3132
3233
33To
tal c
ases
35,0
0715
,700
15,7
0015
,700
15,7
0015
,700
15,7
00
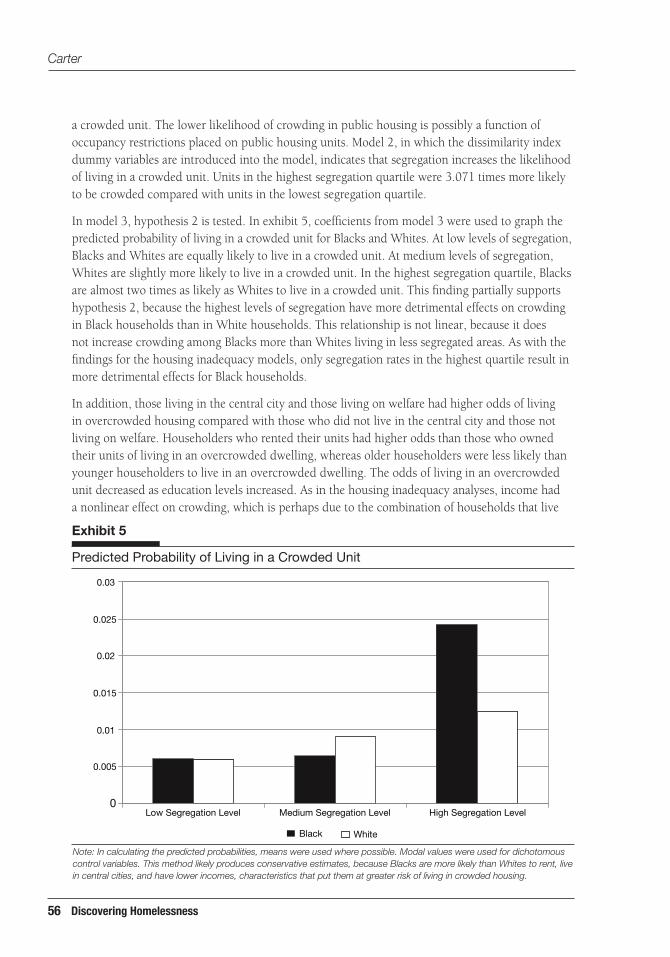
56 Discovering Homelessness
Carter
a crowded unit. The lower likelihood of crowding in public housing is possibly a function of occupancy restrictions placed on public housing units. Model 2, in which the dissimilarity index dummy variables are introduced into the model, indicates that segregation increases the likelihood of living in a crowded unit. Units in the highest segregation quartile were 3.071 times more likely to be crowded compared with units in the lowest segregation quartile.
In model 3, hypothesis 2 is tested. In exhibit 5, coefficients from model 3 were used to graph the predicted probability of living in a crowded unit for Blacks and Whites. At low levels of segregation, Blacks and Whites are equally likely to live in a crowded unit. At medium levels of segregation, Whites are slightly more likely to live in a crowded unit. In the highest segregation quartile, Blacks are almost two times as likely as Whites to live in a crowded unit. This finding partially supports hypothesis 2, because the highest levels of segregation have more detrimental effects on crowding in Black households than in White households. This relationship is not linear, because it does not increase crowding among Blacks more than Whites living in less segregated areas. As with the findings for the housing inadequacy models, only segregation rates in the highest quartile result in more detrimental effects for Black households.
In addition, those living in the central city and those living on welfare had higher odds of living in overcrowded housing compared with those who did not live in the central city and those not living on welfare. Householders who rented their units had higher odds than those who owned their units of living in an overcrowded dwelling, whereas older householders were less likely than younger householders to live in an overcrowded dwelling. The odds of living in an overcrowded unit decreased as education levels increased. As in the housing inadequacy analyses, income had a nonlinear effect on crowding, which is perhaps due to the combination of households that live
56
0
0.005
0.01
0.015
0.02
0.025
0.03
Low Segregation Level Medium Segregation Level High Segregation Level
Black White
Exhibit 5
Predicted Probability of Living in a Crowded Unit
Note: In calculating the predicted probabilities, means were used where possible. Modal values were used for dichotomous control variables. This method likely produces conservative estimates, because Blacks are more likely than Whites to rent, live in central cities, and have lower incomes, characteristics that put them at greater risk of living in crowded housing.

57Cityscape
From Exclusion to Destitution: Race, Affordable Housing, and Homelessness
in smaller units by necessity and households that live in smaller units by choice. Households with very low incomes must live in smaller housing units out of necessity, but households with high incomes may choose smaller units because they are located in areas that are close to valued amenities. Little difference exists in the odds of living in a crowded dwelling in the three regions. Female-headed households were less likely than male-headed households to live in crowded units. This finding may be attributed to female headship serving as a proxy for single-parent families, thus decreasing family size and the probability of adult crowding (Rosenbaum, 1996).
Models 4 and 5 examine the effects of the affordability measures on overcrowding, testing the sec-ond part of hypothesis 3. As expected, housing units in metropolitan areas with higher proportions of low-income renters with high rent burdens are more likely to be crowded. Higher numbers of lowest rent units in relation to households below 50 percent of the poverty threshold reduce the likelihood that a householder is living in a crowded unit. Both affordability measures decrease, but do not erase, the effects of segregation on crowding for Black householders.
In models 6 and 7, the second part of hypothesis 4 is tested. Higher homeownership rates at the metropolitan level decrease the likelihood of householders living in crowded units and reverses the relationship between segregation and crowding, but higher homeownership rates do not erase the relationship between Black headship and crowding. Adding homeownership rates reduces the odds ratio for Black-headed housing units from 1.29 to 1.14. This finding suggests that increasing homeownership rates will decrease home crowding overall but that this effect does not remove the effects of segregation for Blacks in general and especially for Blacks living in the most highly segregated areas. As in models 4 and 5, increasing affordable housing decreases crowding, but it does not erase the effects of segregation on crowding for Black householders living at the highest segregation levels.
NSHAPC Descriptive Statistics
Before the 1980s, the homeless population was primarily composed of White middle-aged males. After 1980, Blacks became overrepresented in the service-using homeless population with respect to their share of the national population (12.8 percent) and their proportion of the poverty pop - ulation (28.4 percent of individuals and 26.1 percent of families).7 In the 1996 NSHAPC, 40.1 percent of homeless clients were Black non-Hispanic and 40.9 percent were White non-Hispanic.8
Geographic Location of the Black Homeless PopulationBoth homeless clients in general and homeless clients who are Black were found at greater rates within central-city areas (exhibit 6). A much higher percentage of Black homeless clients surveyed in the NSHAPC were found in central-city areas (81 percent) than White homeless clients (62 percent). Black homeless clients were concentrated in large central-city areas (63.1 percent), with smaller percentages (17.8 percent) experiencing their homelessness in less dense, mid-size central-city areas. In both suburban and rural areas, White homeless clients are more prevalent than Black
7 March 1997 Current Population Survey.8 This research excludes Hispanic homeless clients, because some evidence indicates that the determinants of homelessness for Hispanic clients are likely different than the determinants for both Black and White non-Hispanic clients. See Baker (1994) for more information about the “Latino paradox,” the underrepresentation of Hispanics in the homeless population.
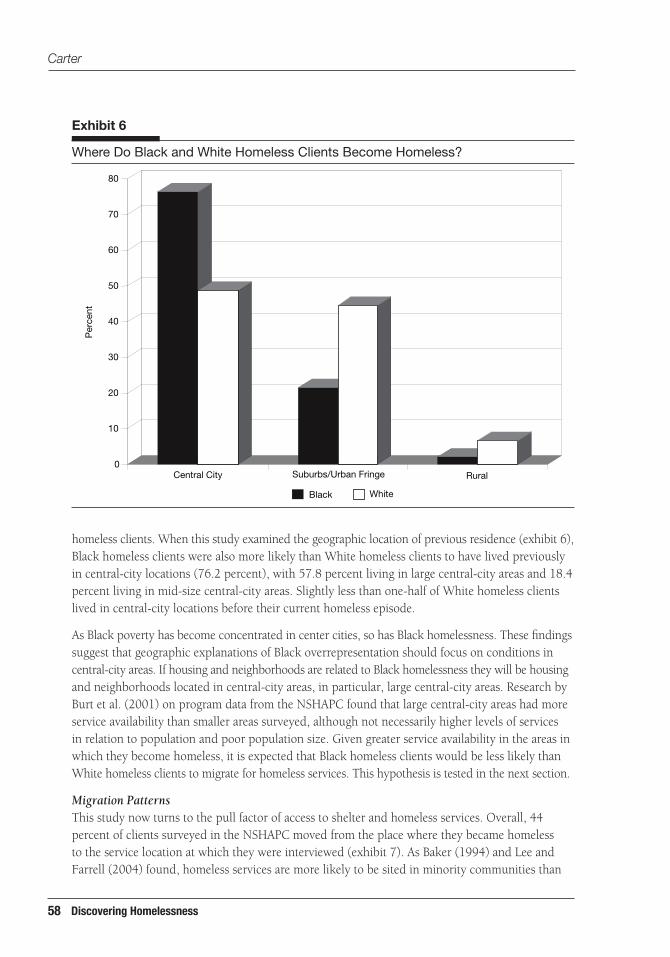
58 Discovering Homelessness
Carter
0
10
20
30
40
50
60
70
80
Central City Suburbs/Urban Fringe
Per
cent
Rural
Black White
homeless clients. When this study examined the geographic location of previous residence (exhibit 6), Black homeless clients were also more likely than White homeless clients to have lived previously in central-city locations (76.2 percent), with 57.8 percent living in large central-city areas and 18.4 percent living in mid-size central-city areas. Slightly less than one-half of White homeless clients lived in central-city locations before their current homeless episode.
As Black poverty has become concentrated in center cities, so has Black homelessness. These findings suggest that geographic explanations of Black overrepresentation should focus on conditions in central-city areas. If housing and neighborhoods are related to Black homelessness they will be housing and neighborhoods located in central-city areas, in particular, large central-city areas. Research by Burt et al. (2001) on program data from the NSHAPC found that large central-city areas had more service availability than smaller areas surveyed, although not necessarily higher levels of services in relation to population and poor population size. Given greater service availability in the areas in which they become homeless, it is expected that Black homeless clients would be less likely than White homeless clients to migrate for homeless services. This hypothesis is tested in the next section.
Migration PatternsThis study now turns to the pull factor of access to shelter and homeless services. Overall, 44 percent of clients surveyed in the NSHAPC moved from the place where they became homeless to the service location at which they were interviewed (exhibit 7). As Baker (1994) and Lee and Farrell (2004) found, homeless services are more likely to be sited in minority communities than
Exhibit 6
Where Do Black and White Homeless Clients Become Homeless?
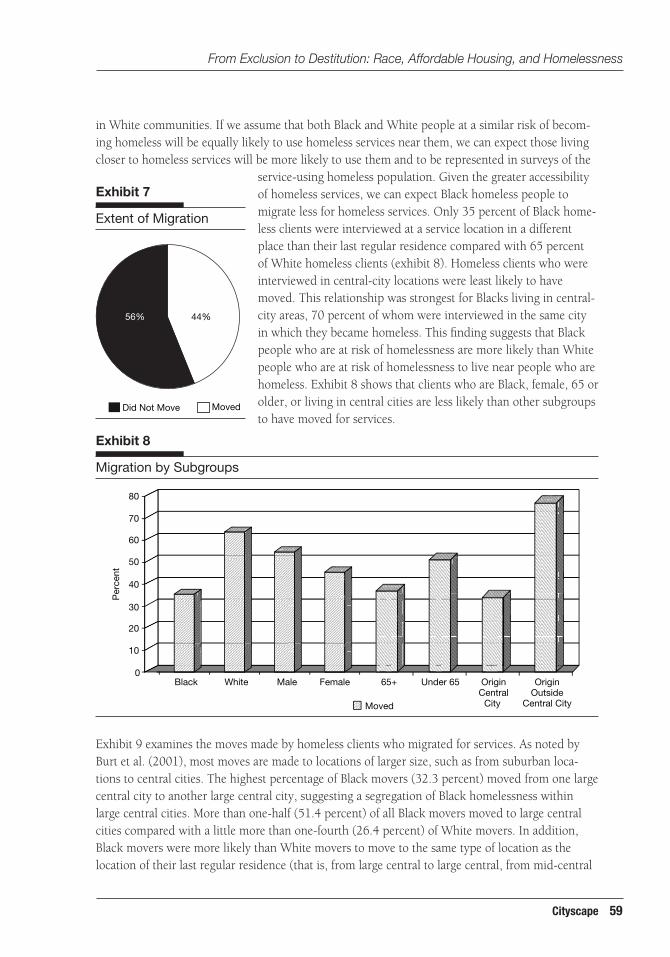
59Cityscape
From Exclusion to Destitution: Race, Affordable Housing, and Homelessness
Black White Male Female 65+
Moved
Under 65 OriginCentral
City
OriginOutside
Central City
Per
cent
0
10
20
30
40
50
60
70
80
in White communities. If we assume that both Black and White people at a similar risk of becom-ing homeless will be equally likely to use homeless services near them, we can expect those living closer to homeless services will be more likely to use them and to be represented in surveys of the
service-using homeless population. Given the greater accessibility of homeless services, we can expect Black homeless people to migrate less for homeless services. Only 35 percent of Black home-less clients were interviewed at a service location in a different place than their last regular residence compared with 65 percent of White homeless clients (exhibit 8). Homeless clients who were interviewed in central-city locations were least likely to have moved. This relationship was strongest for Blacks living in central-city areas, 70 percent of whom were interviewed in the same city in which they became homeless. This finding suggests that Black people who are at risk of homelessness are more likely than White people who are at risk of homelessness to live near people who are homeless. Exhibit 8 shows that clients who are Black, female, 65 or older, or living in central cities are less likely than other subgroups to have moved for services.
Exhibit 8
Migration by Subgroups
Exhibit 7
Extent of Migration
Did Not Move Moved
56% 44%
Exhibit 9 examines the moves made by homeless clients who migrated for services. As noted by Burt et al. (2001), most moves are made to locations of larger size, such as from suburban loca-tions to central cities. The highest percentage of Black movers (32.3 percent) moved from one large central city to another large central city, suggesting a segregation of Black homelessness within large central cities. More than one-half (51.4 percent) of all Black movers moved to large central cities compared with a little more than one-fourth (26.4 percent) of White movers. In addition, Black movers were more likely than White movers to move to the same type of location as the location of their last regular residence (that is, from large central to large central, from mid-central

60 Discovering Homelessness
Carter
Large Central Mid-Central Fringe Large Fringe Mid Rural
to mid-central, and so on) (53.7 versus 34.7 percent). White homeless clients who moved were more likely to be sampled in an emergency shelter than White homeless clients who did not move (34.5 versus 19.6 percent). Thus, White movers are (1) more likely to move, (2) more likely to move to larger locations, and (3) more likely to be sampled in emergency shelters than Black movers. Black movers are (1) less likely to move, (2) more likely to move from one large central-city location to another large central-city location, and (3) more likely to move to a place similar in size to the location they left.
Duration, Transiency, and Alternative Explanations of HomelessnessAfter becoming homeless, Black homeless clients have longer mean homeless spells than White homeless clients have (an average of 3 versus 2.4 years). Using the 1996 NSHAPC, Allgood and Warren (2003) found that White homeless clients had shorter homeless spells than non-White homeless clients. Homeless spells are longer for Blacks in central cities than in other areas and longest for Whites in rural areas. Rural findings should be viewed with caution, however, due to low sample sizes in these areas. Around 50 percent of both Black and White homeless clients were experiencing their first homeless spell at the time of the survey. The frequency of homeless spells was similar across the racial categories examined.
Exhibit 10 presents variation in transiency by race. Transiency is measured as the number of towns or cities that a homeless client stayed in for 2 or more days while homeless. This study found the experience of White homelessness to be more transient. More than two times the percentage (29 versus 13 percent) of White homeless clients stayed in three or more towns or cities during their current homeless spell. Greater White transiency could be due to lack of homeless services or
Exhibit 9
Black clients
White clients
Transition Matrix for Migrations From Original Location (rows) to Service Location (columns), by Race (weighted percentages)
Large central 32.3 2.8 6.7 — —Mid-central 8.1 4.2 — — 1.8Fringe large 6.7 2.5 17.2 — —Fringe mid — .4 — — —Large town 4.2 — — — —Small town — — — — —Rural — 2.5 — — —
Large central 6.4 6.4 2.1 — 3.1Mid-central 4.3 8.3 — — 2.1Fringe large 13.6 4.5 14.2 — —Fringe mid — 7.2 — 4.1 1.4Large town — 2.1 — — —Small town 2.1 3.3 4.7 — 1.2Rural 1.6 2.5 — — 1.7
— indicates fewer than five cases.
Source: 1996 National Survey of Homeless Assistance Providers and Clients
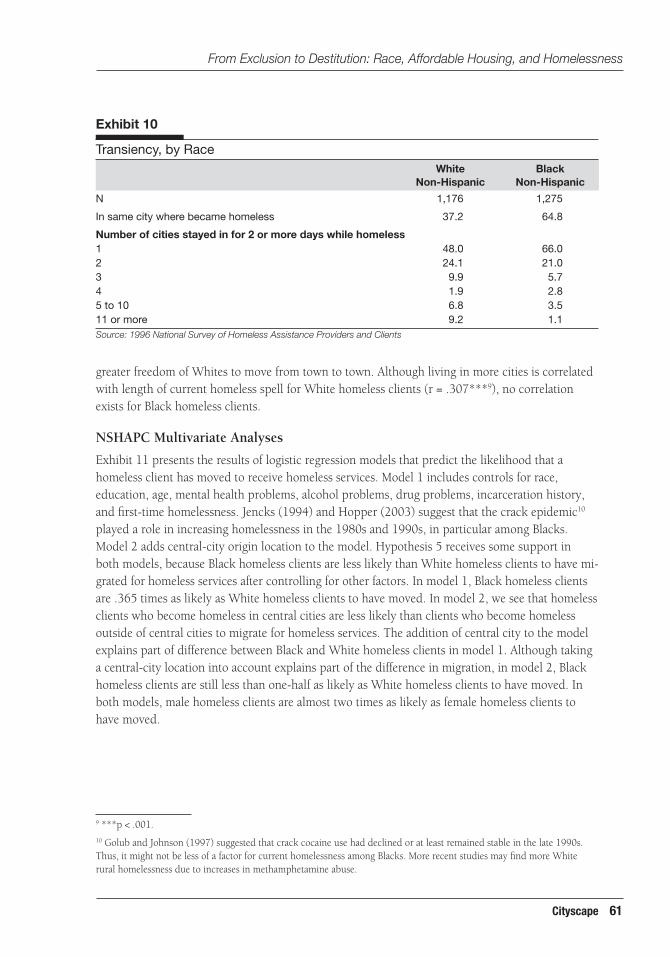
61Cityscape
From Exclusion to Destitution: Race, Affordable Housing, and Homelessness
greater freedom of Whites to move from town to town. Although living in more cities is correlated with length of current homeless spell for White homeless clients (r = .307***9), no correlation exists for Black homeless clients.
NSHAPC Multivariate Analyses
Exhibit 11 presents the results of logistic regression models that predict the likelihood that a homeless client has moved to receive homeless services. Model 1 includes controls for race, education, age, mental health problems, alcohol problems, drug problems, incarceration history, and first-time homelessness. Jencks (1994) and Hopper (2003) suggest that the crack epidemic10 played a role in increasing homelessness in the 1980s and 1990s, in particular among Blacks. Model 2 adds central-city origin location to the model. Hypothesis 5 receives some support in both models, because Black homeless clients are less likely than White homeless clients to have mi-grated for homeless services after controlling for other factors. In model 1, Black homeless clients are .365 times as likely as White homeless clients to have moved. In model 2, we see that homeless clients who become homeless in central cities are less likely than clients who become homeless outside of central cities to migrate for homeless services. The addition of central city to the model explains part of difference between Black and White homeless clients in model 1. Although taking a central-city location into account explains part of the difference in migration, in model 2, Black homeless clients are still less than one-half as likely as White homeless clients to have moved. In both models, male homeless clients are almost two times as likely as female homeless clients to have moved.
Exhibit 10
White Non-Hispanic
Black Non-Hispanic
Transiency, by Race
N 1,176 1,275
In same city where became homeless 37.2 64.8
Number of cities stayed in for 2 or more days while homeless1 48.0 66.02 24.1 21.03 9.9 5.74 1.9 2.85 to 10 6.8 3.511 or more 9.2 1.1Source: 1996 National Survey of Homeless Assistance Providers and Clients
9 ***p < .001.10 Golub and Johnson (1997) suggested that crack cocaine use had declined or at least remained stable in the late 1990s. Thus, it might not be less of a factor for current homelessness among Blacks. More recent studies may find more White rural homelessness due to increases in methamphetamine abuse.
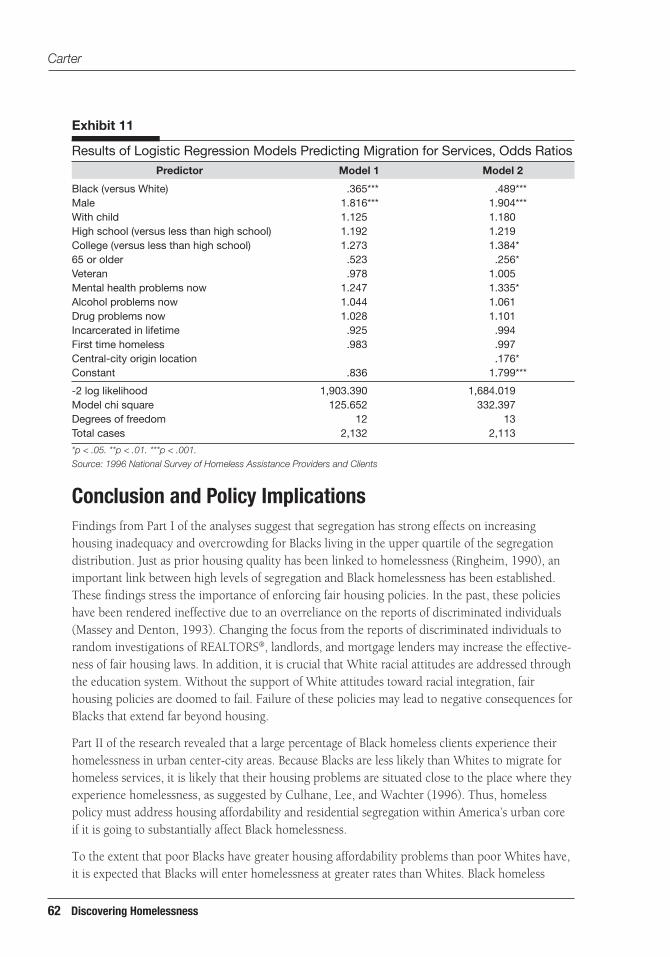
62 Discovering Homelessness
Carter
Exhibit 11
Predictor Model 1 Model 2
Results of Logistic Regression Models Predicting Migration for Services, Odds Ratios
Black (versus White) .365*** .489***Male 1.816*** 1.904***With child 1.125 1.180High school (versus less than high school) 1.192 1.219College (versus less than high school) 1.273 1.384*65 or older .523 .256*Veteran .978 1.005Mental health problems now 1.247 1.335*Alcohol problems now 1.044 1.061Drug problems now 1.028 1.101Incarcerated in lifetime .925 .994First time homeless .983 .997Central-city origin location .176*Constant .836 1.799***
-2 log likelihood 1,903.390 1,684.019Model chi square 125.652 332.397Degrees of freedom 12 13Total cases 2,132 2,113
*p < .05. **p < .01. ***p < .001.
Source: 1996 National Survey of Homeless Assistance Providers and Clients
Conclusion and Policy ImplicationsFindings from Part I of the analyses suggest that segregation has strong effects on increasing housing inadequacy and overcrowding for Blacks living in the upper quartile of the segregation distribution. Just as prior housing quality has been linked to homelessness (Ringheim, 1990), an important link between high levels of segregation and Black homelessness has been established. These findings stress the importance of enforcing fair housing policies. In the past, these policies have been rendered ineffective due to an overreliance on the reports of discriminated individuals (Massey and Denton, 1993). Changing the focus from the reports of discriminated individuals to random investigations of REALTORS®, landlords, and mortgage lenders may increase the effective-ness of fair housing laws. In addition, it is crucial that White racial attitudes are addressed through the education system. Without the support of White attitudes toward racial integration, fair housing policies are doomed to fail. Failure of these policies may lead to negative consequences for Blacks that extend far beyond housing.
Part II of the research revealed that a large percentage of Black homeless clients experience their homelessness in urban center-city areas. Because Blacks are less likely than Whites to migrate for homeless services, it is likely that their housing problems are situated close to the place where they experience homelessness, as suggested by Culhane, Lee, and Wachter (1996). Thus, homeless policy must address housing affordability and residential segregation within America’s urban core if it is going to substantially affect Black homelessness.
To the extent that poor Blacks have greater housing affordability problems than poor Whites have, it is expected that Blacks will enter homelessness at greater rates than Whites. Black homeless

63Cityscape
From Exclusion to Destitution: Race, Affordable Housing, and Homelessness
people have greater access to shelter space and are less likely than White homeless to migrate for homeless services. After Blacks become homeless, it is more difficult for them than for White homeless people to exit their state of homelessness.
These findings suggest that the overrepresentation of Blacks in the homeless population may be related to greater housing affordability problems and greater access to homeless services. In addi-tion to calling for the need for greater attention to affordable housing construction and rehabilita-tion in inner cities, this study’s analyses suggest the need for a more equitable spatial distribution of homeless services across different racial communities. The concentration of drug markets, in particular the crack trade, within center cities may also help explain the prevalence of drug problems experienced by Black homeless people. Drug problems experienced by Blacks may also be a stronger risk factor for homelessness than the mental health problems that are experienced more by White homeless people. Recent historical research by Johnson (2010) attributes Black homelessness from the 1980s to the present to the conjunction of loss of affordable units taken away in urban renewal, loss of jobs due to deindustrialization, and increasing drug-abuse problems related to the availability of crack cocaine in central-city areas.
Although the overrepresentation of Blacks in the homeless population is probably due mostly to a combination of structural and individual factors, it may be partly due to deficiencies in a service-based approach to measuring the homeless. Service-based enumerations and surveys miss many people who are homeless and do not use homeless services. People who do not use homeless services—street homeless and those who double up with friends—do not show up in service-based enumerations and surveys. Proximity to homeless services may affect both service usage and the accuracy of estimates of the homeless population made from service-based samples. If White homeless people find it harder to locate services, they will be less likely than Black homeless people both to use them and to show up in service-based enumerations and surveys. If Black homeless people have greater access to homeless services, they will be more likely than White homeless people to use them and to show up in service-based enumerations and surveys. Increas-ing the equitable spatial distribution of homeless services would not only be a way to provide needed services to White homeless people who are not receiving them, but would also be a way to examine the extent to which the current location of homeless services has biased our estimates of the racial distribution of the homeless population.
To improve this study, data linking housing market characteristics and the homeless population would need to be collected. Confidential data from the NSHAPC can be linked to metropolitan areas (Early, 2005, 2004), but the data are not designed for regional analyses (Burt et al., 2001). Increasing sample sizes within metropolitan areas and sampling more metropolitan areas would make it easier to make regional comparisons, but this may be prohibitively expensive. Sampling a small number of cities within each of the segregation quartiles could make it possible to increase sample sizes without making the study too expensive to conduct.
NSHAPC data are cross sectional, providing only a snapshot of the homeless population in time. Cross-sectional studies of the homeless population overrepresent long-term homeless people and underrepresent short-term homeless people. Requiring homeless-services providers to collect data on clients may give a better sense of annual prevalence of homelessness, but the data may suffer from reliability problems due to the lack of centralized data collection. Service providers may not
64 Discovering Homelessness
Carter
have the time or money to collect such data or may oppose collecting information due to confiden-tiality concerns.
Because the NSHAPC contains data only on people who use homeless services, an appropriate comparison group was not available to adequately test the validity of housing quality as an at-risk measure. The NSHAPC contains information on housed people who use homeless services, but this population is not representative of the entire precariously housed population. Longitudinal data linking the housed population and the homeless population would provide the appropriate comparison groups for this test, although the data would most likely suffer from large attrition problems. This type of data helps determine whether people living in low-quality or overcrowded housing enter homelessness at higher rates than people living in high-quality or uncrowded housing. Culhane, Lee, and Wachter (1996) provided a basis for comparison when, in their work, they asked homeless families in New York and Philadelphia where they lived before they became homeless. Although this approach does not allow for comparison of the homeless population with the entire housed population, it provides the opportunity to compare homeless people to people in the neighborhoods where they previously lived.
Because the NSHAPC did not contain data on distance to homeless services, a definitive statement on the link between access to services and migration cannot be made. This link can be addressed in future research in several ways. Data could be collected on where the homeless lived before their current homeless episode and distances could be calculated between their last residence and their service location. It would be expected that those who live in places with less access to homeless services would have to migrate longer distances for homeless services. Because Blacks are more likely than Whites to live closer to homeless services, it is expected that they would migrate shorter distances for homeless services. This approach, however, does not account for (1) those who become homeless and do not use homeless services and (2) those who would end up in homeless shelters only if one were nearby. The first group is an unavoidable source of error in the analyses of the homeless population, because good-quality data on street homeless people are almost impos-sible to collect.
A second approach includes more of the second group in the analyses by first examining the census tract where service-using homeless people lived before becoming homeless. Characteristics of tracts, including poverty rates, median rents, and vacancy rates, could be collected. After these data are collected, tracts matching these characteristics could be selected at the national level to create a representative sample of tracts from which homeless people are likely to live before they become homeless. After the tracts are selected, distances could be calculated between tracts and homeless-services provision locations. Linking these tracts to data on the services-using homeless population, the probability that a resident will enter the services-using homeless population as a function of distance from homeless services could be predicted. Such an approach would include more of the at-risk population than the first approach and would better assess the role of access to homeless services in explaining the overrepresentation of Blacks in the homeless community.
The questions explored in this study undoubtedly need further research before clear policy impli-cations can be drawn. What is clear is that a relationship exists between high rates of residential segregation and Blacks living in substandard or overcrowded housing. This study found that lower levels of segregation, greater availability of affordable housing, and higher homeownership rates

65Cityscape
From Exclusion to Destitution: Race, Affordable Housing, and Homelessness
were associated with higher quality housing for Blacks. Because increasing the housing quality of all Americans should be an aim of national policy, stronger prointegration and antidiscrimination policies must be adopted. To the extent that increasing the affordable housing supply and the level of homeownership also increases the living conditions of Blacks, policies supporting these aims should also be promoted. In addition to calling for greater attention to affordable housing con-struction and rehabilitation in inner cities, the analyses in this study suggest the need for a more equitable spatial distribution of homeless services across different racial communities and the need to tailor homeless services to the differential determinants of homelessness for different groups.
Acknowledgments
The research in this article was part of a dissertation supported by the U.S. Department of Housing and Urban Development (HUD) Doctoral Dissertation Research Grant #H-21478SG. The views expressed here are those of the author alone and not necessarily those of HUD or the U.S. Census Bureau. The author thanks Alford Young, Jr., Jeffrey Morenoff, Robert Marans, Mary Corcoran, and Mark Holter of the University of Michigan and anonymous referees and editors for providing helpful comments on the dissertation and this article.
Author
George R. Carter III is a survey statistician in the American Housing Survey Branch of the Housing and Household Economic Statistics Division of the U.S. Census Bureau.
References
Allgood, Sam, and Ronald S. Warren, Jr. 2003. “The Duration of Homelessness: Evidence From a National Survey,” Journal of Housing Economics 12: 273–290.
Baker, Susan G. 1994. “Gender, Ethnicity, and Homelessness: Accounting for Demographic Diversity on the Streets,” American Behavioral Scientist 37 (4): 476–504.
Bohanon, Cecil. 1991. “The Economic Correlates of Homelessness in Sixty Cities,” Social Science Quarterly 72 (4): 817–825.
Bullard, Robert D., J. Eugene Grigsby, III, and Charles Lee. 1994. Residential Apartheid: The American Legacy. Los Angeles: CAAS Publications.
Burt, Martha R. 1992. Over the Edge: The Growth of Homelessness in the 1980s. New York: Russell Sage Foundation.
Burt, Martha R., Laudan Y. Aron, Toby Douglas, Jesse Valente, Edgar Lee, and Britta Iwen. 1999. Homelessness Programs and the People They Serve: Findings From the National Survey of Homeless Assistance Providers and Clients: Technical Report. Washington, DC: Interagency Council on the Homeless, Urban Institute.

66 Discovering Homelessness
Carter
Burt, Martha, Laudan Y. Aron, Edgar Lee, and Jesse Valente. 2001. Helping America’s Homeless: Emergency Shelter or Affordable Housing? Washington, DC: The Urban Institute Press.
Burt, Martha R., and Barbara E. Cohen. 1990. “A Sociodemographic Profile of the Service-Using Homeless: Findings From a National Survey.” In Homelessness in the United States: Data and Issues, edited by Jamshid A. Momeni. New York: Praeger: 17–38.
———. 1989. “Differences Among Homeless Single Women, Women With Children, and Single Men,” Social Problems 36 (5): 508–524.
Culhane, Dennis P., Chang-Moo Lee, and Susan M. Wachter. 1996. “Where the Homeless Come From: A Study of the Prior Address Distribution of Families Admitted to Public Shelter in New York City and Philadelphia,” Housing Policy Debate 7 (2): 327–365.
Cutler, David M., and Edward L. Glaeser. 1997. “Are Ghettos Good or Bad?” The Quarterly Journal of Economics August: 827–872.
Early, Dirk W. 2005. “An Empirical Investigation of the Determinants of Street Homelessness,” Journal of Housing Economics 14 (1): 27–47.
––––. 2004. “The Determinants of Homelessness and the Targeting of Housing Assistance,” Journal of Urban Economics 55: 195–214.
Elliot, Marta, and Lauren J. Krivo. 1991. “Structural Determinants of Homelessness in the United States,” Social Problems 38: 113–131.
Golub, Andrew L., and Bruce D. Johnson. 1997. Crack’s Decline: Some Surprises Across U.S. Cities. Research in Brief. Washington, DC: U.S. Department of Justice, Office of Justice Programs, National Institute of Justice.
Gounis, Kostas. 1990. “Shelterization,” Hospital and Community Psychiatry 41 (12): 1357–1358.
Grigsby, J. Eugene, III. 1994. “African American Mobility and Residential Quality in Los Angeles.” In Residential Apartheid: The American Legacy, edited by Robert D. Bullard, J. Eugene Grigsby, III, and Charles Lee. Los Angeles: CAAS Publications.
Honig, Marjorie, and Randall K. Filer. 1993. “Causes of Intercity Variation in Homelessness,” American Economic Review 83 (1): 248–255.
Hopper, Kim. 2003. Reckoning With Homelessness. Ithaca, NY, and London, United Kingdom: Cornell University Press.
Hudson, Christopher G. 1998. An Interdependency Model of Homelessness: The Dynamics of Social Disintegration. Lewiston, NY: The Edwin Mellen Press.
ICF International. 1997. 1997 American Housing Survey Codebook. Washington, DC: U.S. Depart-ment of Housing and Urban Development, Office of Policy Development and Research.
Jencks, Christopher. 1994. The Homeless. Cambridge, MA, and London, United Kingdom: Harvard University Press.

67Cityscape
From Exclusion to Destitution: Race, Affordable Housing, and Homelessness
Johnson, Roberta A. 2010. “African-Americans and Homelessness: Moving Through History,” Journal of Black Studies 40 (4): 583–605.
Johnston, Ronald J. 1982. The American Urban System: A Geographical Perspective. New York: St. Martin’s Press.
Lee, Barrett, and Chad Farrell. 2004. “Metropolitan Neighborhoods With Sheltered Homeless Populations: Evidence From the 1990 and 2000 Censuses.” Living Cities Census Series. Washington, DC: Brookings Institution.
Martin, Elizabeth. 1992. “Assessment of S-Night Street Enumeration in the 1990 Census.” Statisti-cal Research Division Working Papers in Survey Methodology (#92-03). Washington, DC: U.S. Census Bureau.
Massey, Douglas S., and Nancy A. Denton. 1988. “The Dimensions of Residential Segregation,” Social Forces 67 (2): 281–315.
National Academy of Sciences. 1988. Homelessness, Health, and Human Needs. Washington, DC: National Academy Press.
Ringheim, Karin. 1990. At Risk of Homelessness: The Roles of Income and Rent. New York: Praeger.
Rosenbaum, Emily. 1996. “Racial/Ethnic Differences in Home Ownership and Housing Quality, 1991,” Social Problems 43 (4): 403–426.
Rossi, Peter H. 1989a. Without Shelter: Homelessness in the 1980s. Twentieth Century Fund Paper. New York: Twentieth Century Fund Press.
––––. 1989b. Down and Out in America: The Origins of Homelessness. Chicago: The University of Chicago Press.
Shinn, Marybeth, and Colleen Gillespie. 1994. “The Roles of Housing and Poverty in the Origins of Homelessness,” American Behavioral Scientist 37 (4): 505–521.
Shlay, Anne B., and Peter H. Rossi. 1992. “Social-Science Research and Contemporary Studies of Homelessness,” Annual Review of Sociology 18: 129–160.
Stacey, William A. 1972. Black Home Ownership: A Sociological Case Study of Metropolitan Jackson-ville. New York: Praeger.
U.S. Department of Health and Human Services (HHS). 1989. National Household Survey on Drug Abuse, 1988: Population Estimates. DHHS Publication No. ADM 89–1636. Washington, DC: U.S. Government Printing Office.
U.S. Department of Housing and Urban Development (HUD). 1984. A Report to the Secretary on the Homeless and Emergency Shelters. Washington, DC: U.S. Department of Housing and Urban Development, Office of Policy Development and Research.
Wright, James D. 1989. Address Unknown: The Homeless in America. New York: Aldine de Gruyter.
Wright, James D., Beth A. Rubin, and Joel A. Devine. 1998. Beside the Golden Door: Policy, Politics, and the Homeless. New York: Aldine de Gruyter.

68 Discovering Homelessness
Carter
Additional Reading
Aiken, Leona S., and Stephen G. West. 1991. Multiple Regressions: Testing and Interpreting Interac-tions. Newbury Park, CA: Sage Publications.
Babbie, Earl. 2001. The Practice of Social Research, 9th edition. Belmont, CA: Wadsworth/Thomson Learning.
Bullard, Robert D., and Charles Lee. 1994. “Introduction: Racism and American Apartheid.” In Residential Apartheid: The American Legacy, edited by Robert D. Bullard, J. Eugene Grigsby, III, and Charles Lee. Los Angeles: CAAS Publications.
Clark, William A.V. 1991. “Residential Preferences and Neighborhood Racial Segregation: A Test of the Schelling Segregation Model,” Demography 28 (1): 1–19.
Conley, Dalton. 1999. Being Black, Living in the Red: Race, Wealth, and Social Policy in America. Berkeley: University of California Press.
Farley, Reynolds, and William H. Frey. 1994. “Changes in the Segregation of Whites From Blacks During the 1980s: Small Steps Toward a More Integrated Society,” American Sociological Review 59 (1): 23–45.
Farley, Reynolds, Howard Schuman, Suzanne Bianchi, Diane Colasanto, and Shirley Hatchett. 1978. “‘Chocolate City, Vanilla Suburbs’: Will the Trend Toward Racially Separate Communities Continue?” Social Science Research 7 (4): 319–344.
Feagin, Joe R. 1994. “A House Is Not a Home: White Racism and U.S. Housing Practices.” In Residential Apartheid: The American Legacy, edited by Robert D. Bullard, J. Eugene Grigsby, III, and Charles Lee. Los Angeles: CAAS Publications.
Gilens, Martin. 1999. Why Americans Hate Welfare: Race, Media, and the Politics of Antipoverty Policy. Chicago: University of Chicago Press.
Gove, Walter, and Michael Hughes. 1983. Overcrowding in the Household. New York: Academic Press.
Hawley, Amos H., and Vincent P. Rock, eds. 1973. Segregation in Residential Areas: Papers on Racial and Socioeconomic Factors in Choice of Housing. Washington, DC: National Academy of Sciences.
Hays, R. Allen, ed. 1993. Ownership, Control, and the Future of Housing Policy. Westport, CT: Greenwood Press.
He, Yinghua, Brendan O’Flaherty, and Robert A. Rosenheck. 2010. “Is Shared Housing a Way To Reduce Homelessness? The Effect of Household Arrangement on Formerly Homeless People,” Journal of Housing Economics 19: 1–12.
Jaccard, James, Robert Turrisi, and Choi K. Wan. 1990. Interaction Effects in Multiple Regression. Newbury Park, CA: Sage Publications.
69Cityscape
From Exclusion to Destitution: Race, Affordable Housing, and Homelessness
Jackman, Mary R., and Robert W. Jackman. 1980. “Racial Inequalities in Home Ownership,” Social Forces 58 (4): 1221–1234.
Jasper, James M. 1998. “The Emotions of Protest: Affective and Reactive Emotions in and Around Social Movements,” Sociological Forum 13 (3): 397–424.
Kain, John F., and John M. Quigley. 1975. Housing Markets and Racial Discrimination: A Microeco-nomic Analysis. New York: National Bureau of Economic Research.
Krivo, Lauren J., Ruth D. Peterson, Helen Rizzo, and John R. Reynolds. 1998. “Race, Segregation, and the Concentration of Disadvantage: 1980–1990,” Social Problems 45 (1): 61–80.
Kusmer, Kenneth L. 2002. Down and Out, On the Road: The Homeless in American History. Oxford, United Kingdom, and New York: Oxford University Press.
Logan, John R., and Harvey L. Molotch. 1987. Urban Fortunes: The Political Economy of Place. Berkeley: University of California Press.
Long, James E., and Steven B. Caudill. 1992. “Racial Differences in Homeownership and Housing Wealth, 1970–1986,” Economic Inquiry 30 (1): 83–100.
Massey, Douglas S. 1985. “Ethnic Residential Segregation: A Theoretical Synthesis and Empirical Review,” Sociology and Social Research 69: 315–50.
Massey, Douglas S., Gretchen A. Condran, and Nancy A. Denton. 1987. “The Effect of Residential Segregation on Black Social and Economic Well-Being,” Social Forces 66 (1): 29–56.
Massey, Douglas S., and Nancy A. Denton. 1993. American Apartheid: Segregation and the Making of Underclass. Cambridge, MA: Harvard University Press.
Massey, Douglas S., and Eric Fong. 1990. “Segregation and Neighborhood Quality: Blacks, Hispan-ics, and Asians in the San Francisco Area,” Social Forces 69 (1): 15–32.
Massey, Douglas S., Andrew B. Gross, and Kumiko Shibuya. 1994. “Migration, Segregation, and the Geographic Concentration of Poverty,” American Sociological Review 59: 425–445.
Meyer, Stephen G. 2000. As Long As They Don’t Move Next Door: Segregation and Conflict in American Neighborhoods. Lanham, MD: Rowman & Littlefield Publishers.
Oliver, Melvin L., and Thomas M. Shapiro. 1997. Black Wealth/White Wealth: A New Perspective on Racial Inequality. New York: Routledge.
Ong, Paul M., and J. Eugene Grigsby, III. 1988. “Race and Life-Cycle Effects on Home Ownership in Los Angeles, 1970 to 1980,” Urban Affairs Quarterly 23 (4): 601–615.
Parcel, Toby L. 1982. “Wealth Accumulation of Black and White Men: The Case of Housing Equity,” Social Problems 30 (2): 199–211.
Roistacher, Elizabeth A., and John L. Goodman, Jr. 1976. “Race and Home Ownership: Is Discri m-ination Disappearing?” Economic Inquiry 14: 59–70.
70 Discovering Homelessness
Carter
Rosenthal, Robert. 1994. Homeless in Paradise: A Map of the Terrain. Philadelphia: Temple Univer-sity Press.
Schelling, Thomas C. 1971. “Dynamic Models of Segregation,” Journal of Mathematical Sociology 1: 143–186.
Snow, David A., and Robert D. Benford. 1988. “Ideology, Frame Resonance and Participant Mobilization,” International Social Movement Research 1: 197–217.
Struyk, Raymond J. 1976. Urban Homeownership. Lexington, MA: Lexington Books.
Taeuber, Karl E., and Alma F. Taeuber. 1965. Negroes in Cities: Residential Segregation and Neighbor-hood Change. Chicago: Aldine Publishing Company.
Taggart, Harriet, and Kevin Smith. 1981. “Redlining: An Assessment of the Evidence in Metropoli-tan Boston,” Urban Affairs Quarterly 17 (1): 91–107.
Takahashi, Lois M. 1998. Homelessness, AIDS, and Stigmatization: The NIMBY Syndrome in the United States at the End of the Twentieth Century. Oxford, United Kingdom: Clarendon Press.
––––. 1997. “The Socio-Spatial Stigmatization of Homelessness and HIV/AIDS: Toward an Explanation of the NIMBY Syndrome,” Social Science and Medicine 45 (6): 903–914.
Takahashi, Lois M., and Sharon Lord Gaber. 1998. “Controversial Facility Siting in the Urban Environment: Resident and Planner Perceptions in the United States,” Environment and Behavior 30 (2): 184–215.
U.S. Census Bureau. 2000. The American Housing Survey National Microdata: 1997. CD-ROM. Washington, DC: U.S. Census Bureau.
Wagner, David. 1993. Checkerboard Square: Culture and Resistance in a Homeless Community. Boulder, CO: Westview Press.
Wolch, Jennifer, and Michael Dear. 1993. Malign Neglect: Homelessness in an American City. San Francisco: Jossey-Bass Publishers.
Wright, Talmadge. 1997. Out of Place: Homeless Mobilizations, Subcities, and Contested Landscapes. Albany: State University of New York Press.