from director's desk - inflibnet centre · dr. f r sumer, deputy librarian, north eastern hill...
TRANSCRIPT


Vol. 23, No. 4 (October to December 2016)1
From Director's Desk
Wish you all a very happy, healthy and prosperous new year
The Centre was completely occupied with new activities, services and responsibilities entrusted to it by the
University Grants Commission, MHRD and other concerned agencies during the period under report. The work
related to India Rankings 2017 continued on full throttle. MoUs were signed with Clarivate Analytics and Elsevier
Science for retrieval and verification of data on publications and citations for institutions that are applicant for
India Ranking 2017. The Centre designed and developed platforms for capturing data, perceptions and feedback
from public and peers. Other important projects that kept us busy included e-PG Pathshala, Vidya-mitra,
SWAYAM and SWAYAM-PRABHA.
Reviewing of e-content development work under e-PG Pathshala and its repurposing into MOOCs format under
SWAYAM project continued to be another important activity that kept us busy interacting with various
stakeholders including principal investigators for various subjects, paper coordinators and content writers. A
meeting of the reviewers for the subject sociology was organized in the month of November, 2016 at INFLIBNET
Centre involving PIs and paper reviewers.
10th PLANNER 2016 was organized during the quarter under report in the North Eastern Hill University (NEHU),
Shillong from 9th to 11th November 2016. The Conference was a huge success with more than 200 delegates
who participated the convention including 29 publishers who took part in the exhibition organized during the
Convention. The proceedings of the conference published 42 papers and 17 papers were selected for poster
presentation out of 128 submissions. The Convention was inaugurated by Mr. R G Lyngdoh, Vice Chancellor,
Martin Luther Christian University in the presence of Prof. Sri Krishna Srivastava, Vice-Chancellor, NEHU and
other dignitaries. Prof. Jagtar Singh, Department of Library and information Science, Punjabi University, Patiala
was the Keynote Speaker for the convention.
A three-day National Conference on e-Theses and Dissertations (iETD-2016) was organized at the INFLIBNET th th
Centre from 5 to 7 October, 2016, wherein Prof. Anamik Shah, Vice-Chancellor, Gujarat Vidyapith,
Ahmedabad uploaded 1,00,000th theses into the Shodhganga Repository, highlighting yet another milestone for
this ambitious Project.

Vol. 23, No. 4 (October to December 2016)2
(Jagdish Arora)
In addition, a two-day National Workshop on Capacity Building for LIS Professional using Open Journal System
for e-Publishing was organized at TISS Mumbai and a National Workshop on Content Management System was
organized at Sikkim, Gangtok in month of November 2016. An Advanced Training Programme on Shodhganga th thwas organized at INFLIBNET Centre, Gandhinagar from 14 to 16 December, 2016 followed by a three-day
National Workshop on Data and Statistical Analysis using R Programming was organized at the INFLIBNET th st
Centre, Gandhinagar from 19 to 21 December, 2016 wherein “Data Analytic Tool” developed using R under
ICSSR Data Repository project was demonstrated to the participants.
The Newsletter for this quarter include a feature article “Science Mapping and Visualization Tools used in
Bibliometric & Scientometric Studies: An Overview” by Mr. Pallab Pradhan, Scientist-B (LS). I am sure you would
enjoy going through this article.

Training Programme on SOUL 2.0, INFLIBNET Centre,Gandhinagar
The INFLIBNET Centre regularly conducts SOUL 2.0
Training Programmes to impart training on Installation
and Operation of SOUL Software for its users. During ththis quarter, 129 Training Programme on SOUL 2.0
thwas organized at INFLIBNET Centre from 28
rdNovember to 3 December 2016. The Programme was
coordinated by Mr. H G Hosamani, Scientist C (LS),
INFLIBNET Centre. 12 participants including library
science and computer science professionals from across
the country attended training programme.
Workshop on URKUND: A Plagiarism Detection Toolunder Shodhaganga
One-day Workshop on URKUND: A Plagiarism
Detection Tool under Shodhganga & Mendeley:
Referencing Tool and Inauguration of ETD Lab, Assam thUniversity, Silchar, 7 November, 2016
One-day Workshop on URKUND: A Plagiarism
Detection Tool & Mendeley: Referencing Tool was
organised by Assam University, Silchar in collaboration thwith INFLIBNET Centre, Gandhinagar on 7 November,
2016 at Bipin Chandra Paul Seminar Hall, Assam
University, Silchar. Dr. Arun K Sharma, Librarian
coordinated the programme and welcomed the guests
and participants. Prof. Dilip Chandra Nath, Hon’ble
Vice-Chancellor inaugurated the programme. Mr.
Manoj Kumar K, Scientist D (CS), INFLIBNET Centre
made detailed presentations on URKUND: A Plagiarism
Detection Tool & Mendeley: Referencing Tool. He
demonstrated method of generating similarity report
and preparing references using Mendeley and
integrating it with word processing software. The
programme ended with a question answer session that
addressed most of the queries of the participants.
Around 120 participants including faculty members and
research scholars participated in the programme.
Dr. Arun K Sharma extended a warm vote of thanks at
the end of the programme.
Vol. 23, No. 4 (October to December 2016)3
th Participants of 129 Training Programme on SOUL 2.0 with the Director and Technical Staff of the INFLIBNET Centre

Prof. Dilip Chandra Nath, Hon'ble Vice-Chancellor, Dr. Arun K Sharma, Librarian, Assam University and Mr. Manoj Kumar K, Scientist D (CS), INFLIBNET Centre on the Dais during the User Awareness Programme on URKUND: A Plagiarism Detection Tool & Mendeley: Referencing Tool and Inauguration of ETD Lab, Assam University, Silchar
Participants of User Awareness Programme on URKUND: A Plagiarism Detection Tool & Mendeley: Referencing Tool, Assam University, Silchar
Prof. Dilip Chandra Nath, Hon’ble Vice-Chancellor,
Assam University inaugurated the institutional Digital
Repository (IDR) along with ETD Lab under
Shodhganga project at Central Library, Assam
University in presence of Mr. Manoj Kumar K, Scientist
D (CS), INFLIBNET Centre and Dr. Arun K Sharma,
Librarian, Assam University.
Vol. 23, No. 4 (October to December 2016)4

Specialized Training Programmes and NationalWorkshops
Three-day National Conference on Electronic Thesis
and Dissertation (iETD 2016), INFLIBNET Centre, th th
Gandhinagar, 5 -7 October, 2016
Three-day National Conference on Electronic Theses
and Dissertations (iETD 2016) was organised at th th
INFLIBNET Centre, Gandhinagar from 5 to 7 October,
2016. Mr. Manoj Kumar K, Scientist D (CS), Convenor
and Ms. Suboohi S., STO (LS), Co-Convenor
coordinated the Conference. Mr. Manoj Kumar
welcomed the guests and participants. Dr. Jagdish Arora
delivered opening remarks and introduced services and
activities of the INFLIBNET Centre. Prof. Anamik Shah,
Vice-Chancellor, Gujarat Vidyapith, Ahmedabad
inaugurated the programme by lighting the ceremonial
lamp in presence of Dr. Nabi Hasan, University
Librarian, Aligarh Muslim University, Dr. Jagdish Arora,
Director, Mr. Manoj Kumar K, Scientist D (CS), Mr. H.
G. Hosamani, Scientist C (LS) and Ms. Suboohi S., STO
(LS), INFLIBNET Centre. In his inaugural address, he
emphasized the importance of research and ETDs and
also discussed the role of scientific research especially
in chemistry and informed about setting-up of a unique
facility i.e. National Facility for Drug Discovery
Complex at Rajkot University with emphasis on
industry- academic linkages for research.
Prof. Anamik Shah uploaded 1,00,000th thesis as a
milestone in Shodhganga project during Inaugural
Session.
Dr. Nabi Hasan delivered keynote address wherein he
highlighted the process of digitisation of theses carried
out at the AMU. Ms Suboohi briefed about the three
days programme followed by the brief presentation by
Mr. Prathap Das from ProQuest. Mr. H. G. Hosamani
extended a warm vote of thanks at the end of the
inaugural function.
Participants of National Conference on Electronic Thesis and Dissertation (iETD 2016) at INFLIBNET Centre,Gandhinagar
Vol. 23, No. 4 (October to December 2016)5

Topics Name of Expert and Institution
Keynote address and digitization of theses at Dr. Nabi Hasan, University Librarian, Mr. Rais AhmadAMU, Aligarh Khan and Dr. Jafar Iqbal, SPA, Central Library, Aligarh
Muslim University, Aligarh
Evolving ETDs in University Library, Anna University Dr. G. Krishnamoorthy, Director, University Librarian,Mr. S. Bharanidharan and Dr. V. Rajasekar, UniversityLibrary, Anna University, Chennai
Developing Institute Digital Repository at Assam Dr. A. K. Sharma, Librarian, Assam University,University, Silchar: A Case Study Silchar
Citation Practice for Audio Video Materials and Dr. Shailesh Yagnik, Head, Library and InformationAvoiding Plagiarism Service, MICA, Ahmedabad
Managing ETD of Gujarat University: A Case study Dr. Yogesh Parikh, Librarian, Gujarat University,Ahmedabad
International ETD Programmes/Projects: An Overview Dr. T S Kumbar, Librarian, IIT Gandhinagar
Shodhganga, A Platform for Improving Quality of Mr. Manoj Kumar K, Scientist D (CS), Ms. Suboohi S,Research in Indian Universities STO (LS) and Mrs. Archita M, Project Officer (LS),
INFLIBNET Centre, Gandhinagar
The Perceived Ease in the Adoption of Electronic Dr. Hepsibah Francis, Dr. Rama Vaidyanathan &Thesis and Dissertation (ETD) Dr. A. Thirunavukkarasu, Dr. M.G.R Educational
and Research Institute, Chennai
A Study on the Growth and Development of ETD Mr. Nitya Nanda Pathak and Ms. Konika Malakar, Repositories in the University Libraries of Assam Gauhati University, Guwahati
National Level ETD Efforts: A Comparative Analysis Dr. Prashant Shrivastava, Librarian, Grade-II, AIIMS,New Delhi and Dr. Dinesh K. Gupta, Professor, Dept.of Library and Information Sciences, Director(Research) Vardhaman Mahaveer Open University,Kota
Open Innovation Initiatives in India Mr. Abhinav Jha and Dr. Kunal Sinha, CentralUniversity of Gujarat, Gandhinagar
Alternative Perspectives on Plagiarism Ms. Astha Jaiswal, Research Student, Central Universityof Gujarat, Gandhinagar
A Study of Some Characteristics of Ph.D. Theses Mr. Kumar Gandharv Mishra, M.Sc. Student, UniversityUploaded on Shodhganga of Delhi, Delhi
Academic Integrity and Plagiarism: A Case Study Mr. Prakash I N, Dy. Librarian and Dr. H. R. Badrinath,Associate Professor, Alliance School of Business,Alliance University
During the National Conference, technical sessions
started with presentations on various topics on ETD
related to the theme of the Conference i.e. “Evolving
ETDs to Knowledge Repositories” including:
Dr. Jagdish Arora delivered the valedictory address and
distributed certificates to the participants at the end of
the programme. Around 60 participants attended the
programme.
Ahmedabad
Vol. 23, No. 4 (October to December 2016)6

Training Programme on N-LIST using A-View
Class room Sof tware , INFLIBNET Centre , th
Gandhinagar, 13 October, 2016
The INFLIBNET Centre organised training programme
on N-LIST using A-View Classroom Software to
demonstrate e-resources available under N-LIST
programme, process of joining, method of access, etc.
to the students and faculty members of the Govt. thE.V.P.G. College, Korba on 13 October, 2016. Ms.
Kruti Trivedi, Scientist B (LS) and Mrs. Roma Asnani,
STA (LS), INFLIBNET Centre were resource persons.
More than 40 participants attended the programme.
th10 PLANNER 2016, North Eastern Hill University,
th thShillong, 9 -11 November, 2016
thThe 10 PLANNER 2016 (Promotion of Library
Automation and Networking in North Eastern Region)
was organised by the INFLIBNET Centre in
collaboration with North Eastern Hill University,
Shillong on the theme “Disruptive Innovations for th thLibraries: Adopt, Adapt and Evolve” from 9 to 11
November 2016. The main theme of the convention
was divided into three sub-themes, namely i)
Technologies for Libraries; ii) Library Management:
C o l l e c t i o n s a n d
Human Resources;
and iii) Innovative
S e r v i c e s . T h e
C o n v e n t i o n w a s
attended by more than
200 delegates and
invitees from all over
t h e c o u n t r y . 2 9
p u b l i s h e r s
participated in the
exhibition arranged as
p a r t o f t h e
Convention. Out of
128 submissions, 42
papers were selected
for presentation and
1 7 p a p e r s w e r e
selected for poster
presentations.
Inaugural Session
Dr. F R Sumer, Deputy Librarian, North Eastern Hill th
University and Organizing Secretary for the 10
PLANNER 2016, welcomed the dignitaries on the dais
as well as guests and the participants. Mr. R G Lyngdoh,
Vice-Chancellor, Martin Luther Christian University,
inaugurated the Convention by lighting the lamp along
with Prof. Sri Krishna Srivastava, Vice Chancellor, Prof. J
C Binwal, Former University Librarian, Dr. F R Sumer,
Deputy Librarian, NEHU, Prof. Jagtar Singh, Head,
DLIS, Punjabi University, Dr. Jagdish Arora, Director
and Mr. H G Hosamani, Scientist C (LS), INFLIBNET
Centre at Multi Use Conventional Hall, NEHU Campus, th
Shillong on 9 November, 2016.
Dr. Jagdish Arora introduced activities and services of
INFLIBNET Centre briefly and highlighted the
importance of disruptive technology and its application
in the library. In his deliberation, Dr. Arora highlighted
various activities undertaken by the INFLIBNET Centre
for providing quality-based resources for promoting
Dr. F R Sumer, Deputy Librarian, Prof. J C Binwal, Former University Librarian, Prof. Sri Krishna Srivastava, Vice Chancellor, NEHU, Mr. R G Lyngdoh, Vice-Chancellor, Martin Luther Christian University Dr. Jagdish Arora, Director, INFLIBNET Centre, Prof. Jagtar Singh, Head, DLIS, Punjabi University, Mr. H G Hosamani, Scientist C (LS), INFLIBNET
Centre on the Dais during the Inaugural Session
Vol. 23, No. 4 (October to December 2016)7
teaching-learning and research in Indian Universities in
general and North Eastern Universities in particular. He
congratulated all the universities located in North
Eastern region of India in achieving high ranks in NIRF
in comparison to other universities in India. Further, Dr.
Arora apprised the guests and the audience about the e-
Shodhu Sindhu, a new project initiated by INFLIBNET
Centre and encouraged everyone to make use of e-
resources provided by e-Shodh Sindhu.
Prof. Jagtar Singh delivered keynote address. In his
address, he pointed out the role of technologies in
modernisation of library activities and services. He also
emphasised on the role of information literacy/digital
literacy, media literacy, etc. for bridging the gap
between the information poor and information rich. He
stressed upon the role of libraries in materialising
various issues for developing a knowledge-based
society. He advocated the effective use of social media
in libraries for reaching out to unreached in remote
locations.
Prof. J.C. Binwal highlighted the importance of the
libraries from the ancient culture to the digital age and
changing role of librarianship. He emphasised on the
role of libraries in bringing information seekers in touch
with information sources. He also deliberated on the
change of technology from web 1.0 to web 2.0 and web
2.0 to web 3.0. Prof. Binwal also touches upon various
aspects embedded and blended librarianship,
information literacy, knowledge management in
developing knowledge based society.
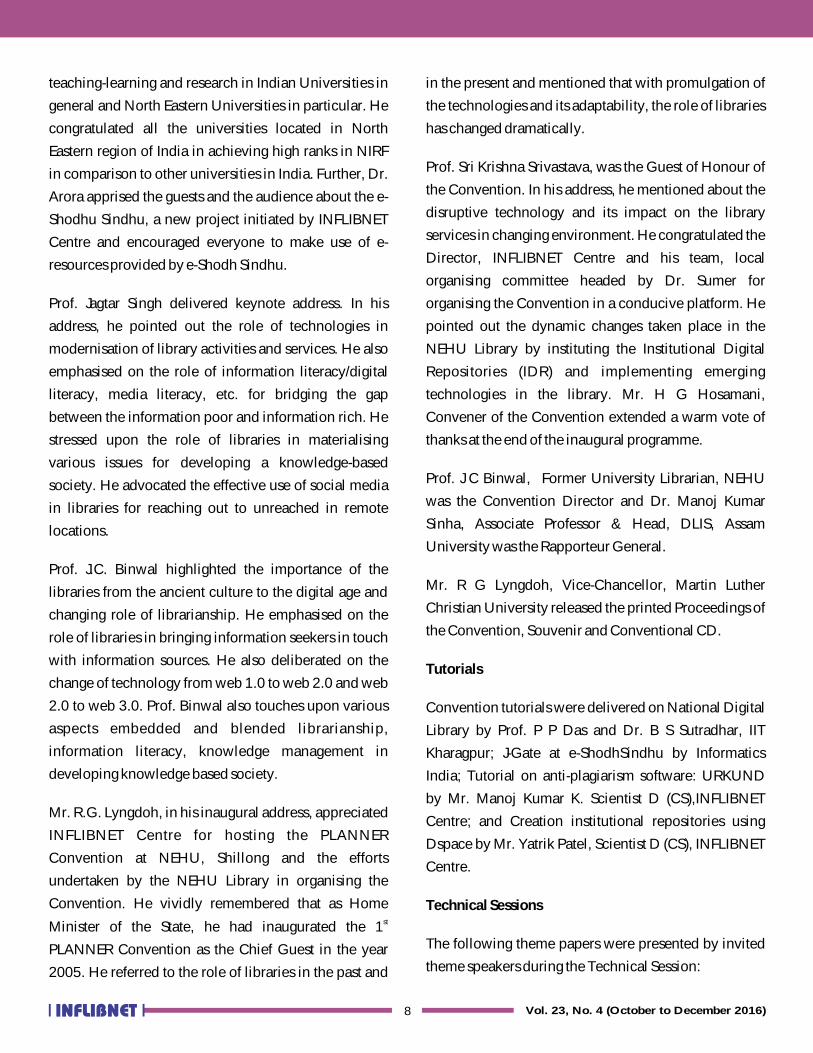
Mr. R.G. Lyngdoh, in his inaugural address, appreciated
INFLIBNET Centre for hosting the PLANNER
Convention at NEHU, Shillong and the efforts
undertaken by the NEHU Library in organising the
Convention. He vividly remembered that as Home st
Minister of the State, he had inaugurated the 1
PLANNER Convention as the Chief Guest in the year
2005. He referred to the role of libraries in the past and
in the present and mentioned that with promulgation of
the technologies and its adaptability, the role of libraries
has changed dramatically.
Prof. Sri Krishna Srivastava, was the Guest of Honour of
the Convention. In his address, he mentioned about the
disruptive technology and its impact on the library
services in changing environment. He congratulated the
Director, INFLIBNET Centre and his team, local
organising committee headed by Dr. Sumer for
organising the Convention in a conducive platform. He
pointed out the dynamic changes taken place in the
NEHU Library by instituting the Institutional Digital
Repositories (IDR) and implementing emerging
technologies in the library. Mr. H G Hosamani,
Convener of the Convention extended a warm vote of
thanks at the end of the inaugural programme.
Prof. J C Binwal, Former University Librarian, NEHU
was the Convention Director and Dr. Manoj Kumar
Sinha, Associate Professor & Head, DLIS, Assam
University was the Rapporteur General.
Mr. R G Lyngdoh, Vice-Chancellor, Martin Luther
Christian University released the printed Proceedings of
the Convention, Souvenir and Conventional CD.
Tutorials
Convention tutorials were delivered on National Digital
Library by Prof. P P Das and Dr. B S Sutradhar, IIT
Kharagpur; J-Gate at e-ShodhSindhu by Informatics
India; Tutorial on anti-plagiarism software: URKUND
by Mr. Manoj Kumar K. Scientist D (CS),INFLIBNET
Centre; and Creation institutional repositories using
Dspace by Mr. Yatrik Patel, Scientist D (CS), INFLIBNET
Centre.
Technical Sessions
The following theme papers were presented by invited
theme speakers during the Technical Session:
Vol. 23, No. 4 (October to December 2016)8

There were 05 technical sessions held during three days wherein 29 papers were presented on various themes as per the details given below:
Sl. No Theme Topic Theme Speaker
1 Technologies for Libraries Glimpses of Semantic Web and Mr. Ravi Shankar Jha, Infosysits Application Across Industries Consultancy
2 Technologies for Libraries Smart Libraries: Powering the Dr. Usha Munshi, Librarian, IIPA,Transition to Learning Common New Delhi
3 Library Management: Disruptive Technology Innovations Prof. R. N. Mishra, Prof. & Head,Collections and Human in Libraries: Impact on future DLISc, Mizoram University,Resources Librarianship Aizawl
4 Innovative Services Disruptive Innovation Services Dr. P. Hensing, Assistant Professor,DLIS, NEHU
Sessions Theme Chairperson Co-chairman/Rapporteur No. ofPapersPresented
Session 1 Technologies for Libraries Mr. Premchand, Librarian, Dr. R. K. Sharma, Librarian, 4IIAS, Shimla UNESCO Information Centre
for India and Bhutan,New Delhi
Session 2 Library Management: Dr. Ashok Rai, Scientist Dr. P.K. Deka, Librarian, 4Collections and Human D (CS) K C Das College, GuwahatiResources
Session 3 Library Management: Prof. Moses M. Naga, HoD, Dr. Lalresiami, Librarian, 8Collections and Human DLISc, NEHU, Shillong Mizoram University,Resources Aizawl
Session 4 Innovative Services Prof. Sanjay Kumar Singh, Dr. Utpal Das, Librarian I/C, 5HoD, DLISc, Gauhati Dibrugarh University,University, Guwahati Dibrugarh
Session 5 Innovative Services Dr. M. N. Motebennur, Dr. Bikika Laloo, Associate 4University Librarian, Krishi Professor, DLIS, North EasternViswavidyalaya, Dharwad HillUniversity, Shillong
Session 6 Innovative Services Dr. Arun Kumar Sharma Dr. Mukesh Saikia, Librarian, 4Tezpur University, Tezpur
Participants of the Convention
,INFLIBNET Centre
Vol. 23, No. 4 (October to December 2016)9

Panel Discussion
A panel discussion on the theme of the Convention
“Disruptive Innovations for Libraries: Adopt, Adapt and
Evolve” was organised prior to the concluding session
of the Convention. Prof. A.S. Chandel, Librarian I/C,
Sikkim University was the Chairman of the Panel
Discussion. Prof. R.N. Mishra, DLISc, Mizoram
University, Prof. Manas Ranjan Mahapatra, IPR-NEC,
Dr. R.K. Mahapatra, Tripura University, Ms. Karen
Donogue, Assistant Professor, Dept of Mass
Communication were the panalist of the panel. Prof.
A.S. Chandel welcomed the panelists and participants.
Thereafter, the panelists deliberated and discussed on
emerging issues on the themes of the Convention. Prof.
Chandel advocated for implementation of ICT tools and
techniques in libraries. He cited the example of
extensive use of CDS/ISIS software developed by
UNESCO for various library-related activities in
nineties. He emphasised on the development of new
ICT gadgets, emergence of Internet and WWW, social
media, web technology and transition of library from
Library 1.0 to Library 2.0 and switching over to Library
3.0, web enabled services, development of applications
for hand held devices like smart phones/mobile, tablets
to access Internet resources.
Dr. Manas Ranjan Mahapatra deliberated on perception
of users about libraries and library services. He
emphasized that the library is treated as a
communication centre and centre for cultural and
national heritage preservation, cultural activities and
discourses. Prof. R.N. Mishra also highlighted the need
for implementing innovative disruptions. He also
advocated for maintaining the present library
automation activities side-by-side before fully
implementing the disruptive innovations. He suggested
the use of disruptive technology for innovative library
activities and services. He said that the library should
work to get return on investment (ROI) for the libraries
which would come from our research scholars and
faculty members in terms of increased research
publications output. Dr. R.K. Mahapatra emphasized on
the need for manpower training and skill development.
He also praised the initiatives taken by the INFLIBNET
Centre for colleges and universities in the North-Eastern
States.
Ms Karen Donogue discussed various disruptive
innovations that are in vogue in library and media. She
also emphasized that professionals from library science,
information science, media / communication science
should come closer and work together.
Valedictory Session
Mr. Hiteshkumar Solanki, Scientist B (CS), INFLIBNET
Centre and Co-Convener of the Convention, delivered
welcome address. Prof. J. C. Binwal, Convention
Director summed up the three days’ convention and
expressed his pleasure on grand success of the
Convention. Dr. Manoj Kumar Sinha, Associate
Professor & Head, DLISc, Assam University and
Rapporteur General of the Convention, extended his
sincere thanks to the organisers for giving him the
responsibility of Rapporteur General in this convention.
Dr. Jagdish Arora, Director, INFLIBNET Centre
congratulated all the members of the Organising
Committee for organising the event meticulously. He
extended his sincere thanks and gratitude to the
Hon’ble Vice-Chancellor, Prof. S.K. Srivastava for
hosting the event. He, on behalf of INFLIBNET Centre,
felicitated all the members of the Local Organising
Committee, staff of INFLIBNET Centre for their
excellent work for organising the three days’ event. Prof.
R.P. Mishra, Dean, School of Economics, Management,
Information Science & Communication, NEHU
appreciated all the efforts of the Central Library and
Dept. of Library and Information Science, NEHU, &
INFLIBNET Centre for organising such a wonderful
mega event in NEHU Campus. Dr. F. R. Sumer
extended warm vote of thanks at the end of the
Convention.
Vol. 23, No. 4 (October to December 2016)10
Recommendations
The following major recommendations were made
during the deliberations of the convention:
v Adequate financial assistance should be provided
to the colleges
and universities
to develop and
maintain well
equipped ICT
l a b o r a t o r i e s ,
digital libraries,
Internet access /
e - r e s o u r c e s
access points in t h
coming XI I I
Five Year Plan
period;
v Organise more training programmes for the LIS
Professionals of North-Eastern Region under the
capacity building programme for new generation
LIS professionals;
v Designate INFLIBNET Centre as the National
Training Agencies for Library and Information
Science professionals, Computer Science
personals, Media personals with full time faculty
and infrastructure for organising continuous
Refresher / Orientation Programme, Training
Programmes, Workshops, Seminars, Conferences,
etc.;
v Introduce disruptive innovations in Libraries to
address the needs of new generation library users;
and
v INFLIBNET Centre should be given the
responsibility to develop state-of-art ICT
infrastructure with arrangement of adequate
learning resources to the Public, Special and
Academic (School, College and University)
Libraries.
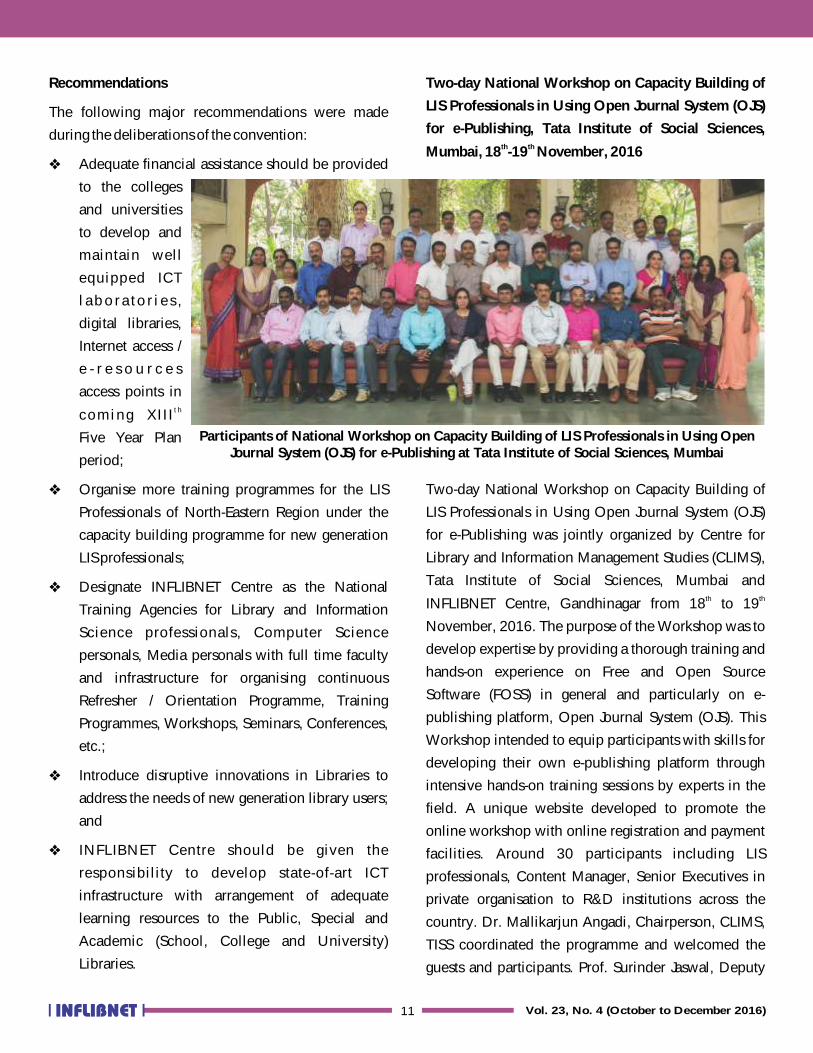
Two-day National Workshop on Capacity Building of
LIS Professionals in Using Open Journal System (OJS)
for e-Publishing, Tata Institute of Social Sciences, th th
Mumbai, 18 -19 November, 2016
Two-day National Workshop on Capacity Building of
LIS Professionals in Using Open Journal System (OJS)
for e-Publishing was jointly organized by Centre for
Library and Information Management Studies (CLIMS),
Tata Institute of Social Sciences, Mumbai and th thINFLIBNET Centre, Gandhinagar from 18 to 19
November, 2016. The purpose of the Workshop was to
develop expertise by providing a thorough training and
hands-on experience on Free and Open Source
Software (FOSS) in general and particularly on e-
publishing platform, Open Journal System (OJS). This
Workshop intended to equip participants with skills for
developing their own e-publishing platform through
intensive hands-on training sessions by experts in the
field. A unique website developed to promote the
online workshop with online registration and payment
facilities. Around 30 participants including LIS
professionals, Content Manager, Senior Executives in
private organisation to R&D institutions across the
country. Dr. Mallikarjun Angadi, Chairperson, CLIMS,
TISS coordinated the programme and welcomed the
guests and participants. Prof. Surinder Jaswal, Deputy
Participants of National Workshop on Capacity Building of LIS Professionals in Using Open Journal System (OJS) for e-Publishing at Tata Institute of Social Sciences, Mumbai
Vol. 23, No. 4 (October to December 2016)11
Director, Tata Institute of Social Sciences, Mumbai
inaugurated the Workshop. In her inaugural address,
she said that TISS, as one of the premier institutes in the
country, has always responded to the needs of the
society in terms of offering quality higher education to
the pupils. She wished all the participants to gain as
much knowledge as possible from this unique
Workshop and assured all possible help to conduct
many more such workshops useful to LIS professionals
in future. Prof. M Mariappan, Chairperson, Centre for
Hospital Administration, School of Health System
Studies, TISS was the Chief Guest for the concluding
and certificate distribution function. Dr. Mallikarjun
Angadi, Chairperson, CLIMS, Dr. J. Shivarama, Asst.
Professor, CLIMS and Mr. Gaurav Prakash, Scientist B
(CS), INFLIBNET Centre were the resource persons.
Around 30 participants participated in the Workshop.
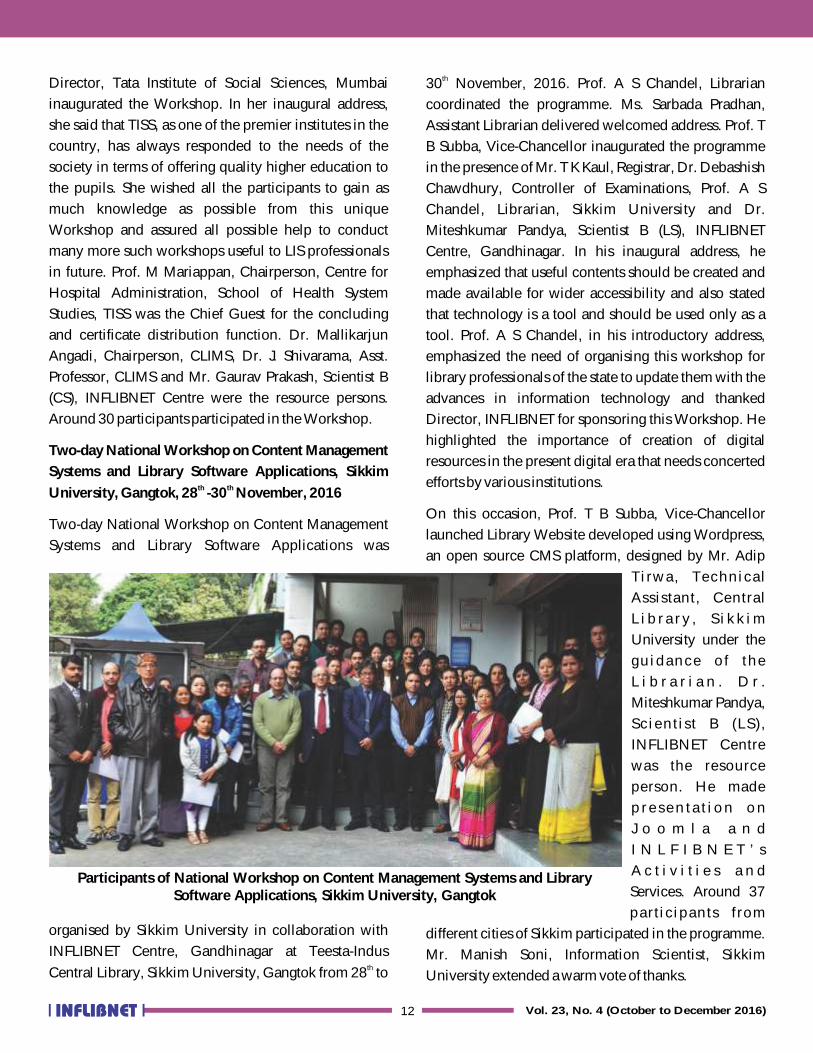
Two-day National Workshop on Content Management
Systems and Library Software Applications, Sikkim th th
University, Gangtok, 28 -30 November, 2016
Two-day National Workshop on Content Management
Systems and Library Software Applications was
organised by Sikkim University in collaboration with
INFLIBNET Centre, Gandhinagar at Teesta-Indus thCentral Library, Sikkim University, Gangtok from 28 to
Participants of National Workshop on Content Management Systems and Library Software Applications, Sikkim University, Gangtok
th30 November, 2016. Prof. A S Chandel, Librarian
coordinated the programme. Ms. Sarbada Pradhan,
Assistant Librarian delivered welcomed address. Prof. T
B Subba, Vice-Chancellor inaugurated the programme
in the presence of Mr. T K Kaul, Registrar, Dr. Debashish
Chawdhury, Controller of Examinations, Prof. A S
Chandel, Librarian, Sikkim University and Dr.
Miteshkumar Pandya, Scientist B (LS), INFLIBNET
Centre, Gandhinagar. In his inaugural address, he
emphasized that useful contents should be created and
made available for wider accessibility and also stated
that technology is a tool and should be used only as a
tool. Prof. A S Chandel, in his introductory address,
emphasized the need of organising this workshop for
library professionals of the state to update them with the
advances in information technology and thanked
Director, INFLIBNET for sponsoring this Workshop. He
highlighted the importance of creation of digital
resources in the present digital era that needs concerted
efforts by various institutions.
On this occasion, Prof. T B Subba, Vice-Chancellor
launched Library Website developed using Wordpress,
an open source CMS platform, designed by Mr. Adip
Ti rwa, Technical
Assistant, Central
L i b r a r y , S i k k i m
University under the
gu idance o f the
L i b r a r i a n . D r .
Miteshkumar Pandya,
Sc ient i s t B (LS ) ,
INFLIBNET Centre
was the resource
person. He made
p r e s e n t a t i o n o n
J o o m l a a n d
I N L F I B N E T ’ s
A c t i v i t i e s a n d
Services. Around 37
part icipants f rom
different cities of Sikkim participated in the programme.
Mr. Manish Soni, Information Scientist, Sikkim
University extended a warm vote of thanks.
Vol. 23, No. 4 (October to December 2016)12

In the valedictory Session, Mr. Jitendra Singh Raje, IAS,
Director, Higher Education, Govt. of Sikkim was the
chief guest. In his address, he talked on importance of e-
content and content creation. He also mentioned that
he would initiate advanced library system in colleges of
Sikkim very soon. He further appreciated the remote
access service provided by Central Library, Sikkim
University to the affiliated colleges of Sikkim.
Three-Day Advanced Training Programme on thShodhganga, INFLIBNET Centre, Gandhinagar, 14 -
th16 December, 2016
Three-day Advanced Training Programme on
Shodhganga was organised at INFLIBNET Centre, th th
Gandhinagar from 14 to 16 December, 2016. Mr.
Manoj Kumar K., Scientist D (CS) and Ms Suboohi S, STO
(LS) coordinated the programme. Prof. Krishna Amin-
Patel, Centre Head, PG Campus, National Institute of
Design (NID), Gandhinagar inaugurated the programme
by lighting the ceremonial lamp. In her inaugural address,
she emphasized the importance of research and ETDs and
plagiarism detection software and services provided by
the INFLIBNET Centre. Mr. H. G. Hosamani, Scientist C
(LS) extended warm vote of thanks. Around 25
participants participated in the workshop. The Workshop
covered theoretical and practical sessions on the
following topics related to Shodhganga:
Topics Name of Expert and Institution
International ETD Programmes/ Projects: An overview Dr. T. S. Kumbar, Librarian, IIT Gandhinagar
Introduction to Shodhganga/ Shodhgangotri and Mr. Manoj Kumar K, Scientist D (CS), INFLIBNET CentreOverview of UGC Guidelines
Standards and Formats for Digitization Mr. Manoj Kumar K, Scientist D (CS), INFLIBNET Centre
Introduction to DSpace and Building IR Mr. Swapnil Patel, Scientist B (CS), INFLIBNET Centre
Institutional Repositories (IR) and Altmetrics Mr. Pallab Pradhan, Scientist B (LS), INFLIBNET Centre
Implementation of National Federated Access Mr Raja V., Scientist B (CS), INFLIBNET CentreManagement Solution for Consortium basedAccess to E-Resources
Anti-Plagiarism Tools and Services and Hands on Ms. Suboohi S, STO (LS), INFLIBNET Centre
Dr. Kumud Sharma, University of Delhi, Dr. (Mrs.) Pankaj Mittal, Additional Secretary, UGC, Prof. Ram Bux, Department of Hindi, Jawaharlal Nehru University, and Dr. Jagdish Arora, Director, INFLIBNET Center on the Dais
during Valedictory Function of Advanced Training Programme on Shodhganga at INFLIBNET Centre
Vol. 23, No. 4 (October to December 2016)13

In the valedictory function, members of the Hindi Samiti
were invited as special guests for the programme. Dr.
(Mrs.) Pankaj Mittal, Additional Secretary, UGC and
F o r m e r V i c e C h a n c e l l o r , B . P . S . M a h i l a
Vishwavidyalaya delivered the valedictory address and
along with Prof. Ram Bux, Department of Hindi,
Jawaharlal Nehru University (JNU), Dr. Kumud Sharma,
University of Delhi and Dr. Jagdish Arora, Director,
INFLIBNET Centre. The invited guests distributed
certificates to the participants at the end of the
programme.
Three-day National Workshop on Data and Statistical
Analysis using R Programming INFLIBNET Centre, th stGandhinagar, 19 – 21 December, 2016
Three-day National Workshop on Data and Statistical
Analysis using R Programming was organised at
th stINFLIBNET Centre, Gandhinagar from 19 to 21
December, 2016. Mr. Hitesh Solanki, Scientist B (CS),
Mr. Divyakant Vaghela, Scientist B (CS) and Mr. H G
Hosamani, Scientist C (LS) coordinated the programme.
Dr. Jagdish Arora, Director lighted the ceremonial lamp
along with Mr. Manoj Kumar K., Scientist D (CS), Mr.
Hitesh Solanki, Scientist B (CS), Mr. Divyakant Vaghela,
Scientist B (CS), INFLIBNET Centre during the inaugural
function. The aim of this Workshop was to provide
basic training in understanding the concepts in data
science and statistical analysis using R programming.
The R programming language is one of the most widely
used programming languages among the data scientists
and researchers. It is open source software and allows
integration with other applications. Following
theoretical sessions were conducted during the
Workshop:
Topics Name of Expert and Institution
INFLIBNET Activities and Service Mr. Yatrik Patel, Scientist D (CS), INFLIBNET Centre
Introduction to R programming (Installation, getting Mr. Divyakant Vaghela, Scientist B (CS), INFLIBNETStarted R, Tinn-R, Rcommander, RStudio) Centre
Data Types in R (Constants, vectors, matrix, Ms. Mitisha Vaidya, Project Officer (CS), INFLIBNETdataframes, lists) Centre
Importing and handling data in R Mr. Hitesh Solanki, Scientist B (CS), INFLIBNET Centre
Introduction to R programming (Working with functions, Dr. R. D. Chaudhari, Associate Professor, M G Sciencesummary measures) Institute, Ahmedabad
Statistical Analysis using R (Hypothesis Testing: Dr. Dharmesh Raykundaliya, Assistant Professor,Parametric and Non-parametric) Sardar Patel University, Anand
Statistical Analysis using R(Correlation and Linear Dr. R. D. Chaudhari, Associate Professor, M G ScienceRegression Modelling) Institute, Ahmedabad
Statistical Analysis using R (Probability Distributions) Dr. Dharmesh Raykundaliya, Assistant Professor,Sardar Patel University, Anand
Statistical Analysis using R (Analysis of Variance : Dr. Dharmesh Raykundaliya, Assistant Professor,Linear Model) Sardar Patel University, Anand
Data visualization using R : Base, lattice and Dr. R. D. Chaudhari, Associate Professor, M G Scienceggplot packages Institute, Ahmedabad
Reproducible research using R and Rstudio (knitr and Dr. R. D. Chaudhari, Associate Professor, M Gmarkdown packages) Science Institute, Ahmedabad
Vol. 23, No. 4 (October to December 2016)14
Mr. Hitesh Solanki and Mr. Divyakant Vaghela,
Scientists B (CS), Ms. Mitisha Vaidya, Project Officer
(CS) and Ms. Tulsi Punjani, Project Assistant (Statistics)
were resource persons in practical sessions of the
training programme. The certificates of participation
were distributed at the end of programme. Around 20
participants including IT professionals, LIS professionals
and research scholars attended the programme. Mr. H.
G. Hosamani, Scientist C (LS) extended a warm vote of
thanks at the end of the Workshop.
E-Content Development / Meeting /Workshop undere-PG Pathshala
Meeting of Reviewer under the subject ‘Sociology’, thINFLIBNET Centre, Gandhinagar, 29 November,
2016
The INFLIBNET Centre organised meeting of Reviewer,
to review the modules and video recording of MOOCs th
Course of the papers under the subject Sociology on 29
November, 2016. Mr. Abhishek Kumar, Scientist C
(CS), INFLIBNET Centre briefed about the activities to
be carried out by the reviewer to convert the ePG
Pathshala e-Content into MOOCs courses. E-text and
self-assessment of papers reviewed by PI, Prof. Sujata
Patel, Department of Sociology, University of
Hyderabad, Hyderabad.
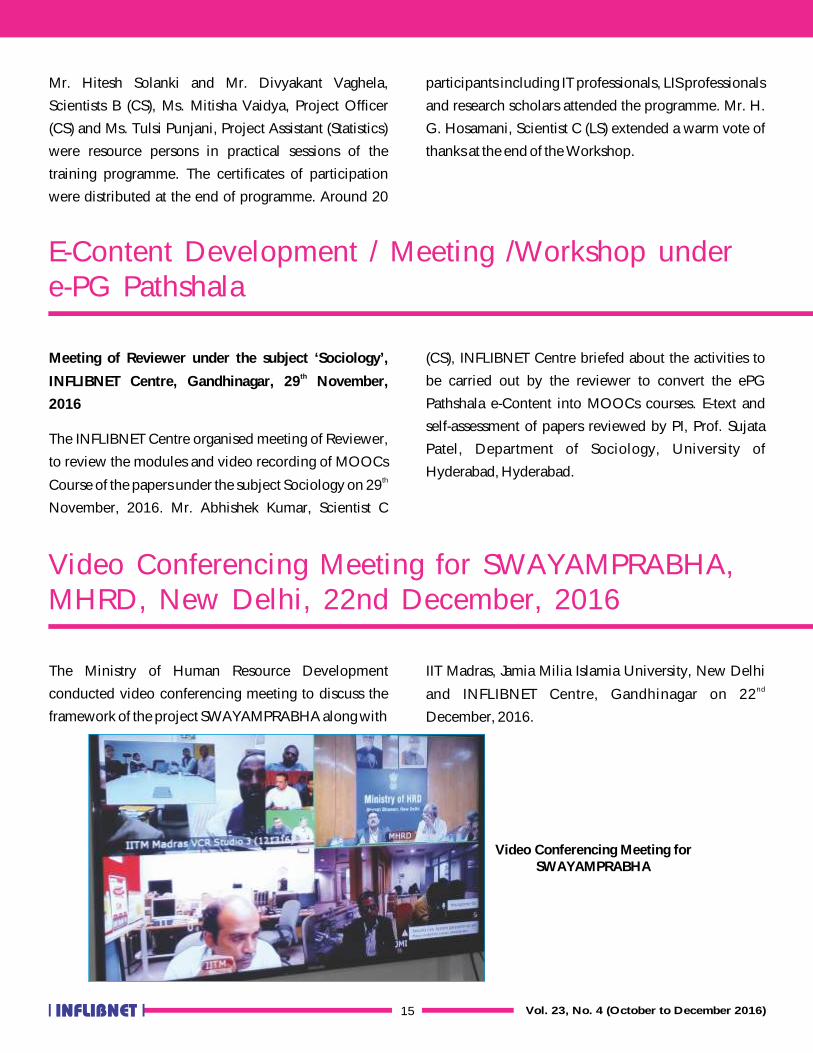
Video Conferencing Meeting for SWAYAMPRABHA,MHRD, New Delhi, 22nd December, 2016
The Ministry of Human Resource Development
conducted video conferencing meeting to discuss the
framework of the project SWAYAMPRABHA along with
IIT Madras, Jamia Milia Islamia University, New Delhi ndand INFLIBNET Centre, Gandhinagar on 22
December, 2016.
Video Conferencing Meeting forSWAYAMPRABHA
Vol. 23, No. 4 (October to December 2016)15

Navratri
The INFLIBNET Centre celebrated Garba festival with
great enthusiasm. The Garba night was organized for its th
employees and their families on 7 October 2016. The
function started with Durga Puja and everyone from the
campus, staff member and their families participated.
The employees and their families turned out in their best
traditional attire. Dr. Jagdish Arora, Director,
INFLIBNET Centre distributed the prizes for the best
dance performers, best-dressed persons and children.
The function concluded with the ceremonial dinner.
Navratri @INFLIBNET Centre
Vol. 23, No. 4 (October to December 2016)16

Joomla: An Open Source Content Management System
Content Management System allows user to create and
edit web content without knowing web scripting
language and backend database. It support feature
called “What You See is What You Get” (WYSIWYG),
which means that the content which is displayed in the
editor would have the same look and feel for the end-
users interface. In most content management system
WYSIWYG editor is available, which allows user to
manage their content without having programming
expertise.
Joomla is an open source software which is one of the
most advanced content management systems. It is
distributed under the terms of the GNU General Public
License (GPL). It could be easily managed by the person
with low technical background. A person having basic
knowledge of HTML and CSS can also work efficiently
on Joomla CMS. It is being used to create a professional
portal/website with good look and feel without having
operating knowledge of computer compared to other
CMS platforms. Every CMS has its own terminology to
describe various functions knitted in a specific
sequence.
It can easily be one of the best choices for creating
integrated digital frameworks required for showcasing
the libraries activities. One can extend it with different
add-ons or modules which are available free of cost. It
has the ability to change the theme based on the user’s
requirement. This enables website creator to enhance
the presentation of the website. Joomla distributions are
bundled, one can use it as kit for starting the
development and various components can be used to
enhance Joomla’s core abilities. It is also powerful,
scalable and sophisticated CMS (Content Management
System) for building and managing template based
websites/portals. The web based and menu-driven
interface allows users to create contents without any
limitations. Joomla allows user to create content in the
form of articles and that can be assigned with a menus.
Joomla also has various modules which can be
integrated with its core setup. Developers of the Joomla
have also contributed language independent modules
for non-English languages which can be customized.
Users can create their content in the form of articles. The
word “article” is used to describe the content of a unit
that is created in Joomla. An article, however, could be a
complete description of a concept, or just a single page
of content. The articles are used to encourage creation
of smaller, more manageable units of electronic
content/information, perhaps focused on a small
number of sub-topics. These articles could be linked
with various menus which are visible in the user
interface/website.
Joomla, basically, deals with content that includes
textual material, multimedia, presentations, etc.
Pre-requisites
Following pre-requisites software are required before
installing Drupal:
• Windows or Linux OS
• HTTP Web Server (Apache Web server or IIS)
• PHP 5.0.4+
• MySQL - 4.1.10+
Technical Features
• Software is capable to develop web portals;
• It has powerful media manager which can be used
to manage multimedia and image files;
Vol. 23, No. 4 (October to December 2016)17

•
available at no cost;
• Joomla uses Bootstrap 3 for creating responsive
web portals;
• It uses PHP as scripting language, MySql as
database and Apache as web server;
• Web based interface for in-house operations;
• It has extensive control panel/dashboard for
creating and managing contents and menus;
• It also facilitates integration of external payment
gateway module for the portals which are dealing
with online payments;
• The software has inbuilt Banner Manager which
provides facility to change or manage banners as
per the requirement;
• Components are available free of cost to enhance
the core of Joomla;
• It has a feature called ‘search better search smarter’
which provides facility to search within the
website;
• In case, user is not able to categorise the content,
they can use tagging option available for
distinguishing the content;
• Access Control List allows users to manage the
users of their website, and different groups;
• Supports Unicode standard for multi-lingual
contents; and
• Flexibility of database structure.
Content Licensing - As stated above, Joomla is released
under GNU General Public License and Joomla’s
online documentation is compiled by individual
contributors which are available in open domain with
Joomla! Electronic Documentation License (JEDL).
It can be customized with dynamic themes Future Developments
Developers of the Joomla are committed to enhance its
features and functionalities with the changing needs of
the community. As and when new development takes
place in the field of website development, the software
is being updated accordingly.
Joomla Themes - A theme manager is an integral part of
the core instance of Joomla. It allows content authors to
have control over the look and feel of the content that
they create. There are many websites that provide
version wise templates/themes for Joomla.
User Forum and Support
Joomla software is most widely used open source
software for creating websites and portals. It offers
solution to various problems occurred while using
through community forum. User can register
themselves and raise their questions to get possible
solution of the query. One can register his email ID at
https://forum.joomla.org/ to get email alerts from the
active users.
References:
1. Joomla! - Forum. (2016). Retrieved December 26,
2016, from https://forum.joomla.org/
2. Joomla! The CMS Trusted by millions for their
Websites. (2016). Retrieved December 26, 2016,
from https://www.joomla.org/
3. Severdia, R. (2016). Joomla! Core Features.
Re t r i eved December 26 , 2016 , f rom
https://www.joomla.org/core-features.html
4. Shehu, A. (2016). Building Websites With Joomla!
3: Learn How to Develop Impressive and High
Quality Websites in Minutes. A Basic Computer &
Internet Skill Is All You Need. Partridge Singapore.
Vol. 23, No. 4 (October to December 2016)18
Article
1. Introduction
In the fastest growing technological world of
information communication technology & scientific
research and development, an overwhelming amount
of information / data in various formats is generated
directly or indirectly. As far as academic and scientific
community is concerned, a large number of scholarly
articles are being published on daily basis by research
scholars and academician across the world.
Bibliometric and scientometric analysis, science
mapping and visualization techniques are used to
understand the evolution of scientific knowledge,
intellectual concepts, social structures, inter-
connections and inter-relationships of thousands of,
millions of scholarly articles. Bibliographies, references
and citation data retrieved from databases like Google
Scholar, Web of Science and Scopus are used to
conduct such analysis and studies to measure the
scientific productivity, and to analyse impact of
scientific research embedded in research articles.
According to Encyclopaedia of Information Science and
Technology, IGI Global: “Science mapping is the
development and application of computational
techniques to the visualization, analysis, and modelling
of a broad range of scientific and technological activities
as a whole”. Mapping of science is nothing but to
represent complex, abstract or raw data in a visually
understandable format. Mapping of science helps to
clearly understand the concepts of science, making
them more lively visible and concrete. The fundamental
principle of science mapping is to represent the body of
scientific literature in a tangible form so that one can
handle it more effectively. A science map provides an
overview of the scientific landscape which can be used
to support exploration, description, or explanation of
the state and development of scientific knowledge and
practices. Citations provide insights into value of
published article by the scientific community.
The workflow of science mapping consists of a number
of steps including data retrieval, pre-processing,
network extraction, normalization, mapping, analysis
and visualization. At the end of this process, the analyst
has to interpret and obtain some conclusions from the
results (Cobo et al., 2011).According to Tech Target,
“Data visualization is a general term that describes any
effort to help people understand the significance of data
by placing it in a visual context. Patterns, trends and
correlations that might go undetected in text-based data
can be exposed and recognized easily with data
visualization software.
Bibliometrics / Scientometrics involve quantitative
studies of scientific literatures. These studies include
Science mapping and visualization techniques are used for data analysis in bibliometric and scientometric studies.
Science mapping and visualization helps to explore the scientific knowledge, make it livelier by visualizing and
showcasing the impact of research by displaying the structural relationship and dynamics of scientific research
domains. Various software tools have been developed incorporating different science mapping and visualization
techniques. This article briefly presents features and functions of such software tools used for data analysis in
bibliometric and scientometric studies.
Pallab Pradhan, Scientist B (LS)
Science Mapping and Visualization Tools used in Bibliometric & Scientometric Studies: An Overview
Vol. 23, No. 4 (October to December 2016)19
topics like data analysis, science mapping, and
visualization, etc. The Online Dictionary of Library and
Information Science (ODLIS) defines Scientometrics
software as set of computer based programs, designed
and developed to analyse citation based bibliographic
data as input to perform the specific tasks i.e. structural
analysis of scholarly communication, mapping of
scientific research, creation of metrics based social
maps, information representation and organisation,
visualisation of research, micro level analysis (co-word,
co-author, cited references, bibliographic coupling, co-
citation) etc. as output (Kumar, Shivarama,
&Choukimath, 2015).
There are a number of science mapping and
visualization software tools specifically used in
bibliometric &scientometric studies available free of
cost on the Internet. Most of these software tools are
based on modern mathematical algorithms, statistical
methods, graphs theory, sophisticated networks theory
and visualization techniques, etc. This article briefly
elaborates features and functions of software tools
available for science mapping and visualization.
2. Bibliometric & Scientometric Analysis, Science
Mapping, and Visualization Software Tools
2.1 BibExcel
Bibexcel is a versatile bibliometric toolbox developed
by Olle Persson, Department of Sociology, Umea
University, Umea, Sweden. BibExcel is specifically
designed to assist a user in analysing bibliographic data,
or any data of textual nature formatted in a similar
manner. The idea is to generate data files that can be
imported to Excel, or any program that takes tabbed data
records, for further processing. BibExcel can read data
retrieved from different bibliographic sources, such as
ISI Web of Science (WoS), Scopus in Procite export
format, also it can convert to other formats. In Bibexcel,
it is possible to do most types of bibliometric analysis,
e.g. bibliometric, citation analysis, co-citation, shared
references, bibliographic coupling, cluster analysis,
prepare bibliometric maps for mapping with Pajek,
NetDraw.
This tool-box includes a number of tools, some of them
visible in the window interface and others hide behind
the menus. Many of the tools can be used in
combination to achieve the desired result. The program
offers a high degree of flexibility to the users in both data
management and analysis which is one of the real
strengths of this tool. Bibexcel allows easy interaction
with other software, e.g. Pajek, Excel, SPSS, etc.
BibExcel can produce net-files for co-authorships, co-
citations etc, and then convert these files for further
analysis and visualization with Pajek. BibExcel can also
make clu-files and vec-files for Pajek which is freely
available on the net.
BibExcel is a free-ware for academic and non-profit use.
The so f twa re c an be down loaded f r om
http://homepage.univie.ac.at/juan.gorraiz/bibexcel/.
2.2 BiblioTool
BiblioTools 2.2, is a set of python scripts developed by
Sebastian Grauwin for transforming raw bibliographic
data as extracted from the Web of Science into “maps of
science” gathering relevant information about millions
of articles in a single picture. These scripts are designed
to be used as a black box, i.e. no prior knowledge of
python is required for using them. However, user is free
to change the codes if they want to which should help
them to generate their own desired “maps of science”.
BiblioTools1.0 was first released in 2011 based on SQL
queries. Further, in July 2012, BiblioTools 2.1 was
released based on python scripts with updates and
corrections in years 2012 and 2014. User can download
BiblioTools 2.2 file, unzip it and place the unzipped
folder wherever they want to install. The BiblioTools
scripts have been heavily tested on Unix, Mac and
Windows. In order to run them, user need to be able to
Vol. 23, No. 4 (October to December 2016)20
run python and need to have the following packages
installed: argparse, numpy, matplotlib, networkx.
BiblioTools 2.2 can be downloaded from:
http://www.sebastian-grauwin.com/?page_id=427.
User need to have an access to the Web of Science to
extract bibliographic data, gephi to open and visualize
the different maps produced by the scripts, and a latex
compiler to visualize some tables produce by the scripts
in pdf format. BiblioTools 2.2 can perform various
bibliometrics related exercises, e.g. data parsing,
f i l ter ing, detect ing bibl iographic coupling
communities, co-occurrence maps, etc.
2.3 CiteSpace
CiteSpace is a freely available Java application
developed by Chaomei Chen, College of Information
Science and Technology, Drexel University,
Philadelphia, USA for progressive knowledge domain
visualization and analyzing trends and patterns in
scientific literature. It helps to conduct interactive visual
analytic studies of scientific literature concerning a
scientific field, a discipline, or an institution, and
identify and interpret salient patterns and trends.
CiteSpace provides various functions to facilitate the
understanding and interpretation of network patterns
and historical patterns, including identifying the fast-
growth topical areas, finding citation hotspots in the
land of publications, decomposing a network into
clusters, automatic labelling clusters with terms from
citing articles, geospatial patterns of collaboration, and
unique areas of international collaboration. CiteSpace
supports structural and temporal analyses of a variety of
networks derived from scientific publications,
including collaboration networks, author co-citation
networks, and document co-citation networks. It also
supports networks of hybrid node types such as terms,
institutions, and countries, and hybrid link types such as
co-citation, co-occurrence, and directed citing links.
The primary source of input data for CiteSpace is the
Web of Science. CiteSpace also provides some simple
interfaces for obtaining data from PubMed, arXiv, ADS,
and NSF Award Abstracts. CiteSpace can be used to
generate geographic map overlays viewable in Google
Earth map based on the locations of authors.
CiteSpace software is freely available. The current
version of the software is 5.0.R3 SE. As CiteSpace is a
Java application, user need to make sure that their
computer supports Java, including Windows, Linux or
Mac, and Java Runtime (JRE) is installed on computer. It
is currently optimized for Windows 64-bit Java 8 (i.e.
Java 1.8) and can be downloaded f rom:
http://cluster.ischool.drexel.edu/~cchen/citespace/do
wnload/.
2.4 CitNet Explorer
CitNetExplorer is a Java based software tool developed
by Nees Jan van Eck and LudoWaltman at Centre for
Science and Technology Studies (CWTS), Leiden
University, Netherlands. It is a software tool for
visualizing and analyzing citation networks of scientific
publications. The tool allows citation networks to be
imported directly from the Web of Science database and
can be exported in the popular Pajek file format.
Citation networks can be explored interactively by
using zoom and scroll functionality, for instance by
drilling down into a network and by identifying clusters
of closely related publications, direct and higher-order
indirect citation relations.
CitNetExplorer is freely available for non-commercial
research and teaching purposes, and distributed under a
non-commercial research and teaching license. CitNet
Explorer version 1.0.0, released on March 10, 2014,
c a n b e d o w n l o a d e d f r o m : h t t p : / /
www.citnetexplorer.nl/download. To run CitNet
Explorer, user need to install Java version 6 or higher in
their system.
Vol. 23, No. 4 (October to December 2016)21
2.5 VOSviewer
VOSviewer is a free Java based program, primarily
developed by Nees Jan van Eck and Ludo Waltman at
Centre for Science and Technology Studies (CWTS),
Leiden University, Netherlands. It is a software tool for
constructing and visualizing bibliometric networks.
These networks may for instance include journals,
researchers, or individual publications, and they can be
constructed based on co-citation, bibliographic
coupling, or co-authorship relations. VOSviewer also
offers text mining functionality that can be used to
construct and visualize co-occurrence networks of
important terms extracted from a body of scientific
literature.
VOSviewer provides a number of advanced features for
creating bibliometric networks (e.g., co-authorship,
bibliographic coupling, and co-citation networks). For
instance, the influence of publications with many
authors, many citations, or many references can be
reduced using a fractional counting approach. Data
cleaning can be performed using thesaurus files. Co-
authorship networks, co-occurrence networks, and
citation-based networks can be created directly based
on Web of Science, Scopus, PubMed, and RIS files.
Networks can be imported from and exported to Pajek
network files and GML files. Natural language
processing techniques are inbuilt in the software for
creating term co-occurrence networks based on English-
language textual data. Also, state-of-the-art techniques
for network layout and network clustering are available
in the software. Visualizations of bibliometric networks
can be explored in full detail using zoom and scroll
functionality.
The software is freely available to use for any purpose.
VOSviewer version 1.6.5, released on September 28,
2 0 1 6 , c a n b e d o w n l o a d e d f r o m :
http://www.vosviewer.com/download. To run
CitNetExplorer, user need to have Java version 6 or
higher installed in their system.
2.6 CopalRed
CoPalRed is a Knowledge System developed by Rafael 3
Bailón-Moreno at EC Research Group at Department of
Chemical Engineering. University of Granada, Spain in
2003. CoPalRed collects the information contained in
the databases, e.g. WOS, Scopus, MedLine, ProCite,
etc. and transforms it into new knowledge, which was
not explicit in the information contained in the
databases, but is generated from the information
contained therein. Since July 2011, CopalRed has
changed its name to Techne Co Word, since it continues
its development under the cover of the research group
“Techne, Knowledge and Product Engineering”. Its
current stable version is 2.0 released in July, 2011. It
works only on Windows operating system.
CopalRed, as a knowledge system, consists of mainly
four modules, i.e. information capture, information
debugging, knowledge base generation, and
knowledge management module.
CoPalRed is mainly able to perform three types of
analysis:
v Structural analysis: It reveals the network structure
of the scientific field under study, defining the
actors and their relationships.
v Strategic analysis: It places each actor in a relative
position within the network, defining it according
to the intensity of its external relations (centrality)
and according to its internal cohesion (density).
v Dynamic analysis: It analyzes the transformations
(translations-translations) of the actors over time.
Identifies approaches, bifurcations, appearances
and disappearances of the actors.
CoPalRed generates two types of outputs of knowledge:
v Specific outputs that can be displayed on screen,
printed or saved; and
v Compatible standard outputs which are a set of
reports with content similar to the specific outputs,
Vol. 23, No. 4 (October to December 2016)22

but with the particularity of being presented in
formats compatible to Microsoft Word and
Microsoft Excel.
CopalRed’s knowledge management module is capable
of performing various bibliometrics functions including
drawing networks and exporting them to any image
editor, rotating them, changing thresholds, Bradford
distributions, Lotka distributions, affiliations,
bibliographies, ranking of documents by relevance, and
so on in any combination of themes or subnets.
2.7 CRExplorer
The CRExplorer is a new software based on the
programs provided at Loet Leydesdorff’s homepage
athttp://www.leydesdorff.net/software/rpys/.The
developers of CRExplorer are Andreas Thor, Werner
Marx, Lutz Bornmann (Germany) and Loet Leydesdorff,
(The Netherlands). The CRExplorer uses data from Web
of Science or Scopus databases as input. User needs to
download publication sets including the references
cited to analyse in CRExplorer. The program focusses on
the analysis of the cited references, in particular on the
referenced publication years. When the aggregated
citations are plotted along the time axis, one obtains a
“spectrogram” with distinct peaks. CRExplorer
visualizes this spectrogram, cleans the cited references
(called “disambiguation”), and uses a smoothening
algorithm to suppress the noise. The CRExplorer uses
the Reference Publication Year Spectroscopy (RPYS)
method which was developed by Werner Marx, who
used it for the first time in the field of meteorology.
CRExplorer requires a system with Java 8 support (Java
Run Time) to run. There are two options to run
CRExplorer:
v Java Web Start: Click the CRExplorer Start link to
launch CRExplorer directly from this web page
using Java Web Start Launcher.
v Download: You can download a runnable JAR file.
On most systems, a double click on the JAR file will
start CRExplorer.
The last version of CRExplorer 1.6.8 was released on
August 29, 2016. This software has different features,
such as:
v It reads files from Scopus. The file format “CSV”
(including citations, abstracts and references)
downloaded from Scopus.
v CRExplorer exports files in the Web of Science and
Scopus format. These files can be imported in other
bibliometric programs (e.g. VOSviewer).
v Internal file format: working files are/can be saved
in the internal file format “*.cre”.
v Co-citation for cited references which are co-cited
in a specific publication and data clustering.
2.8 Inter Disciplinary Research (IDR) Toolkit
The IDR toolkit offers a novel tool, the overlay maps of
science, as a method to explore the degree of
interdisciplinary of a set of publications. It was
developed by Dr. Alan Porter andDr. Ismael Rafols.The
overlay technique visualizes the spread of publications
over the global map of science, i.e. the structure of
science as obtained from the analysis of cross-citations
between disciplines. It follows the method introduced
in Rafols & Meyer (2010) to create the overlay map on
the basis of a global map of science. It helps to visually
locate bodies of research within the sciences, both at
each moment of time and dynamically. A user has to
rely on access to the Web of Science to obtain the set of
Web of Science Categories (WCs) for a given set of
articles and the files available in mapping kit (also
available at http://users.fmg.uva.nl/lleydesdorff/
overlaytoolkit/). The objective is to obtain the set of
Web of Science Categories (WCs) for a given set of
articles; provide this to network software; and output
overlay information to add to a suitable basemap using
Pajek and/or VOSviewer.
Vol. 23, No. 4 (October to December 2016)23

The analysis can be carried out at different units of
aggregation in IDR: for example, for a university or
corporation, for a research topic, or for a research
programme or funding agency. By locating the
publications over the map of science, user can gain an
understanding of the diversity of disciplines involved.
Since attribution of publications to disciplines is
problematic and controversial, the overlay maps are
only reliable with large numbers. In IDR, a user need to
have a set of at least 70 publications for an exploratory
map, but for accurate representations, it is
recommended to have above 1,000 publications.
The maps allow one to intuitively perceive various
aspects of disciplinary diversity. First, the number of
disciplines involved. Second, the balance of disciplines,
i.e. whether publications are evenly distributed or some
disciplines are predominant. Third, and crucially, the
cognitive distance between the disciplines involved
–whether the research investigated covers disparate or
cognate areas of science. This aspect of disparity is a key
advantage of the maps: they differentiate between short-
range interdisciplinarity (e.g. chemistry and physics), or
long-range interdisciplinarity (e.g. social science and
biology). Measures of interdisciplinarity can be
associated with these maps.
2.9 IN-SPIRE
IN-SPIRE™ Visual Document Analysis, a powerful
information visualization software is developed by
Pacific Northwest National Laboratory with assistance
from U.S. Department of Energy. It is designed to help
analyst to uncover relationships, trends, and themes
hidden within data which can lead to new knowledge
and new insights that could be used to assess terrorist
threats, determine how to treat a medical condition, or
gather market research on the competition and many
more.
IN-SPIRE™ can quickly and automatically convey the
gist of large sets of unformatted text documents such as
technical reports, web data, newswire feeds and
message traffic. IN-SPIRE™ can handle real-time data by
adding new documents as they arrive. It also processes
foreign language data and provides robust support for
translation. By clustering similar documents together.
This Windows-based software unveils common themes
and reveals hidden relationships within the collection.
IN-SPIRE™ analyses a multitude of text files and
determines key topics or themes in each to create a
signature for each document in the collection. IN-
SPIRE’s two main visualizations display representations
of the documents in which those with similar or related
topics appear closer together. The Galaxy visualization
uses the metaphor of the stars in the night sky with each
star representing an individual document. The
ThemeView™ visualization uses a 3-dimensional terrain
map display to provide a high-level overview of the
data. The Search tools in IN-SPIRE™ support simple
queries, phrase queries, and queries with example text.
Other tools help to explore trends over time and
relationships between concepts.
IN-SPIRE™ has in-built algorithms to perform various
analyses, such as:
v : IN-SPIRE comes bundled with
an entity extractor that extracts People,
Organizations, Locations, E-mail addresses, web
addresses, and more.
v Automatic Keyword Extraction: Essential
keywords and phrases are now automatically
identified and extracted when documents are
processed by IN-SPIRE, enabling keywords and
phrases such as “united states”, “supreme court”,
and “pope benedict.”
v Themes: Keywords and phrases are grouped into
themes based on their co-occurrence within
documents in a dataset.
v Surprising Terms: The Time tool’s terms view uses
a new algorithm to analyze change in term
Entity Extraction
Vol. 23, No. 4 (October to December 2016)24

frequency over time. All terms in the document
content are analysed to find those with interesting
spikes in frequency.
IN-SPIRE™ is a licensed commercial software. It mostly
operates on Windows workstations and Servers. A
typical IN-SPIRE computer would include a 1.5 Ghz
processor, 2Gb of memory, and 200 Gb disk drive in
which about 20-50 Gb should be available to store the
program and associated datasets. The latest version of
IN-SPIRE is version 5.9.
2.10 HistCite
HistCite is a software package used for bibliometric
analysis and information visualization. It was
developed by Eugene Garfield, the founder of the
Institute for Scientific Information (ISI). It is a software
developed to allow the users to aid researchers in
visualizing the results of literature searches in the Web
of Science. HistCite let the users analyze and organize
the results of a search to obtain various views of the
topic’s structure, history, and relationships. It is easy,
fast, and provides perspectives and information not
otherwise available.
HistCite helps the user to analyse:
• How much literature has been published in a
specific field? When and in what countries has, it
been published? What countries are the major
contributors to that field? What are the languages
most frequently used by the items published in that
field?
• What journals cover the literature of the field?
Which are the most important?
• Who are the key authors in that field? What
institutions do these authors represent?
• Which articles are the most important?
• How have the various contributors to the field
influenced each other?
In regards to information visualization, HistCite
performs one specific application that it converts
bibliographies into diagrams called historiographs.
HistCite operates on Windows computers with Internet
Explorer. The latest version of HistCite is version 12.3. A
free copy of HistCite software can be downloaded from:
http://interest.science.thomsonreuters.com/forms/Hist
Cite/ by agreeing to an End User License Agreement
provided by Thomson Reuters, now a part of Clarivate
Analytics.
2.11 Loet Leydesdorff’s Software
Leydesdorff’s software is a set of command-line DOS
based programs to analyse and evaluate bibliometrics
data obtained from the data sources such as Scopus,
Web of Science, and Google Scholar. The set of
software / programs were developed by Loet
Leydessorff at Science & Technology Dynamics,
University of Amsterdam, Amsterdam School of
Communications Research (ASCoR), The Netherlands.
The set of programs is freely available for academic and
research community. The different programs allow the
user to perform several bibliometric analyses, such as:
co-word analyses, co-authorship, author bibliographic
coupling, journal bibliographic coupling, author co-
citation, animation of network data, co-word mapping
of texts (lines), visualization of various networks and
organization of Google Scholar files into files for
relational database management (MS Access, dBase),
etc. The institutional and international collaboration,
even the collaboration at the level of cities can be
analysed with the help of this program. The results can
be visualized using external software, such as Pajek,
UCINET, Network Workbench Tool or the Sci2 Tool.
Also, the visualization of these collaboration networks
can be done using Google Maps and external software.
2.12Publish or Perish (PoP)
Publish or Perish (PoP) is a software program that
retrieves and analyses academic citations. It was
Vol. 23, No. 4 (October to December 2016)25

developed by Anne-WilHarzing, Professor of
International Management, Middlesex University,
London in the year 2006. Publish or Perish is designed
to empower individual academics to present their case
for research impact to its best advantage based on
citations. It uses Google Scholar and Microsoft
Academic Search to obtain the raw citations, then
analyses these and presents the following metrics:
v Total number of papers and total number of
citations,
v Average citations per paper, citations per author,
papers per author, and citations per year,
v Hirsch’s h-index, Zhang’s e-index and related
parameters,
v Egghe’s g-index,
v The contemporary h-index,
v Three variations of individual h-indices,
v The average annual increase in the individual h-
index,
v The age-weighted citation rate(AWCR) and AW-
index,
v An analysis of the number of authors per paper and
Multi-authored h-index.
The results from the analysis are available / displayed
on-screen and can also be copied to the Windows
clipboard (for pasting into other applications) or saved
to a variety of output formats (for future reference or
further analysis). Publish or Perish includes a detailed
help file with search tips and additional information
about the citation metrics.
Publish or Perish works on system based on Windows,
OS X and GNU/Linux operating systems. Its latest th
version is 5.26.2 released on 8 February 2017.
2.13SciMAT
SciMAT (Science Mapping Analysis Software Tool) is an
open source science mapping software tool which
incorporates methods, algorithms, and measures for all
the steps in science mapping workflow, from
preprocessing to the visualization of the results. It was
developed by M.J. Cobo, A.G. López-Herrera, E.
Herrera-Viedma, and F. Herrera, Soft of Computing and
Intelligent Information Systems (Sci2s) Research Group,
University of Granada, Spain. SciMAT has been
supported by the Project of Spanish Ministry of
Education and Science. SciMAT allows the user to carry
out studies based on several kinds of bibliometric
networks. Different normalization and similarity
measures can be used over the data. Several clustering
algorithms can be chosen to cut up the data.It is based
on a longitudinal science mapping approach.
SciMAThas different modules that help the analyst to
carry out the steps of the science mapping workflow,
such as: a) knowledge base and document Management
module; b) science mapping and analysis module; and
c) visualization module.
The main characteristics of SciMAT are:
v It helps for acquisition and handling of
data in ISI Web of Knowledge format and RIS
format.
v Bibliometric networks: SciMAT has incorporated
methods to build several kinds of bibliometric
networks based on co-word analysis, co-author,
co-citation, bibliographic coupling, and authors’
clusters, etc.
v Preprocessing: SciMAT implements a wide range
of preprocessing tools such as detecting duplicate
and misspelled items, time slicing, data reduction
and network reduction.
v Normalization: SciMAT has different normality
measures to perform normalization, i.e.
Association Strength, Equivalence Index, Inclusion
Index, Jaccard’s Index and Salton’s Cosine.
Loaders:
Vol. 23, No. 4 (October to December 2016)26

v
mapping, SciMAT has incorporated Simple
Centers Algorithm, Single-linkage, Complete-
linkage, Average-linkage and Sum-linkage
clustering algorithms.
v Analysis: SciMAT allows the analyst to perform:
network analysis (Callon’s density and centrality),
performance and quality analysis (sum, minimum,
maximum and average citations, and bibliometric
measures based on citations, such as: h-index, g-
index, hg-index or q2-index), and temporal
analysis. Also, it helps to track the conceptual,
intellectual or social evolution of a research field
through the course of time periods.
v Visualization: To visualize the result, strategic
diagram, cluster network, overlapping map,
evolution map can be created in SciMAT.
v Report: In SciMAT, outputs / reports are generated
in HTML and LaTeX format.
SciMAT has been developed using Java as programing
language.As such, it run in the majority of the operating
systems i.e. (Windows, Linux, MacOS, etc. To run
SciMAT, version 8 of Java has to be installed in the
system. It is free software available under GPLv3 license
which can be downloaded, redistributed or modified
under the terms of the GNU General Public License. thThe latest version of SciMATis v1.1.04 released on 12
July, 2016.
2.14Network Workbench (NWB) Tool
The Network Workbench (NWB) project at Indiana
University, USA developed a large-scale network
analysis, modelling and visualization cyber
infrastructure toolkit for biomedical, social science and
physics research. The NWB can perform network
analysis, modelling, and visualization with the most
effective algorithms and a wide variety of reference
datasets. The NWB tool supports network science
research across scientific boundaries.
Mapping (through clustering): For science The NWB tool is an algorithm integration framework
that supports easy addition and dissemination of
existing and newly created algorithms. The tool uses the
Cyber infrastructure Shell (CIShell) written in Java, an
OSGI-based software architecture, to facilitate easy plug
and play of diverse algorithms. The NWB tool has a
menu driven interface that supports network/graph
load, view and save operations, etc. The NWB tool
includes GUESS, a powerful and flexible network
visualization tool. The tool can load, process, and save
various network file formats including NWB (*.nwb),
GraphML (*.xml or. graphml), XGMML (*xml), Pajek
(*.net), Pajek (*.mat), TreeML (*.xml), Scopus
(*.scopus), NSF (*.nsf), Endnote (*.enw), Bibtex (*.bib),
CSV (*.csv), ISI (*.isi) and two-column edge lists
(*.edge). It also supports viewing and saving plain text
files (*.txt) generated by algorithms.
The Network Workbench tool provides significant
functionality for scientometricians, including the ability
to analyze, clean, and create networks derived from
scholarly data sources, such as ISI, Scopus, the NSF
grant database, BibTeX and Endnote reference formats.
Some of important scientometrics analysis features of
NWB tool are:
v Removes ISI duplicate records and rows with
multitudinous fields;
v Detects duplicate nodes;
v Update network by merging nodes; and
v Extract directed network, paper citation network,
author paper network, co-occurrence network of
word and reference, co-author network, document
co-citation network and co-citation similarity
network.
The NWB tool is freely available to download at
http://nwb.cns.iu.edu/download.html. The latest
official release version of NWB tool is 1.0.0 released on th15 September, 2009. The NWB tool works on
Windows, Linux and Mac systems.
Vol. 23, No. 4 (October to December 2016)27

2.15Sci2 Tool
The Science of Science (Sci2) is a modular toolset
specifically designed for the study of science. It supports
the temporal, geospatial, topical, and network analysis
and visualization of scholarly datasets at the micro
(individual), meso (local), and macro (global) levels.
The Sci2 tool was developed by Cyber Infrastructure for
Network Science Center Team, Indiana University,
USA.
Sci2 is OSGi/ Cyber Infrastructure Shell (CIShell)
powered, which means it can easily be extended to
support and integaret new algorithms, input formats,
and more through the OSGi/CIShell plugin architecture.
Sci2 tool hosts many tools to aid in every step of the data
preparation, analysis, and visualization process. A
number of data formats are supported on Sci2 platform,
such as: NWB (*.nwb), GraphML (*.xml or. graphml),
XGMML (*xml), Pajek (*.net), Pajek (*.mat), TreeML
(*.xml), Scopus (*.scopus), NSF (*.nsf), Endnote
(*.enw), Bibtex (*.bib), CSV (*.csv), ISI (*.isi), and edge
lists (*.edge).
Some of the main functionalities of Sci2 tool are:
v Loading Data: Load a supported file format for
preparation, analysis or visualization.
v Data Preparation: Extract networks from raw data
or update currently existing networks by merging
nodes and removing duplicates.
v Processing: Clean data for analysis and
visualization.
v Analysis: Employ a variety of advanced analysis
algorithms for temporal, topical, geospatial, and
network data.
v Modelling: Graph generation with aging, scaling,
random, and other specifications.
v Visualization: Visualize temporal, topical,
geospatial, and network data.
Similar to the NWB tool, Sci2 tool can read data files
from different databases such as Web of Science and
Scopus and different export formats such as Bibtex and
EndNote. It can also import plain text exports direct
from Web of Knowledge. The data preparation function
cleans the bibliographic data and creates different
networks and tables that can be used in preprocessing,
analysis, and visualization. Principally, the networks
that can be extracted are as follows: co-author, co-PI
(Principal Investigator), co-word, document co-citation,
journal co-citation, author co-citation, author
bibliographic coupling, document bibliographic
coupling, and journal bibliographic coupling.
Moreover, the tool can build different direct linkage
networks such as author-citation, document citation,
source-citation paper, and, finally, author-document
(consumed/produced) network.
The Sci2 tool is available freely and can be downloaded
u p o n r e g i s t r a t i o n a t :
https://sci2.cns.iu.edu/user/welcome.php.
2.16 SitKis
Sitkis is a free Java and MS Access based software tool
developed exclusively for bibliometric analysis. It helps
researchers during computation process of research
analysis and evaluation of scientific information. It
provides tools for extremely streamlined analysis of
bibliometric networks. User can calculate large amount
of data in few minutes utilizing Sitkis.
Sitkis incorporates the following functionality:
v Import ISI Web of Science data on articles and
other publications into Microsoft Access Database
for easy access and manipulation;
v Create analyses of citing and cited articles,
including time series trends in citation classics
within a specific discourse;
v Export UCINET-compatible networks of citing and
cited articles. Export functionality includes
Vol. 23, No. 4 (October to December 2016)28

automatic normalization, selection of year ranges,
threshold levels for minimum number of citations,
etc;
v Group articles into independent dense groups, and
analyze different theoretical streams within a
selected scientific discourse; and
v Generate statistics based on the country or
university of the original or citing authors.
Advanced users can also accomplish the following tasks
much more efficiently by utilizing Sitkis:
v Manage knowledge of a topic area by categorizing
and prioritizing articles,
v Create bibliometric analyses by coding articles
according to criteria of their choice,
v Cluster and partition co-citation networks to reveal
the structure of citation and co-citation patterns;
and
v Use abstracts of articles in a text analysis software.
Sitkis requires Microsoft Access 2000 (or newer, part of
Microsoft Office) and Java 1.3 (or newer) run time
environment (freely available from Sun Microsystems)
to function. Sitkis runs on all PC computers, but a
relatively powerful computer is recommended for
analysis dealing with large number (over 5000) of
articles.User can download the new version of SitKis
f r o m : h t t p s : / / w w w . d r o p b o x . c o m / s /
ukl1624t02r31sg/sitkis2012.zip.
2.17 VantagePoint
VantagePoint is a powerful text-mining tool for
discovering knowledge in search results from patent
and literature databases. VantagePoint helps the user to
rapidly understand and navigate through large search
results, giving them a better perspective on their
information. Vantage point is a commercial software
tool developed by Search Technology, Inc., USA.
VantagePoint works with search results from text
databases. It is most helpful when we need to work with
thousands of records instead of a few dozens.
VantagePoint is a menu-driven platform. Major features
and functionalities of Vantage Point are as follows:
v After the user
imports the data into VantagePoint, fields are
mined from the text using pattern matching, rule-
based, and natural language processing techniques
to obtain: a) Fields found in most bibliographic
databases (for example, authors, inventors,
affiliations, assignees, dates, descriptors, index
terms, and classification codes); b) Normalized
values that are sometimes buried in the basic
fielded data or presented in mixed formats, such as
dates, classification codes, or patent numbers; c)
Meaningful words and phrases from the titles,
abstracts, patent claims, and other free text; and d)
Entities defined in user-managed dictionaries.
VantagePoint comes with access to their in-built
library of import filters, thesauri and macros. It also
comes with tools to build user’s own import filters,
thesauri, and macros for proprietary data sources
and business processes. User can also import Excel
or Access data using VantagePoint’s “Import
Database Table” wizard.
v Top 10 Lists: User can browse their data from many
perspectives. The simplest tool is a list. Using a list
of affiliations (or authors or countries), user can see
the top affiliations (or authors or countries) and
browse the records for each one. User can sort and
search his/her lists in an instant, and create groups
in their lists in many different ways. “List
Comparison” lets the user compare any two lists
from any set of VantagePoint data and identify the
common or unique items in the lists. With time-
sliced data sets, this can help the user to identify
new or emerging concepts, authors, institutions or
countries. “Using Group” using Thesaurus, user
Extracting and Indexing Data:
Vol. 23, No. 4 (October to December 2016)29

can apply a thesaurus to own list and create groups
of list items. “Find and Group” searches the list for
user’s target text and adds matching items to a
group. “Find” provides for three search strings and
several Boolean operators (for example, “and,”
“adjacent,” “near4,” “or”, etc.).
v : Using a Co-occurrence
matrix, user can spread a list across any other list.
For example, using a co-occurrence matrix of
“author” and “year of publication,” user can see an
author’s publication trend over time and browse
their publications by year. This way, user can see
which authors have been working in an area for the
longest time as well as whether they are still active.
Further, data from lists and co-occurrence matrices
can be easily exported to other applications for
visualization or customized analysis.
v Maps/Networks: Beyond one-dimensional (lists)
and two-dimensional (co-occurrence matrices)
a n a l y s e s , V a n t a g e P o i n t p e r f o r m s
multidimensional statistical analysis to identify
clusters and relationships among concepts,
people, organizations and countries.
v Data Cleaning: VantagePoint uses fuzzy matching
techniques to identify, associate, and clean up
data. For example, it handles misspellings,
alternative hyphenation and capitalization, and
differing conventions for listing the names of
people and companies, providing the user with
higher-quality data that is essential for good
analysis.
v User Managed Thesauri: With VantagePoint user
can create, edit, and apply thesauri, which can be
used for specialized data reduction or conversion.
Using a thesaurus, user can easily combine all
variants of a data element (for example, United
States, US, U.S., USA, etc.). For other types of
analysis, user can combine data elements into
Co-occurrence Matrices
broad categories (for example, “aluminum alloys,”
“magnesium alloys,” “carbon fiber reinforced
plastics,” and “copper alloys” into “Materials”; or
“USA,” “Canada,” and “Mexico” into “North
America”).
v User can automate sequences of actions
using VantagePoint’s extensions to Microsoft’s
VBScript. User can create and distribute scripts and
make his/her own customized analysis techniques
and processes easily repeatable.
VantagePoint only works on Windows 7, 8, and 10
platforms. VantagePoint’s installation on Windows
Server is not supported and also on other operating
systems, e.g., Macintosh OS X or Linux.
VantagePoint is commercial, licensed on a per-seat
basis. The standard commercial single seat
VantagePoint license is perpetual and requires no
annual fees after the initial purchase. However,
user can get a 30-day trial free copy of
VantagePoint.
2.18 Bibliometrix R Package
Bibliometrix provides a set of tools for quantitative
research in scientometrics and bibliometrics.
Bibliometrix works with data extracted from the two
main bibliographic databases: Scopus and Clarivate
Analytics’s ISI Web of Knowledge. Bibliometrics turns
the main tool of science, quantitative analysis, on itself.
Essentially, bibliometrics is the application of
quantitative analysis and statistics to publications such
as journal articles and their accompanying citation
counts. Bibliometrix package provides various routines
for importing bibliographic data from these two
databases, performing bibliometric analysis.
Bibliometrix supports scholars in three key phases of
analysis:
v Data importing and conversion to R format;
v Bibliometric analysis of a publication dataset; and
Scripting:
Vol. 23, No. 4 (October to December 2016)30
v
collaboration, and co-word analysis. Matrices are
the input data for performing network analysis,
multiple correspondence analysis, and any other
data reduction technique.
The stable version of Bibliometrix can be downloaded
directly from RCRAN Package Repository available
a t h t t p s : / / c r an . r - p r o j e c t . o r g / w e b / p ack ag e s /
bibliometrix/index.html. The latest version of
Bibliometrix package is 1.4 which was released on 24-
01-2017. The package is licensed and distributed under
GPL-3 license.
2.19 metaknowledge
metaknowledge, a Python3 package is basically used
for doing computational research in bibliometrics,
scientometrics, and network analysis. It is also being
used to simplify the process of doing systematic reviews
in any disciplinary context. metaknowledge is
developed by NetLab research group headed by Dr.
John McLevey's at the University of Waterloo, Canada.
metaknowledge is a Python3 library that simplifies
bibliometric research using data from various sources. It
reads a directory of plain text files containing meta-data
on publications and citations, and writes to a variety of
data structures that are suitable longitudinal research,
computational text analysis (e.g. topic models and burst
analysis), Reference Publication Year Spectroscopy
(RPYS), and network analysis (including co-citation, co-
authorship, multi-modal, multi-level, and dynamic).
metaknowledge can easily handles large datasets (e.g.
several million records) efficiently.
metaknowledge currently handles data from the Web of
Science, Scopus, PubMed, Proquest Dissertations &
Theses, administrative data from the National Science
Foundation, and the Canadian tri-council granting
agencies: SSHRC, CIHR, and NSERC.
Building matrices for co-citation, coupling, There are di f ferent modules avai lable in
metaknowledge, such as:
v contour: A nicer matplotlib graph visualizer and
contour plot;
v WOS: The backend functions and classes
associated with the Web of Science;
v medline: The backend functions & classes
associated with Medline, the format used by
Pubmed;
v proquest: The backend functions and classes
associated with ProQuest;
v scopus: The backend functions and classes
associated with records from scopus; and
v journalAbbreviations: Handles the abbreviated
journal names used by WOS.
The metaknowledge comes with a command-line
application named [metaknowledge]. This provides a
simple interface to the python package which allows the
generation of most of networks along with ways to
manage the records themselves. Datasets created with
metaknowledge can be analyzed using NetworkX and
the standard libraries for data analysis in Python. It is
also easy to write data to csv or graphml files for analysis
and visualization in R, Stata, Visone, Gephi, or any
other tools for data analysis. metaknowledge also has a
simple command line tool for extracting quantitative
datasets and network files from Web of Science files.
This makes the library more accessible to researchers
who do not know Python, and makes it easier to quickly
explore new datasets.
metaknowledge is a free and open source software,
distributed under the GPL license. Its latest version is
metaknowledge 3.1.2 which can be downloaded from
https://pypi.python.org/pypi/metaknowledge#downlo
ads.
Vol. 23, No. 4 (October to December 2016)31

3. Conclusion
In this article, a brief profile of different science mapping
and visualization software tools used in bibliometric
and scientometric studies is provided. A total number of
nineteen software tools have been covered in the article
which are widely used by the academic and scientific
research community worldwide. It is very difficult to
choose the best among all as each of these software
tools have their own set of features, characteristics and
functions to perform specific task. Most of these tools
are freely available to the users over the Internet to
download and use. The students, the research scholars
and the professionals who have interest to work in
bibliometric and scientometric related studies would
find these tools useful in their studies.
References
Aria, M. &Cuccurullo, C. (2017) A brief introduction to
b i b l i o m e t r i x . A v a i l a b l e a t
http://www.bibliometrix.com/documentation/bibliom
etrix-vignette.html (Accessed on 12/02/2017).
BIBLIOMETRIX R Package: Bibliometric and Co-
C i t a t i o n A n a l y s i s T o o l . A v a i l a b l e a t
ht tp: / /www.bibl iometr ix .org/ (Accessed on
12/02/2017).
Chen, C. CiteSpace: Visualizing Patterns and Trends in
S c i e n t i f i c L i t e r a t u r e . A v a i l a b l e a t
http://cluster.cis.drexel.edu/~cchen/citespace/
(Accessed on 12/02/2017).
C i t ed Re fe rences Exp lo re r . Ava i l ab le a t
http://www.crexplorer.net/ (Accessed on 12/02/2017).
CiteSpace101. CiteSpace: Visualizing Trends and
Patterns in Scientific Literature. Available at
https://sites.google.com/site/citespace101/home
(Accessed on 12/02/2017).
CitNetExplorer: Analyzing citations patterns in
s c i e n t i f i c l i t e r a t u r e . A v a i l a b l e a t
ht tp: / /www.citnetexplorer.nl / (Accessed on
12/02/2017).
Cobo, M., López-Herrera, A., Herrera-Viedma, E., &
Herrera, F. (2011). Science Mapping Software Tools:
Review, Analysis, and Cooperative Study among Tools.
Journal of the American Society for Information Science
and Technology, 62(7), 1382-1402. Available at
doi:10.1002/asi.21525 (Accessed on 12/02/2017).
C o p a l R e d . A v a i l a b l e a t
https://es.wikipedia.org/wiki/Copalred (Accessed on
12/02/2017).
EC3. CopalRed version 1.0 Espanol (beta). Available at
http://ec3.ugr.es/copalred/index.htm (Accessed on
12/02/2017).
Encyclopaedia of Information Science and Technology,
Third Edition. Science Mapping. Available at
h t tp : / /www. ig i -g loba l .com/chapte r / sc ience -
mapping/112859 (Accessed on 12/02/2017).
Fernandez, V. Sitkis: Literature Review. Available at
http://en.vicenc-fernandez.eu/sitkis-literature-review/
(Accessed on 12/02/2017).
G r a u w i n , S . B i b l i o T o o l s . A v a i l a b l e a t
http://www.sebastian-grauwin.com/?page_id=427
(Accessed on 12/02/2017).
Harzing, Anne-Wil. Publish or Perish. Available at
http://www.harzing.com/resources/publish-or-perish
(Accessed on 12/02/2017).
HistCite. Available at https://en.wikipedia.org/
wiki/Histcite (Accessed on 12/02/2017).
IDR: Measuring and Mapping Interdisciplinary
Research. Available at http://www.idr.gatech.edu/
overlay.php (Accessed on 12/02/2017).
Jamali, H. R. Scientometric Portal. Available at
https://sites.google.com/site/hjamali/scientometric-
portal (Accessed on 12/02/2017).
Vol. 23, No. 4 (October to December 2016)32

Kumar, A., Shivarama, J., & Choukimath, P. A. (2015).
Popular Scientometric Analysis, Mapping and
Visualisation Softwares: An Overview. In 10th
International CALIBER-2015, HP University and IIAS,
Shimla, Himachal Pradesh, India (pp. 157-170).
Gandhinagar, Gujarat: INFLIBNET Centre. Available at
http://ir.inflibnet.ac.in/handle/1944/1855 (Accessed on
12/02/2017).
Leydesdorff, L. Loet Leydesdorff’s Software. Available at
http://www.leydesdorff.net/software.htm (Accessed on
12/02/2017).
NWB Team. (2006). Network Workbench Tool. Indiana
University, Northeastern University, and University of
Michigan. Available at http://nwb.slis.indiana.edu
(Accessed on 12/02/2017).
Pacific Northwest National Laboratory. IN-SPIRE™
Visual Document Analysis. Available at http://in-
spire.pnnl.gov/ (Accessed on 12/02/2017).
Persson, O., R. Danell, & J. Wiborg Schneider. (2009).
How to use Bibexcel for various types of bibliometric
analysis. In celebrating scholarly communication
studies: A Festschrift for OllePersson at his 60th
Birthday, ed. F. Astrom, R. Danell, B. Larsen, J.
Schneider, p 9-24. Leuven, Belgium: International
Society for Scientometrics and Informetrics. Available at
http://homepage.univie.ac.at/juan.gorraiz/bibexcel/
(Accessed on 12/02/2017).
Reid McIlroy-Young, John McLevey, and Jillian
Anderson. 2015. metaknowledge: open source
software for social networks, bibliometrics, and
soc io logy o f knowledge r e sea r ch . URL :
http://www.networkslab.org/metaknowledge.
Sci2 Tool: A Tool for Science of Science Research &
Practice. Available at https://sci2.cns.iu.edu/
user/index.php (Accessed on 12/02/2017).
Science of Science Tool (Sci2). Available at
https://en.wikipedia.org/wiki/Science_of_Science_Too
l_(Sci2) (Accessed on 12/02/2017).
SciMAT: Science Mapping Analysis Tool. Available at
http://sci2s.ugr.es/scimat/ (Accessed on 12/02/2017).
Search Technology. VantagePoint: Serious Software for
S e r i o u s P r o f e s s i o n a l s . A v a i l a b l e a t
https://www.thevantagepoint.com (Accessed on
12/02/2017).
VOSviewer: Visualizing scientific landscapes.
Available at http://www.vosviewer.com/ (Accessed on
12/02/2017).
Visitors
Prof. Anamik Shah, Vice-Chancellor, Gujarat Vidyapith, Ahmedabad, Gujarat
Dr. Nabi Hasan, University Librarian, Aligarh Muslim University, Aligarh, Uttar Pradesh
Dr. Kumud Sharma, Department of Hindi, University of Delhi, New Delhi
Dr. (Mrs.) Pankaj Mittal, Additional Secretary, UGC, New Delhi
Prof. Ram Bux, Department of Hindi, Jawaharlal Nehru University, New Delhi
Prof. Krishna Amin-Patel, Centre Head, National Institute of Design (NID), Gandhinagar, Gujarat
Dr. Ram Gopal Singh, Professor & Research Director, Department of Hindi, Gujarat Vidyapith, Ahmedabad, Gujarat
Vol. 23, No. 4 (October to December 2016)33

Staff News
Dr. Jagdish Arora, Director
Dr. Jagdish Arora delivered keynote address on “Media
and Information Literacy at INFLIBNET Centre”, during
the inaugural session of the UNESCO-supported
Capacity Building Workshop on Media and Information th thLiteracy held at Punjabi University, Patiala on17 -19
October 2016. He delivered keynote address on
“Changing Roles of Libraries and Librarians in Libraries
of Future” during the E-Content 2016: A Seminar on
Library Services and Management – A Platform nd
Approach held on 22 November, 2016 at
Ahmedabad. He was an invited speaker on “Role of
Social Media in Promoting Library Services” during the
inaugural session of International Conference on
“Marching Beyond the Libraries (ICMBL – 2016): The
Role of Social Media and Networking held in KIIT th th
University, Bhubaneswar, 25 to 26 November, 2016.
Dr. Arora was invited to moderate the session on th
“Digital Literacy: Standards and Policy “during 5
International Conference on Digital Libraries (ICDL-
2016): “Smart Future: Knowledge Trends that will
Change the World” held at India Habitat Center, New th th
Delhi, on 13 -16 December, 2016. He chaired a
special session on National Digital Library (NDL) and
moderated a panel discussion on NDL during th5 International Conference on Digital Libraries (ICDL-
2016): “Smart Future: Knowledge Trends that will
Change the World” held at India Habitat Center, New thDelhi on 13 December, 2016.
Mr. Manoj Kumar K., Scientist D (CS)
Mr. Manoj Kumar was invited to deliver a lecture on “
Academic Integrity in Research: Use of Anti-plagiarism th
Tools” on 27 October 2016 at Mangalore University,
Mangalore. He also demonstrated technical process
involved in uploading theses into Shodhganga as well thas use of the anti-plagiarism tools on 28 October 2016.
He was also invited for inaugurating “E-Piravi in
Education: Research, Resources and Plagiarism” during
Kerala Piravi day by M E S College, Mampad, st
Malappuram, Kerala on 1 November 2016.
Mr. Abhishek Kumar, Scientist C (CS)
Mr. Abhishek Kumar attended meetings of thsubcommittee, e-PG Pathshala held on 4 October,
2016 at University of Grants Commission (UGC), New
Delhi. He was invited to attend the meeting on e-
content development in Mathematics at University of th
Calcutta, Kolkata on 14 October 2016. He was also
invited for demonstrating e-content for MOOC at UGC, th
New Delhi on 24 October, 2016. He attended a
meeting of Task Force Committee for e-Content, UGC, th
New Delhi on 25 October, 2016. He attended meeting
of National Institute of Ranking Framework (NIRF)-nd rdFormula Discussion held on 2 November and 3
December, 2016 at National Board of Accreditation,
New Delhi. He made a presentation of his paper
entitled India rankings 2016: Ranking Model for Indian thHigher Educational Institutions on 18 November,
2016 during International Conference on ICT in
Business, Industry and Government (ICTBIG) 2016. He
was invited to deliver a talk on MOOC at Jamia Millia thIslamia University, New Delhi on 19 November, 2016.
He also attended meeting of subcommittee, e-PG th
Pathshala held on 23 December, 2016 at UGC, New
Delhi.
Mr. Swapnil Patel, Scientist B (CS)
Mr. Swapnil Patel was invited to give suggestions on the st
Library module of the In-house ERP software on 21
November 2016 at INDUS University, Ahmedabad.
Vol. 23, No. 4 (October to December 2016)34

Ms. Kruti J. Trivedi, Scientist B (LS)
Ms. Kruti Trivedi attended first Meeting of
Implementation Core Committee (ICC) for NIRF held on th15 November, 2016 at National Board of
Accreditation, New Delhi.
Mr. Hiteshkumar Solanki, Scientist B (CS)
Mr. Hiteshkumar Solanki attended Meeting of National
Institute of Ranking Framework (NIRF)-DCS th nd
requirement held on 13 October, 2016, 2 November, rd2016 and 3 December, 2016 at National Board of
Accreditation, New Delhi.
Mr. Pallab Pradhan, Scientist B (LS)
Mr. Pallab Pradhan attended the International
Conference on “Marching Beyond the Libraries: The
Role of Social Media and Networking” held at KIIT
th thUniversity, Bhubaneswar during 25 to 26 November,
2016. He made a presentation of his research work
entitled “Analysis of Mendeley Readership Statistics of
Indian Information and Library Science Literature”.
Mr. Raja V, Scientist B (CS)
Mr. Raja V attended Meeting of National Institute of
Ranking Framework (NIRF)-DCS requirement held on th
13 October, 2016 at National Board of Accreditation,
New Delhi.
Mr. Dharmesh Shah, STA (CS)
Mr. Dharmesh Shah attended Meeting of National
Institute of Ranking Framework (NIRF) DCS th nd
requirement held on 13 October, 2016, 2 November, rd2016 and 3 December 2016 at National Board of
Accreditation, New Delhi.
Staff Achievement
Mr. Miteshkumar Pandya, Scientist B (LS)
The Centre congratulates to Mr. Miteshkumar Pandya, Scientist B (LS) for awarding Ph.D degree in
Library and Information Science for his thesis entitled “Thesaurus Development for Indian Social
Science Literature on Relational Database Management System and its Integration with OII” by
Sardar Patel University, Vallabh Vidyanagar.
Users’ Speak
Vol. 23, No. 4 (October to December 2016)35

CALIBER 2017
th11 International
2017
11
August 2-4, 2017
Venue
Anna University, Chennai Tamil Nadu
Convention Theme
Sub-Theme
Re-Envisioning Role of Libraries: Transforming Scholarly Communication
Open EducationResearch Data and Knowledge Management
Role of LICs in the Assessment of Scientific ResearchRe-Envisioning the Role of Libraries and Information Centres
INFLIBNET Centre Gandhinagar, Gujarat
Anna UniversityChennai, Tamil Nadu
Organised by :-
in collaboration with :-