from data to knowledge - new york state school boards ... · from data to knowledge ... let’s...
TRANSCRIPT

New York State School Boards Association2009 Annual Convention, NYCOctober 15-18, 2009
1
Knowledge-based Data Visualization
From Data to Knowledge
Improving K‐12 Assessment Results with K l d b d D t Vi li tiKnowledge‐based Data Visualization
NYSSBAOctober 16, 2009 Steven Arnoff, Ed.D.

New York State School Boards Association2009 Annual Convention, NYCOctober 15-18, 2009
2
Knowledge-based Data Visualization

New York State School Boards Association2009 Annual Convention, NYCOctober 15-18, 2009
3
Knowledge-based Data Visualization

New York State School Boards Association2009 Annual Convention, NYCOctober 15-18, 2009
4
Knowledge-based Data Visualization
• As we look for that one button solution, we begin to see and search for understanding on three topics:
1. Student Information Systems
2. Data‐Driven Decision Making2. Data Driven Decision Making
3. Data Visualization
1. Student Information Systems

New York State School Boards Association2009 Annual Convention, NYCOctober 15-18, 2009
5
Knowledge-based Data Visualization
Three Generations of SIS
• Mid‐1980s to mid‐1990s: demographic data –names, address, phone numbers, etc.
• Mid‐90s (until NCLB) electronically filing state reports –• Mid‐90s (until NCLB) electronically filing state reports –enrollment, financial reports, etc.
• NCLB and beyond – AARAcurriculum, instruction, and assessment data
Industry Research
Publication Date: 23 March 2009
ID Number: G00166334
Key Issues for K‐12 Education, 2009:
Making Decisions That Work Now butMaking Decisions That Work Now but Look Beyond the Present

New York State School Boards Association2009 Annual Convention, NYCOctober 15-18, 2009
6
Knowledge-based Data Visualization
1. Run
2. Grow
3. Transform
• “… an administrative suite [SIS] that satisfies current business needs (that is, run) might very well be malleable or extendable enough that in the future it might serve broader audiences (grow) or facilitate an entirely different — if not radical —
h l i ti (t f ) ”school organization (transform).” Emphasis added.
Two Essential Questions
1. What should you expect your student information system to do for your district?
2 How should your student information system2. How should your student information system benefit your school community?

New York State School Boards Association2009 Annual Convention, NYCOctober 15-18, 2009
7
Knowledge-based Data Visualization
What should you expect your student information system to do for your district?
Any student information system must: (RUN)
1. Registration and Enrollment
2. Schedule
3. Attendance
4. Grading
5. Reporting
How should your student information system benefit your school community?
Today’s student information system must do more. It must help us to GROW and TRANSFORM our schools
1.Curriculum
2.Assessment
3 Data Analysis3.Data Analysis
4.Planning Instruction
5.Improve Communication
6.Growth Path
StudentMature Use
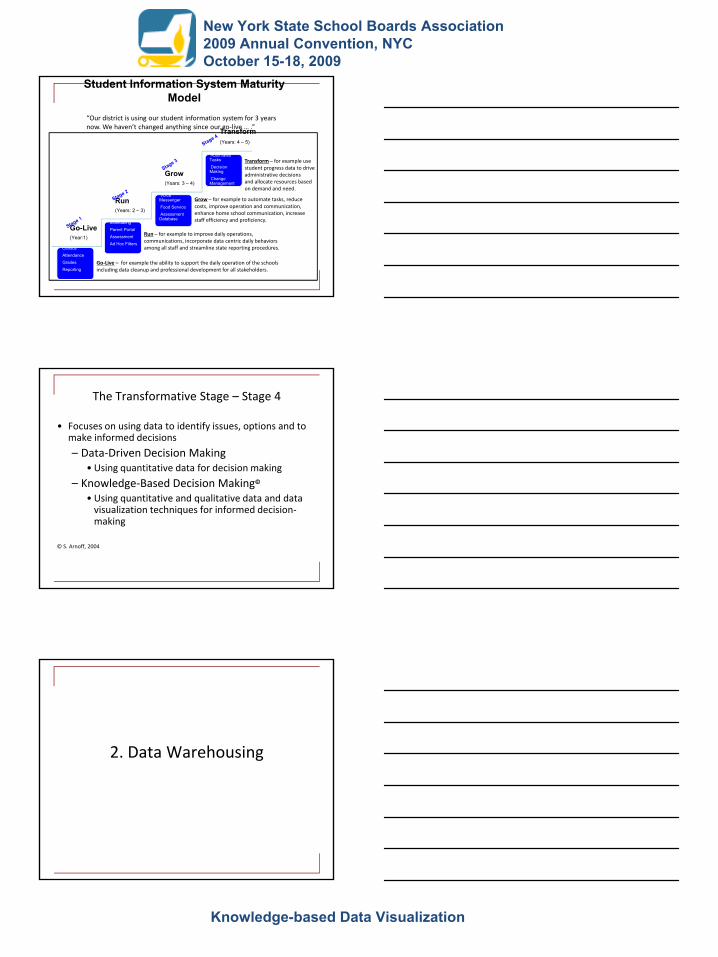
Student Information System Maturity Model
“Our district is using our student information system for 3 years now. We haven’t changed anything since our go‐live … .”
Student Information System Maturity Model
Use
Expand Capabilities
Harvest Value

New York State School Boards Association2009 Annual Convention, NYCOctober 15-18, 2009
8
Knowledge-based Data Visualization
Focus on basics:enrollment datastudent schedulesattendance
d i d
Student Information System Maturity Model
“Our district is using our student information system for 3 years now. We haven’t changed anything since our go‐live … .”
academic gradesreport cards transcriptsstate and federal reporting
The second year? The third year?
Student Information System Maturity Model
“Our district is using our student information system for 3 years now. We haven’t changed anything since our go‐live … .”
Will the SIS support the district in five years?
Student Information System Maturity Model
“Our district is using our student information system for 3 years now. We haven’t changed anything since our go‐live … .”
The Student Information System Maturity Model has 4 stages:
Year : 1 Stage 1 Go‐Live
Years: 2‐3 Stage 2 Run
Years: 3‐4 Stage 3 Grow
Years: 4‐5 Stage 4 Transform
New York State School Boards Association2009 Annual Convention, NYCOctober 15-18, 2009
9
Knowledge-based Data Visualization
Transform – for example use student progress data to drive administrative decisions and allocate resources based
Grow (Years: 3 – 4)
Transform(Years: 4 – 5)
Automated Tasks
Decision Making Change Management
Student Information System Maturity Model
“Our district is using our student information system for 3 years now. We haven’t changed anything since our go‐live … .”
on demand and need.
Go-Live(Year:1)
Run(Years: 2 – 3)
Go‐Live – for example the ability to support the daily operation of the schools including data cleanup and professional development for all stakeholders.
Run – for example to improve daily operations, communications, incorporate data centric daily behaviors among all staff and streamline state reporting procedures.
Grow – for example to automate tasks, reduce costs, improve operation and communication, enhance home school communication, increase staff efficiency and proficiency.Scheduling
Parent PortalAssessmentAd Hoc Filters
Voice Messenger
Food ServiceAssessment Database
CensusAttendanceGradesReporting
The Transformative Stage – Stage 4
• Focuses on using data to identify issues, options and to make informed decisions
– Data‐Driven Decision Making• Using quantitative data for decision making
– Knowledge‐Based Decision Making©
• Using quantitative and qualitative data and data visualization techniques for informed decision‐making
© S. Arnoff, 2004
2. Data Warehousing

New York State School Boards Association2009 Annual Convention, NYCOctober 15-18, 2009
10
Knowledge-based Data Visualization
Data, data everywhere …
But often not a lot of useable information …
Essential QuestionsWhat question or questions do we want data to help us answer?What data do we need to answer the question(s)?question(s)?Where do we put or “house” the data?How do we access, analyze and visualize the data?

New York State School Boards Association2009 Annual Convention, NYCOctober 15-18, 2009
11
Knowledge-based Data Visualization
Data‐Driven Decision Making requires that we are able to effectively and efficiently:gather,
store (warehouse), access, and analyze
quantitative (numeric) and qualitative (text) data about school district and school operations and especially about teaching and student learning outcomes.
The data that we can gather, warehouse, and analyze to improve education decision‐making can be defined by the following four categories:
1. Demographic Information2. Student Information3. Curriculum Information4. Instruction Information
Let’s take a closer look…
Knowledge‐Based Decision Making©
DemographicInformationSchool
ClassStudent nameGradeEthnicityGenderLearning provision(s)Language proficiency
Curriculum Information
StandardsBenchmarksCurriculum mappingStandardized testsState assessmentsDistrict assessments
Char
acte
rist
ics
Inte
nded
Student Information
HomeworkQuizzesTestsGradesPerceptionsStandards‐based reports
InstructionInformation
UnitsLessonsMaterialsStrategiesDifferentiated InstructionAuthentic assessmentRubricsProfessional Development
Core Purpose
Atta
ined
Impl
emen
ted
© S. Arnoff, 2004

New York State School Boards Association2009 Annual Convention, NYCOctober 15-18, 2009
12
Knowledge-based Data Visualization
Knowledge‐Based Decision Making©
DemographicInformationSchool
ClassStudent nameGradeEthnicityGenderLearning provision(s)Language proficiency
Curriculum Information
StandardsBenchmarksCurriculum mappingStandardized testsState assessmentsDistrict assessments
Char
acte
rist
ics
Inte
nded
Disaggregate and analyze summative data by student demographic factors.
Disaggregate and analyze summative data by school, class, student, content area, strand and item.
Disaggregate and analyze student achievement by demographic factors.
Disaggregate and analyze student achievement by school, class, and content area.
Student Information
HomeworkQuizzesTestsGradesPerceptionsStandards‐based reports
InstructionInformation
UnitsLessonsMaterialsStrategiesDifferentiated InstructionAuthentic assessmentRubricsProfessional Development
Core Purpose
Atta
ined
Impl
emen
ted
© S. Arnoff, 2004
Formative assessment to inform lesson design and presentation based on student and class readiness for learning.
Adjust class instruction based on student learning feedback.
Adjust instruction for small groups based on learning acquisition feedback and demographic information.
Adjust individual student instruction based on learning acquisition feedback.
Demographic Information
Curriculum Information
Instruction Information
Student Information
Two -way interactions X X
Two -way interactions X X
Two -way interactions X X
Two -way interactions X X
Two and Three Way Interactions
Two -way interactions X X
Three -way interactions X X X
Three -way interactions X X X
Three -way interactions X X X
Three -way interactions X X X
Four -way interactions X X X X
Demographic and Curriculum Components
DemographicInformation
SchoolClassStudent nameGradeEthnicityGenderLearningct
eristics
Curriculum Information
StandardsBenchmarksCurriculum mappingStandardized testsStatent
ende
d
Learning provision(s)Language ProficiencyCh
arac State
assessmentsDistrict assessments
In

New York State School Boards Association2009 Annual Convention, NYCOctober 15-18, 2009
13
Knowledge-based Data Visualization
Demographic and Curriculum Questions
•Benchmarks
•Standards
•Similarities•Similarities
•Differences
Curriculum Information
StandardsBenchmarksCurriculum mappingStandardized testsState assessmentsDistrict assessmentsIn
tend
ed
UnitsLessons
Curriculum and Instruction Information
InstructionInformation
LessonsMaterialsStrategiesDifferentiated InstructionAuthentic assessmentRubricsProfessionalDevelopmentIm
plem
ente
d
Curriculum and Instruction Questions
•Curriculum Alignment
•Curriculum Mapping
•Instructional Methodologygy
•Professional Development

New York State School Boards Association2009 Annual Convention, NYCOctober 15-18, 2009
14
Knowledge-based Data Visualization
Curriculum InformationStandardsBenchmarksCurriculum mappingStandardized testsState assessmentsDistrict assessmentsIn
tend
ed
Curriculum and Student Information
Student Information
HomeworkQuizzesTestsGradesPerceptionsStandards-based reportsA
ttaine
d
Curriculum and Student Questions
•Benchmarks and/or Standards Achievement
•Level of Proficiency
•Vertical and Horizontal Curriculum Articulation
Student Information
HomeworkQuizzesTestsGradesPerceptionsStandards-based reportsA
ttaine
d
InstructionInformation
UnitsLessonsMaterialsStrategiesDifferentiated Instructionem
ente
d
Student and Instruction Information
Standards based reports InstructionAuthentic assessmentRubricsProfessionalDevelopment
Impl
New York State School Boards Association2009 Annual Convention, NYCOctober 15-18, 2009
15
Knowledge-based Data Visualization
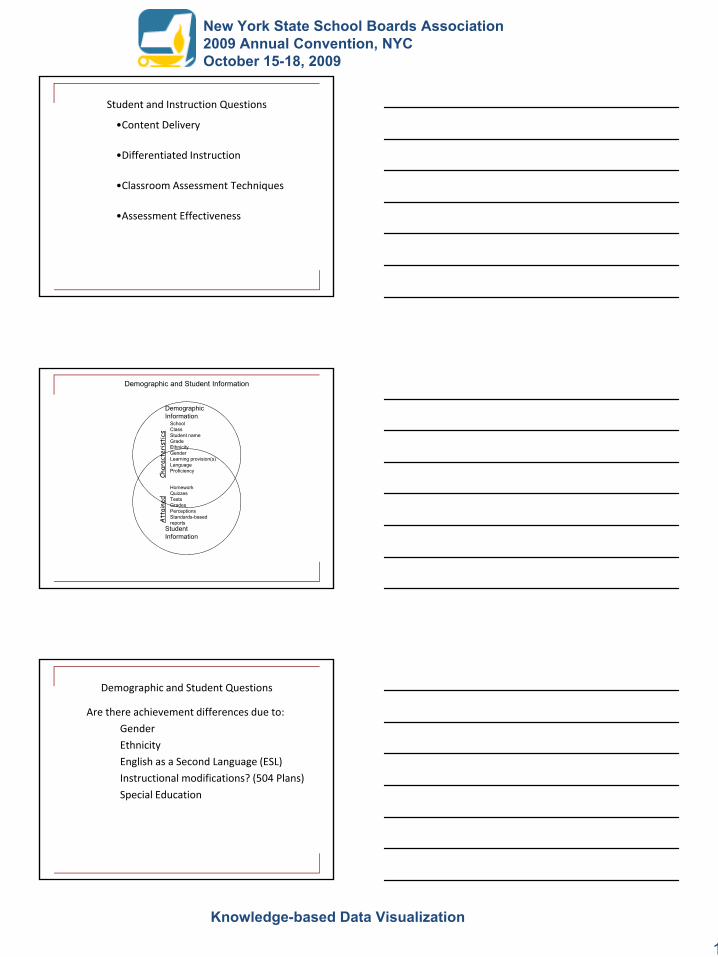
Student and Instruction Questions
•Content Delivery
•Differentiated Instruction
•Classroom Assessment Techniques•Classroom Assessment Techniques
•Assessment Effectiveness
DemographicInformation
SchoolClassStudent nameGradeEthnicityGenderLearning provision(s)Language Proficiency
Charac
teristics
Demographic and Student Information
Student Information
HomeworkQuizzesTestsGradesPerceptionsStandards-based reportsA
ttaine
d
Demographic and Student Questions
Are there achievement differences due to:
Gender
Ethnicity
English as a Second Language (ESL)
Instructional modifications? (504 Plans)
Special Education

New York State School Boards Association2009 Annual Convention, NYCOctober 15-18, 2009
16
Knowledge-based Data Visualization
Curriculum Information
DemographicInformation
SchoolClassStudent nameGradeEthnicityGenderLearning provision(s)Language Proficiency
Charac
teristics
StandardsBenchmarksCurriculum mappingStandardized testsState assessmentsDistrict assessments
Inte
nded
Units
Demographic, Curriculum, and Instruction Information
InstructionInformation
LessonsMaterialsStrategiesDifferentiated InstructionAuthentic assessmentRubricsProfessionalDevelopmentIm
plem
ente
d
Demographic, Curriculum, and Questions
•Curriculum Alignment
•Achievement Characteristics
•Student Characteristics
•Instruction Interventions
Curriculum Information
Homework
StandardsBenchmarksCurriculum mappingStandardized testsState assessmentsDistrict assessmentsIn
tend
ed
Units
Curriculum, Instruction, and Student Information
Student Information
QuizzesTestsGradesPerceptionsStandards-based reportsA
ttaine
d
InstructionInformation
LessonsMaterialsStrategiesDifferentiated InstructionAuthentic assessmentRubricsProfessionalDevelopmentIm
plem
ente
d

New York State School Boards Association2009 Annual Convention, NYCOctober 15-18, 2009
17
Knowledge-based Data Visualization
Curriculum, Instruction, and Student Questions
•Student Achievement
•Curriculum Modifications
•Instructional Interventions
•Professional Development
•Assessment Techniques
DemographicInformation
SchoolClassStudent nameGradeEthnicityGenderLearning provision(s)Language Proficiency
Charac
teristics
Demographic, Instruction, and Student Information
Student Information
HomeworkQuizzesTestsGradesPerceptionsStandards-based reportsA
ttaine
d
InstructionInformation
UnitsLessonsMaterialsStrategiesDifferentiated InstructionAuthentic assessmentRubricsProfessionalDevelopmentIm
plem
ente
d
Demographic, Instruction, and Student Questions
•Student Achievement
•Instructional Methodology
•Assessment Effectiveness
•Professional Development

New York State School Boards Association2009 Annual Convention, NYCOctober 15-18, 2009
18
Knowledge-based Data Visualization
DemographicInformation
Curriculum Information
SchoolClassStudent nameGradeEthnicityGenderLearning provision(s)Language Proficiency
Charac
teristics
StandardsBenchmarksCurriculum mappingStandardized testsState assessmentsDistrict assessmentsIn
tend
ed
Demographic, Curriculum, and Student Information
Student Information
HomeworkQuizzesTestsGradesPerceptionsStandards-based reportsA
ttaine
d
Demographic, Curriculum, and Student Questions
•Benchmarks and/or Standards
•Assessment Measures
DemographicInformation
Curriculum Information
SchoolClassStudent nameGradeEthnicityGenderLearning provision(s)Language ProficiencyCh
arac
teristics
StandardsBenchmarksCurriculum mappingStandardized testsState assessmentsDistrict assessmentsIn
tend
ed
Four-way Interaction Analysis
Student Information
HomeworkQuizzesTestsGradesPerceptionsStandards-based reportsA
ttaine
d
InstructionInformation
UnitsLessonsMaterialsStrategiesDifferentiated InstructionAuthentic assessmentRubricsProfessionalDevelopmentIm
plem
ente
d

New York State School Boards Association2009 Annual Convention, NYCOctober 15-18, 2009
19
Knowledge-based Data Visualization
What curriculum, instruction, assessment and student demographic data is available?What data is available in electronic form?What equipment and programs might be needed to access
d l d l h d ?
Questions For Thought
and analyze and visualize the data?Do any staff members have experience analyzing student
data?
There are commercial software products called data warehouses. These commercial products provide a place to put a variety of information and a way to search and display results.
How do we “house” data?
A true data warehouse, however, is more than one software application.
A data warehouse is a central repository that brings together what might otherwise seem to be disparate information about the education process.
How do we “house” data?
This information is often “locked up” in the personal computers (often called information silos) of individual employees.

New York State School Boards Association2009 Annual Convention, NYCOctober 15-18, 2009
20
Knowledge-based Data Visualization
Bringing together data residing in computer systems and applications throughout the organization into a data warehouse provides a way to overcome the problem of seeing every tree, but
How do we “house” data?
never seeing the forest.
Data Warehouse Components
Data Warehouse
InputsCurriculum, Demographic, and Budget Information including curriculum maps, student characteristics and program costs
ProcessInstruction Information including methods, materials, resources and assessment models
OutcomesStudent Information including formative and summative assessment data
The Knowledge Pyramid
Wisdom
Knowledge
Understanding patterns
Understanding principles
System maturity
Information
Raw Data
Data AnalysisUnderstanding relationships
Zelenky, M. (1987) “Management Support Systems: Towards Integrating Knowledge Management”, Human Systems Management, Vol. 7. No.1. pp. 58‐70.Ackoff, R. L. (1989) “From Data to Wisdom”, journal of Applied Systems Analysis, Vol. 16. pp. 3‐9.

New York State School Boards Association2009 Annual Convention, NYCOctober 15-18, 2009
21
Knowledge-based Data Visualization
Once we have a data warehouse and populate it with the appropriate data …
Once we have formulated our questions and identified that we have the data to answer the
Questions For Thought
identified that we have the data to answer the questions …
How can we get actionable information from our data warehouse?
3. Data Visualization
Data Visualization
• The main goal of data visualization is to communicate information clearly and effectively through graphical means.
• To convey ideas effectively, both aesthetic form and functionality need to go hand in hand, providing insights into a rather sparse and complex data set by communicating its key‐aspects in a more intuitive way.

New York State School Boards Association2009 Annual Convention, NYCOctober 15-18, 2009
22
Knowledge-based Data Visualization
Data Visualization
• The field's origins are in the early days of computer graphics in the 1950s, when the first graphs and figures were generated by computers.
• A significant boost was given to the field with the appearance, in 1987, of the NSF report "Visualization in Scientific Computing." (edited by Bruce H. McCormick, Thomas A. DeFanti and Maxine D. Brown)
Data Visualization
• The phrase "Visualization in Scientific Computing" which turned into Scientific Visualization was used initially to refer to visualization as a part of a process of scientific computing: the use of computer modeling and simulation in scientific and engineering practice.
• More recently, visualization is increasingly also concerned with data from other sources, including the large and heterogeneous data collections found in business and finance, and yes, education.
What is Data Mining
Data mining is the term used to describe the application of computer technology to attain beneficial information from what is often at first glance a vast and a seemingly unrelated enormous quantity of data.
Data visualization is a form of data mining.

New York State School Boards Association2009 Annual Convention, NYCOctober 15-18, 2009
23
Knowledge-based Data Visualization
What is Data Mining
Data mining is a way to:answer questions that educators are interested in answering
andto identify and answer questions that educators did not know
enough to ask.
For Example
Are student demographic characteristics a factor in the type of pleasure reading that students enjoy?
Are students that transfer into the school after grade 2 reading at the same level as students that have been in the school since
Data mining can answer questions such as:
at the same level as students that have been in the school since kindergarten?
How will data be mined for information?What will we do with the results of our data mining?
Questions For Thought

New York State School Boards Association2009 Annual Convention, NYCOctober 15-18, 2009
24
Knowledge-based Data Visualization
What does data visualization look like. How is it different from the charts and graphs I am used to creating and using to understand and communicate information to others?
Questions For Thought

New York State School Boards Association2009 Annual Convention, NYCOctober 15-18, 2009
25
Knowledge-based Data Visualization
Conclusion
• The interactions of a student information system, data warehousing and data visualization create a synergy that can
– identify learning strengths and weaknesses
– provide insight and understanding
– translate into practices designed to improve achievement for all students.
In The Future
• There are people who believe that there may be an easier way to achieve these goals.
• Such approaches are still somewhat experimental. For example…
New York State School Boards Association2009 Annual Convention, NYCOctober 15-18, 2009
26
Knowledge-based Data Visualization
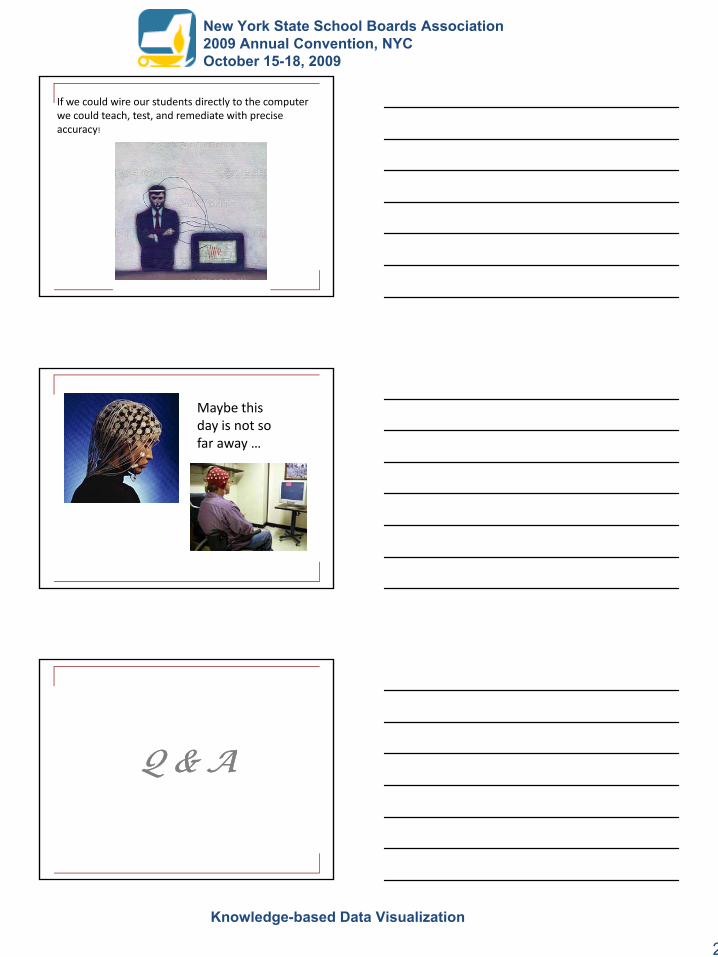
If we could wire our students directly to the computer we could teach, test, and remediate with precise accuracy!
Maybe this day is not so far away …
Q & AQ & AQ & AQ & A