from cost of control to cost of inaction: overview of the ... · from cost of control to cost of...
TRANSCRIPT

From cost of control to cost of inaction:
Overview of the CIRCLE project OECD Nuclear Energy Agency (OECD NEA) International Workshop
Paris, 20 January 2016
Olivier Durand-Lasserve
(OECD/ENV - IEA/STO)
Work coordinated by Rob Dellink, Jean Chateau and Elisa Lanzi
(OECD/ENV)

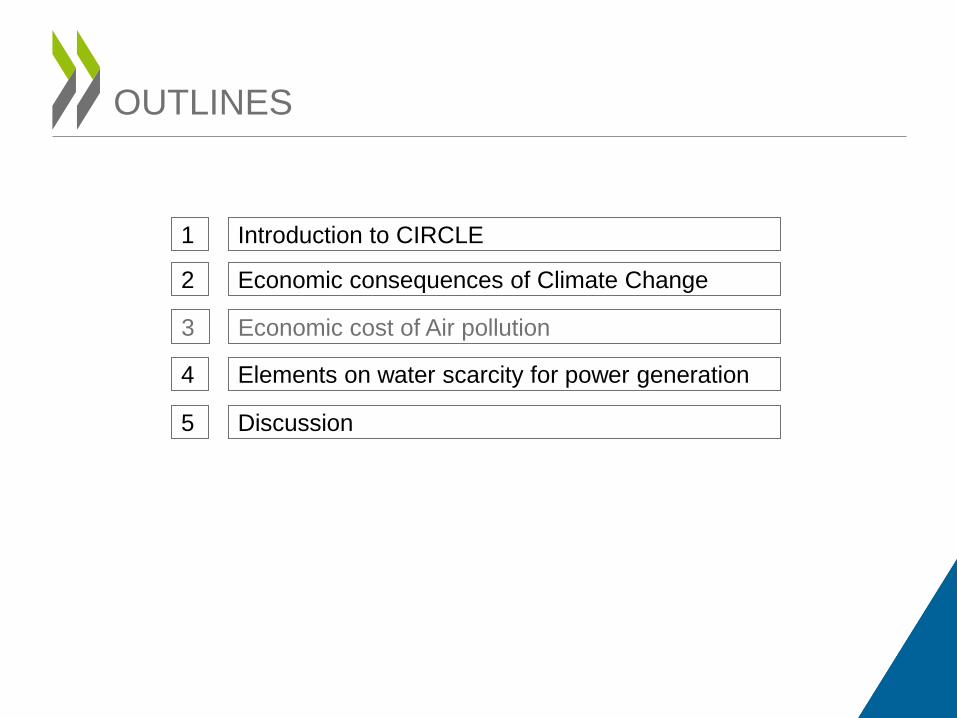
OUTLINES
Economic consequences of Climate Change 2
Introduction to CIRCLE 1
Elements on water scarcity for power generation 4
Discussion 5
Economic cost of air pollution 3
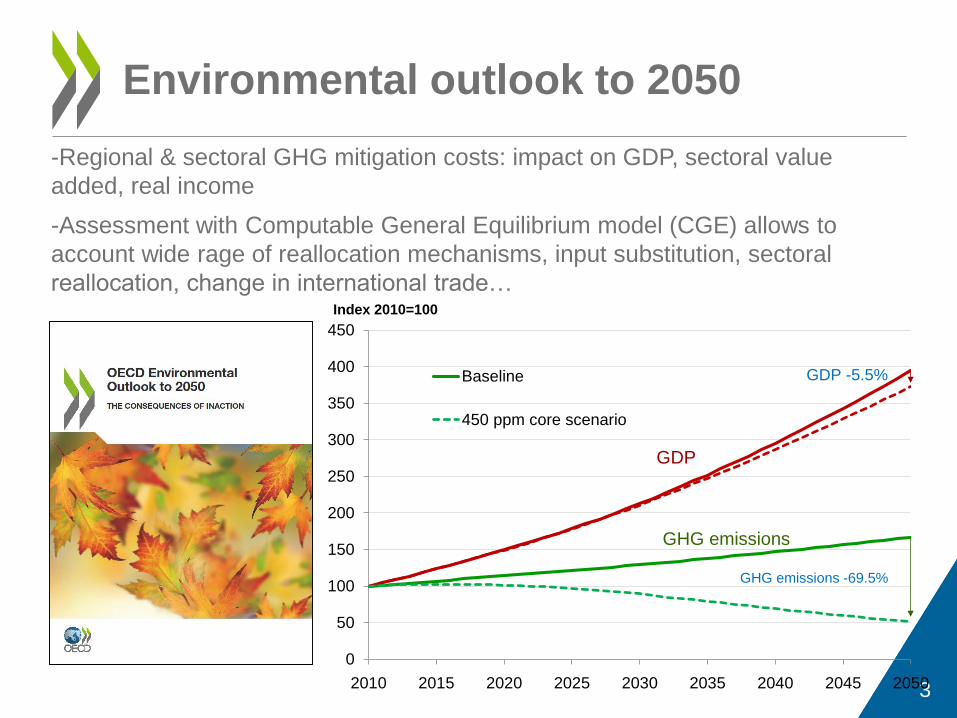
-Regional & sectoral GHG mitigation costs: impact on GDP, sectoral value
added, real income
-Assessment with Computable General Equilibrium model (CGE) allows to
account wide rage of reallocation mechanisms, input substitution, sectoral
reallocation, change in international trade…
3
Environmental outlook to 2050
0
50
100
150
200
250
300
350
400
450
2010 2015 2020 2025 2030 2035 2040 2045 2050
Index 2010=100
Baseline
450 ppm core scenario
GDP -5.5%
GHG emissions -69.5%
GDP
GHG emissions

• CIRCLE project : Costs of Inaction and Resource scarcity: Consequences for
Long-term Economic growth
• Aims to include the feedback of environnemental damages on economic
growth
– Regional and sectorial costs of inaction assess with CGE, based on
collaboration with several expert groups
– Use GDP as key indicator of economic growth
– Qualitative assessment to complete the picture
– Wide collection of damages are considered: climate change, land and water
scarcity, air pollution
4
CIRCLE project
5
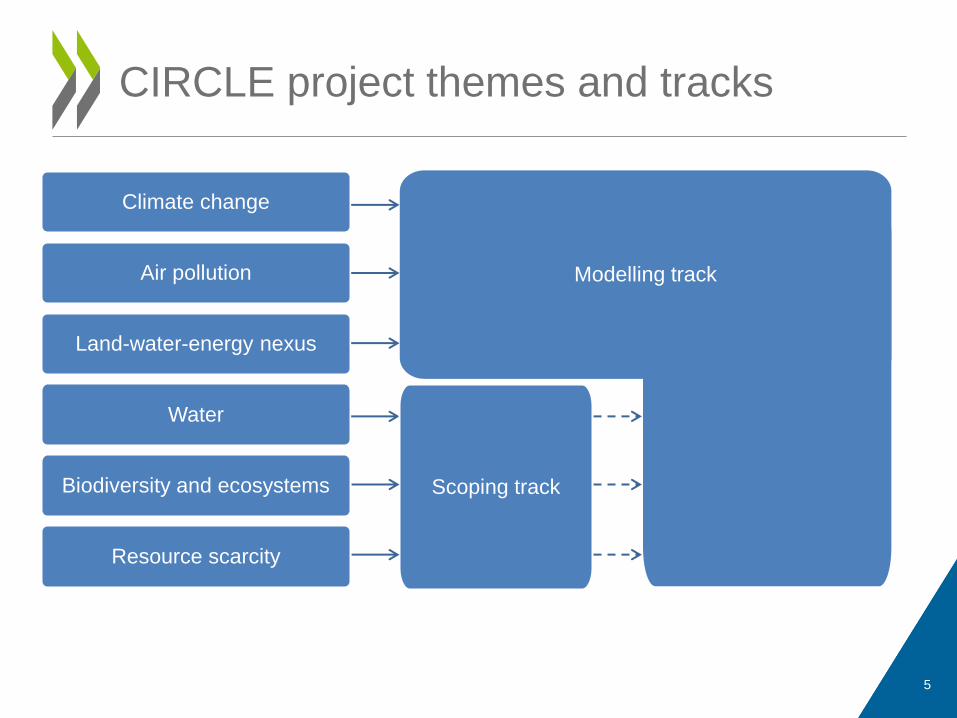
CIRCLE project themes and tracks
Climate change
Modelling track Air pollution
Land-water-energy nexus
Water
Scoping track Biodiversity and ecosystems
Resource scarcity
OUTLINES
Economic consequences of Climate Change 2
Introduction to CIRCLE 1
Elements on water scarcity for power generation 4
Discussion 5
Economic cost of Air pollution 3

• Aim: assess the economic consequences of
climate change
• Until 2060, multi-sector, multi-region
General Equilibrium production function
approach: climate change affects drivers of
growth
• After 2060, stylised Integrated Assessment
Model approach
• Collaboration with several expert groups, incl.
FEEM, CERE, NIES
7
Introduction
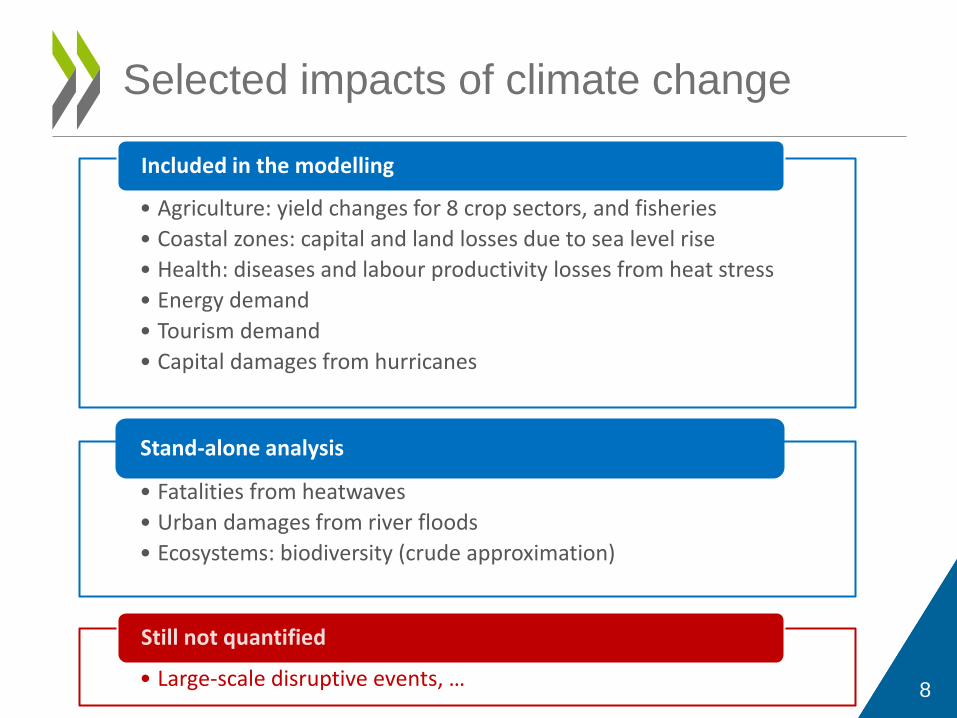
Selected impacts of climate change
8
• Agriculture: yield changes for 8 crop sectors, and fisheries
• Coastal zones: capital and land losses due to sea level rise
• Health: diseases and labour productivity losses from heat stress
• Energy demand
• Tourism demand
• Capital damages from hurricanes
Included in the modelling
• Fatalities from heatwaves
• Urban damages from river floods
• Ecosystems: biodiversity (crude approximation)
Stand-alone analysis
• Large-scale disruptive events, …
Still not quantified
9
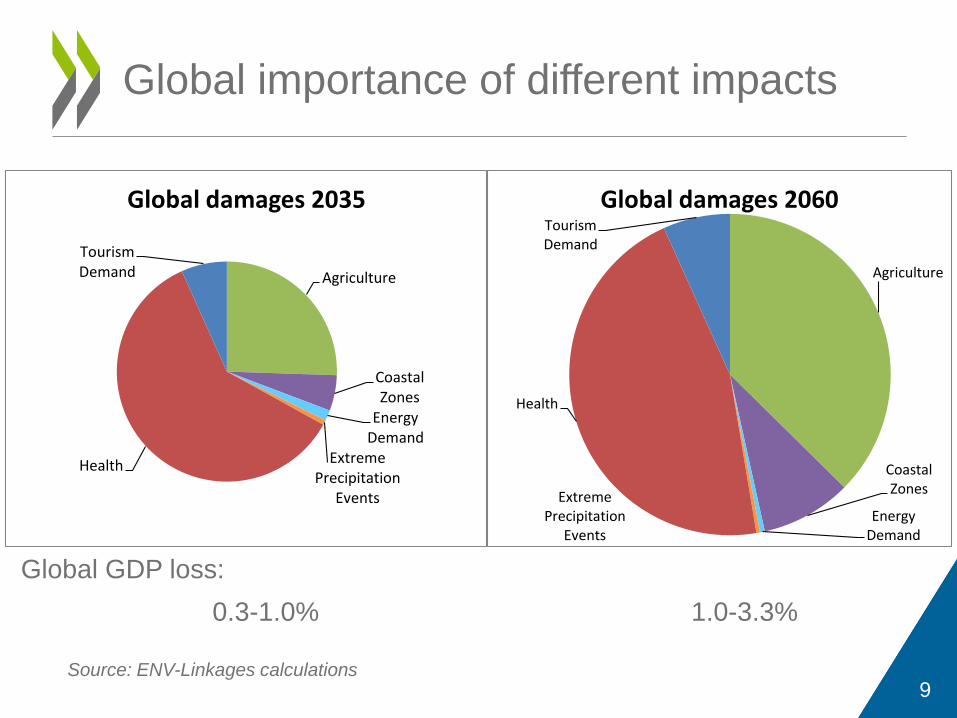
Global importance of different impacts
Source: ENV-Linkages calculations
Global GDP loss:
0.3-1.0% 1.0-3.3%
Agriculture
Coastal Zones
Energy Demand
Extreme Precipitation
Events
Health
Tourism Demand
Global damages 2060
Agriculture
Coastal Zones
Energy Demand
Extreme Precipitation
Events
Health
Tourism Demand
Global damages 2035
10
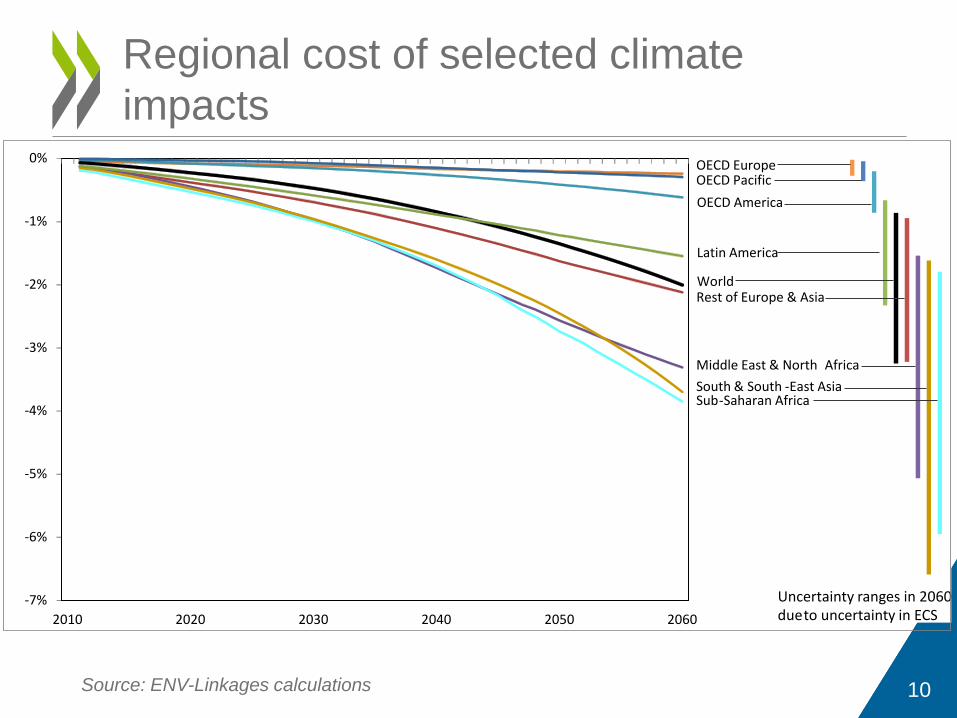
Regional cost of selected climate
impacts
Source: ENV-Linkages calculations
Uncertainty ranges in 2060 due to uncertainty in ECS
-7%
-6%
-5%
-4%
-3%
-2%
-1%
0%
2010 2020 2030 2040 2050 2060
- South & South East Asia
OECD Pacific
Rest of Europe & Asia
OECD Europe
Latin America
OECD America
World
- Sub Saharan Africa
Middle East & North Africa
Main messages (I)
1. Almost all regions significant negative market and
non-market impacts, plus downside risks
– Global GDP cost 1.0-3.3% by 2060, 2-10% by 2100
– Largest losses in Africa and Asia
– Largest losses from health and agricultural impacts
– Largest losses to capital and labour
– Costs increase more than proportionately with temperature
2. Losses spread across economies
– All sectors and regions are indirectly affected
3. Consequences are unavoidable and enduring
– Emissions commit the world to long-lasting impacts
11
Main messages (II)
4. Ambitious adaptation and mitigation can reduce
future impacts and limit risks
– Ambitious policies can reduce macroeconomic costs by
2100 from 2-10% to 1-3%
– Adaptation is important to ensure consequences of climate
change remain limited
– Ambitious global mitigation can help avoid half of the
economic consequences and limit downside risks
– Distribution of policy costs and benefits across regions and
sectors will not be proportional (but both imply a shift
towards more services)
12
OUTLINES
Economic consequences of Climate Change 2
Introduction to CIRCLE 1
Elements on water scarcity for power generation 4
Discussion 5
Economic cost of Air pollution 3
14
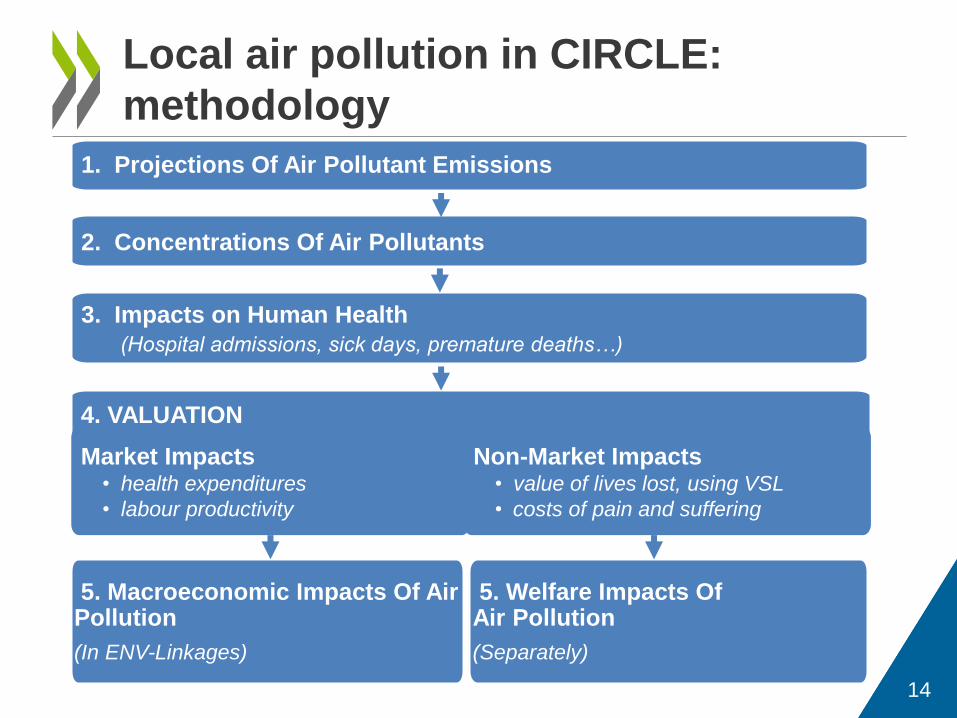
Local air pollution in CIRCLE:
methodology
1. Projections Of Air Pollutant Emissions
2. Concentrations Of Air Pollutants
3. Impacts on Human Health
(Hospital admissions, sick days, premature deaths…)
4. VALUATION
5. Macroeconomic Impacts Of Air Pollution
(In ENV-Linkages)
Market Impacts • health expenditures
• labour productivity
Non-Market Impacts • value of lives lost, using VSL
• costs of pain and suffering
5. Welfare Impacts Of Air Pollution
(Separately)

OUTLINES
Economic consequences of Climate Change 2
Introduction to CIRCLE 1
Elements on water scarcity for power generation 4
Discussion 5
Economic cost of air pollution 3

Power generation
• Hydroelectric & thermoelectric (TE) plants
• Mostly water withdrawal (not consumption)
• Limited power trade & need for stable supply
Water for Energy
Energy Land
Energy
Water
Agriculture
Economic activities
Resource
Power
generation,
fossil fuels
extraction
Biofuels
Land
use
discharges,
pollution,…
Water
Fossil fuels
• Cons. & withdrawal for extraction &
processing
• Fossil resources available become
more water intensive (e.g. shale oil & gas)
• International trade (->virtual water trade)
Biofuels
• Water consumption, dep. types of crops
• Role of energy & env. policies
• International trade (->virtual water trade)

Power supply &
transportation
Power demand
Climate change
Water policies
Megatrends
Environmental policies
Socioeconomic drivers
Population & GDP
IT technologies
(+) quantity &
quality of supply
T° increase
Change in rainfall
Seasonal variations
Extreme events
Uncertainty
(-) quantity
TE plant cooling
system standards
(-) TE dependence on
water
(+) cooling
(-/+) pumping in
agric)
(-/+) annual load
(-/+) peak load
(-) hydro, (-) TE (-/+)
capacities
(-) hydro, (-) TE capacities
(+/-) seasonal H &
(+ ?) grid security
Energy conservation
Renewable (wind, sol...)
Efficiency standards
Local air protection
(+) hydro, (-) TE
dependence
(-) dependence on TE
(+) PG in less populated
areas
Climate change

Country level: ways to generate electricity
with less water, example in the US
0
0.5
1
1.5
2
2.5
1960 1965 1970 1975 1980 1985 1990 1995 2000 2005 2010
(TK
Wh
)
Fossil fuel based electrcity generation in the US
Coal Gas Nuclear Oilsource: IEA extended energy balances 2014
0
50
100
150
200
250
300
350
400
450
500
1960 1965 1970 1975 1980 1985 1990 1995 2000 2005 2010
Bga
l/d
Water withdrawal by use in the US
Thermoelectric power Other usessource: USGS Water Use Data for the Nation
Reduced water withdrawal from thermoelectric generation:
-Cooling technologies: phase out of once-through systems
-Plant efficiency
But stress at the sub-national level
-South West US (DOE, 2012)
-No disruption but power provided to final consumers at a higher cost
Competition with other activities: urban demand, shale oil and gas,…

Cost for the power sector?
• PG technologies and water intakes
• Interconnections
• Response to water scarcity
• Uncertainty
>Need for detailed power generation model
Cost for the whole economy?
• Production function approach?
• Cost of disruption (with VOLL)?
• Cost for reducing the risk of disruption?
• Opportunity cost of reduced future access?
>How to get these notions in ENV-Linkages?
Assessment at the global level? Water demand for energy (Davies et al; 2013, Kyle et al., 2012 ) but no macroeconomic cost
How to assess macroeconomic costs of
water scarcity through power generation?

OUTLINES
Economic consequences of Climate Change 2
Introduction to CIRCLE 1
Elements on water scarcity for power generation 4
Discussion 5
Economic cost of air pollution 3

THANK YOU!
For more information:
www.oecd.org/environment/CIRCLE.htm
www.oecd.org/environment/modelling

APPENDIX
22

• Collaboration with existing impact studies
– Methodology largely based on the FEEM ICES model
– Data for a subset of damages from sectoral EU projects, obtained
with help of FEEM
– Additional data from range of collaborators, incl. NIES, VU
University Amsterdam, IIASA, IPTS-JRC
– Data consistency on damages is ensured by choosing damages
corresponding to an appropriate temperature pathway (no simple
damage functions relating everything to global T)
• Damages calculated in ENV-Linkages model to 2060
– Autonomous adaptation takes place via sectoral adjustments and
international trade
• Stylised calculations with AD-DICE to 2100
– Baseline and damages to 2060 harmonised with ENV-Linkages
Methodology for climate damages
23

-5.0%
-4.0%
-3.0%
-2.0%
-1.0%
0.0%
1.0%
2.0%
Can
ada
Ch
ile
Me
xico
USA
EU la
rge
4
Oth
er O
ECD
EU
Oth
er O
ECD
Au
s. &
New
Z.
Jap
an
Ko
rea
Ch
ina
No
n-O
ECD
EU
Ru
ssia
Cas
pia
n r
egi
on
Oth
er E
uro
pe
Bra
zil
Oth
er L
at.A
m.
Mid
dle
Eas
t
No
rth
Afr
ica
ASE
AN
9
Ind
on
esi
a
Ind
ia
Oth
er A
sia
Sou
th A
fric
a
Oth
er A
fric
a
OECD America OECD Europe OECD Pacific Rest of Europe and Asia LatinAmerica
MiddleEast &NorthAfrica
South- and South-EastAsia
Sub-Saharan
Africa24
Regional results and uncertainty from
climate sensitivity – year 2060
Source: ENV-Linkages calculations
-14.0%
-12.0%
-10.0%
-8.0%
-6.0%
-4.0%
-2.0%
0.0%
2.0%
4.0%
Can
ada
Ch
ile
Me
xico
USA
EU la
rge
4
Oth
er O
ECD
EU
Oth
er O
ECD
Au
s. &
New
Z.
Jap
an
Ko
rea
Ch
ina
No
n-O
ECD
EU
Ru
ssia
Cas
pia
n r
egi
on
Oth
er E
uro
pe
Bra
zil
Oth
er L
at.A
m.
Mid
dle
Eas
t
No
rth
Afr
ica
ASE
AN
9
Ind
on
esi
a
Ind
ia
Oth
er A
sia
Sou
th A
fric
a
Oth
er A
fric
a
OECD America OECD Europe OECD Pacific Rest of Europe and Asia LatinAmerica
MiddleEast &NorthAfrica
South- and South-EastAsia
Sub-Saharan
Africa
OECD America OECD Europe OECD Pacific Rest of Europe and Asia Latin
America
Middle East &
N. Africa South and South-
East Asia
Sub-Saharan
Africa
25
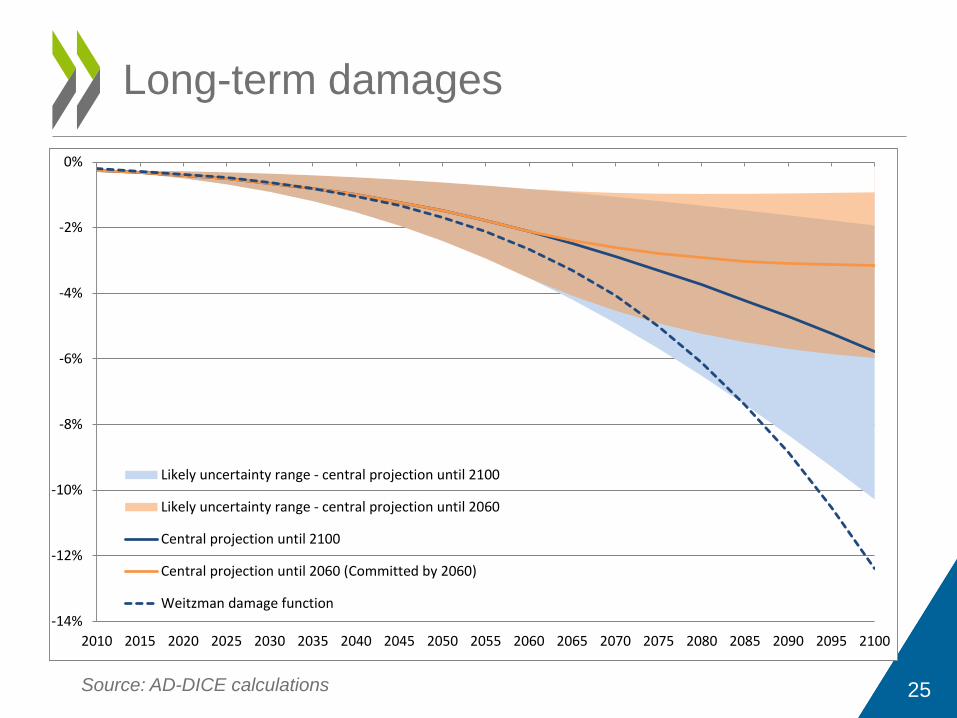
Long-term damages
Source: AD-DICE calculations
-14%
-12%
-10%
-8%
-6%
-4%
-2%
0%
2010 2015 2020 2025 2030 2035 2040 2045 2050 2055 2060 2065 2070 2075 2080 2085 2090 2095 2100
Likely uncertainty range - central projection until 2100
Likely uncertainty range - central projection until 2060
Central projection until 2100
Central projection until 2060
Weitzman damage function-14%
-12%
-10%
-8%
-6%
-4%
-2%
0%
2010 2015 2020 2025 2030 2035 2040 2045 2050 2055 2060 2065 2070 2075 2080 2085 2090 2095 2100
Likely uncertainty range - central projection until 2100
Likely uncertainty range - central projection until 2060
Central projection until 2100
Central projection until 2060 (Committed by 2060)
Weitzman damage function

26
Damages with policy controls
Source: Preliminary AD-DICE calculations
-10%
-9%
-8%
-7%
-6%
-5%
-4%
-3%
-2%
-1%
0%
2010 2015 2020 2025 2030 2035 2040 2045 2050 2055 2060 2065 2070 2075 2080 2085 2090 2095 2100
Likely uncertainty range - no policies
Likely uncertainty range - optimal policies
Central projection - no policies
Central projection - optimal policies-10%
-9%
-8%
-7%
-6%
-5%
-4%
-3%
-2%
-1%
0%
2010 2015 2020 2025 2030 2035 2040 2045 2050 2055 2060 2065 2070 2075 2080 2085 2090 2095 2100
Likely uncertainty range - no policies
Likely uncertainty range - optimal policies
Central projection - no policies
Central projection - optimal policies
27
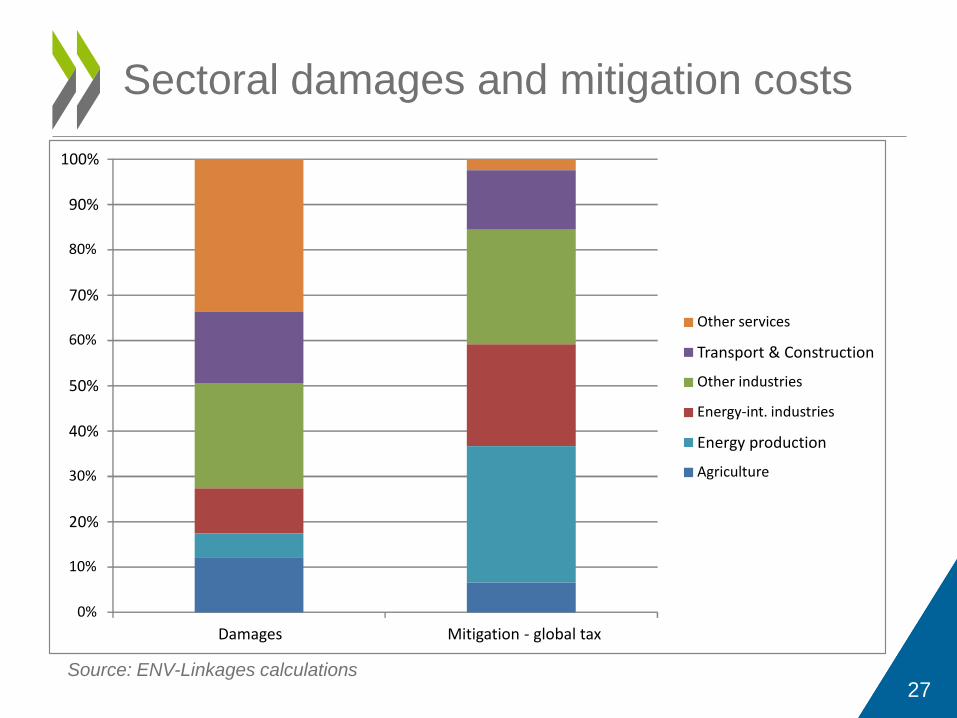
Sectoral damages and mitigation costs
Source: ENV-Linkages calculations
0%
10%
20%
30%
40%
50%
60%
70%
80%
90%
100%
Damages Mitigation - global tax
Other services
Transport & Construction
Other industries
Energy-int. industries
Energy production
Agriculture

28
No-damage baseline GDP projection
Source: ENV-Linkages calculations
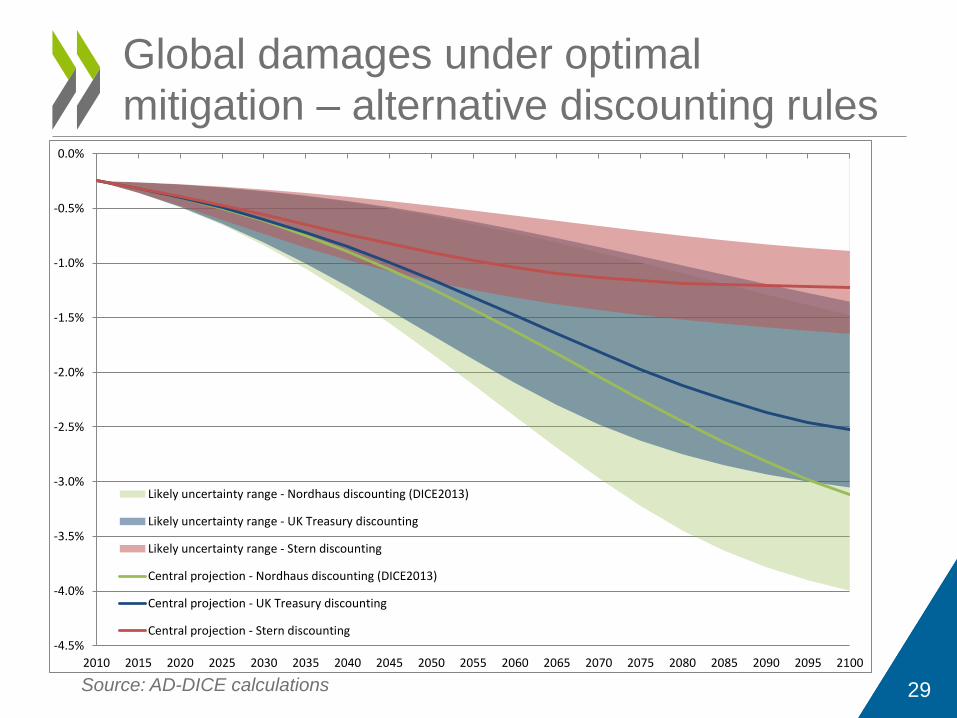
29
Global damages under optimal
mitigation – alternative discounting rules
Source: AD-DICE calculations
-4.5%
-4.0%
-3.5%
-3.0%
-2.5%
-2.0%
-1.5%
-1.0%
-0.5%
0.0%
2010 2015 2020 2025 2030 2035 2040 2045 2050 2055 2060 2065 2070 2075 2080 2085 2090 2095 2100
Likely uncertainty range - Nordhaus discounting (DICE2013)
Likely uncertainty range - UK Treasury discounting
Likely uncertainty range - Stern discounting
Central projection - Nordhaus discounting (DICE2013)
Central projection - UK Treasury discounting
Central projection - Stern discounting

Europe France (IEA, 2012); Central Europe (Rübbelke and Vögele,
2011)
Australia: increased water withdrawal for power generation in water
stressed areas (Smart and Aspinall, 2009)
China: Power generation in regions with water scarcity, adoption of dry
cooling + (shale resources in water scarce areas) (IEA, 2012)
India: seasonal variations drought and heat waves create high demand
and low supply (IEA, 2012; Bhattacharya and Mitra, 2013)
Sub Saharan Africa: uncertainty on water flows increases the cost of
developing that hydro capacities (Cervigni et al 2015)
Howe local circumstances matter:
Hotspots and bottlenecks