from changes in today’s options...
TRANSCRIPT
Creating Consistent Income from Changes in Today’s
Options Market
2
Creating Consistent Income from Changes in Today’s Options Market
© Copyright 2017 by Trading Concepts
All Rights Reserved
This training program, or parts thereof, may not be reproduced in any form without the prior written permission of Trading Concepts, Inc.
No claim is made by the Trading Concepts, Inc.™ that the (option) trading strategies shown here will result in profits and will not result in losses. Option trading may not be suitable for all recipients of this Training Program. All comments, trading strategies, techniques, concepts and methods shown within our Course are not and should not be construed as an offer to buy or sell stocks and options – they are opinions based on market observation and years of experience. Therefore, the thoughts expressed are not guaranteed to produce profits in any way. All Opinions are subject to change without notice. Each option trader/investor is responsible for his/ her own actions, if any. Your download of this content constitutes your agreement to this disclaimer and exempts Trading Concepts from any liability or litigation.
Important Notice - Risk Disclaimer: Options Trading has large potential rewards, but also large potential risk. You must be aware of the risks and be willing to accept them in order to invest in the options market. Don't trade with money you can't afford to lose. This is neither a solicitation nor an offer to buy or sell options. No representation is being made that any account will or is likely to achieve profits or losses similar to those discussed in our training program. The past performance of any option trading strategy or methodology is not necessarily indicative of future results. Hypothetical or simulated performance results have certain inherent limitations. Unlike an actual performance record, simulated results do not represent actual option trading. Also, since the option trades have not actually been executed, the results may have under- or over-compensated for the impact, if any, certain market factors, such as lack of liquidity. Simulated option trading programs in general are also subject to the fact that they are designed with the benefit of hindsight. No representation is being made that any account will or is likely to achieve profits or losses similar to those that may be shown.
3
Table of Contents
Introduction to Change in the Market 4
The Fed is Walking Away from QE 6
Trading Volume is Moving Upstairs 9
Markets Follow the Sun and Create More Gaps 11
Markets Are Underpricing Expected Volatility 12
We’re Using the Same Old Tools With New Markets 14
Summary 15

4
Introduction to Change in the Market
Is today’s market the same as the one that we traded five years ago? Ten years ago? Fifty year ago? Many traders and investors are assuming so, because they’re not even asking the question. Before we dig into this, I think that one look at the chart below will give you your answer:
Pretty amazing, isn’t it? We’ve seen more changes in the market over the last 20 years than all of the previous years put together….and the pace is accelerating. Think about why this is happening….as recently as the 1980’s, the “stock market” was like some remote, distant, untouchable island only inhabited by insiders.
Now the Stock Market has been distributed to the masses, in not only the United States, but world-wide. Even China has gotten into the act, with millions of citizens opening accounts and trading shares of Chinese companies in a replay of the late 90’s “bubble” days of the US.
And not only have stock markets attracted world-wide attention from a whole new class of investors, but the Options markets are heading that way as well. I can’t even watch a football game these days without seeing an online Option broker commercial, so Options trading has grown up from a black art practiced in the back room by math
5
nerds and in the trading pits by warriors….to a full-fledged and viable form of trading to the retail masses who can do so in the privacy of their homes.
And to some degree, this has come about by NEED and not just market forces. With the huge rally in asset prices since 2009 (that most missed out on), stock prices of the typical “market movers” isn’t exactly cheap these days. $1863/share for Priceline? With most investors having modest accounts these days, still suffering from the economic downturn and increasing job replacement due to automation, it’s hard to imagine how you’ll reach retirement goals by buying a few shares of one expensive stock.
But Options give you…..alternatives. If you’re reading this report, I probably don’t have to go into all of the reasons why Options trading offers an incredible litany of advantages and alternative forms of generating “value” and income. We view it as a good thing that you’re reading this to view new methods into generating edge!
But in the years we’ve made it our business to specialize in Options, we’ve found that the ground is literally shifting below our feet in terms of how the Options trading landscape is changing. Some of the changes that we’ve seen lately are in our favor and make our jobs easier, while some of them have occurred in a very “sneaky” manner and it’s taken a sharp eye and constant vigilance to stay on top of.
What are these recent changes and how do we stay on top of them? Let’s look at some of the more recent and impactful ones….
6
The Fed is Walking Away from QE It’s been a roller-coaster ride for the Federal Open Market Committee (FOMC) for the past few years. From 2003 through mid-2007 they were continually, persistently raising interest rates every six weeks in order to stay in front of the threat of inflation. They turned the screw one-quarter turn too tight and the economy literally began to collapse under their feet in 2007, so they jumped into action and chased the market down the hill with a series of emergency rate cuts. They progressively cut the effective interest rate to zero percent, creating a new acronym in the process (ZIRP) for Zero Rate Interest Policy. I thought that they were out of the game and totally irrelevant as of 2009.
There was no way that they would be hiking interest rates for years; we viewed this as a good thing as we wouldn’t have to deal with the risk of anything happening during their every-six-week announcement.
And then the unthinkable happened. What was a rumor in the back rooms of traders everywhere….”the Plunge Protection Team”…..kicked into gear. There was always a sense that money was being printed with the absence of the government M2 money supply report, foreshadowing that something was going on but no one knew WHAT. This fueled the conspiracy theory rumors in chat rooms and forums.
That “what” was announced in August of 2010 as “monetary stimulus.” There were many different forms of it, all given different, colorful names (i.e. “Operation Twist,” “QE3” etc.) each with the purpose of injecting much-needed liquidity into the financial markets. Eventually, everyone settled on the term “Quantitative Easing” (QE) as the politically-correct term for the stimulus, which was another way of inferring that money was being printed out of thin air, debasing the currency and creating a money supply.
The POINT of this action was to increase the liquidity and stimulate business and the economy.
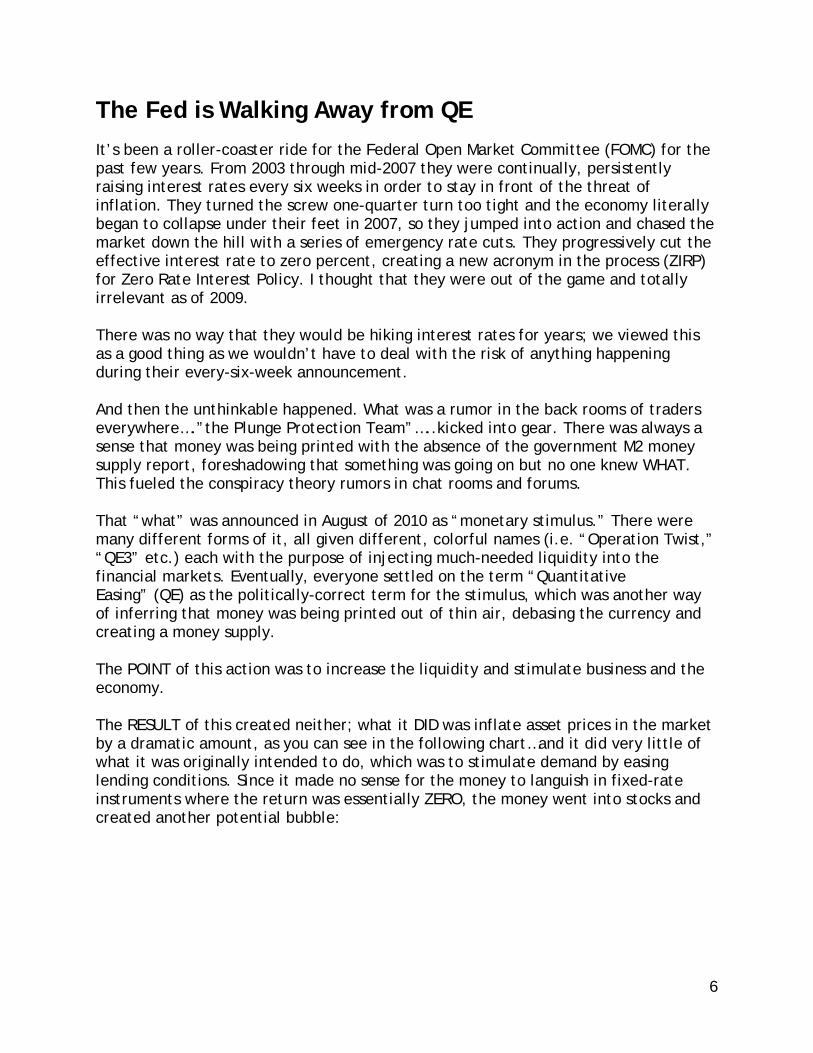
The RESULT of this created neither; what it DID was inflate asset prices in the market by a dramatic amount, as you can see in the following chart…and it did very little of what it was originally intended to do, which was to stimulate demand by easing lending conditions. Since it made no sense for the money to languish in fixed-rate instruments where the return was essentially ZERO, the money went into stocks and created another potential bubble:
7
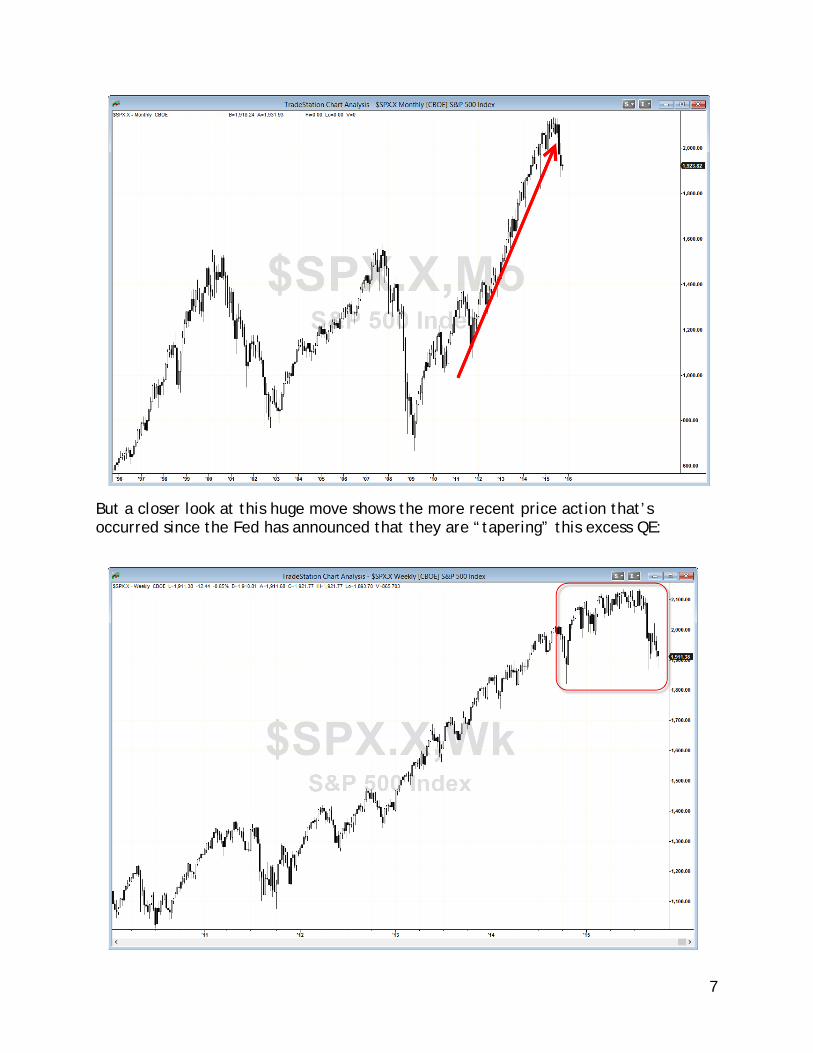
But a closer look at this huge move shows the more recent price action that’s occurred since the Fed has announced that they are “tapering” this excess QE:

8
The net result of this “taper” down to zero QE has been a much more volatile, non- linear market that is difficult for traders and investors to trade. In the next video and report, we’ll detail that this is a very normal occurrence, however this formation can lead to severe market conditions that few are prepared for.
The Fed is currently between a “rock and a hard place.” They have ended QE with the intent to going back to a more “normal” interest rate environment, but they may have waited too long to take their foot off the gas, creating a bubble that might “pop.” In that case, it will be impossible for them to raise rates, and in fact, might lead to yet another round of undesirable stimulus and a more toxic balance sheet.
The point of all this, if you can FIND one these days….is that uncertainty and volatility rule the markets right now, and our trading methodology needs to reflect this.
9
Trading Volume is Moving Upstairs
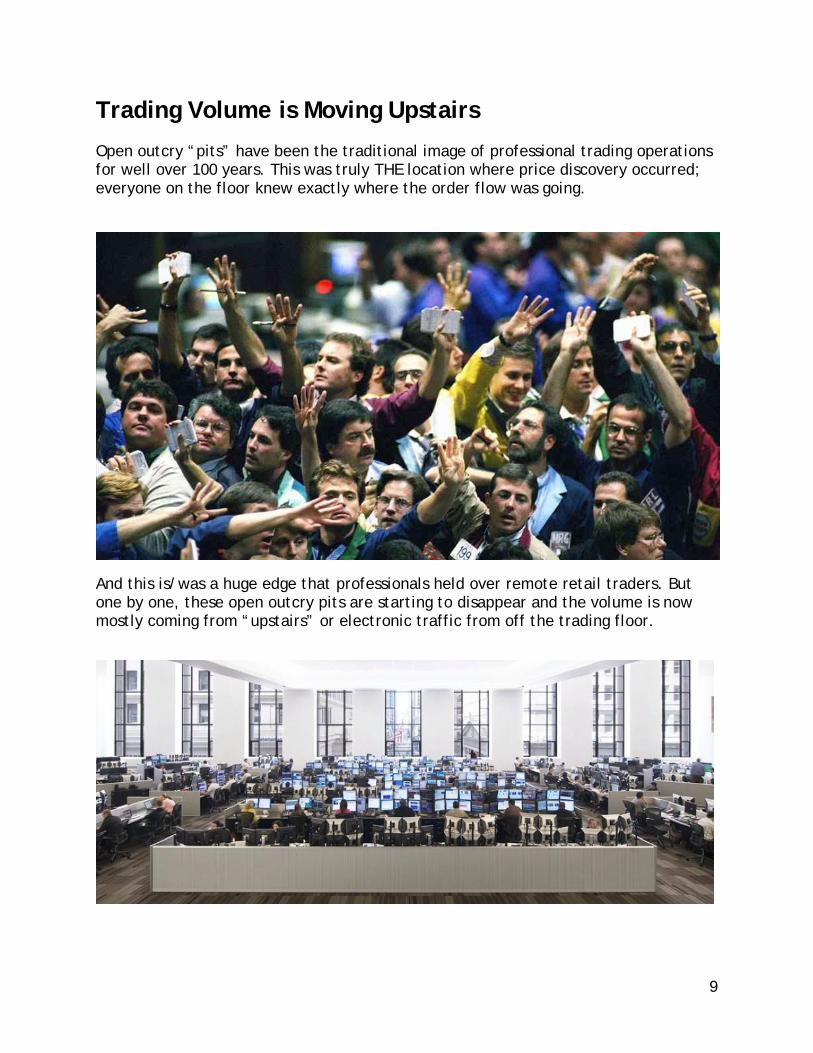
Open outcry “pits” have been the traditional image of professional trading operations for well over 100 years. This was truly THE location where price discovery occurred; everyone on the floor knew exactly where the order flow was going.
And this is/was a huge edge that professionals held over remote retail traders. But one by one, these open outcry pits are starting to disappear and the volume is now mostly coming from “upstairs” or electronic traffic from off the trading floor.

10
This means that a lot of “prop” and professional trading operations that are performing “market-making” or “liquidity” services are now in a separate location, trading through an electronic connection. In other words, they have the same edge that you and I have concerning Price Discovery!
This is good news for retail traders, right? Yes, absolutely! Bid/ask spreads are generally very narrow which has taken the prop traders out of their function of market-making, at least in the old terms.
There are, however, two things that we’ve noticed with this increased emphasis on electronic trading:
A Shift in Options Liquidity
We’ve really seen a liquidity shift into large-cap issues; options volume and growth is going into these stocks, while ignoring the other 80% of stocks with options. So yes, it’s great that just about every stock has listed options now, but so many of them have essentially ZERO volume with associated wide bid/ask spreads. These stocks essentially cannot be traded with options without losing a huge amount of edge to enter/exit a position.
The Risk of Being “Picked Off”
In today’s electronic environment, if you miss-enter an order, either on entry or exit, you will INSTANTLY be filled at a disadvantage to you. In the past, this used to be a manual process where someone would have to be monitoring an option chain to notice the odd order and then execute the trade against it; you had a few seconds to notice the error and correct it, but not now.
The lesson is clear: be very careful when you enter or exit an order or you’ll be filled against your will while losing a lot of edge.

11
Markets Follow the Sun and Create More Gaps
Prior to a decade ago, a stock that traded on the NYSE saw very little “real” volume in the aftermarket before it opened up again for the next trading day at 0930am ET. A stock would generally open up very close to where it stopped trading the previous day.
Now, we’re seeing an accelerating trend towards more and more trading that occurs OUTSIDE of the “cash” market normally associated with the 930a - 400p ET US exchange window. You can see this effect in the chart for AAPL below:
The green areas are some of the price areas where significant overnight trading took place, which creates a “gap” on the price chart.
Some charts will gap more than others, and it’s usually going to be the candidates that attract the most global attention and volume. We’ll just have to keep this in mind as we trade these candidates, because a large overnight gap might create an unrecoverable defensive situation, especially with strategies where the reward-to-risk is unfavorable to begin with.
12
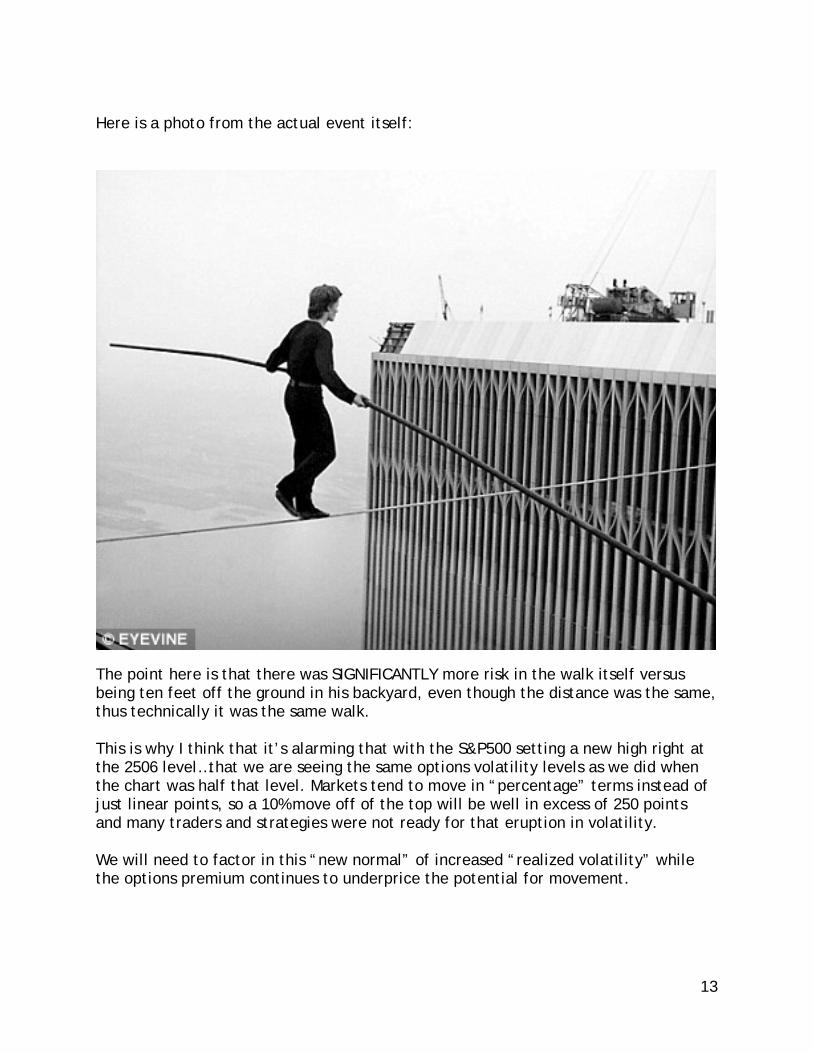
Markets Are Underpricing Expected Volatility The best way to explain this point is with an analogy to height. A movie about Philippe Petit’s magnificent, incredible tightrope walk between the World Trade Center towers (1974). This is a more “Hollywood” version of Man on Wire which was a 2008 documentary of how Petit thought of the stunt, trained for it, and pulled it off.
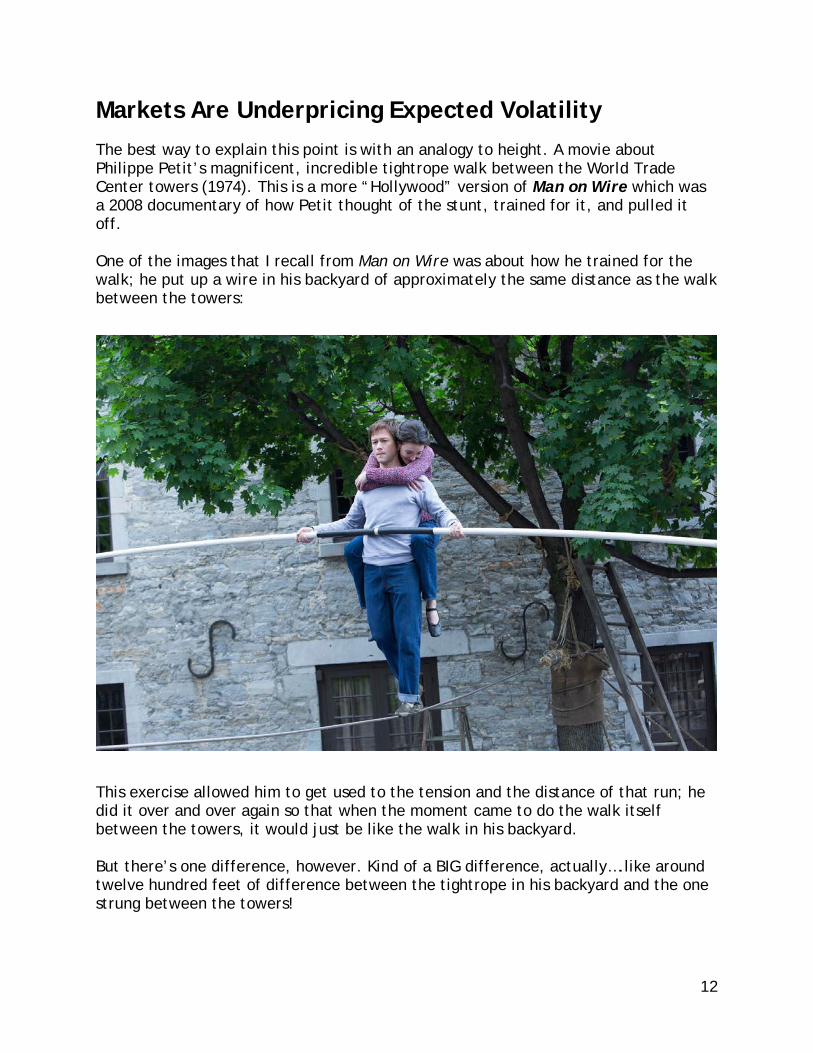
One of the images that I recall from Man on Wire was about how he trained for the walk; he put up a wire in his backyard of approximately the same distance as the walk between the towers:
This exercise allowed him to get used to the tension and the distance of that run; he did it over and over again so that when the moment came to do the walk itself between the towers, it would just be like the walk in his backyard.
But there’s one difference, however. Kind of a BIG difference, actually….like around twelve hundred feet of difference between the tightrope in his backyard and the one strung between the towers!
13
Here is a photo from the actual event itself:
The point here is that there was SIGNIFICANTLY more risk in the walk itself versus being ten feet off the ground in his backyard, even though the distance was the same, thus technically it was the same walk.
This is why I think that it’s alarming that with the S&P500 setting a new high right at the 2506 level…that we are seeing the same options volatility levels as we did when the chart was half that level. Markets tend to move in “percentage” terms instead of just linear points, so a 10% move off of the top will be well in excess of 250 points and many traders and strategies were not ready for that eruption in volatility.
We will need to factor in this “new normal” of increased “realized volatility” while the options premium continues to underprice the potential for movement.
14
We’re Using the Same Old Tools With New Markets
If you talk with 90% of retail traders today, you’ll see them dutifully applying the same tools that they’ve always used, and the same ones that everyone else uses, which are Stochastics, MACD, and moving averages. Yet as we’ve already shown, markets move in a very different manner than they did when these indicators were invented and applied to charts.
George Lane invented the Stochastic Oscillator in the 1950’s, and Gerald Appel developed the MACD indicator in the 1960’s; these are used, respectively, as “oscillator” tools that are intended to mark tops and bottoms, and as a momentum indicator to show when momentum was slowing down and ready to reverse.
We’re not denying the usefulness of these excellent indicators, however quite frankly, they are best suited for “choppy” markets that feature price action that trades within a wide range - precisely what we got for decades before the 1990’s showed up and changed the paradigm.
Markets are moving continually between states of “range expansion” (i.e. a trend) and “range contraction”, or a consolidation. Back and forth…..build up energy in a consolidation…then they tend to break out into the next trend.
You’ll see examples of this migration in “market character” in the next video, and I’ll show examples of this “Fractal Energy Trading” analysis and the methods that I currently use to find edge in this new “modern market”….in video/report #3.

15
Summary
These are but five conditions that I’ve seen change in markets lately; we could probably drone on for hours talking about how things have changed recently. But the point is, CHANGE is here to stay. Not only do we need to accept the fact that things are different than how they were, but we also need to EMBRACE the fact that conditions will continue to change going forward.
The flexible, prepared investor will adapt to future markets like water adapts to topography, flowing with it and around it instead of insisting on a direction. After all, trading is not that difficult, most of the time is is US that complicates it, right?
In the next report and video I’d like to give you a little more structure on how you can start to evaluate market movement and character from some different perspectives that you might not have considered before.