from census to population density surfacesenvironmental/amaral_gavlak... · web viewcensus sector...
TRANSCRIPT

How Remote Sensing Data, Spatial Analysis Methodologies and Census Tract data can Improve the Spatial Distribution of Population for Environmental Related Studies: The cases of Marabá and the Sustainable Forest District, SFD-BR163, Pará, Brazilian Amazônia.
Silvana Amaral · André Augusto Gavlak · Maria Isabel Sobral Escada · Antônio Miguel Vieira Monteiro1
Abstract Contributing to represent population spatial distribution, this work proposes a methodological approach to redistribute census sector population data in density surfaces. The methodology based on cell space was developed for a municipality, in the Brazilian Amazon, consisting of: (i) a dasymetric method to eliminate areas of environmental restriction to human presence; (ii) environmental data indicative of human presence generates a potential surface of population occurrence; and (iii) census population count was redistributed into cells. This methodology, adapted for the 13 municipalities of Sustainable Forests District of BR-163, generated population distribution surfaces for 2000 and 2007. The evolution of the resident population over the SDF/BR-163 showed spatial patterns compatible to the occupation process described in the literature and verified in the fieldwork. Since the proposed methodology can be extended to other areas, population density surfaces can be useful as additional data source to study population and territory dynamics.
Keywords Population distribution · Density population surface · Amazon · Fuzzy inference · SFD-BR163.
Introduction
From the origins of population and environment studies, the main approach comprised the pressure of the numbers (population) over the natural resources (Ehrlich 1968; McMichael 1993). The human and environment relationships were the central issue, instead of discussing the population dynamic as consequence of environmental conditions (Hogan 1989). Recently, the predominant focus about population-environment-development research is a moderate approach, where demographic pressure is no longer the principal determinant of environmental problems, but merely an aggravating factor (Hogan 2000).
Considering the process of forest conversion in the Brazilian Amazonia region, the human presence was at the same time responsible for environmental changes, and suffered the consequences of these changes over the settled population. Identifying cause-consequence relations depends on the focus, scale of analysis, and conservation versus development orientation.
Most of studies using remote sensing approaches for environment and population either works in a very detailed scale (settlements) or considers population as an independent variable conditioning land use changes. Images from remote sensing contributed significantly for studies about human and biophysical dimensions integration in the Amazonia region (Frohn et al. 1996; Wood and Skole 1998). Land use and cover changes analyses enable the integration between remote sensing and socio-demography studies, combining image-processing techniques with social science analytical methods (McCraken et al 2002). For land cover and landscape changes, the observation unit is the pixel. Then, resolution, scale and information available from spectral bands are functions of the remote sensors selected. In the other hand, data for social scientists usually came from field surveys and/or official census, for which the observation unit is essential to define the research subject such as events, individuals, households, social group, and communities. Therefore, the scale for an integrate analysis arises from two questions: who are the social actors of interest, and which is the spatial dimension concerning to these actors.
The historical process of colonization in Brazilian Amazon, considering the demographic dynamic and land use and cover change patters have been studied based on households units (Moran et al. 1994; Moran and Brondízio 1998; McCracken et al. 1999; Moran et al. 2003). Cohort, age and period effects are analyzed to interpret landscape changes, mainly deforestation rates and secondary succession. Despite the undeniable
1S. Amaral ( ) · A. A. Gavlak · M.I.S. Escada · A. M. V. MonteiroBrazilian National Institute for Space Research – INPE, PO Box 515 - 12227-010 - São José dos Campos - SP, Brazile-mail: [email protected]
contribution, such detailed studies describe a local particular process, and because of the Amazonia regional heterogeneity, they are unsuitable to generalization.
For human population studies in a scale of analysis broader than familiar unit, population data from official census is the alternative demographic data source. In Brazil, the information for decennial censuses and population counts are collected taking the residences as sampling unit (IBGE, 2010). However, population data has been published taking the census sector2 as spatial unit, i.e. the information about inhabitants is available spatially aggregated.
The physical limits of Amazonian municipalities changed over the past decades leading to changes in the limits of the census sectors. Then, spatial analysis and comparisons between census/counting population data are not straightforward. Moreover, as census sectors spatially define areas, they can be represented as polygons in a planar subdivision (layers) in Geographical Information Systems. This representation can be easily superposed over remote sensing images for complementary visualization of physical environment and population distribution. As census sectors areas contain aggregated information, one cannot easily attribute population data for an image pixel, especially for heterogeneous areas as rural census sector in the Amazonia.
As human activities change the territory, and the settlement of population usually follows some environmental preferences, remote sensing and ancillary geographical data can be used to redistribute population inside a census sector. This work aims to contribute for representing the spatial distribution of population data, presenting a methodological approach to redistribute census sector population data in a cellular database, a spatial unit between pixels and the census sector limits.
First, to create a population density surface from census sector population counts we developed a methodology for Marabá, a municipality in the state of Pará, Brazil. Then, we present the population density surface obtained for the BR-163 Sustainable Forest District (SDF/BR-163). This political division comprises 13 municipalities in west of the state of Pará, where the dynamic of human activity and environmental changes demands continuous studies and monitoring. Finally, we discuss the population density surfaces comparing to the fieldwork observations.
A model to disaggregate population data inside the census sectors
In this work, population is represented by the resident population count provided by the Brazilian Institute for Geography and Statistics (IBGE - Instituto Brasileiro de Geografia e Estatística) census and counting. Instead of census sectors, the population distribution will be represented by a continuous surface where the population count is attributed to cells, the map unit of the surface. We developed the methodology generating a population density surface for the municipality of Marabá using a dasymetric method and a model based on indicative variables. Adapting this methodology to regional features, a second population density surface was created for the 13 municipalities of SFD-BR163.
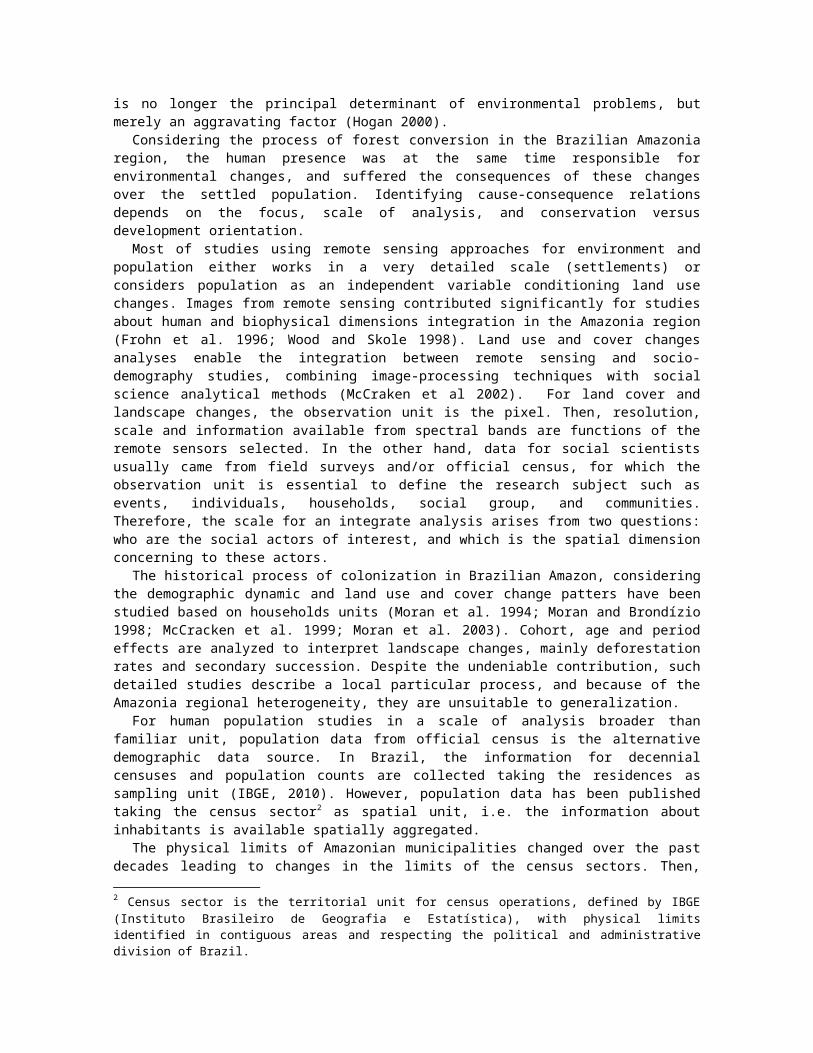
Marabá is located in the southeast of Pará state (Figure 1). It occupies 15,111.26 km2 and is a regional capital whose urban center is on the confluence of Tocantins and Itacaiunas rivers, and PA-150 and Transamazônica roads. Marabá experienced intense migration flows from the state of Maranhão in the sixties, and from southeast states in the seventies (De Reynal et al. 1995). Population mobility has slowed recently and it is basically rural-to-urban or rural-to-rural migration (Oliveira et al. 2001).
2 Census sector is the territorial unit for census operations, defined by IBGE (Instituto Brasileiro de Geografia e Estatística), with physical limits identified in contiguous areas and respecting the political and administrative division of Brazil.
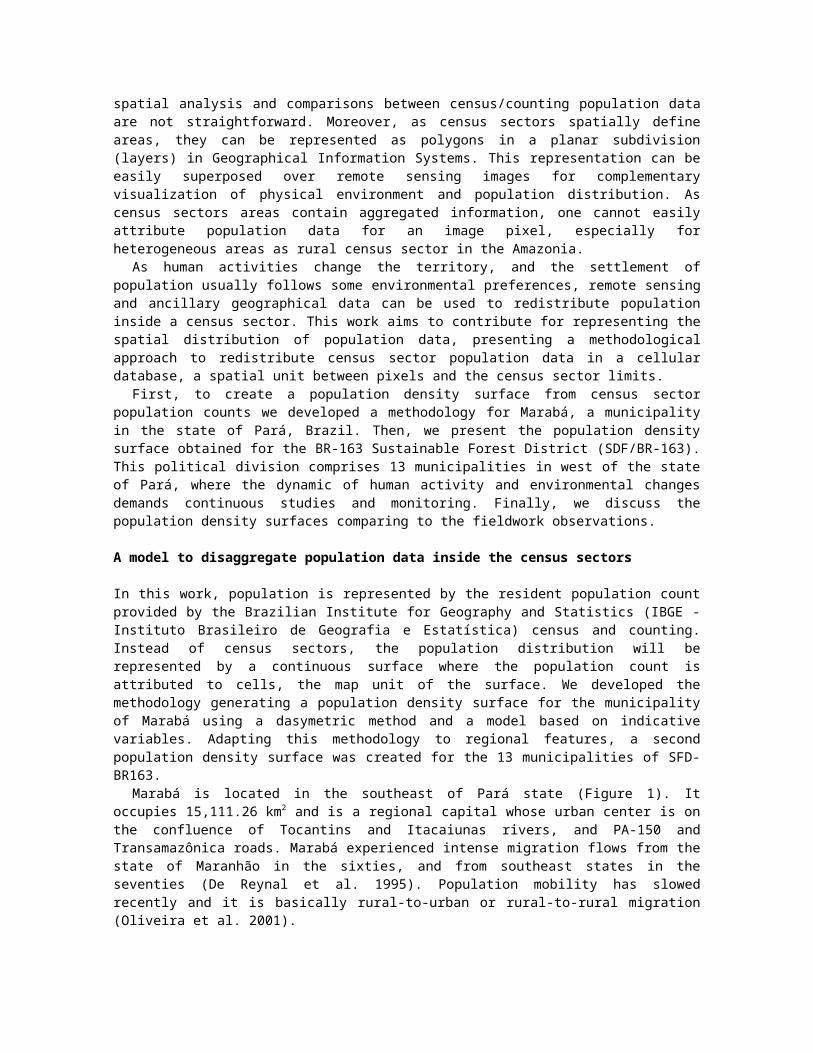
Fig. 1 Municipality of Marabá and the census sectors limits over ETM+/ Landsat7 image color composition (R5G4B2)
Disaggregating population from census sector (polygons) to cell space (surface) requires the construction of a subjacent surface with a modeling describing the factors that conditioning population distribution (Goodchild et al. 1993). We assumed that there are spatial variables related to the absence or presence of human establishment that could be used to indicate how the population is distributed (Figure 2).
Fig. 2 General procedure to disaggregate population counts within census sectors. Source: Adapted from Amaral (2005)
The method consists of three basic steps: (i) a dasymetric method (Mennis 2003; Sleeter 2004) to eliminate the areas of environmental restriction to human presence (cells), taking a map of land use cover classification as reference; (ii) indicative information of human presence in a multivariate interpolation method generates a potential surface of population occurrence, using Fuzzy Inference (Zadeh 1988; Meirelles 1997), proposing an adjacent surface model, and (iii) count values of census population is finally assigned to each cell proportionally to the potential occurrence of population defined by the indicative variables.
For the Amazon region, there are extensive areas of water and forest land cover that cannot contain any population count value. We propose the use of ordinary digital classification of remote sensing images, as thresholds settings, to identify the water bodies and forest cover areas land cover. Then, the dasymetric method consisted of removing from the population density surface, that cells where water bodies and/or forest occupied at least 95% of the cell area in Marabá.
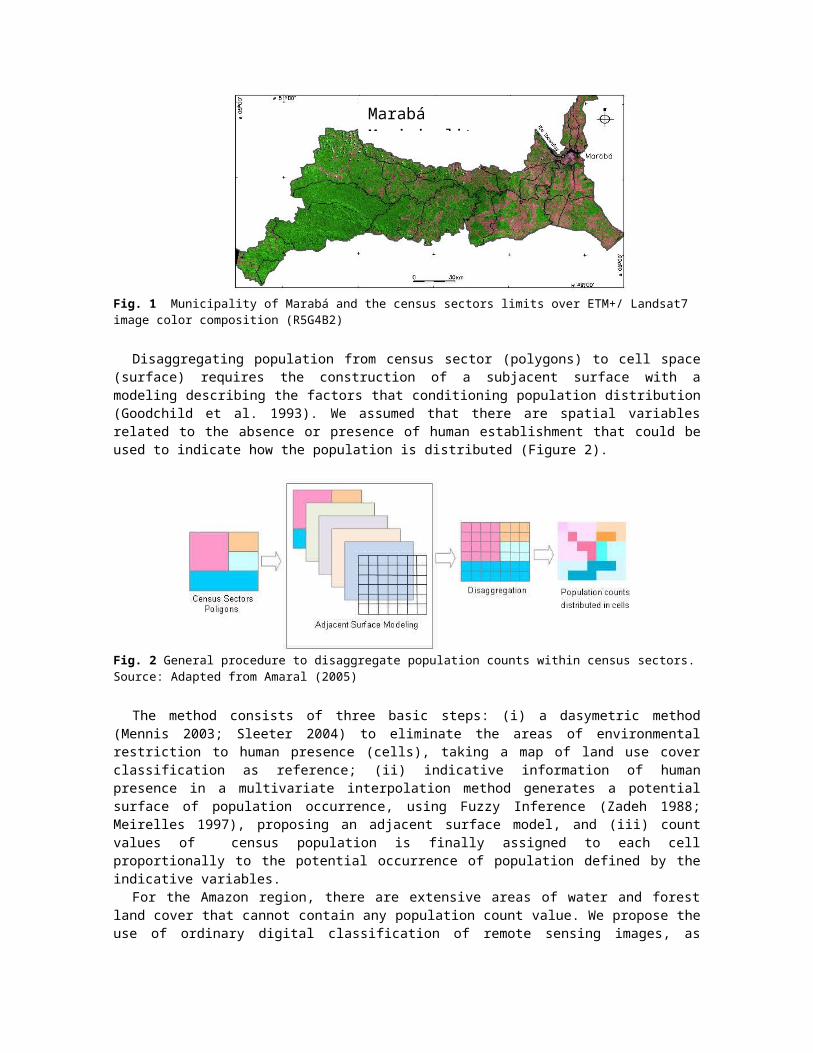
The multivariate interpolation method proposed to generate a potential surface of population occurrence can be summarized into five general steps (Figure 3): 1) selection of indicative variables; 2) identifying the relation between indicative variables and population distribution; 3) create a geographical database with indicative variables layers in a cellular spaces approach; 4) standardizing indicative variables based on Fuzzy inference, enabling continuous classification; 5) defining operations to combine indicative variables, that will finally create an adjacent model represented by a grid surface with a potential of population occurrence assigned for each cell. These steps are presented below.
Marabá Municipality
Variables x population
Empirical and literature AcessibilityLand coverLand form
Spatial references
Fuzzy Pertinence Values Quadratic Function
Relation between variables Spatial OperatorsMean ,
Weight average,Fuzzy operators,
Indicator variables layers RS & GIS
Adjacent surface Potential Population Occurrence
Indicative variables selection
Fig. 3 The multivariate interpolation method to generate the potential surface of population occurrence. Source: adapted from Amaral (2003)
1) Selecting environmental variables related to human population presence
Different factors may determine the presence of human population in a specific region, such as the historic process, the accessibility, the availability of natural resources, the presence of urban facilities and infrastructure, the local physical characteristics, among others. The relative importance of each factor is also fundamental, and may vary according to local conditions. As an example, the global population distribution model proposed by Landscan used as indicative variables: land cover classes, distance to roads, slope classes, and the presence of night time lights from DMSP/OLS sensor (Badhuri et al. 2002).
The access at the Amazon region is historically a major factor associated to the human presence. According to Machado (1999), the governmental policy in the sixties intended to integrate the territory by investing in infrastructure, basically roads and electric power. The pioneer roads attracted migratory fluxes, and promoted the foundation of villages and towns along the way. The traditional dendritic population distribution pattern along riverine communities was incremented by the “terra-firme” pattern following the road axis. In the decade of 90, the region experienced the process of urbanization and urban dispersion, with the creation of new municipalities and population concentrated in urban nuclei of about 20.000 inhabitants. As a result, urban nuclei were concentrated along rivers and roads axis.
The presence of roads is also related to the deforestation process in the Amazon. Most of detected deforestation area for 1991 to 1996 period (75%) occurred 50km far from the roads (Alves 1999). Even though deforestation rates are not directly related to total population counts or estimates, this type of land cover activity indicates the human presence.
Considering these historical factors, and data availability, five variables were initially selected as indicators of human presence to disaggregate population for Marabá municipality: distance to roads, distance to rivers, distance to urban nuclei, percentage of forest cover, and slope. The three former ones are related to accessibility and infrastructure. The percentage of forest cover is related to human activities. At last, and of minor importance, the physical variable of slope is related to the general preference of human settlements and built areas for flat terrains. The LandScan project (Dobson 2000) observed that most human settlement occurs on soft slope and flat land, and in mountainous regions, the slope measures are inversely related to population density.
2) Identifying the relation between indicative variables and population distribution
To transform each selected variable in a population indicator, the occurrence of the districts3 in the municipalities were assumed as evidence of human presence related to population. Each variable was studied specifically, seeking for the relation with the distribution of all districts seats in the Pará state. From the frequency analysis between district seats and their river distances, it was observed that 90% of the districts are located more than 17 km far from rivers, 50% are less than 3.5 km, and the mean distance is 6.81 km. (Figure 4a). For the distance to roads, 90% of the districts seats are less than 127 km far from roads and 50% less than 27.5 km (Figure 4b). The relief in Pará state is mostly flat, with slope values ranging from 0 to 7.3%. It was observed that 90% of the districts seats presented mean slope lower than 2%, and 50% of the districts presented less than 0.27% of mean slope (Figure 4c).
Fig. 4 Accumulated frequency of districts seats in Pará state relating to their distance to rivers (a), distance to roads (b), and mean slope (c)
For the distance to her urban centers, a nearest neighbor distance analysis over the district seats indicated that an average, they are 24.5 km distant of each other. Between districts seats, the shortest distance is 1.5 km and the greatest distance is 24.5 km.
For the forest percentage variable, considering the Pará state characteristics, we assumed that areas with more than 95% of forest cover are not likely to present resident population. Areas with less than 5% of forest cover has human presence associated to, and at 30% of forest cover the potential of population occurrence and absence is equivalent. These are empirical values, and had to be adjusted for each study case.
3) The geographical database and cellular space
Marabá possesses 39 census sectors, with an average area of 387.47 km2, varying from 1.17 km2 to 1955.21 km2. Sectors in the east sectors are dominated by agricultural activities, and mainly pastures. Sectors in the west still have forest cover dominance due to the conservation units (national forests and biological reserves). In order to include the heterogeneity of Marabá census sectors, the population density surface were generated using cells of 1 km x 1km. Only cells completely inside the Marabá boundary limits received population count at the density surface.
All the indicative variables and census sector population data formed a geographical database at TerraView GIS System (Terraview 2010), taking cells as unit of analysis to generate the surface density. The ideas of cellular worlds (Couclelis 1985; Couclelis 1991; Couclelis 1997) and a cellular geography (Tobler 1979) supports the theoretical debate in the geography field on representational perspectives for the geographic spaces.
The classification of ETM+/Landsat Images, WRS 224/64 (2002/08/22) and WRS 224/65 (2002/08/13), mapped the classes water and forest for Marabá with 30m of spatial resolution. Images were co-registered to census sector limits, presented a positioning error of about one pixel (30 m) and projected to UTM/SAD69 geographical reference. A simple threshold algorithm over ETM+ spectral band 4 (0.750-0.900µm, near infrared) classified the water bodies’ areas. Forest classification relied on threshold algorithm over ETM+ normalized vegetation index (NDVI) (Rouse et al. 1974), where spectral information from near infrared (band 4) and visible (band 3: 0.630 – 0.690µm) is combined ((band4 – band3)/(band4 + band3)).
3 According to IBGE (2000), districts in Brazil are administrative units of municipalities. Apart from the municipal seat, every district seat has the status of village (vila).
(a) (b) (c)

The road network vectors available in the Ecological Economic Macrozoning database (MMA/SDS 2002) were used as reference for the distance to roads variable, computed for a regular grid of 500 m spatial resolution.
Rivers limits provided by National Agency for Electrical Energy (ANEEL) was a reference to the regular grade containing the distance to rivers. The location (points) of the districts seats (IBGE 2000) were used to analyze the distance to urban centers. The grid containing slope values (percentage) was calculated directly from the altimetry data (SRTM 2000).
4) Standardizing indicative variables based on Fuzzy inference
As proposed by Turner and Openshaw (2001), Fuzzy pertinence functions (Zadeh 1988; An et al. 1991) can be useful to transform the environmental data (indicative variables) into standardized variables expressing the relations to occurrence of population.
The use of Fuzzy sets for characterization of spatial classes is indicated when dealing with ambiguity, abstraction, and ambivalence in mathematical or conceptual models of empirical phenomena (Burrough and Mcdonnell 1998). In the concept of pertinence function, given the value of an attribute “z”, the function determines whether the element evaluated belongs to a given set of analysis or not. Thus, Fuzzy pertinence functions were built from maximum, minimum and average values of each variable related to the population presence. As a first approach, we proposed applying quadratic functions for all variables. Taking the distance to roads (z) as an example, the quadratic pertinence function was obtained as:
f ( x )={ 0if z>4000 0m¿
1/(1+α (z – β )¿¿2)¿∗¿1if z ≤1000 m(1)
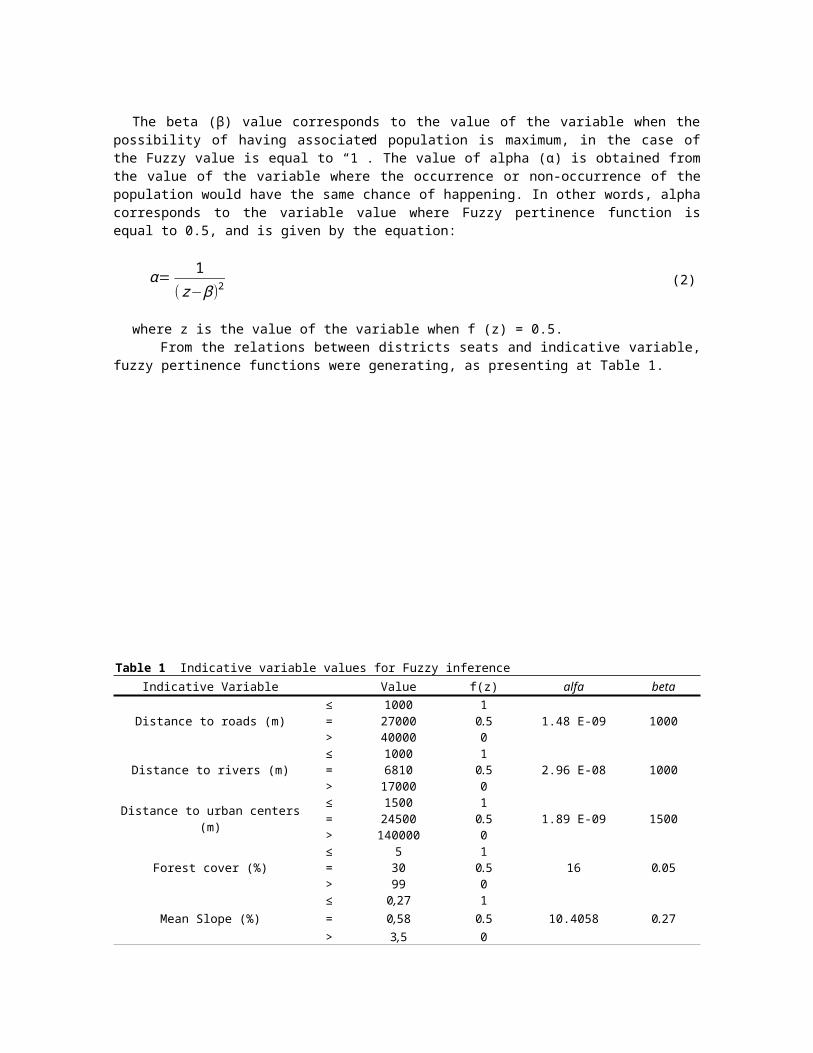
The beta (β) value corresponds to the value of the variable when the possibility of having associated population is maximum, in the case of the Fuzzy value is equal to “1”. The value of alpha (α) is obtained from the value of the variable where the occurrence or non-occurrence of the population would have the same chance of happening. In other words, alpha corresponds to the variable value where Fuzzy pertinence function is equal to 0.5, and is given by the equation:
α= 1
( z− β )2 (2)
where z is the value of the variable when f (z) = 0.5. From the relations between districts seats and indicative variable, fuzzy pertinence functions were
generating, as presenting at Table 1.
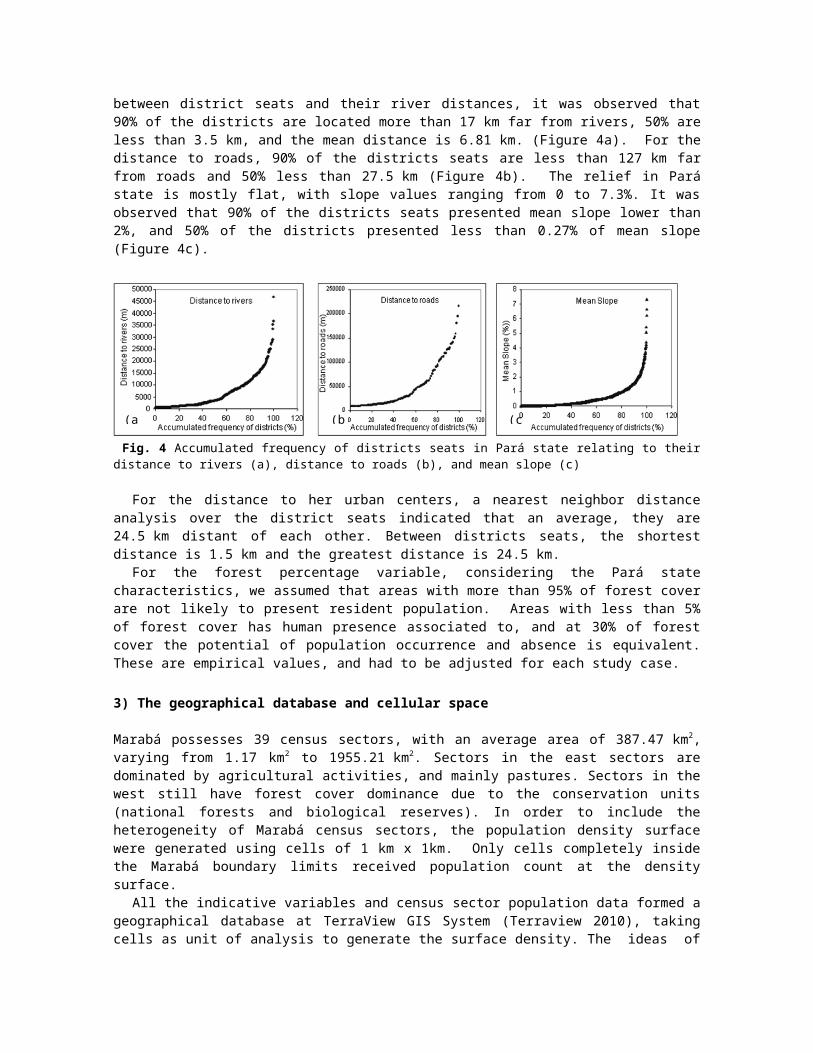
Table 1 Indicative variable values for Fuzzy inferenceIndicative Variable Value f(z) alfa beta
Distance to roads (m)≤ 1000 1
1.48 E-09 1000= 27000 0.5> 40000 0
Distance to rivers (m)≤ 1000 1
2.96 E-08 1000= 6810 0.5> 17000 0
Distance to urban centers (m)≤ 1500 1
1.89 E-09 1500= 24500 0.5> 140000 0
Forest cover (%)≤ 5 1
16 0.05= 30 0.5> 99 0
Mean Slope (%)≤ 0,27 1
10.4058 0.27= 0,58 0.5> 3,5 0
5) Combining indicative variables
Once the fuzzy pertinence function was obtained for each indicative variable, it was necessary to establish their relative importance, or the relation between variables. It is a fundamental step to model the adjacent surface containing the possibility of population occurrence. In the absence of a robust conceptual model, or a standard surface which could be used to infer the relationship between the variables, we proposed to apply: fuzzy operators (minimum, maximum, and the gamma), simple average, and weighted average. Hierarchical Analysis Procedures (Saaty 1978) provided the paired comparison of the evidences to specify weights for each indicative variable.
These operators will generate a final value related to the potential of population occurrence provided by the indicative variables interactions, for each grid cell, composing the adjacent surface model.
Finally, to disaggregate population from census sectors to cells, the total population count had to be redistributed taking only the valid cells into account. Each grid cell had a potential of population occurrence assigned from the operations between indicative variables. As census sectors are represented for several cells, the population count for each cell was distributed by:
Pgridi=PCS I
∗(Fgridi
∑i=0
j
Fgrid ) (3)
where Pgrid i is the population count to be attributed to a grid cell i ; PCSI is the population count for the
census sector I, to which the grid cell i belongs; F grid is the adjacent surface value the for the grid cell i. This value is weighted by the sum of adjacent surface values of every cell belonging to the census sector I.In the end of the procedure, the population density initially depicted by the limits of census sectors (polygonal) is presented in regular 1x1km cells, according to defined relationships between indicatives variables and population presence.
Population Density Surface for Marabá municipality
In the absence of population data distributed in a more detail spatial unity as census sector, data from resident population in the official settlement projects (PA - Projetos de Assentamentos) of the National Institute of Colonization and Agrarian Reform (INCRA – Instituto Nacional de Colonização e Reforma Agrária) (MDA 2003) were used to evaluate the density population surfaces. Population density for each PA was calculated from total of residents and the area of each PA, and compared to the density values calculated from respective population surfaces cells. Figure 5 presents the PAs limits over the original census sector representation.
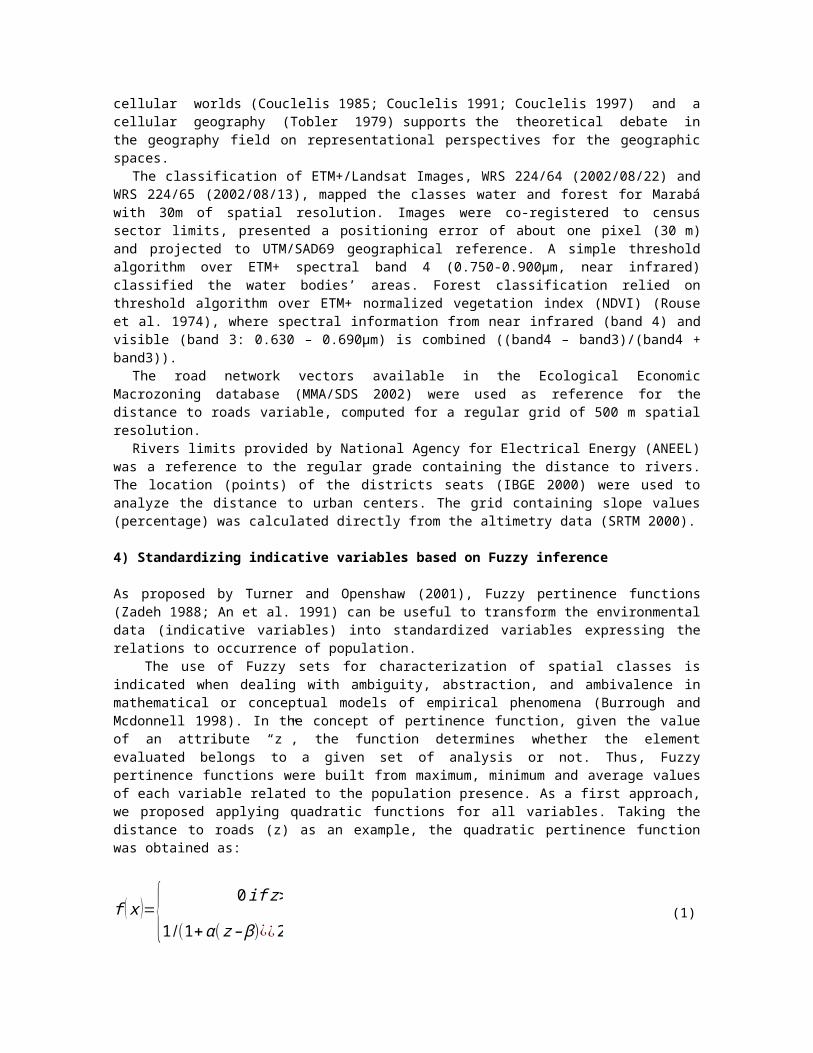
Fig 5 Original density population from IBGE - 2000 census sectors (IBGE, 2000) and INCRA Settlements Projects localization
The global accuracy, given by the percentage of area correctly classified for each surface (Table 2) indicated that fuzzy gamma operator presented better performance (18.8%). However, this global accuracy was related to correspondence values observed for the lower population density range (0,00-0,05 inhab/km 2) and highest population density range registered for the PAs (6,54 - 65,00 inhab/km2).
Table 2 Global Accuracy (%) for the comparison between the population density surfaces and the resident population data from INCRA settlement projectsPopulation density surface Global Accuracy (%)Average 14.3Weighted average 10.4Minimum Fuzzy 10.4Maximal Fuzzy 9.5Gamma Fuzzy 18.8Census sectors 11.8
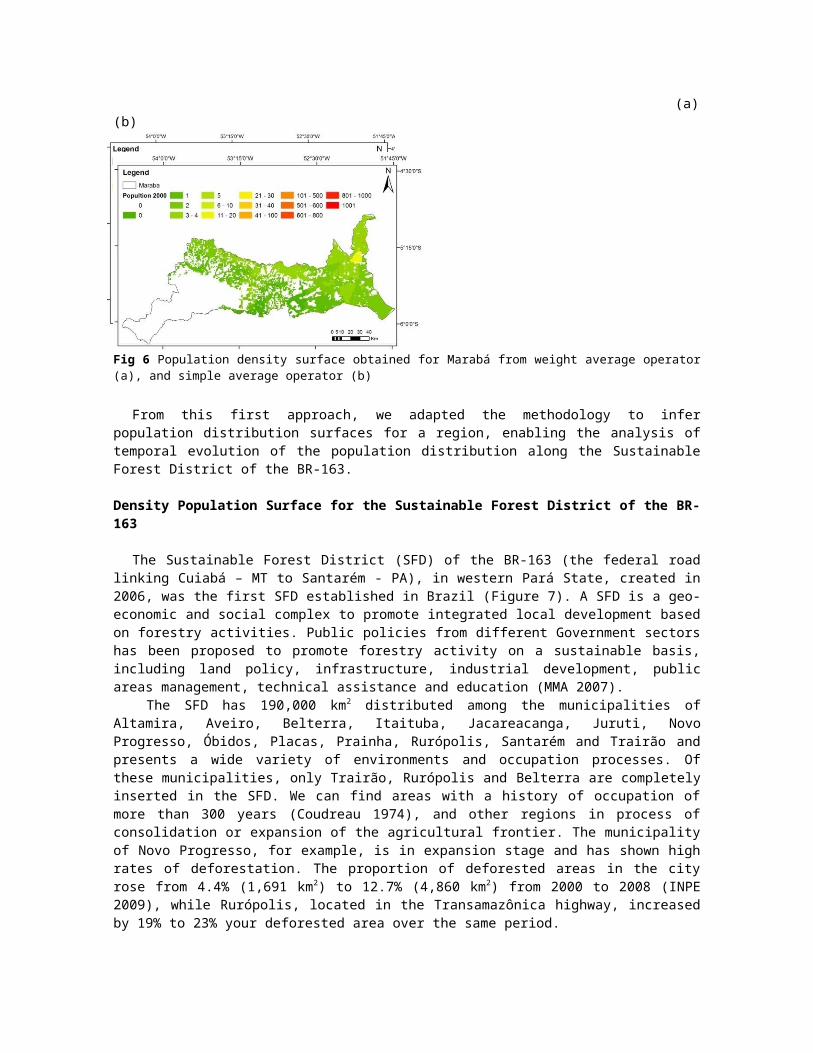
The global accuracy for the surface density obtained from simple average operator (14.3%) was related to intermediate population density ranges, and was superior to the global accuracy obtained for the population density provided for the original census sector representation (Figure 6a). From the visual analysis, the simple average operator also provided the best population distribution for entire Marabá municipality, presenting more heterogeneity than weighted average surface (Figure 6b) and the other fuzzy operators. The weighted average operator did not consider properly the importance of forest cover. Fuzzy Operators Minimum and Gamma were sensitive to the presence of zeros. Maximum Fuzzy operator incorporated little variability to the census sectors generating a density surface slightly differing from the original census sector polygonal representation.
(a) (b)
Fig 6 Population density surface obtained for Marabá from weight average operator (a), and simple average operator (b)
From this first approach, we adapted the methodology to infer population distribution surfaces for a region, enabling the analysis of temporal evolution of the population distribution along the Sustainable Forest District of the BR-163.
Density Population Surface for the Sustainable Forest District of the BR-163
The Sustainable Forest District (SFD) of the BR-163 (the federal road linking Cuiabá – MT to Santarém - PA), in western Pará State, created in 2006, was the first SFD established in Brazil (Figure 7). A SFD is a geo-economic and social complex to promote integrated local development based on forestry activities. Public policies from different Government sectors has been proposed to promote forestry activity on a sustainable basis, including land policy, infrastructure, industrial development, public areas management, technical assistance and education (MMA 2007).
The SFD has 190,000 km2 distributed among the municipalities of Altamira, Aveiro, Belterra, Itaituba, Jacareacanga, Juruti, Novo Progresso, Óbidos, Placas, Prainha, Rurópolis, Santarém and Trairão and presents a wide variety of environments and occupation processes. Of these municipalities, only Trairão, Rurópolis and Belterra are completely inserted in the SFD. We can find areas with a history of occupation of more than 300 years (Coudreau 1974), and other regions in process of consolidation or expansion of the agricultural frontier. The municipality of Novo Progresso, for example, is in expansion stage and has shown high rates of deforestation. The proportion of deforested areas in the city rose from 4.4% (1,691 km2) to 12.7% (4,860 km2) from 2000 to 2008 (INPE 2009), while Rurópolis, located in the Transamazônica highway, increased by 19% to 23% your deforested area over the same period.
In recent decades, the municipalities of the SFD-BR163 suffered significant increase in their populations accompanied by a dismemberment process, and the creation of new municipalities. Figure 1 shows the political division of the municipalities that constitutes the SFD and its census sectors (IBGE 2010). In 1980, the SFD region was composed by the municipalities of Altamira, Aveiro, Itaituba, Santarém, Prainha, Óbidos and Juruti. In the 1991 Census, IBGE register Rurópolis as a new municipality, and in 2000, the municipalities of Belterra, Jacareacanga, Novo Progresso, Placas and Trairão. Half of the municipalities in SFD was created during the 1990s. Novo Progresso showed a decrease in its population at this decade, pointing a different relationship from the general trend: the increase of population and deforestation rates as a directly proportional phenomenon.
In this context, the recent demographic dynamic of municipalities in agricultural frontier areas is expressed as an evidence of the occupation processes, demonstrating, among other things, the ability to fix population. Studies that aim to capture the implications of land use change in agricultural frontier areas should also focus on changes in the demographic structure composition. This theme assumes greater relevance in the Amazon region due to the close relationship between the urban development dynamics, land concentration processes, and evasion of rural populations.
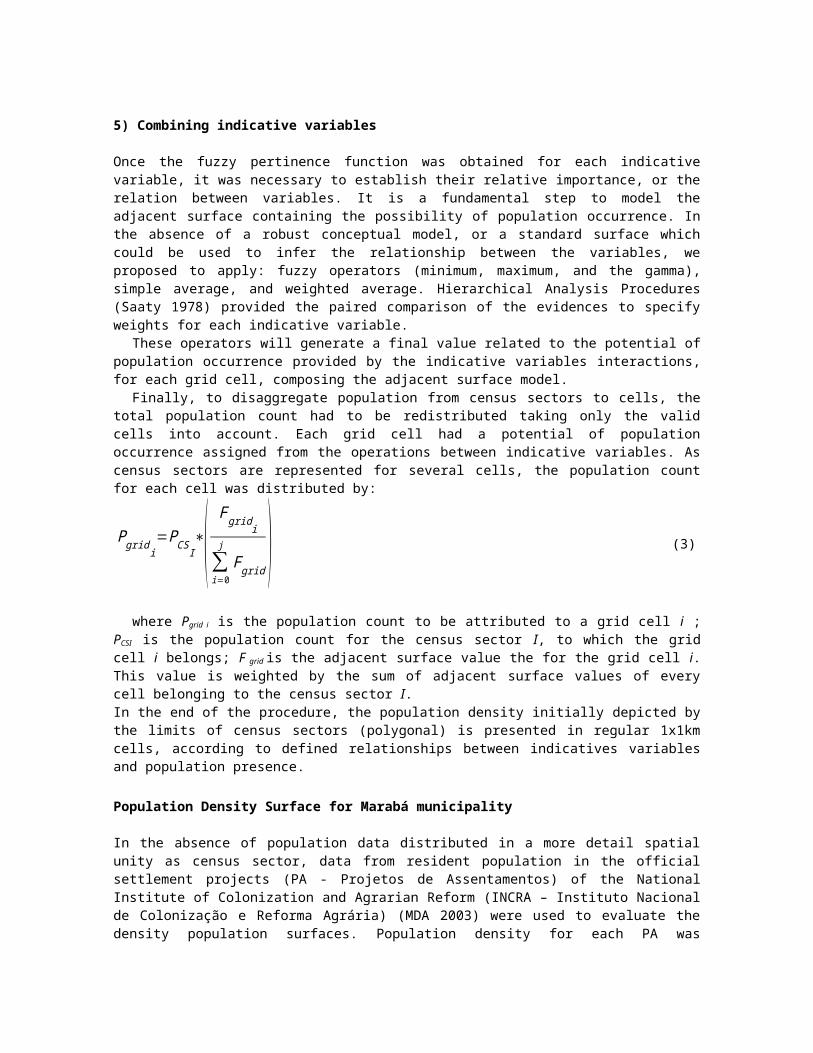
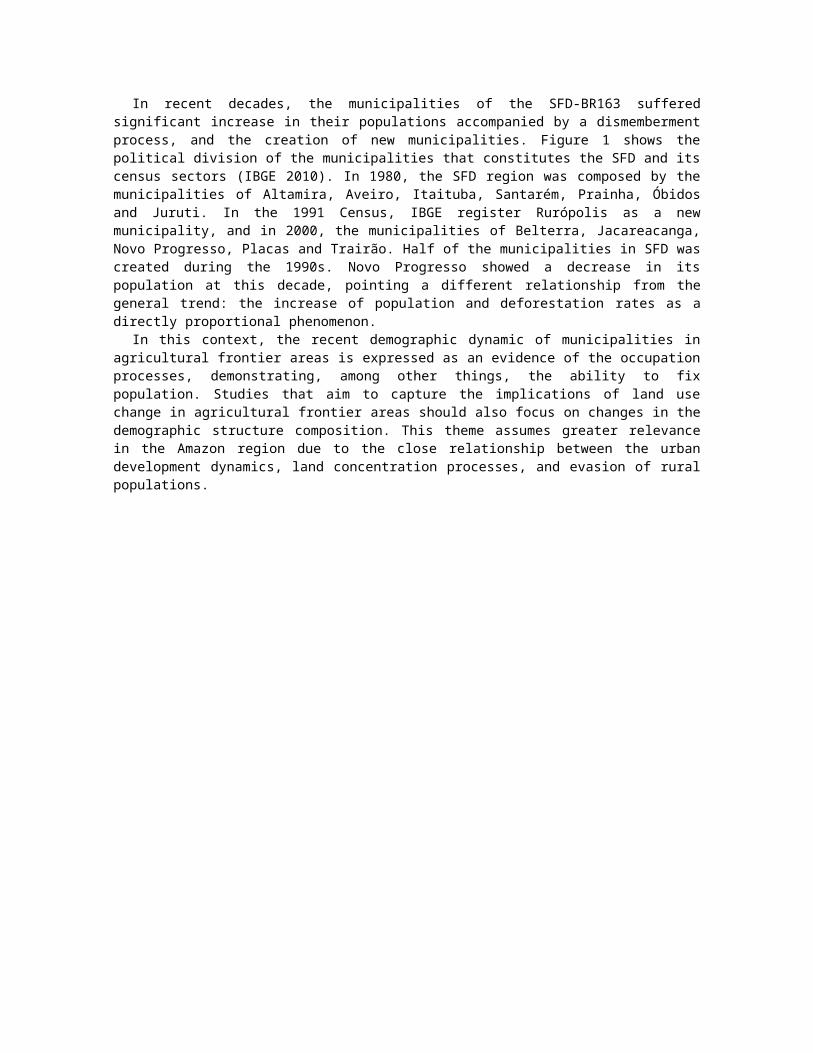
Fig. 7 Localization of the Sustainable Forest District/BR-163 in Pará state (Source: MMA, 2007) and the municipalities divided by rural census sectors (IBGE, 2010)
On the bases of the literature concerning to the occupation of the SFD region (Amaral 2003; Becker 2004; Furtado, 2004; Pandolfo 1994), the variables distance to roads, distance to rivers, distance to urban centers, forest cover and distance to hillside were selected as indicative variables to generate a potential surface of population occurrence. To evaluate the relationship between each of the selected indicative variables with population values, every community from SFD were studied, taking cells of 2x2 km as unit of analysis. Table 3 presents the data utilized.
Table 3 Data SourcesData Source YearDeforestation Prodes (TM/Landsat 5) / INPE 2009
Communities Brazilian Institute of Environment and Renewable Natural Resources – IBAMA and Field Work 2010
Roads Brazilian Institute of Geography and Statistics - IBGE 2007Rives Brazilian National Agency of Water – ANA 2007Geomorphology NASA/SRTM 2000Population Brazilian Institute of Geography and Statistics - IBGE 2000 and 2007
Indicative variables and population distribution for SFD-BR163
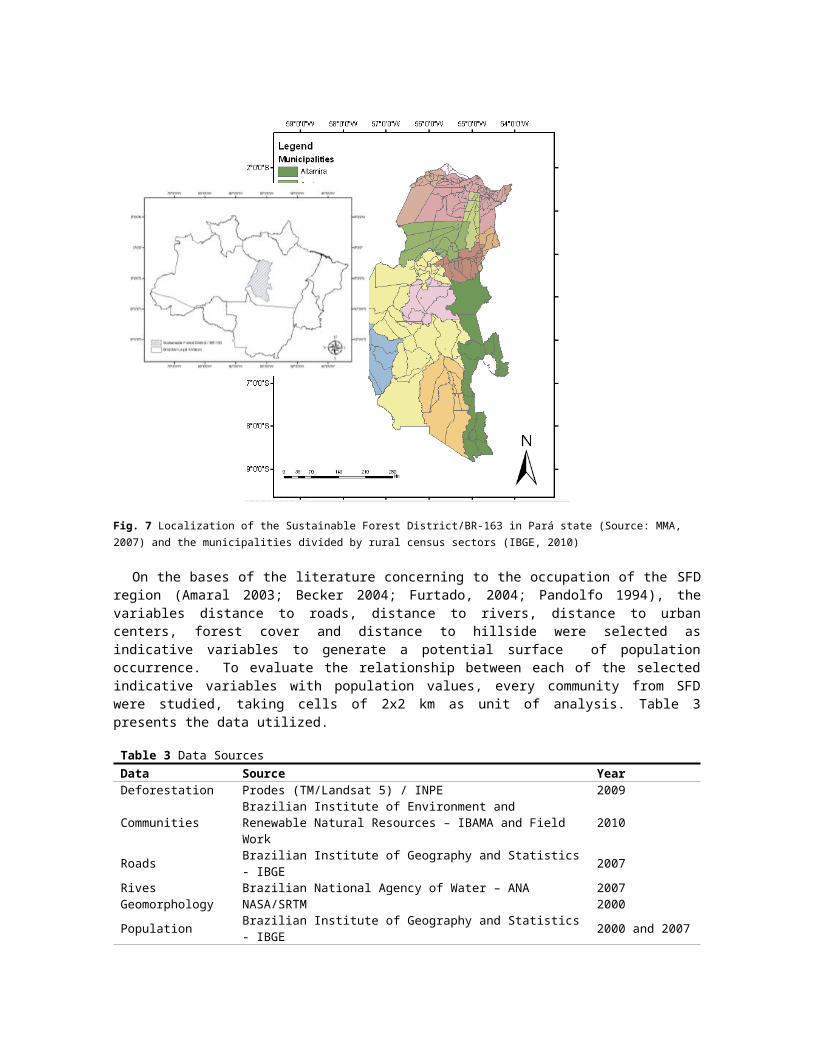
The frequency distribution of distance to rivers (Figure 8) indicated that 90% of the communities are more than 30 km distant to rivers, 50% of them are less than 7.68 km, and the average distance is 9.7 km.

Fig. 8 Average distance to rivers for the influence areas of the communities (accumulated frequency, histogram and spatial distribution)
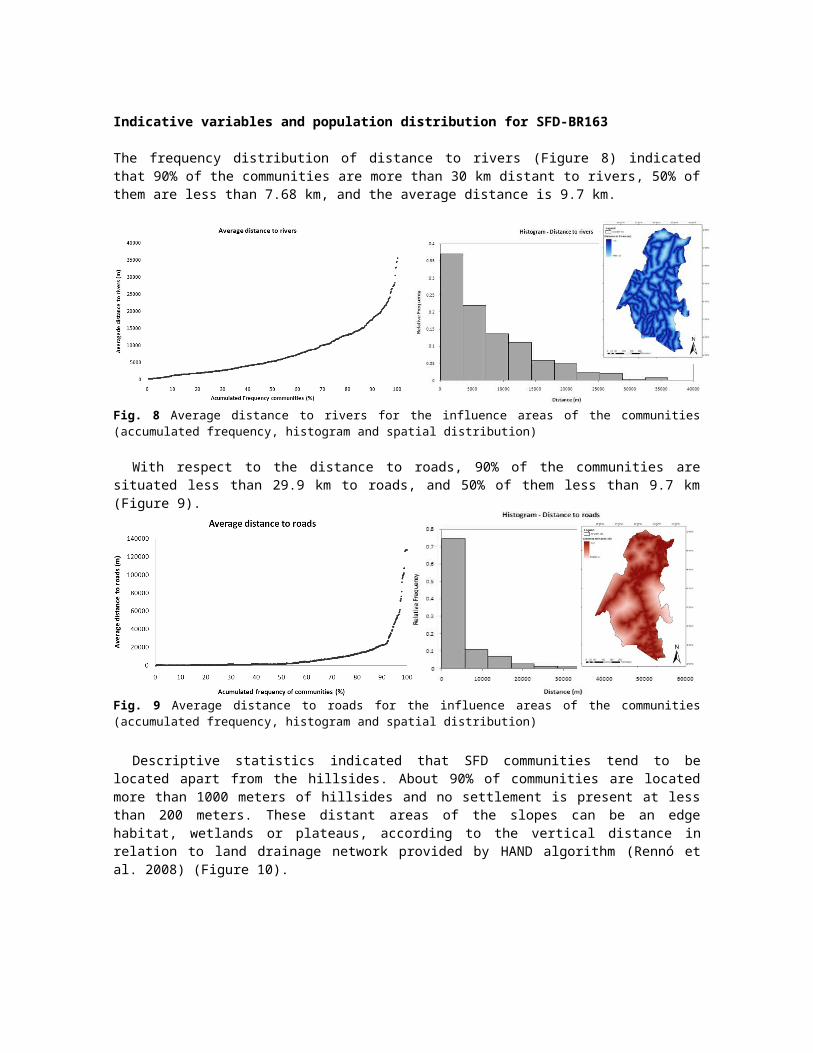
With respect to the distance to roads, 90% of the communities are situated less than 29.9 km to roads, and 50% of them less than 9.7 km (Figure 9).
Fig. 9 Average distance to roads for the influence areas of the communities (accumulated frequency, histogram and spatial distribution)
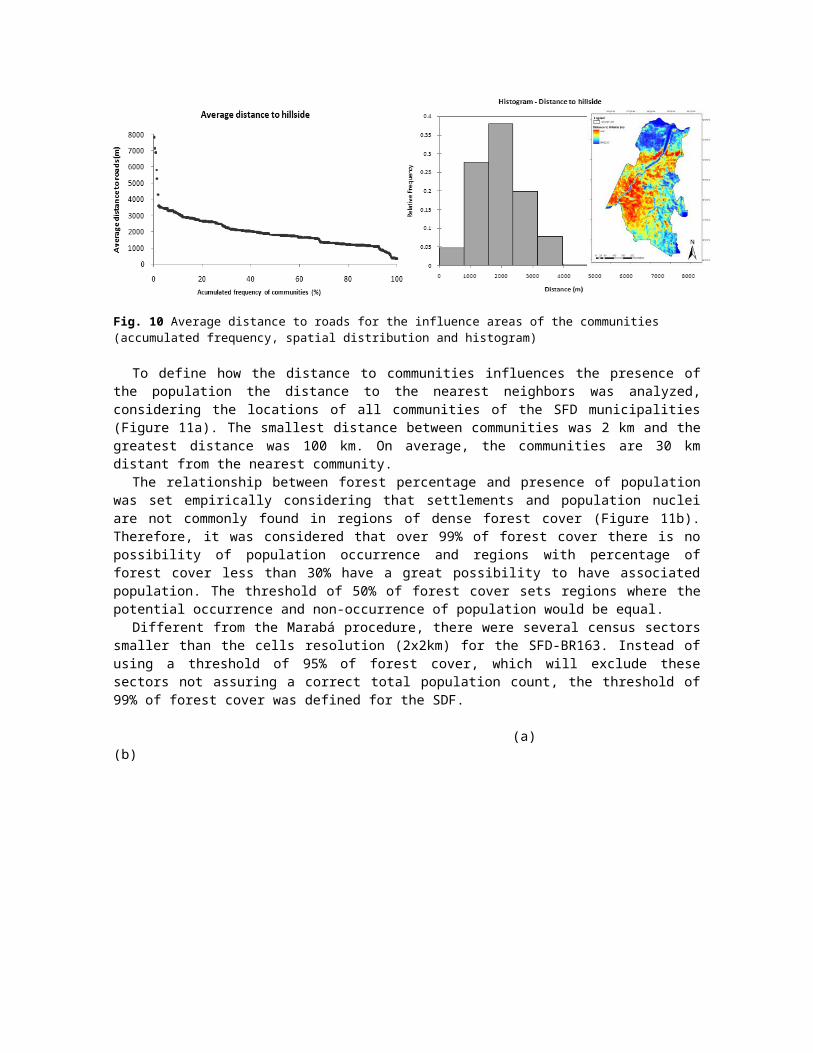
Descriptive statistics indicated that SFD communities tend to be located apart from the hillsides. About 90% of communities are located more than 1000 meters of hillsides and no settlement is present at less than 200 meters. These distant areas of the slopes can be an edge habitat, wetlands or plateaus, according to the vertical distance in relation to land drainage network provided by HAND algorithm (Rennó et al. 2008) (Figure 10).
Fig. 10 Average distance to roads for the influence areas of the communities (accumulated frequency, spatial distribution and histogram)
To define how the distance to communities influences the presence of the population the distance to the nearest neighbors was analyzed, considering the locations of all communities of the SFD municipalities

(Figure 11a). The smallest distance between communities was 2 km and the greatest distance was 100 km. On average, the communities are 30 km distant from the nearest community.
The relationship between forest percentage and presence of population was set empirically considering that settlements and population nuclei are not commonly found in regions of dense forest cover (Figure 11b). Therefore, it was considered that over 99% of forest cover there is no possibility of population occurrence and regions with percentage of forest cover less than 30% have a great possibility to have associated population. The threshold of 50% of forest cover sets regions where the potential occurrence and non-occurrence of population would be equal.
Different from the Marabá procedure, there were several census sectors smaller than the cells resolution (2x2km) for the SFD-BR163. Instead of using a threshold of 95% of forest cover, which will exclude these sectors not assuring a correct total population count, the threshold of 99% of forest cover was defined for the SDF.
(a) (b)
Fig. 11 Spatial distribution of average distance to communities (a) and forest percentage (b)
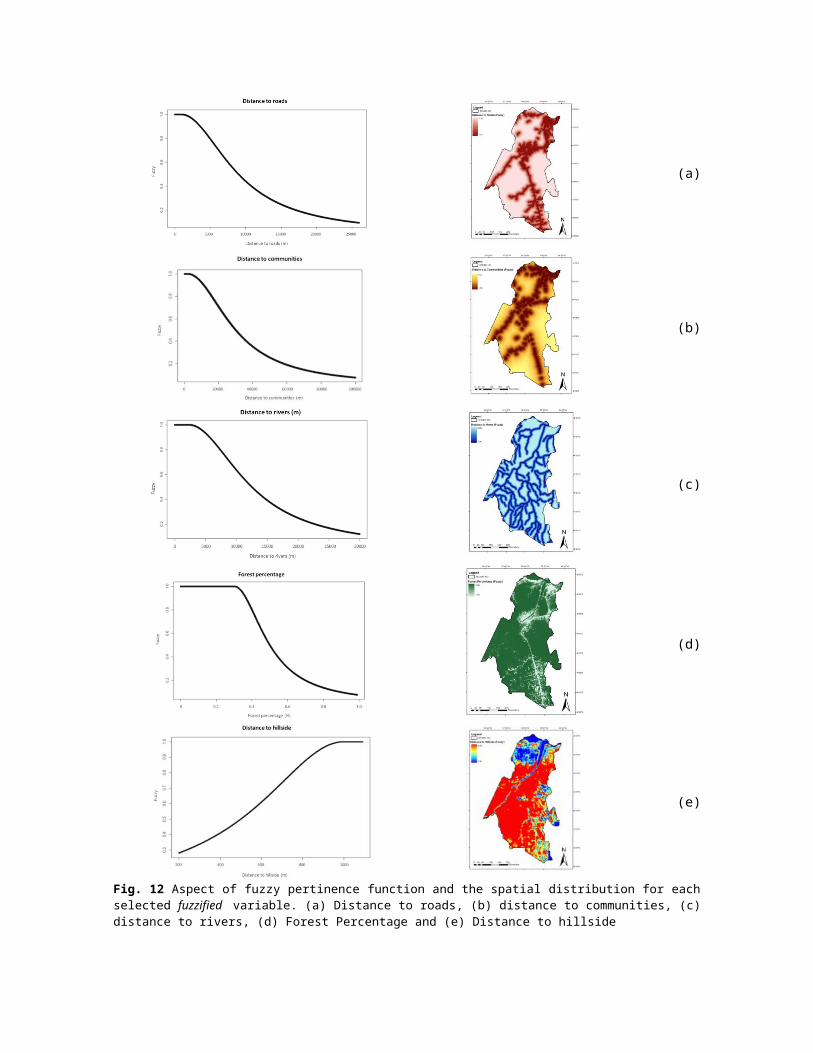
The summary of maximum, minimum and average values correlating the variables with the presence of population is presented in Table 4. These values were used to build Fuzzy pertinence functions and the spatial distribution for each selected fuzzified variables (Figure 12).
Table 4 Indicative variable values for Fuzzy inferenceVariable value f(z) alfa beta
Distance to roads≤ 900 1
1.98E-08 900= 9702 0.5> 29900 0
Distance to communities≤ 2000 1
1.28E-09 2000= 30000 0.5> 100000 0
Distance to rivers≤ 900 1
5.95E-08 900= 7686 0.5> 30300 0
Forest Percentage≤ 0.3 1
2.50E+01 0.3= 0.5 0.5> 0.99 0
Distance to hillside≥ 1000 1
4.00E-06 1000= 500 0.5> 200 0
(a)
(b)
(c)
(d)
(e)
Fig. 12 Aspect of fuzzy pertinence function and the spatial distribution for each selected fuzzified variable. (a) Distance to roads, (b) distance to communities, (c) distance to rivers, (d) Forest Percentage and (e) Distance to hillside
The evolution of spatial distribution of population on SFD-BR163
The spatial distribution of population for SFD-BR163, represented by population density surfaces for 2000 and 2007 is presented in Figure 13.
(a) (b)
Fig. 13 Spatial distribution of population on SFD-BR163 for 2000 (a) and 2007 (b)
To assess the accuracy of surface distribution of population a fieldwork was held in October 2010, where the location of 98 communities in the study area was checked out (Figure 14). Population data from 19 communities was collected (Table 5) by interviewing residents, association leaders, community health agents, and employees of the educational system. The Weighted Average of the variables presented the closest result with reality, when compared with Maximum Fuzzy, Minimum Fuzzy, Gama Fuzzy and Simple Average. The mean difference between the predicted and the declared population were of 10%, what is a good result considering that the surface was produced for 2007 Population Counting, and in the fieldwork, population values were declared and not estimated by survey.
Table 5 shows the evolution of total population in the municipalities of the region of BR-163 highway between 2000 and 2007, and the population growth considering exclusively the population values for the cells inside the limit of SFD-BR163. In 2000, the population of the municipalities, considering only the population count for cells that are inside SFD-BR163 limits was 476,656 inhabitants, and it reached the value of 532,457 inhabitants in 2007. It represents an accumulated increase rate of 11.7% at the period. Considering that the environmental conditions, represented by the indicative variables, influenced the population distribution in the same way for 2000 and 2007, the population distribution scattered all over the territory of SFD-BR163. Instead of just the intensification of previously occupied areas, the distribution pattern changed.
There was some concentration of inhabitants in the north part, along the Amazonas River and in the vicinity of Santarém. However, the concentration of population along the axis Rurópolis -Itaituba-Trairão, following Transamazônica and BR-163 highways in 2000, was substituted by larger areas of classes with low population density. This can be associated to the population decrease observed for Trairão.
Table 4 Comparison between total population from fieldwork (2010) and estimated from the population density surface
(2007)Community Declared Population 2010 Interpolated population 2007129 do Bode 413 342São Jorge 3000 2111Galiléia 200 124Divinópolis 3000 2464Itapacuru 50 27Itacimpasa 800 733Nova Canaã 225 255Nova Esperança 800 936Bela Vista do Caracol 9000 8897Jamanxim 3500 2990Moraes Almeida 3000 2989Alvorada 5000 4852Água Azul 800 832Santa Júlia 800 640Três Bueiros 750 697Riozinho 600 521Santa Luzia 240 198Aruri 200 163Tucunaré 70 45
The effect of conservation units’ presence in the SFD is evident when comparing the population surfaces. In the southern SFD, in the municipality of Altamira, the population started to occupy the east side of BR-163 highway, while in the west side, the population in Novo Progresso decreased. Among other potential factors, in the west side there is the Jamanxim National Forest, which prevented the human occupation. Most of areas without population correspond to a conservation unit of restrict use, as National Parks or Ecological Station, and the areas where the population distribution spread out or was intensified during the analyses period referred to public land without destination or conservation units that allow sustainable use (as Environmental Protection Areas).
Fig.14 Communities verified during fieldwork
Table 5 Total resident population for municipalities of SFD-BR163 for 2000 (IBGE Demographic Census, 2000), and
2007 (IBGE- Population Count, 2007), and the results from density surfaces for those cells of municipalities contained in SFD-BR163 physical limits.
Locality Municipality2000
Municipality2007
Cells insideSFD-BR163
2000
Cells insideSFD-BR163
2007
Cells insideSDF/BR-163 2007-2000 %
Brazil 169799170 183987291 8.36Pará State 6192307 7065573 14.10Altamira 77439 92105 3286 5548 2263 68.87Aveiro 15518 1883 11954 17238 5283 44.19Belterra 14594 12707 14573 12707 -1866 -12.80Itaituba 94750 118194 95653 117450 21797 22.79Jacareacanga 24024 37073 12919 19515 6596 51.06Juruti 31198 33775 28980 33909 4928 17.00Novo Progresso 24948 21598 24666 21583 -3083 -12.50Óbidos 46490 46793 2919 1291 -1628 39.28Placas 13394 17898 5170 7200 2031 88.11Prainha 27301 26436 1404 2640 1237 26.68Rurópolis 24660 32950 26011 32950 6939 4.00Santarém 262538 274285 233057 242380 9322 14.04Trairão 14042 16097 14064 16039 1975 -55.77SFD TOTAL 565907 641737 476656 532457 55802 11.71
With respect to municipal dynamics, every municipality had increased their resident population, except for
Aveiro, Belterra, and Novo Progresso. Aveiro has most of the municipal area inside of some conservation unit. From the fieldwork, the local government explained that they do not have the legal land tenure for rural and also for urban areas, what restricts their production activities, as agriculture or pasture, and even the possibility to build a hospital, and other urban equipments.
Belterra suffered a land concentration process when soybean producers discovered the Santareno Plateau. Small producers sold their properties for grain production, and migrated to urban areas (Coelho 2008). In the population density maps, it is expressed by the intensification of residents in the city of Belterra and disappearance of denser areas closer to this city.
Novo Progresso received an intense immigration flux in the 2000s (Figure 15). Men at working age (between 20 to 40 years old) went to Novo Progresso to work with timber in the numerous sawmills installed in the city. With the intensification of the combat against deforestation and illegal timber practices, in 2007 the population of this city suffered a reduction of about 3000 inhabitants, mostly men, as indicated by the demographic pyramid.
(a) (b)
Fig.15 Age pyramids for Novo Progresso in 2000(a) and 2007 (b). Source: IBGE (2000) and IBGE (2007)
Conclusions
This paper proposed a methodology to desegregate population data provided in the limits of census sectors in smaller spatial units, based on ancillary environmental data and geoinformation techniques. The results showed that it is possible to recover the heterogeneity of the census sectors, whenever the relations between the indicator variables and population occurrence are defined with criteria, and the local particularities are taken into account. The methodology developed for the municipality of Marabá was adapted to the Sustainable Forest District of BR-163 municipalities. As the area of interest was expanded, the cell size was enlarged, and the pattern of population distribution was obtained from the presence of communities. Data from fieldwork expedition indicated an adequate fit between the population count predicted from the population surface and the total population informed for the communities along BR-163 highway.
The population density surfaces enabled to interpret the distribution of human presence considering the territory to be potentially occupied. There is no population allocated in areas where there is no possibility of human presence, as in rivers, dense forests cover, sand islands, and so forth. Moreover, representing population in cell spaces enables to monitor the population over the time. Even if the limits of municipalities or census sectors change, what is very common in dynamic regions as Amazonia, the distribution can be represented and compared in a cell space.
The evolution of the resident population over the DFS/BR-163 territory from 2000 to 2007 showed spatial patterns compatible to the occupation process described in the literature and reported in the field. Therefore, since the proposed methodology can be adapted to represent the population distribution of other areas, population density surfaces can be useful as additional data source to study population and territory dynamics.
The proposed methodology can be improved depending on the knowledge about the spatial indicative variables and human presence relationships. With population data from 2010 census we will be able to represent the population density evolution for a ten years period, and better monitor the impacts of the creation of a sustainable forest district over the population distribution in the region of BR-163 highway influence.
AcknowledgementsThis work was partially support by INPE – National Institute for Space Research, Scenarios Project
(Cenários para a Amazônia: uso da terra, biodiversidade e clima), and LUA/IAM Project - Land Use Change in Amazonia: Institutional Analysis and Modeling at multiple temporal and spatial scales.
References
Alves, D. An analysis of the geographical patterns of deforestation in Brazilian Amazônia in the 1991-1996 period. (1999). Proceedings of 48th Annual Conference of the Center for Latin American Studies - Patterns and Processes of Land Use and Forest Change in the Amazon,. University of Florida, Gainesville.
Amaral, S. (2003). Geoinformação para estudos demográficos: Representação Espacial de Dados de População na Amazônia Brasileira. Phd Thesis. Escola Politécnica da USP, São Paulo.
Amaral, S., Monteiro, A. M. V., Câmara, G., Quintanilha, J. A. (2005). Estimativa da distribuição espacial da população na Amazônia brasileira com o uso de sensoriamento remoto orbital: contribuições das imagens CCD/CBERS no caso do Município de Marabá-PA. Proceedings of Simpósio Brasileiro de Sensoriamento Remoto. Goiânia. Available at: http://urlib.net/ltid.inpe.br/sbsr/2004/11.20.16.29 . Accessed March 2010.
An, P., Moon, W. M., Rencz, A. (1991). Application of fuzzy set theory for integration of geological, geophysical and remote sensing data. Canadian Journal of Exploration Geophysics, 27 (1), 1 - 11.
Becker, B. K. (2004). Amazônia - Geopolítica na Virada do III Milênio. Rio de Janeiro: Editora Garamond.
Bhaduri, B., Bright, E., Coleman, P., Dobson, J. E. (2002). LandScan Locating people is what matters. GeoInformatics, 5(2), 34-37.
Burrough, P. A., McDonnell, R. A. (1998). Principles of Geographic information systems. Oxford: University Press.
Coelho, A. (2008). Modelagem de dinâmica do uso da terra e cobertura vegetal em área de expansão de grãos na região oeste do Pará. Master thesis, Universidade Federal do Pará.
Couclelis, H. (1985). Cellular Worlds: A Framework for Modelling Micro-Macro Dynamics. Environment and Planning A, 17(1), 585-596.

Couclelis, H. (1991). Requirements for planning-relevant GIS: a spatial perspective. Papers in Regional Science, 70(1), 9-19.
Couclelis, H. (1997). From cellular automata to urban models: new principles for model development and implementation. Environment and Planning B, 24(1),165-174.
Coudreau, H. (1977). Viagem ao Tapajós. São Paulo: Editora da Universidade de São Paulo. De Reynal, V., Hebette, J., Muchagata, M. G., Topall, O. (1995). Agriculturas familiares e
desenvolvimento em frente pioneiro amazônica, LASATCAT/GRET/UAG.Dobson, J. E., Bright, E. A., Coleman, P. R., Duree, R. C., Worley, B. A. (2000). LandScan: A Global
Population Database for Estimating Populations at Risk. Photogrammetric Engineering and Remote Sensing, 66(7), 849-857.
Ehrlich, P. R. (1968). The population bomb. New York: Ballantine Books.Frohn, R. C., Mcgwire, K. C., Dales, V. H., Estes, J.E. (1996). Using satellite remote sensing to
evaluate a socio-economic and ecological model of deforestation in Rondonia, Brazil. International Journal of Remote Sensing, 17(16), 3233 - 3255.
Furtado, C. (2004). Formação econômica do Brasil. São Paulo: Companhia das Letras.Goodchild, M. F., Anselin, L., Deichmann, U. (1993). A framework for the areal interpolation of
socioeconomic data. Environment and Planning A, 25(3), 383-397.Hogan, D. J. (1989). População e Meio Ambiente. Textos NEPO 16. Campinas, Núcleo de Estudos
Populacionais – NEPO, Unicamp.Hogan, D. J. (2000). A relação entre população e ambiente: desafios para a demografia. In H.
Torres & H. Costa (Eds.), População e Meio Ambiente. Debates e Desafios. São Paulo: Editora SENAC, p. 21-52.
IBGE. Instituto Brasileiro de Geografia e Estatística. (2000). Ministério do Planejamento, Orçamento e Gestão, Brasil.
IBGE. Instituto Brasileiro de Geografia e Estatística. (2010). Ministério do Planejamento, Orçamento e Gestão, Brasil.
INPE. Instituto Nacional de Pesquisas Espaciais. (2009). Monitoramento da floresta amazônica por satellite - Projeto PRODES. Available at http://www.obt.inpe.br/prodes/r2009.htm. Accessed January 2010.
Machado, L. O. (1999) Urbanização e Mercado de trabalho na Amazônia Brasileira. Cadernos IPPUR. Rio de Janeiro, 13(1), 109-138.
Mccracken, S., Brondízio, E., Nelson, D., Moran, E. F., Siqueira, A., Rodriguez-Pedraza, C. (1999). Remote sensing and GIS at farm property level: demography and deforestation in the Brazilian Amazon. Photogrammetric Engineering and Remote Sensing, 65(11), 1311-1320.
Mccracken, S., Siqueira, A.D., Moran, E. F., Brondízio, E. S. (2002). Land Use Patterns on an Agricultural Frontier in Brazil. Insights and Examples from a Demographic Perspective. In C. H. Wood & R. Porro. Deforestation and Land Use in the Amazon (pp. 162-217). Gainsville, Florida: University of Florida Press.
McMichael, A. J. (1993). Planetary overload: Global environmental change and the health of the human species. Cambridge, Cambridge University Press.
MDA. (2003). Ministério do desenvolvimento agrário; INCRA, Instituto Nacional de colonização e reforma agrária; SR(27), Superintendência Regional do sul do Pará. Projetos de Assentamentos, Gerência Operacional de Sistemas (GSO) - Web e SIPRA 4.0. Marabá.
Meirelles, M. S. P. M. (1997). Análise integrada do ambiente através de geoprocessamento: uma proposta metodológica para elaboração de zoneamentos. Phd Thesis. UFRJ, Rio de Janeiro.
Mennis, J. Generating Surface Models of Population Using Dasymetric Mapping. 2003. The Professional Geographer, 55(1), 31-42.
MMA. Ministério do Meio Ambiente. (2006). Plano de Ação 2006-2007: Grupo de trabalho interinstitucional do Distrito Florestal Sustentável da BR-163. Brasília.
MMA/SDS. Ministério do meio ambiente / Secretaria de Desenvolvimento sustentável. Projeto Cenários para a Amazônia Legal: Sistema de Consulta. (2002). Sistematização e Atualização de Informações. Brasília/DF, Consórcio ZEE-Brasil – Cdrom.
Moran, E. F., Brondízio, E., Mausel, P., Wu, Y. (1994). Integrating Amazonian vegetation, land use, and satellite data. Bioscience, 44(5), 329-338.
Moran, E. F., Brondízio, E. (1998). Land-use change after deforestation in Amazonia. In D. Liverman, E. F. Moran, R. Rindfuss, P. C. Stern (Eds.), People and Pixel. Linking Remote Sensing and Social Science (pp. 94-120). Washington, D.C.: National Academy Press,
Moran, E. F., Siqueira, A., Brondízio, E. Household Demographic Structure and it´s Relationship to the Amazon Basin. (2003). In J. Fox, V. Mishra, R. Rindfuss, S. Walsh. People and Environment: Approaches to Linking Household and Community Surveys to Remote Sensing
and GIS (pp. 1- 30). Boston: Kluwer Academic Press. Available at: http://www.springerlink.com/content/h578w04n9w1472u4/fulltext.pdf . Accessed October 2010.
Oliveira, M. C. C., Silva, W. R., Santos, W. A. (2001). Estudo sobre o processo de migração de agricultores familiares na área rural da região de Marabá. LASAT - Laboratório Sócio-Agronômico do Tocantins.
Pandolfo, C. (1994). Amazônia brasileira: ocupação, desenvolvimento e perspectivas atuais e futuras. Belém: CEJUP.
Rennó, C. D., Nobre, A. D., Cuartas, L. A., Soares, J. V., Hodnett, M. G., Tomasella, J., Waterloo, M. J. (2008). HAND, a new terrain descriptor using SRTM-DEM: Mapping terra-firme rainforest environments in Amazonia. Remote Sensing of Environment, v. 112(9), 3469-3481.
Rouse, J.W., Haas, R. H., Schell, J. A., Deering, D.W. (1974). Monitoring Vegetation Systems in the Great Plains with ERTS. Proceedings of Third Earth Resources Technology Satellite-1 Symposium,1974, NASA SP-351, 3010-3017.
Saaty, T. L. (1978). Exploring the interface between hierarchies, multiple objectives and fuzzy sets. Fuzzy sets and systems, 1(1), 57-68.
Sleeter, R. (2004). Dasymetric mapping techniques for the San Francisco Bay region, California: Urban and Regional Information Systems Association. Urban and Regional Information Systems Association, Annual Conference Proceedings, Reno, USA.
SRTM. (2000). Shuttle Radar Topography Mission. United States Geological Survey.Terraview. (2010). Available at http://www.dpi.inpe.br/terraview. Acessed November 2010.Tobler, W. (1979). Cellular Geography. In Gale S. & Olsson G. (Eds.), Philosophy in Geography, Reidel, Dordrecht, 379-
386.Turner, A., Openshaw, S. (2001). Disaggregative Spatial Interpolation. GISRUK Proceedings.
Glamorgan Wales.Wood, C. H., Skole, D. (1998). Linking Satellite, Census, and Survey Data to Study Deforestation
in the Brazilian Amazon. In D. Liverman, E. F. Moran, R. Rindfuss, P. C. Stern (Eds.), People and Pixel: Linking Remote Sensing and Social Science (pp. 70-93). Washington, D.C, National Academy Press.
Zadeh, L. A. (1988). Fuzzy Logic. Computer, 21(4), 83-92.