from ‘made in china’ to ‘sold in china’: the rise of the...
TRANSCRIPT
�
McKinsey Global Institute
From ‘Made in China’ to ‘Sold in China’: The rise of the Chinese urban consumer
November 2006
EXECUTIVE SUMMARY

�
9
Executive summaryEver since China’s process of liberalization began in the �980s, business execu-
tives around the world have dreamed of serving a market of �.3 billion customers.
But while the production side of China’s economy has boomed with two decades of
�0 percent growth, the consumer side has yet to live up to its promise.� Consump-
tion in China has grown at a significantly slower pace than output—consumption
as a share of GDP has shrunk from �7 percent in �995 to 37 percent in 2005. For
all of the excitement over China, its total consumer economy today is still barely
larger than Italy’s despite having over 20 times the population, and its citizens
spend on average only $5�3 per person per year versus $��,5�� in Italy.
The experience of foreign multinational companies (MNCs) serving China’s con-
sumers has likewise been mixed. There have been some notable success stories,
for example Western-style hypermarkets now reach deep into the Chinese heart-
land and last year nearly 90 million mobile phones were sold in China, making
it the world’s largest mobile market. But many companies have been surprised
at the competitive intensity of China’s markets, found the markets for their—by
Chinese standards, premium-priced—products smaller than anticipated, and
seen margins squeezed by the costs of sales, marketing, and distribution. As
one senior MNC executive put it, the attention China gets in his boardroom is way
out of proportion to the reality of his company’s current profits in the country.
If there is one overriding message from this report, however, it is that such
attention is just what the Chinese consumer market deserves. This report will
show that China’s economy is on the verge of an important transition in which its
consumers will begin to take their place on the world stage.
� See Nicholas R. Lardy, “China: Toward a Consumption-Driven Growth Path,” Institute for International Economics Policy Briefs in International Economics, no. PB06-6, October 2006.
9
�0
Over the past year, the McKinsey Global Institute (MGI) has looked closely into the
future of China’s consumer market. We have assembled a proprietary database
of 20 years’ of data that links macroeconomic and demographic variables to
Chinese incomes and consumption behavior. We have then used that data to
econometrically project Chinese income distributions and consumption patterns
out to 2025.
Our analysis shows that over the next two decades, the Chinese economy will
gradually begin to move away from its historical investment-led growth model,
and China’s consumers will begin to play a far greater role in their economy’s
growth. As this re-balancing from investment to consumption occurs, Chinese
incomes, which have been lagging GDP growth, will eventually begin to catch up,
and, between 2006 and 20�5, a massive middle class will emerge. This rising
middle class will largely be an urban phenomenon, which we project will spread
beyond China’s large wealthy coastal cities, to smaller cities further inland, thus
significantly changing the geography of China’s consumer market.
As the incomes of China’s new middle class rise dramatically, so too will their
consumption, making China the third-largest consumer market in the world
by 2025. A key characteristic of China’s new middle class will be that these
households will have passed the threshold where necessities such as food and
clothing constitute the bulk of their purchases. They will begin to spend a larger
proportion of their income on discretionary items, thus significantly changing the
pattern of spending in the economy.
We have also found that the spectacular rise of China’s urban middle class, and
its consequent impact on consumption, is a very robust outcome. It does not de-
pend on major changes in Chinese savings behavior or on particular government
policies (although certain policies could accelerate or slow the process), but
primarily on economic and demographic forces that are already well-established,
and on the continuation of overall economic growth. Even the impact of varying
future growth rates tends to alter only the timing of these developments, not
whether they happen at all.
ChIna’s EConoMy WIll RE-BalanCE ToWaRd ConsuMpTIon
China, like a number of other Asian economies, has aggressively pursued a policy
of investment-led growth. It has mobilized the savings of its vast, thrifty popula-
tion to build its industrial base, particularly in the export sector, and develop its
infrastructure. This policy has been very successful in fuelling over two decades
��
of high growth and, as we will see, significantly improving the incomes of large
numbers of citizens.
This investment-led approach, however, has created imbalances in both the
Chinese economy and the world economy, ranging from the underdevelopment
of China’s domestic consumer market, to a heavy reliance on exports for growth,
and the consequent imbalances in world trade and currency levels. China’s in-
vestment share of GDP, at �2 percent in 2005, is among the highest in the world.
At some point in its development, China will begin to re-balance. Eventually, two
things will occur. First, marginal returns on investment will begin to decline, thus
creating a natural brake on investment growth. Prior MGI work shows that this
is already beginning to happen in China.2 In the first half of the �990s, China
needed $3.30 of investment to support each dollar of GDP growth; since 200�,
it has required $�.90 to produce one dollar of GDP growth. 3 Second, consumers
will reach income levels where domestic spending begins to have a larger impact
on stimulating economic growth. As we will discuss, incomes in China are fast
approaching this point as well.
Furthermore, since December 200�, China’s top political leadership has made
it an express policy to ensure that a re-balancing towards consumption occurs
over time.� The government has been using a combination of monetary and
administrative controls to attempt to rein in China’s investment growth, as well
as taking actions, such as raising the minimum wage, de-regulating the retail
market, and creating the “Golden Week” holidays, to encourage consumption
growth.
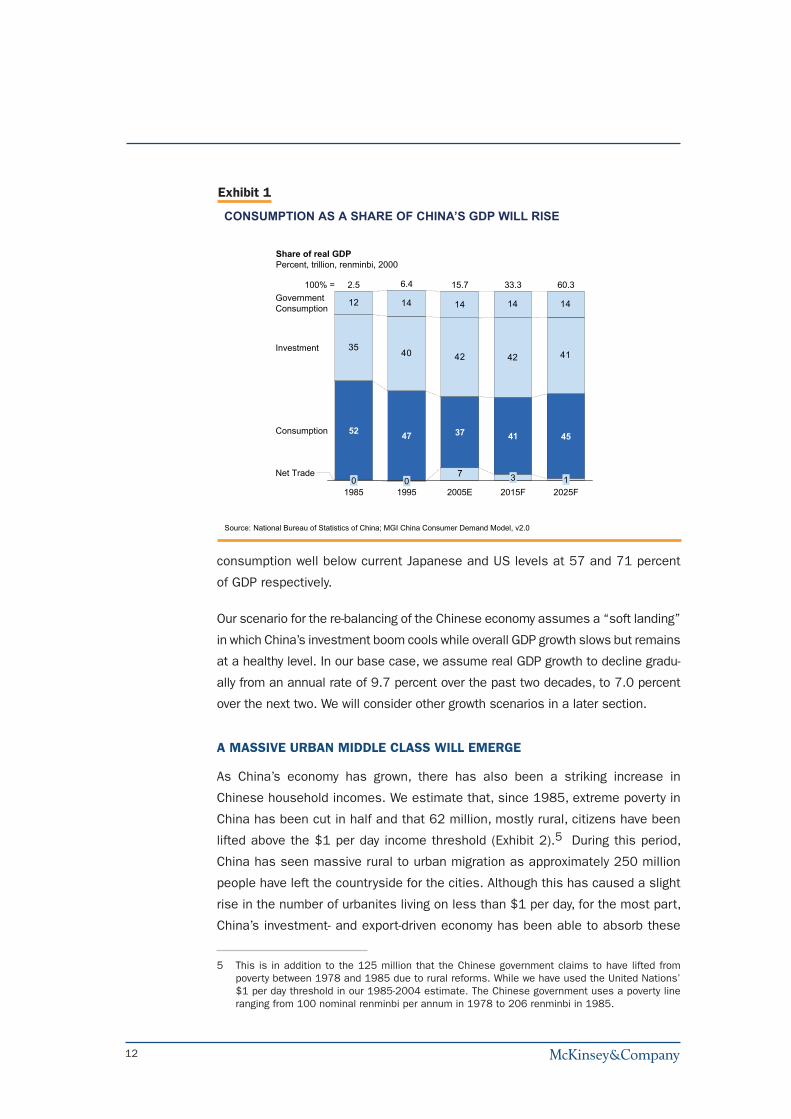
We estimate that over the next two decades, a combination of moderating invest-
ment levels and rising incomes will cause China’s consumption share of GDP
to rise from 37 percent today to �� percent by 20�5, and to �5 percent by
2025 (Exhibit �). Although this re-balancing would be an important shift from the
situation prevailing today, it is important to note that it will merely be returning
China to a share of consumption seen in the mid-�990s. It will still leave Chinese
2 See Diana Farrell, Susan Lund, Jaeson Rosenfeld, Fabrice Morin, Niyati Gupta, Ezra Greenberg, “Putting China’s Capital to Work: The Value of Financial System Reform,” McKinsey Global Institute, 2006, (http://www.mckinsey.com/mgi/publications/china_capital/index.asp).
3 Diana Farrell, Susan Lund, Fabrice Morin, “How Financial System reform could benefit China,” The McKinsey Quarterly, 2006 Special Edition: Serving the new Chinese consumer, (http://www.mckinseyquarterly.com/article_page.aspx?ar=�785).
� As Lardy (2006) notes, the policy was announced at the Central Economic Work Conference in December 200� and has been reiterated in speeches and remarks by both Premier Wen Jiaobao and President Hu Jintao.
�2
consumption well below current Japanese and US levels at 57 and 7� percent
of GDP respectively.
Our scenario for the re-balancing of the Chinese economy assumes a “soft landing”
in which China’s investment boom cools while overall GDP growth slows but remains
at a healthy level. In our base case, we assume real GDP growth to decline gradu-
ally from an annual rate of 9.7 percent over the past two decades, to 7.0 percent
over the next two. We will consider other growth scenarios in a later section.
a MassIvE uRBan MIddlE Class WIll EMERGE
As China’s economy has grown, there has also been a striking increase in
Chinese household incomes. We estimate that, since �985, extreme poverty in
China has been cut in half and that 62 million, mostly rural, citizens have been
lifted above the $� per day income threshold (Exhibit 2).5 During this period,
China has seen massive rural to urban migration as approximately 250 million
people have left the countryside for the cities. Although this has caused a slight
rise in the number of urbanites living on less than $� per day, for the most part,
China’s investment- and export-driven economy has been able to absorb these
5 This is in addition to the �25 million that the Chinese government claims to have lifted from poverty between �978 and �985 due to rural reforms. While we have used the United Nations’ $� per day threshold in our �985-200� estimate. The Chinese government uses a poverty line ranging from �00 nominal renminbi per annum in �978 to 206 renminbi in �985.
Exhibit 1
CONSUMPTION AS A SHARE OF CHINA’S GDP WILL RISE
Source: National Bureau of Statistics of China; MGI China Consumer Demand Model, v2.0
Share of real GDPPercent, trillion, renminbi, 2000
7
4142424035
1414141412
52
02025F1985
47
0
6.4
1995
100% =GovernmentConsumption
Investment
Consumption
Net Trade
60.333.315.7
2015F3
2.5
41
1
45
2005E
37

�3
relatively low-skill migrants, shifting them from the agricultural into the manufac-
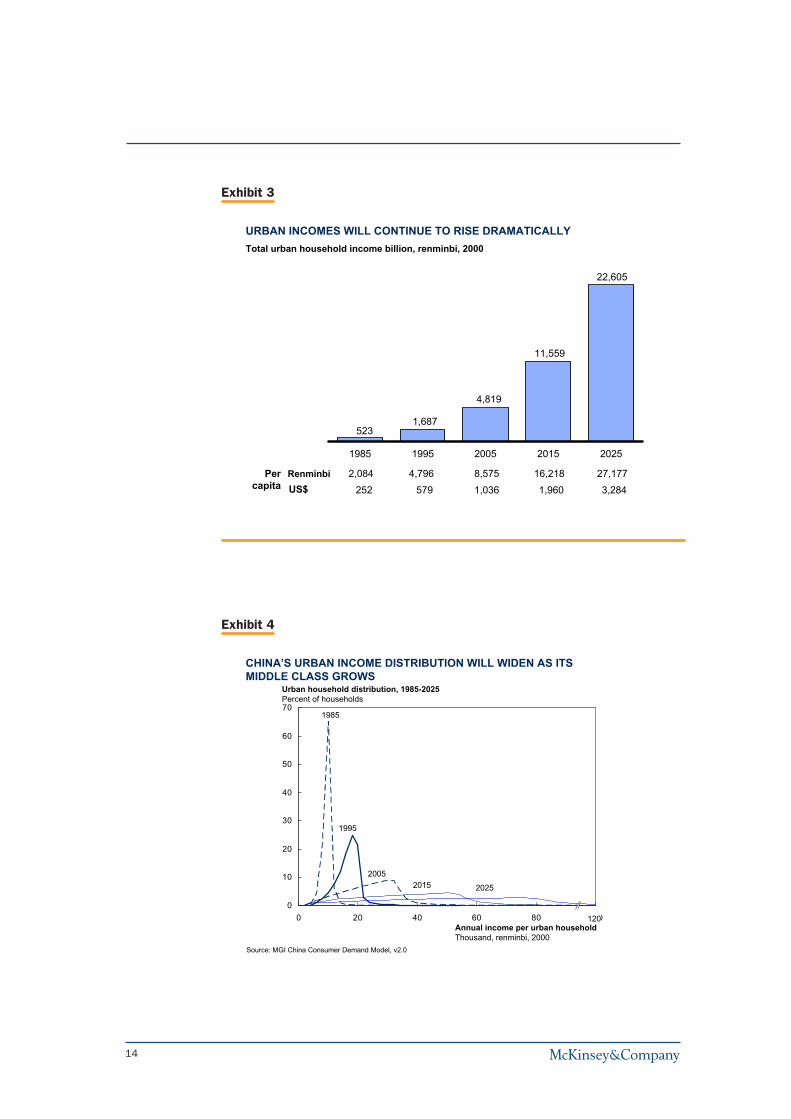
turing economy, where both their wages and skill levels have risen. Since �985,
urban real per-capita disposable incomes have more than quadrupled, rising
from 2,08� renminbi ($252) to 8,575 renminbi ($�,036) per annum in 2005
(Exhibit 3).
Going forward, as the economy re-balances away from investment-led growth, we
expect to see Chinese households capture a greater share of total factor income,
rising from 59 percent today to 6� percent by 2025. This means that, even
as overall economic growth moderates, incomes will continue to rise strongly.
In urban areas, total income will continue to rise even faster than overall GDP,
climbing 8 percent per annum over the coming two decades. This will be driven
by both continued urbanization, as the percentage of people living in urban areas
rises from �3 percent today to 59 percent by 2025, as well as rising per capita
income as China’s cities continue to create higher-value manufacturing and
service jobs.
As incomes grow, the shape of the distribution of income in urban China will
change too (Exhibit �). In �985, 99 percent of the urban population had household
disposable income of less than 25,000 renminbi ($3,0�9) per year. By 2005,
that had dropped by almost half, and will continue to fall as large segments
of the population move into the middle class. For the purposes of this report,
Exhibit 2
114.6
67.3
116.01985
Rural
Urban
47.3 6.6 53.92004
1.5
5.2
CHINA HAS REDUCED EXTREME POVERTY BY 53 PERCENT
Population earning under $1/day*Million
Rural
Urban
* Computed at $ PPP, 2000Source: MGI China Consumer Demand Model, v2.0; World Development Indica tors
Povertyreduction:62 million
��
Exhibit 3
URBAN INCOMES WILL CONTINUE TO RISE DRAMATICALLYTotal urban household income billion, renminbi, 2000
1985 1995 2005 2015 2025
2,084252
4,796579
8,5751,036
16,2181,960
27,1773,284
RenminbiUS$
Percapita
22,605
11,559
4,819
1,687523
Exhibit 4
0
10
20
30
40
50
60
70
0 20 40 60 80 100Annual income per urban householdThousand, renminbi, 2000
Urban household distribution, 1985-2025Percent of households
CHINA’S URBAN INCOME DISTRIBUTION WILL WIDEN AS ITS MIDDLE CLASS GROWS
Source: MGI China Consumer Demand Model, v2.0
120
1985
1995
20052015 2025
�5
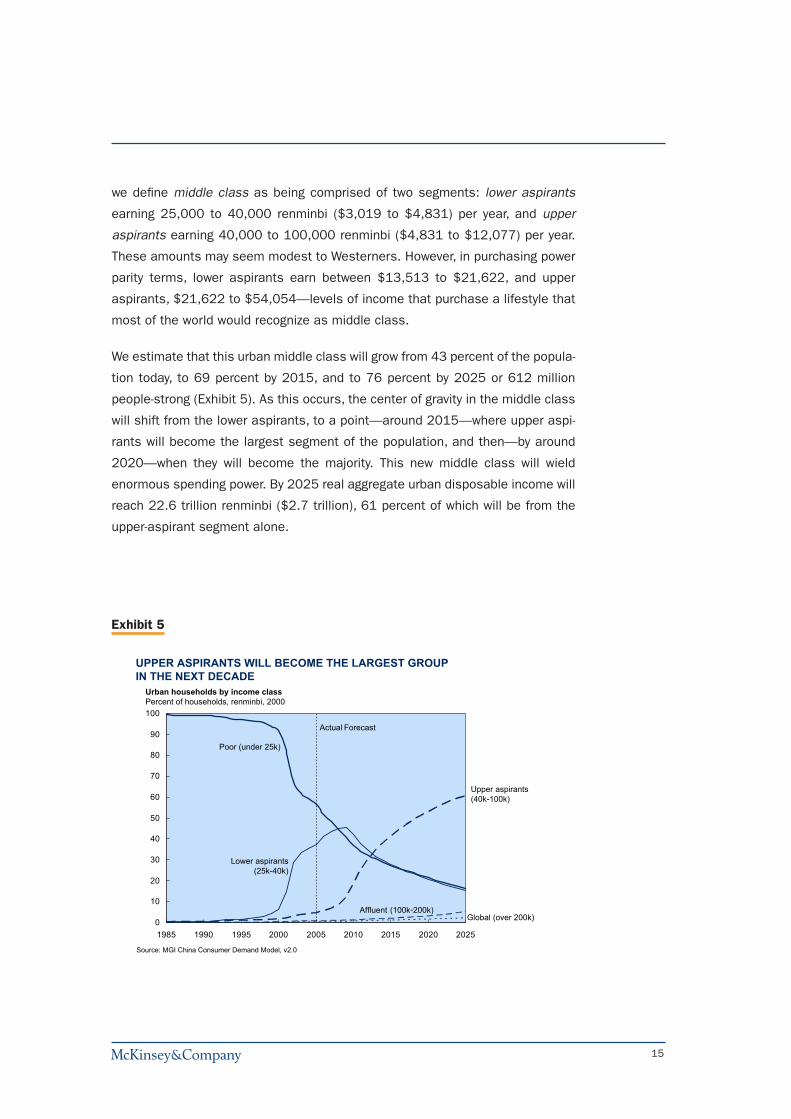
we define middle class as being comprised of two segments: lower aspirants
earning 25,000 to �0,000 renminbi ($3,0�9 to $�,83�) per year, and upper
aspirants earning �0,000 to �00,000 renminbi ($�,83� to $�2,077) per year.
These amounts may seem modest to Westerners. However, in purchasing power
parity terms, lower aspirants earn between $�3,5�3 to $2�,622, and upper
aspirants, $2�,622 to $5�,05�—levels of income that purchase a lifestyle that
most of the world would recognize as middle class.
We estimate that this urban middle class will grow from �3 percent of the popula-
tion today, to 69 percent by 20�5, and to 76 percent by 2025 or 6�2 million
people-strong (Exhibit 5). As this occurs, the center of gravity in the middle class
will shift from the lower aspirants, to a point—around 20�5—where upper aspi-
rants will become the largest segment of the population, and then—by around
2020—when they will become the majority. This new middle class will wield
enormous spending power. By 2025 real aggregate urban disposable income will
reach 22.6 trillion renminbi ($2.7 trillion), 6� percent of which will be from the
upper-aspirant segment alone.
Exhibit 5
UPPER ASPIRANTS WILL BECOME THE LARGEST GROUPIN THE NEXT DECADE
Source: MGI China Consumer Demand Model, v2.0
0
10
20
30
40
50
60
70
80
90
100
1985 1990 1995 2000 2005 2010 2015 2020 2025
Actual Forecast
Affluent (100k-200k)
Poor (under 25k)
Upper aspirants(40k-100k)
Global (over 200k)
Lower aspirants(25k-40k)
Urban households by income classPercent of households, renminbi, 2000
�6
China’s urban spending power will also be far less concentrated in the major Tier
� cities (Beijing, Shanghai, Guangzhou, and Shenzhen) and along the coasts,
than it has in the past. China’s 37 Tier 2 cities (the top three by population size
are Chongquing, Wuhan, and Tianjin), and 620 Tier 3 cities (the top three are
Xiangfan, Puning, and Zaoshuang—note that �36 Tier 3 cities have populations
of greater than a million) are both growing more quickly than the big four cities
and will account for the lion’s-share of China’s urban income growth.
ChIna WIll BECoME ThE WoRld’s ThIRd-laRGEsT ConsuMER EConoMy
As Chinese urban incomes rise at a rapid rate, so too will the spending of this
population. But how much spending rises depends on how much China’s frugal
citizens put away in savings—overall, Chinese households saved 37 percent of
their disposable income in 2005.6 Research by McKinsey’s China Consumer
Center has shown that the primary driver of this high savings rate has been
the weakness of the social safety net in China. In essence, people self-insure
against unexpected health-care costs, as well as save for their retirement and
their children’s education. While the Chinese government has made improving
the safety net a priority, we assume that only modest progress will be made
in the timeframe of our study, and that it will take time for savings behavior to
change. Rather, we believe that savings rates will moderate due to demographic
factors (the aging of the pre-one child cohort), rising wealth levels, and improve-
ments in the financial sector (e.g. greater availability of insurance products).
Urban households already save less than the national average, and we expect
their savings rate to decline gradually over the coming two decades.
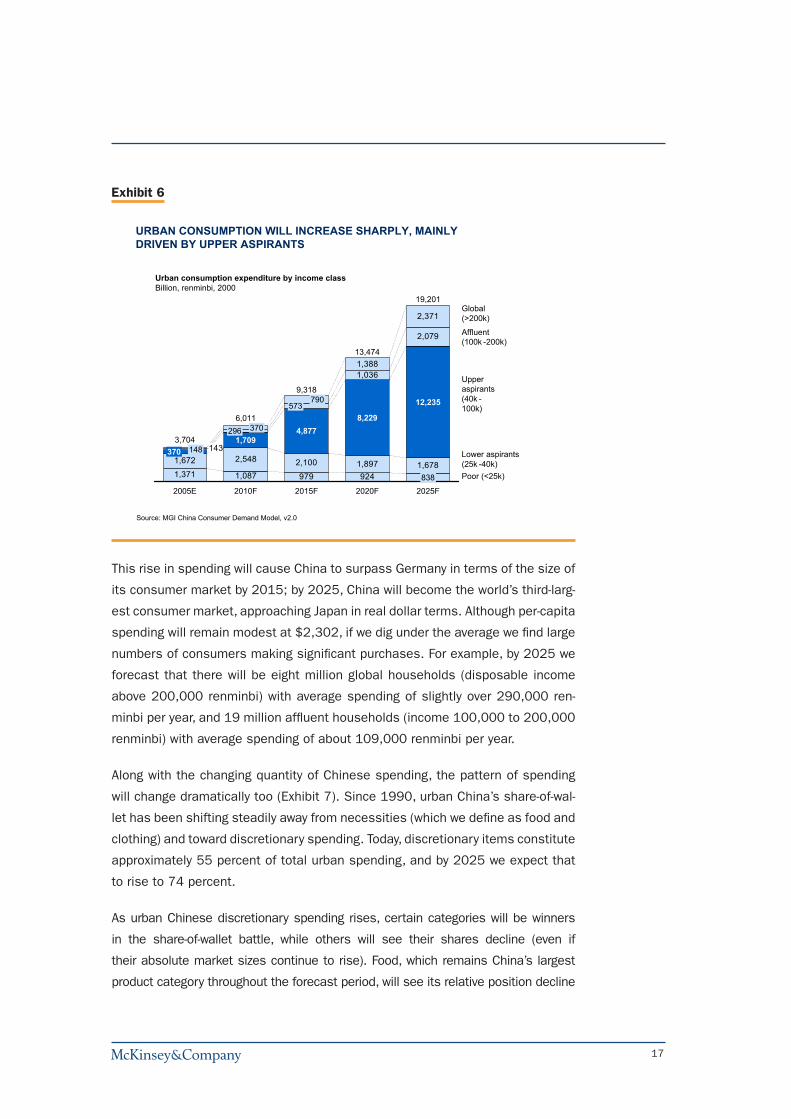
The combination of rapidly rising incomes and moderating savings rates will lead
to a strong surge in spending over the coming two decades. Urban consumer
spending will grow more than five-fold in real terms from 3.7 trillion renminbi
($��6 billion) per year in 2005 to �9.2 trillion renminbi ($2.3 trillion) in 2025
(Exhibit 6). Upper aspirants, who represent only a small fraction of spending
today, will be the dominant consumers by 20�5.
6 This represents a substantial upward revision of earlier estimates of the household savings rate. In the recent release by the NBS, a significant increase in services went to investment rather than consumption. Consequently, this change resulted in a spike in the national savings rate. We re-estimated the share of income and consumption going to households using this revised data and flow-of-funds data, to arrive at a new, higher 2005 estimate of the household savings rate. See also explanation given in Appendix B.
�7
This rise in spending will cause China to surpass Germany in terms of the size of
its consumer market by 20�5; by 2025, China will become the world’s third-larg-
est consumer market, approaching Japan in real dollar terms. Although per-capita
spending will remain modest at $2,302, if we dig under the average we find large
numbers of consumers making significant purchases. For example, by 2025 we
forecast that there will be eight million global households (disposable income
above 200,000 renminbi) with average spending of slightly over 290,000 ren-
minbi per year, and �9 million affluent households (income �00,000 to 200,000
renminbi) with average spending of about �09,000 renminbi per year.
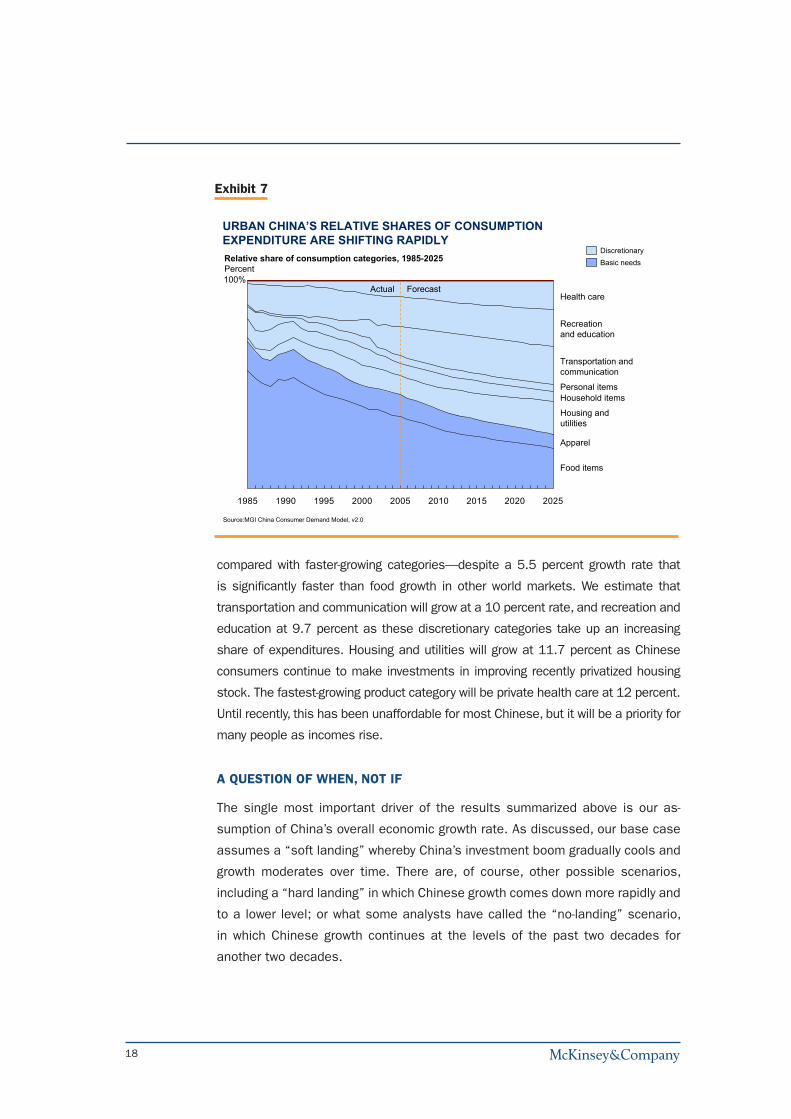
Along with the changing quantity of Chinese spending, the pattern of spending
will change dramatically too (Exhibit 7). Since �990, urban China’s share-of-wal-
let has been shifting steadily away from necessities (which we define as food and
clothing) and toward discretionary spending. Today, discretionary items constitute
approximately 55 percent of total urban spending, and by 2025 we expect that
to rise to 7� percent.
As urban Chinese discretionary spending rises, certain categories will be winners
in the share-of-wallet battle, while others will see their shares decline (even if
their absolute market sizes continue to rise). Food, which remains China’s largest
product category throughout the forecast period, will see its relative position decline
Exhibit 6
URBAN CONSUMPTION WILL INCREASE SHARPLY, MAINLYDRIVEN BY UPPER ASPIRANTS
Affluent(100k -200k)
Poor (<25k)
Upperaspirants(40k -100k)
Global(>200k)
Lower aspirants(25k -40k)
Source: MGI China Consumer Demand Model, v2.0
1,371 1,087 979 924
1,672 2,548 2,100 1,897 1,678
1,388
2,371
2,079
1,036
1431483703,704
2005E
3701,709
6,011
2010F
790573
4,877
9,318
2015F
8,229
13,474
2020F
12,235
19,201
2025F838
296
Urban consumption expenditure by income classBillion, renminbi, 2000
�8
compared with faster-growing categories—despite a 5.5 percent growth rate that
is significantly faster than food growth in other world markets. We estimate that
transportation and communication will grow at a �0 percent rate, and recreation and
education at 9.7 percent as these discretionary categories take up an increasing
share of expenditures. Housing and utilities will grow at ��.7 percent as Chinese
consumers continue to make investments in improving recently privatized housing
stock. The fastest-growing product category will be private health care at �2 percent.
Until recently, this has been unaffordable for most Chinese, but it will be a priority for
many people as incomes rise.
a QuEsTIon of WhEn, noT If
The single most important driver of the results summarized above is our as-
sumption of China’s overall economic growth rate. As discussed, our base case
assumes a “soft landing” whereby China’s investment boom gradually cools and
growth moderates over time. There are, of course, other possible scenarios,
including a “hard landing” in which Chinese growth comes down more rapidly and
to a lower level; or what some analysts have called the “no-landing” scenario,
in which Chinese growth continues at the levels of the past two decades for
another two decades.
Exhibit 7
URBAN CHINA’S RELATIVE SHARES OF CONSUMPTION EXPENDITURE ARE SHIFTING RAPIDLYRelative share of consumption categories, 1985-2025Percent
Basic needsDiscretionary
1985 1990 1995 2000 2005 2010 2015 2020 2025
Health care
Transportation andcommunication
Recreationand education
Household itemsPersonal items
Apparel
Food items
Housing andutilities
100%Actual Forecast
Source:MGI China Consumer Demand Model, v2.0
�9
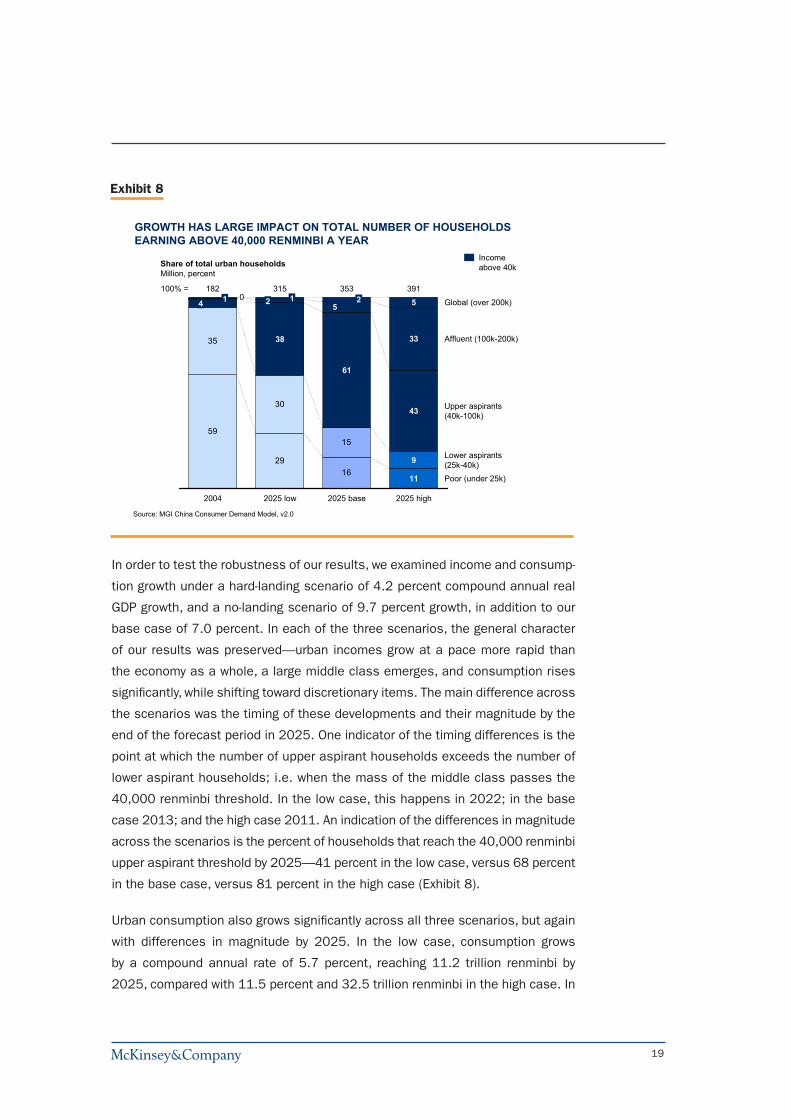
In order to test the robustness of our results, we examined income and consump-
tion growth under a hard-landing scenario of �.2 percent compound annual real
GDP growth, and a no-landing scenario of 9.7 percent growth, in addition to our
base case of 7.0 percent. In each of the three scenarios, the general character
of our results was preserved—urban incomes grow at a pace more rapid than
the economy as a whole, a large middle class emerges, and consumption rises
significantly, while shifting toward discretionary items. The main difference across
the scenarios was the timing of these developments and their magnitude by the
end of the forecast period in 2025. One indicator of the timing differences is the
point at which the number of upper aspirant households exceeds the number of
lower aspirant households; i.e. when the mass of the middle class passes the
�0,000 renminbi threshold. In the low case, this happens in 2022; in the base
case 20�3; and the high case 20��. An indication of the differences in magnitude
across the scenarios is the percent of households that reach the �0,000 renminbi
upper aspirant threshold by 2025—�� percent in the low case, versus 68 percent
in the base case, versus 8� percent in the high case (Exhibit 8).
Urban consumption also grows significantly across all three scenarios, but again
with differences in magnitude by 2025. In the low case, consumption grows
by a compound annual rate of 5.7 percent, reaching ��.2 trillion renminbi by
2025, compared with ��.5 percent and 32.5 trillion renminbi in the high case. In
Exhibit 8
GROWTH HAS LARGE IMPACT ON TOTAL NUMBER OF HOUSEHOLDSEARNING ABOVE 40,000 RENMINBI A YEAR
Share of total urban householdsMillion, percent
Source: MGI China Consumer Demand Model, v2.0
59
2916
35
30
15
0 1
38
21315
2025 low
25
61
353
2025 base
5
33
43
9
11
4
2025 high
Global (over 200k)
Affluent (100k-200k)
Upper aspirants(40k-100k)
391
Poor (under 25k)
100% = 182
2004
Lower aspirants(25k-40k)
Incomeabove 40k
20
all cases, consumption shifts significantly toward discretionary items, reaching
63 percent of share-of-wallet by 2025 in the low case, and 80 percent in the
high case.
In addition to GDP growth, we also examined sensitivities to other factors that
affect both the level of income as well as its distribution, such as population,
growth, the urbanization rate, educational attainment, and wealth effects from
savings. While population growth tends to be a relatively predictable factor in
economics, there is nonetheless some variability around forecasts, and, given
the size of China’s population, such differences could potentially matter. For
example, if China’s population were to be �00 million people, or 7 percent, larger
than is forecast by 2025, this would translate into an urban consumption market
that is 6.3 percent larger than our base case. Likewise, a 5 percent increase
in the urbanization rate from our base case would move the size of the urban
market up by 8 percent.
Educational attainment tends to effect the shape of the income distribution, but
even a 23 percent change in the level (thus catching up with South Korea) would
only marginally change the distribution—e.g. the total income of households at
the top-end global-income bracket would only rise by � percent. Finally, if real
wealth in China were to zoom up from its ratio of �.2 times GDP today to 6.0
times by 2025 (20 percent higher than our base case and higher than the current
US level), there would only be a modest impact on the income distribution—e.g.,
the total income of households at the top-end global-income bracket would rise
by 3.8 percent.
Our conclusion is that, short of an economic downturn far below our low case,
a major reversal in China’s political or social conditions, or changes in other
factors that significantly deviate from our base-case assumptions, over the next
two decades China will give birth to a massive middle class and develop into one
of the world’s major consumer economies.
Readers interested in our detailed findings and analyses are invited to go to
the main chapters in the full report. Those interested in forecasts for specific
product and service categories should look at Appendix A, and those interested
in further details on our modeling approach and data sources are directed to
Appendix B.
* * *
2�
As the dream of a market of nearly 270 million middle-class households begins
to come true over the coming decades, both business leaders and policy mak-
ers will grapple with its implications. MNCs will need to continue to drive their
prices and costs down relentlessly to be able to reach and build relationships
with consumers who have modest incomes today but will be the middle class
of tomorrow. In addition, MNCs will need to extend their geographic reach into
the Tier 3 and lower cities where the majority of these consumers live. At the
same time, Chinese companies will need to build skills in branding and product
innovation in order to follow these customers up-market as their tastes change
with rising incomes.
For their part, policy makers will face a delicate balancing act of shifting China’s
economy from dependence on investment and exports, to one that is increasingly
driven by its own domestic consumers, while still keeping growth rates at high
levels. Critical decisions will need to be made about government investment in
the social safety net to free up consumption, and financial-sector reform will play
a key role in helping both China’s producers and households reduce their excess
savings and spend more.
China’s growth into a consumer superpower will be good for China as more of its
citizens realize their aspirations for a more comfortable life. It will also be good
for the citizens of other countries as China’s consumer markets will generate
enormous opportunities for companies around the world, creating jobs, expand-
ing trade, and leading to a more balanced role for China in the global economy.