from a studebaker to a ferrari - presentation 2007 09 28...
TRANSCRIPT

FROM A STUDEBAKER TO A FERRARI:
Managing by Standards and Performance Measures
presented by:
From a Studebaker to a Ferrari: Managing by Standards© PROS Consulting LLC, 2007 1
Leon Younger – Allen Mullins – B.G. Clark

From a Studebaker to a Ferrari: Managing by Standards© PROS Consulting LLC, 2007 2

The Studebaker…”TraditionalModel”The Studebaker… Traditional Model
W f d ti th bj ti f th We focused on meeting the objectives of the year that was established by the budget …
Getting along with what we have with limited Getting along with what we have with limited accountability and we were more focused on responsibility than accountabilityBudgets were compared to previous budgetsStaffing levels were tied to to previous staffing levelslevelsProgram, facility, and event attendance compared to previous attendanceEquating few complaints to customer satisfaction
From a Studebaker to a Ferrari: Managing by Standards© PROS Consulting LLC, 2007 3

The Ferrari…”High PerformanceThe Ferrari… High Performance Model”
G tti th i k d f t ith Getting there quicker and faster with more accuracy and efficiency…
Agencies are now more focused on outcomes that Agencies are now more focused on outcomes that are measurable than outputsTerms such as capacity management, demand, ff f fefficiency, frequency, retention, levels of service,
cost per experience or task are the mode of todayWe are now focused on market driven decision We are now focused on market driven decision making that is data driven not gut drivenData supported quantified results is the work
k f dspeak of todayFrom a Studebaker to a Ferrari: Managing by Standards© PROS Consulting LLC, 2007 4

Transitioning through Standards…Transitioning through Standards…
Getting there quicker and fasterGetting there quicker and faster…Change to meet customer demands and be accountable for resources StaffingEquipmentCapital budgetsCapital budgetsRevenues earned
Focus on outcomes that are measurable
Reporting ResultsReporting Results
From a Studebaker to a Ferrari: Managing by Standards© PROS Consulting LLC, 2007 5

Transitioning Through StandardsTransitioning Through Standards
M i f di i l d l Moving from traditional management model to high performance management models requiresrequires:
Clearly defined improved business processes Systematic and holistic shift in planning Systematic and holistic shift in planning, execution and monitoring
From a Studebaker to a Ferrari: Managing by Standards© PROS Consulting LLC, 2007 6
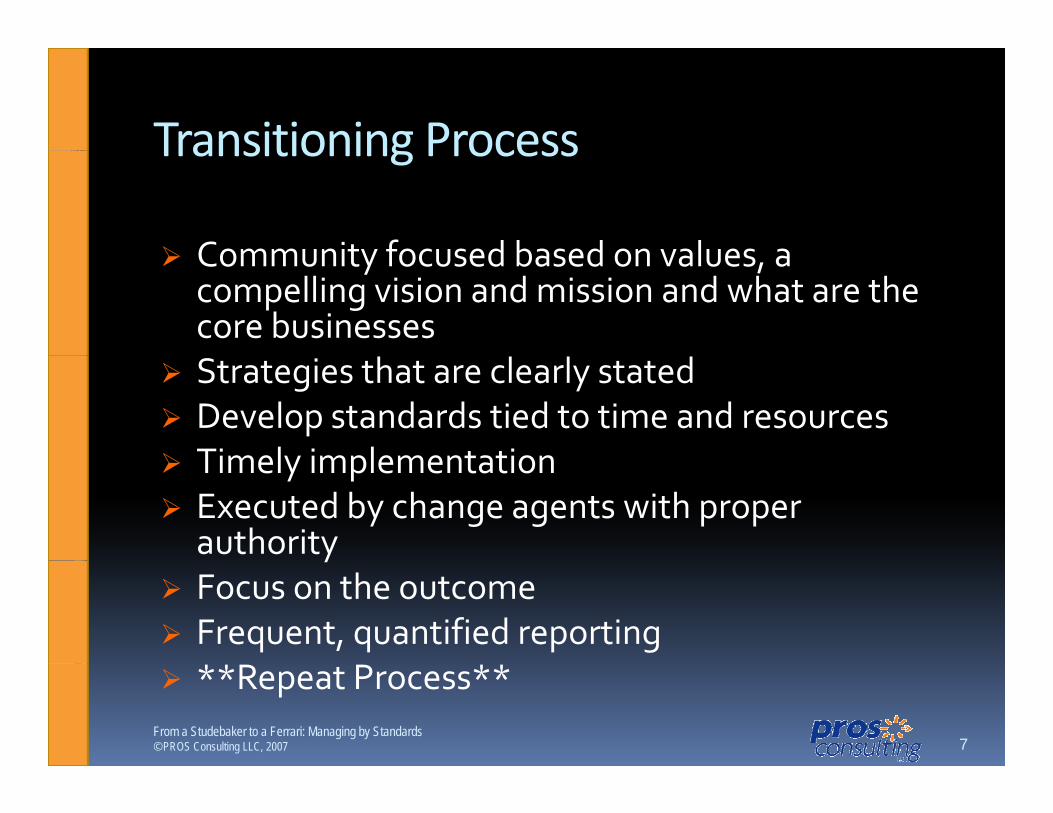
Transitioning ProcessTransitioning Process
Community focused based on values a Community focused based on values, a compelling vision and mission and what are the core businessesStrategies that are clearly stated Develop standards tied to time and resourcesTimely implementation Timely implementation Executed by change agents with proper authorityyFocus on the outcome Frequent, quantified reporting**Repeat Process**
From a Studebaker to a Ferrari: Managing by Standards© PROS Consulting LLC, 2007 7

Transitioning FunctionsTransitioning Functions
M j f i l f d dMajor functional areas for standards:Business Systems (Operations)M iMaintenanceProgrammingF ilitiFacilitiesCustomer service
From a Studebaker to a Ferrari: Managing by Standards© PROS Consulting LLC, 2007 8
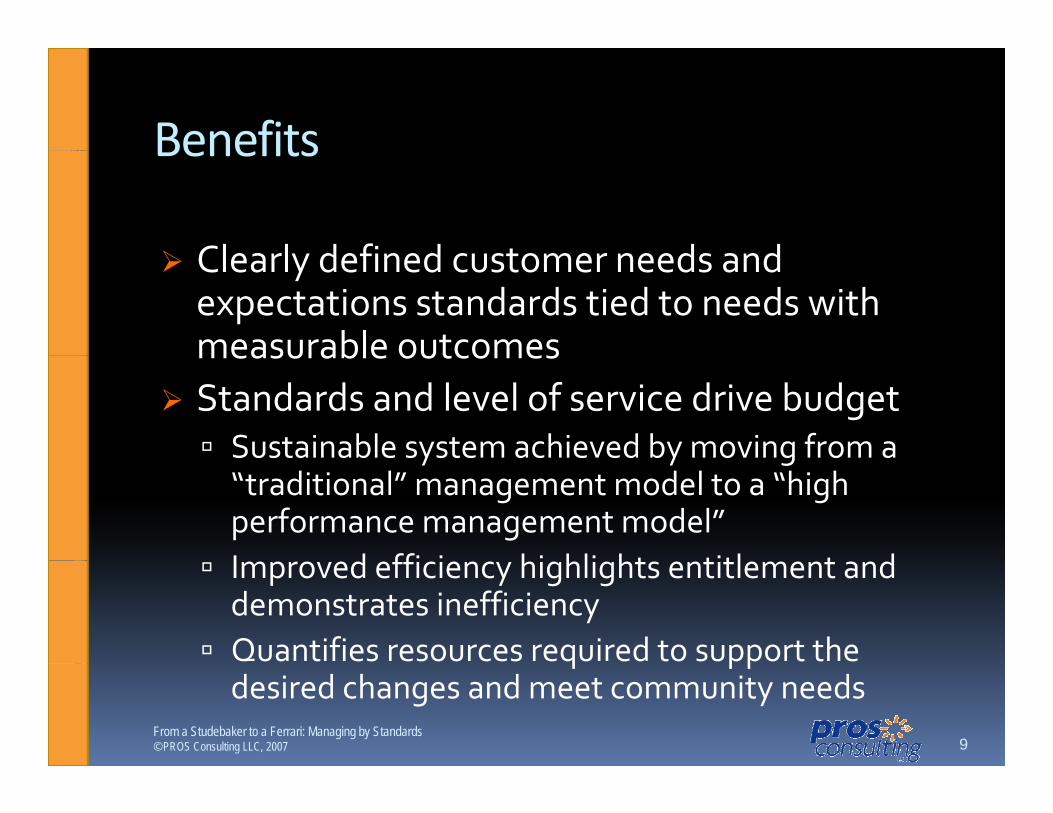
BenefitsBenefits
Cl l d fi d t d d Clearly defined customer needs and expectations standards tied to needs with measurable outcomesmeasurable outcomesStandards and level of service drive budget
Sustainable system achieved by moving from a Susta ab e syste ac e ed by o g o a“traditional” management model to a “high performance management model”I d ffi i hi hli ht titl t d Improved efficiency highlights entitlement and demonstrates inefficiencyQuantifies resources required to support the q ppdesired changes and meet community needs
From a Studebaker to a Ferrari: Managing by Standards© PROS Consulting LLC, 2007 9

Business Systems
From a Studebaker to a Ferrari: Managing by Standards© PROS Consulting LLC, 2007 10

Business SystemsBusiness Systems
FinancialFinancialBudget, accounting, procurement, reporting
Customer InformationReservation/Scheduling, Web‐site
Work ManagementAsset Management Work Order Resource Asset Management, Work Order, Resource Management
Human Resource/PayrollPersonnel, Payroll, Benefits, Intranet
Planning, Design and ConstructionGeographic Information Systems (GIS) Capital Geographic Information Systems (GIS), Capital Improvement Program, Regulatory Tracking
From a Studebaker to a Ferrari: Managing by Standards© PROS Consulting LLC, 2007 11

Business Systems ‐ PlanningBusiness Systems Planning
Id if i i b i Identify existing business systemsAssess functionality of business systems b d d dbased on desired outcomesDefine gapsDevelop requirementsEvaluate available systemsyCreate implementation strategies
From a Studebaker to a Ferrari: Managing by Standards© PROS Consulting LLC, 2007 12
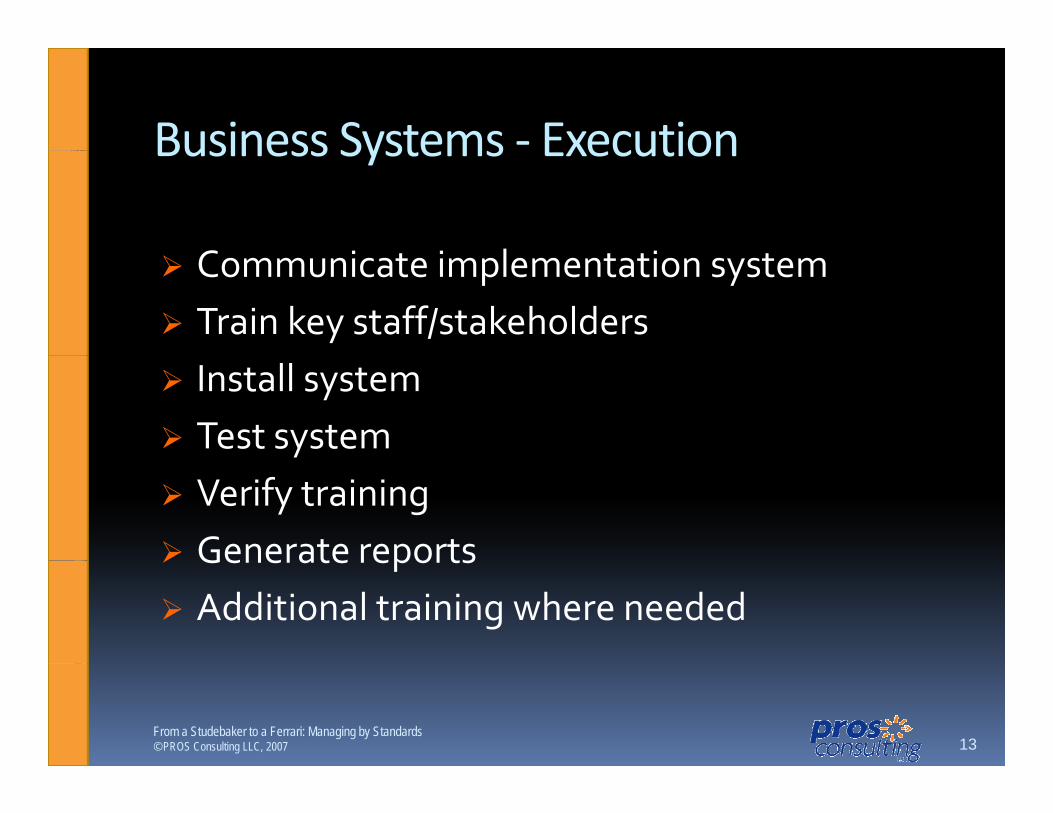
Business Systems ‐ ExecutionBusiness Systems Execution
C i i l i Communicate implementation systemTrain key staff/stakeholdersInstall systemTest systemVerify trainingGenerate reportsGenerate reportsAdditional training where needed
From a Studebaker to a Ferrari: Managing by Standards© PROS Consulting LLC, 2007 13
Business Systems ‐ ExampleWork Order Management SystemFunctional Requirements meeting
es
Rating formula = Low 1, medium 2, high 3, N/A 0 D
istr
ict 1
Dis
trict
2
Dis
tric
t 3
Dist
rict 4
Dis
tric
t 5
Dis
tric
t 6
Zoo
Fair
Park
Faci
lity
Serv
ice
Gol
f / T
enni
s
Gro
up
Criti
cal
Comments1 Inventory Management: x x x x x xx x
P t b d i ti 3Part number, description, cost (length of fields)
3
Fields for part categories and nomenclature
3
Markup 3 Warehouse--- to cover operating costs
Balance-on-hand 3YTD, MTD, Date last issued
3
Active / inactive 3Catalog listing 3B d i t f 3Barcode interface 3Quantity-on-hand, 3Quantity-on-order 3Expected date 3Re-order point 3Cycle counts 3yShrinkage Reports 3Point-of-sale system 0Multiple warehouses 3 other depts.Creation of pick lists 3Reference to purchase
d k d3 X

Maintenance
From a Studebaker to a Ferrari: Managing by Standards© PROS Consulting LLC, 2007 15
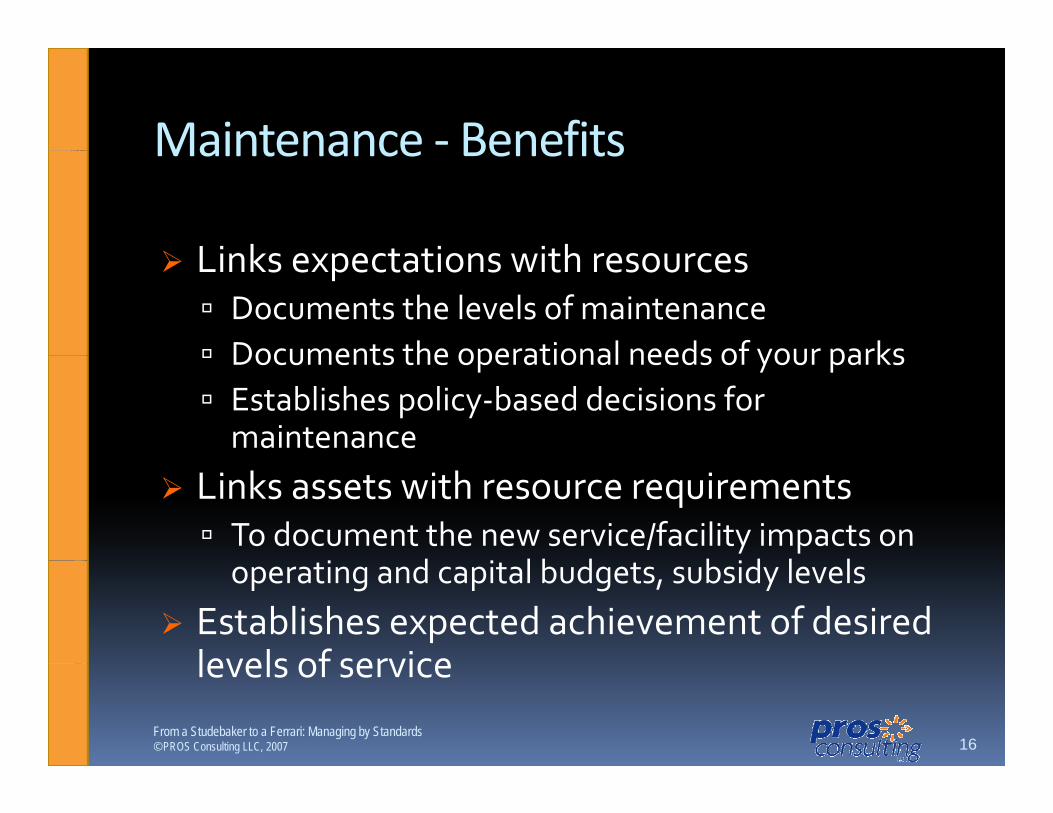
Maintenance ‐ BenefitsMaintenance Benefits
Li k t ti ith Links expectations with resourcesDocuments the levels of maintenanceDocuments the operational needs of your parksDocuments the operational needs of your parksEstablishes policy‐based decisions for maintenance
Links assets with resource requirementsTo document the new service/facility impacts on
i d i l b d b id l loperating and capital budgets, subsidy levelsEstablishes expected achievement of desired levels of servicelevels of service
From a Studebaker to a Ferrari: Managing by Standards© PROS Consulting LLC, 2007 16
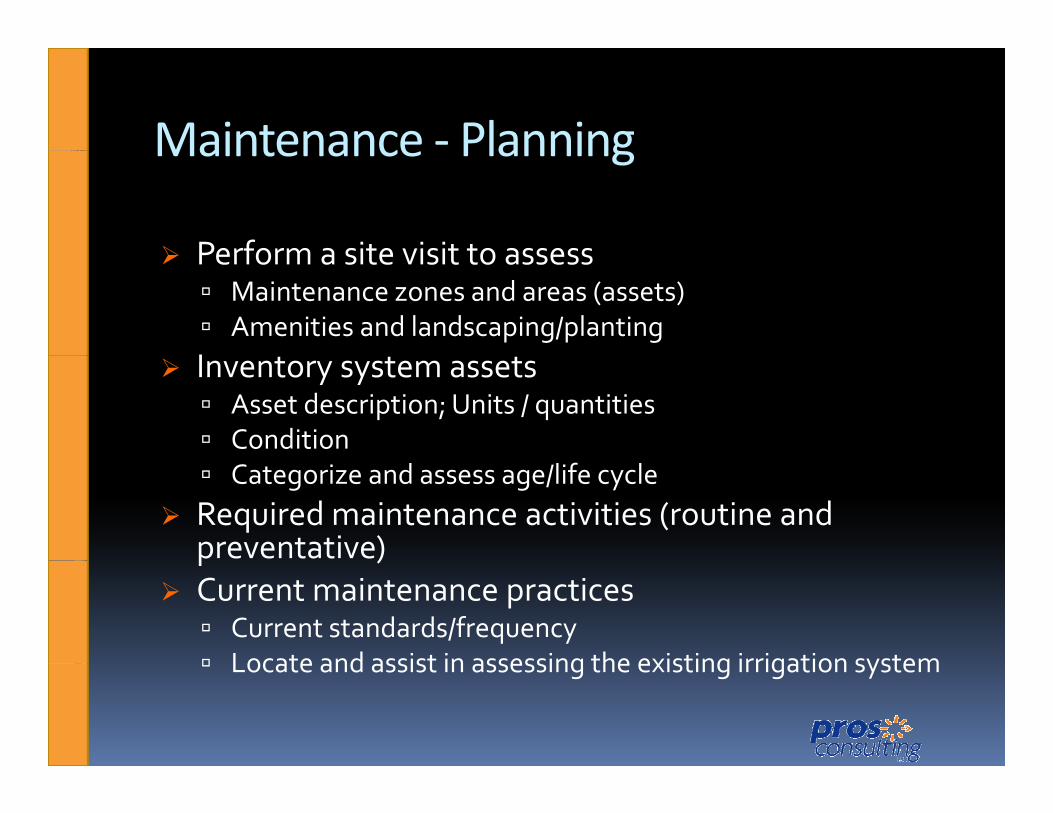
Maintenance ‐ PlanningMaintenance Planning
Perform a site visit to assessPerform a site visit to assessMaintenance zones and areas (assets)Amenities and landscaping/planting
I Inventory system assetsAsset description; Units / quantitiesConditionCategorize and assess age/life cycle
Required maintenance activities (routine and preventative)p )Current maintenance practices
Current standards/frequencyLocate and assist in assessing the existing irrigation systemLocate and assist in assessing the existing irrigation system

Maintenance ‐ PlanningMaintenance Planning
Task 1
Task 2
Task 3Asset
Standard Units:TimeTask
Frequencies by Level of Service
From a Studebaker to a Ferrari: Managing by Standards© PROS Consulting LLC, 2007 18
Maintenance ‐ ExecutionMaintenance Execution
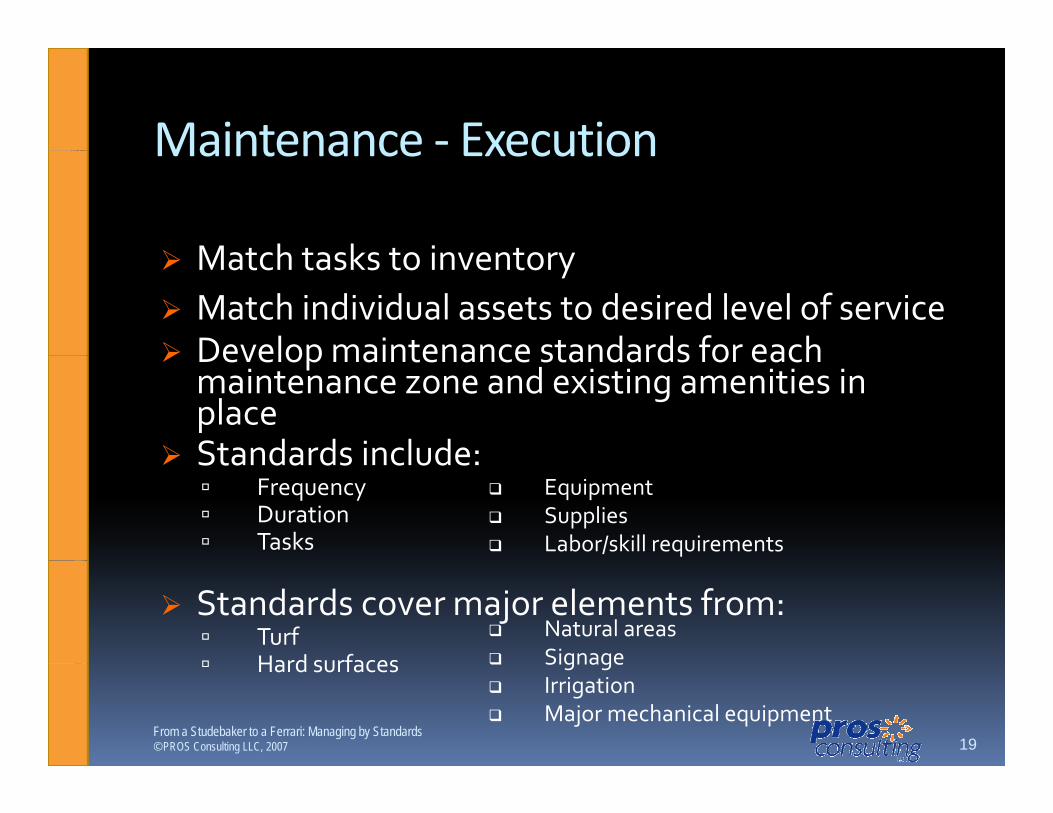
Match tasks to inventoryMatch tasks to inventoryMatch individual assets to desired level of serviceDevelop maintenance standards for each Develop maintenance standards for each maintenance zone and existing amenities in placeStandards include: Standards include:
FrequencyDurationTasks
EquipmentSuppliesLabor/skill requirements
Standards cover major elements from:TurfHard surfaces
Natural areasSignageHard surfaces SignageIrrigationMajor mechanical equipment
From a Studebaker to a Ferrari: Managing by Standards© PROS Consulting LLC, 2007 19
Maintenance ‐ ExamplesMaintenance Examples
Sample ResultsSa p e esu ts
Inventory Item
CurrentAverage Hours per Unit Current
Current Times Per Cur Labor
StandardAverage Hours per Level 1
Level 1 Times Per
Level 1 Labor
Item Quantity Item Unit Activity Unit Description Frequency Year Hours Unit Frequency Year Hours
Turf 40 Acres
Turf Trimout ‐ Spring and Summer 2.00 Acre Bi‐weekly 12.00 960.00 2.00 1/week 36.00 2,880.00Turf Mowing ‐ Spring and
Turf 40 Acres Summer 2.00 Acre 1/week 21.00 1,680.00 2.00 1/10 days 12.00 960.00
From a Studebaker to a Ferrari: Managing by Standards© PROS Consulting LLC, 2007 20

Maintenance ‐ ExamplesMaintenance Examples
S l S d dSample Standards
Activity
Average Hours per
UnitUnit
DescriptionCurrent
FrequencyLevel 1
FrequencyLevel 2
FrequencyLevel 3
FrequencyActivity Unit Description Frequency Frequency Frequency FrequencyTurf Mowing ‐ Spring and Summer 2.00 Acre 1/week 1/10 days 1/14 days 1/18 daysTurf Mowing ‐ Fall and Winter 1.00 Acre 1/month 1/14 days 1/20 days 1/24 daysTurf Trimout ‐ Spring and Summer 2.00 Acre Bi‐weekly 1/week Bi‐weekly 1/monthTurf Trimout ‐ Fall and Winter 2.00 Acre 1/month 1/week Bi‐weekly 1/monthTurf Fertilization 1 00 Acre 1/year 2/year 1/year 1/yearTurf Fertilization 1.00 Acre 1/year 2/year 1/year 1/yearIrrigation (Watering Schedule) 1.00 Acre 3/week 3/week 2/week 1/weekLeaf Management 2.00 Acre 2/year 2/year 1/year 1/yearLitter Removal ‐ Peak 0.20 Acre 2/week 2/week 1/weekLitter Removal ‐ Non Peak 0.20 Acre 1/week 2/week 1/weekGarbage Pickup ‐ Trash Cans 0 04 Can 2/week 1/day 2/week 1/weekGarbage Pickup ‐ Trash Cans 0.04 Can 2/week 1/day 2/week 1/weekRestroom Servicing 1.00 Building 1/day 2/day 1/day 1/day Assets Infrastructure Inspections 1.00 Each 1/week 1/week biweekly 1/monthPlay Equipment Inspection 2.00 location 1/week 1/week biweekly 1/monthPlay Equipment Compliance Assessment 2.00 location 1/month 1/month Bi‐monthly 1/quarterLandscape Bed Maintenance 1 00 1 000 SF 2/year Bi monthly 1/quarter 2/yearLandscape Bed Maintenance 1.00 1,000 SF 2/year Bi‐monthly 1/quarter 2/yearSmall Trees or Shrubs Inspection 0.20 Each 4/year 4/year 1/2years 1/year
From a Studebaker to a Ferrari: Managing by Standards© PROS Consulting LLC, 2007 21

Maintenance ‐ ExamplesMaintenance Examples
From a Studebaker to a Ferrari: Managing by Standards© PROS Consulting LLC, 2007 22

Maintenance ‐MonitoringMaintenance Monitoring
D b d i d l l f Document gaps between desired level of service and actual level of service achieved
l dDocument planned resource requirements to achieve desired level of service to actual
li dresources appliedDemonstrate resources, results, needs Communicate resources, results, needs
From a Studebaker to a Ferrari: Managing by Standards© PROS Consulting LLC, 2007 23

Programming
From a Studebaker to a Ferrari: Managing by Standards© PROS Consulting LLC, 2007 24

Programming ‐ BenefitsProgramming Benefits
M t h t t dMatches programs to customer needsEstablishes expected achievement of desired levels of servicelevels of serviceHelps define facility development requirements requirements
Programs drive design Guides consistency in program deliveryGuides consistency in program deliveryContinuous refinement of program offerings to customer feedback and changing demandsg g
From a Studebaker to a Ferrari: Managing by Standards© PROS Consulting LLC, 2007 25

Programming ‐ PlanningProgramming Planning
F id d i d i i f Factors considered in determining future directions for recreation programs
IInventoryOther service providersO ll tOverall assessmentIdentify opportunities Market size/trendsMarket size/trendsPrioritize and define core offeringsAlign resources to core services and strategiesAlign resources to core services and strategies
From a Studebaker to a Ferrari: Managing by Standards© PROS Consulting LLC, 2007 26
Select Program StandardsSelect Program Standards
Instructor or program coordinators’ qualificationsInstructor or program coordinators’ qualificationsInstructor‐to‐participant ratiosBackground checksBackground checksAppropriate recreation space (safety, cleanliness)Minimum and maximum numbers of participantsp pRecreation equipment or suppliesLength of the programSafetyCustomer feedback methods
fPricing of services From a Studebaker to a Ferrari: Managing by Standards© PROS Consulting LLC, 2007 27
Programming ‐ ExecutionProgramming Execution
S d d i d d l Standards review and development processConduct focus groups to test viabilityModify programs based on inputAdjust to changing demands
From a Studebaker to a Ferrari: Managing by Standards© PROS Consulting LLC, 2007 28
Programming ‐MonitoringProgramming Monitoring
C l d d / lCompare program results to standards/planParticipationP l d/h ld/ ll dPrograms planned/held/cancelledCost recoveryC t ti f tiCustomer satisfaction
Participant surveysCustomer retention
From a Studebaker to a Ferrari: Managing by Standards© PROS Consulting LLC, 2007 29
Facilities
From a Studebaker to a Ferrari: Managing by Standards© PROS Consulting LLC, 2007 30

Facilities ‐ BenefitsFacilities Benefits
Facility Standards are guidelines that define Facility Standards are guidelines that define service areas based on population and/or capacity
d l d f l dSupports investment decisions related to facilities and amenitiesRelates recreation needs to spatial analysis within a
i id f k f ili i d community‐wide system of park facilities and amenitiesBecomes a major structuring element that can be used t id d i t f ilit d l tto guide and assist facility development
Does not represent a guarantee to schedule or fund projects in Department’s capital p j p pimprovement plan
From a Studebaker to a Ferrari: Managing by Standards© PROS Consulting LLC, 2007 31

Facilities ‐ PlanningFacilities Planning
Quantify customer needs Quantify customer needs Document facilities inventory
Construction type (engineered, non‐engineered)Primary usage
Document usage of each facilitySports including participant ages and gender)p g p p g g )Frequencies of useSeasonsIntensity of useIntensity of use
Document capacity of each facility to maintain desired facility condition
Develop and apply facility usage guidelines that are tied to Develop and apply facility usage guidelines that are tied to maintenance and operational standards
From a Studebaker to a Ferrari: Managing by Standards© PROS Consulting LLC, 2007 32

Capacity and DemandCapacity and Demand
Capacity: Capacity of an asset is defined as the maximum number of events (i.e. games, practices, special events), and corresponding hours and persons, that an individual asset can service
Demand: Defined as actual usage and organized by representative age segment and activity (e.g. 6 to 18 year ld f l h f b ll)old females; youth softball)
From a Studebaker to a Ferrari: Managing by Standards© PROS Consulting LLC, 2007 33
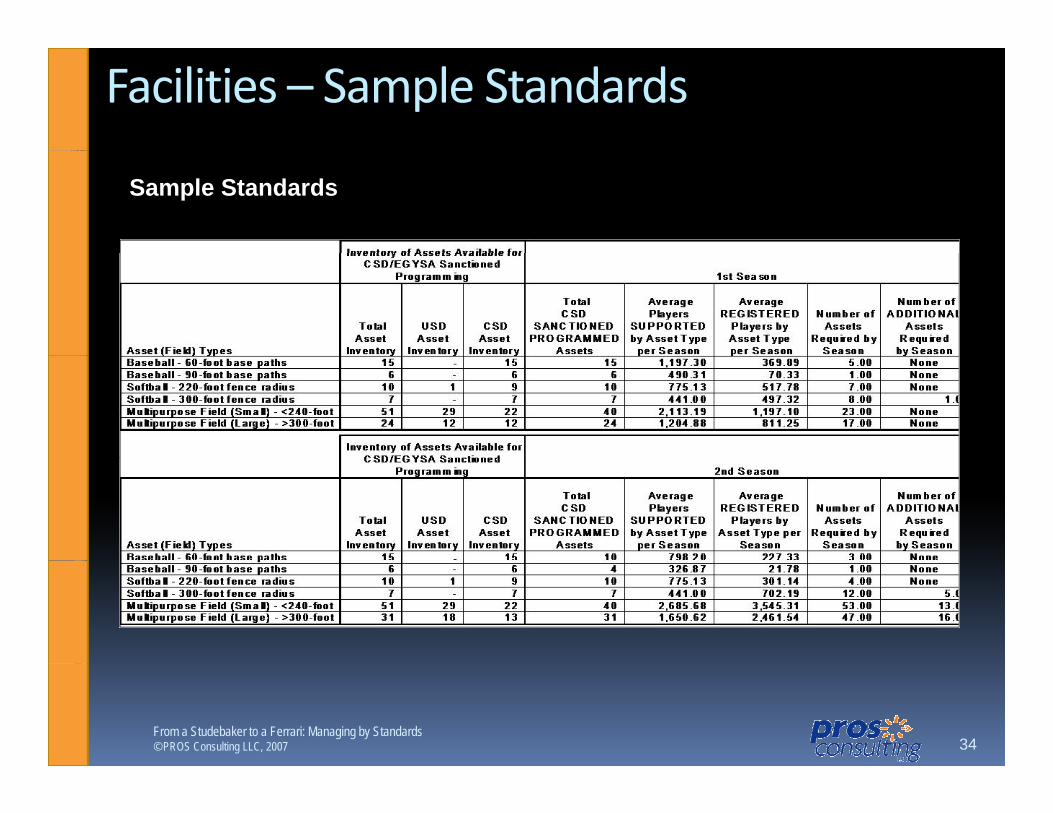
Facilities – Sample Standards
Sample Standards
From a Studebaker to a Ferrari: Managing by Standards© PROS Consulting LLC, 2007 34

Facilities – Sample Standards
Sample StandardsAmenity Drive Time Standard Circular Distance Population Density
Based on EstablishedBased on Established Design Standards
Regional/Interpretive Center
45 minutes 30 miles 1/150,000
Outdoor Pools 15 minutes 2 miles 1/25,000 Playgrounds Walking distance 1 mile 1/1,250yg g ,Softball Field\s (youth)
15 minutes 2 miles 1/5,000
Softball Fields (adult)
20 minutes 3 miles 1/20,000
Recreation Center 15 minutes 2 miles 1 sf/personpGolf Course 20 minutes 3 miles 1 hole/1,000 Sports Courts (tennis)
10 minutes 2 miles 1/5,000
Sports Courts (outdoor basketball)
10 minutes 2 miles 1/5,000
Indoor Gym 10 minutes 2 miles 1sf/person Neighborhood Park Walking distance 1 mile 1/5,000 Soccer Complex (4 to 10 fields)
20 minutes 3 miles 1/25,000
Youth Baseball Field 15 minutes 2 miles 1/4,000 Adult Baseball Field 20 minutes 3 miles 1/25,000Community Park 15 minutes 2 miles 1/20,000
From a Studebaker to a Ferrari: Managing by Standards© PROS Consulting LLC, 2007 35

Facilities ‐ ExecutionFacilities Execution
St d d A li ti S i A A l i Standards Application – Service Area Analysis Overlaps and gaps are graphically identified based on population densities within the service area of on population densities within the service area of a specific facility or amenityFacility standards should be viewed as a guideThey address goals to be achievedStandards are to be coupled with conventional wisdom and judgment related to the particular wisdom and judgment related to the particular situation and needs of the communityDevelop recommended improvements – drives Capital Improvement Plan
From a Studebaker to a Ferrari: Managing by Standards© PROS Consulting LLC, 2007 36
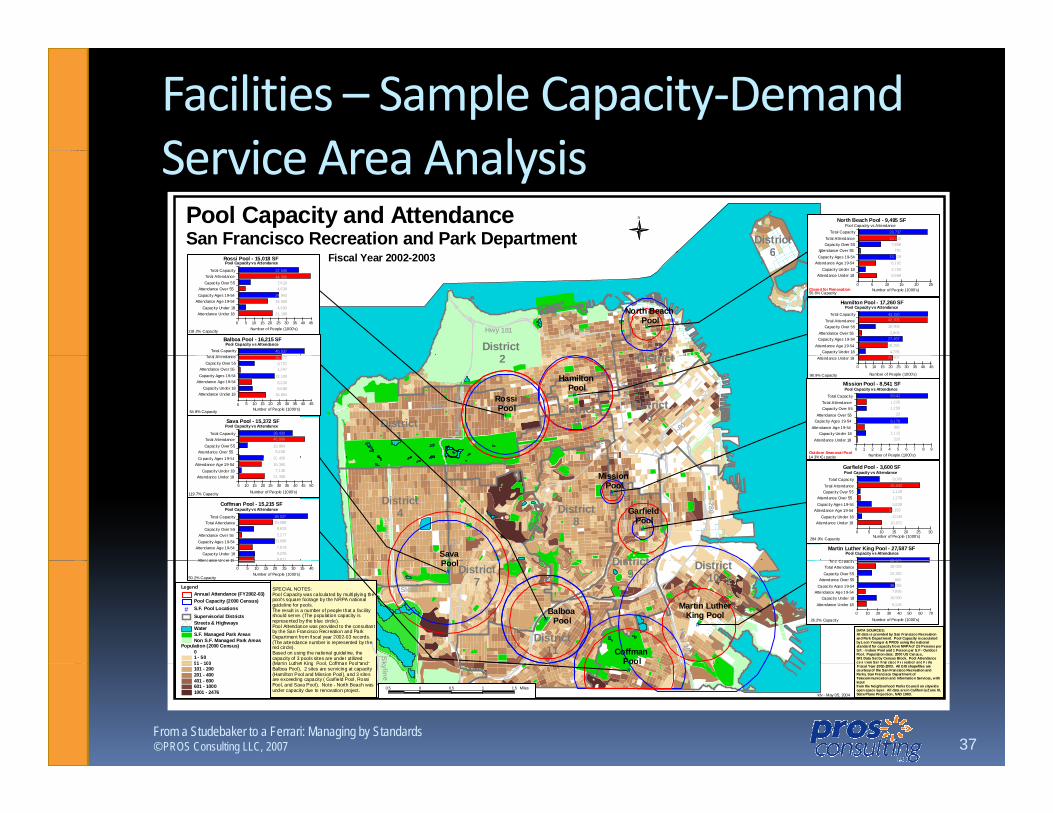
Facilities – Sample Capacity‐Demand Service Area AnalysisService Area Analysis
District6
Pool Capacity and AttendanceSan Francisco Recreation and Park Department
N
Total Capac ityTotal AttendanceCapac ity Over 55
Attendance Over 55
Pool Capacity vs AttendanceNorth Beach Pool - 9,495 SF
23,73713,4407,858
770
#LombardHwy 101
District 2 Di t i t
6Fiscal Year 2002-2003
Total Capac ityTotal AttendanceCapac ity Over 55
Attendance Over 55 Capac ity Ages 19-54
Attendance Age 19-54Capac ity Under 18
Pool Capacity vs Attendance
43,15042,70510,9082,803
27,45718,2954,785
Hamilton Pool - 17,260 SF
Capac ity Ages 19-54Attendance Age 19-54
Capac ity Under 18Attendance Under 18
Number of People (1000's)2520151050
56.6% Capacity
13,1196,1022,7606,568
Closed for Renovation
Total Capac ityT t l Att d
Pool Capacity vs AttendanceBalboa Pool - 16,215 SF
40,537
Total Capac ityTotal AttendanceCapac ity Over 55
Attendance Over 55 Capac ity Ages 19-54
Attendance Age 19-54Capac ity Under 18
Attendance Under 18
Number of People (1000's)454035302520151050
Pool Capacity vs Attendance
118.2% Capacity
Rossi Pool - 15,018 SF
37,54544,3967,6104,639
24,94218,5694,993
21,188 North Beach Pool
#
#
Van Ness
Park Presidio I-80
Geary
Market
District1
2 District3
District5
District6
Total Capac ityTotal AttendanceCapac ity Over 55
Attendance Over 55 Capac ity Ages 19-54
Attendance Age 19-54Capac ity Under 18
Attendance Under 18
Number of People (1000's)9876543210
Pool Capacity vs Attendance
14.3% Capacity
Mission Pool - 8,541 SF
8,5411,2251,259
23
6,170982
1,112220
Outdoor Seasonal Pool
Attendance Under 18
Number of People (1000's)
454035302520151050
98.9% Capacity
21,607
Total Capac ityTotal AttendanceCapac ity Over 55
Attendance Over 55 Capac ity Ages 19 54
Pool Capacity vs AttendanceSava Pool - 15,372 SF
38,43046,006
10,8645,208
20 430
Total AttendanceCapac ity Over 55
Attendance Over 55 Capac ity Ages 19-54
Attendance Age 19-54Capac ity Under 18
Attendance Under 18
Number of People (1000's)454035302520151050
64.8% Capacity
26,2779,7511,247
22,1008,2268,686
16,804 Rossi Pool
Hamilton Pool
#
#
19th
I-280
M
Mission
Sunset
District4
District
District8
Total Capac ity
Pool Capacity vs AttendanceMartin Luther King Pool - 27,587 SF
68 967
Total Capac ityTotal AttendanceCapac ity Over 55
Attendance Over 55 Capac ity Ages 19-54
Attendance Age 19-54Capac ity Under 18
Attendance Under 18
Number of People (1000's)302520151050
Pool Capacity vs AttendanceGarfield Pool - 3,600 SF
9,00025,6421,1281,3785,828
14,1932,044
10,071
284.9% Capacity
14.3% CapacityCapac ity Ages 19-54Attendance Age 19-54
Capac ity Under 18Attendance Under 18
Number of People (1000's)5045403530252015105
119.7% Capacity
20,43019,3907,136
21,408
Total Capac ityTotal AttendanceCapac ity Over 55
Attendance Over 55 Capac ity Ages 19-54
Attendance Age 19-54Capac ity Under 18
Attendance Under 18
Pool Capacity vs AttendanceCoffman Pool - 15,215 SF
38,03719,088
8,6532,277
20,0987,8789,2868,933
Sava P l
Mission Pool
Garfield Pool
#
##
Sloat
Sk
I-280
Hwy 1 01
District7
District11
District10
District9
Population (2000 Census)01 - 5051 100
Non S.F. Managed Park AreasS.F. Managed Park AreasWaterStreets & HighwaysSupervisorial Districts
# S.F. Pool LocationsPool Capacity (2000 Census)Annual Attendance (FY2002-03)
Legend
Total Capac ityTotal AttendanceCapac ity Over 55
Attendance Over 55Capac ity Ages 19-54
Attendance Age 19-54Capac ity Under 18
Attendance Under 18
Number of People (1000's)706050403020100
9,106
18,5907,995
99214,322
18,09368,967
36,055
26.2% Capacity
Attendance Under 18
Number of People (1000's)4035302520151050
50.2% Capacity
8,933
DATA SOURCES:All data is provided by San Francisco Recreation and Park Department. Pool Capacity is caculated by Leon Younger & PROS using the national standard for capacity from NRPA of 2.5 Persons per S.F. - Indoor Pool and 1 Person per S.F - Outdoor Pool. Population data: 2000 US Census, SF1 Data Set by Census Block. Pool Attendance data from San Francisco Recreation and Parks,
Pool
Balboa Pool
Coffman Pool
Martin LutherKing Pool
SPECIAL NOTES:Pool Capacity was calculated by multiplying thepool's square footage by the NRPA national guideline for pools. The result is a number of people that a facility should serve. (The population capacity is represented by the blue circle).Pool Attendance was provided to the consultant by the San Francisco Recreation and Park Department from fiscal year 2002-03 records.(The attendance number is represented by thered circle).Based on using the national guideline, the capacity of 3 pools sites are under utilized (Martin Luther King Pool Coffman Pool and
#k y lin e
kfv - May 05, 2004
51 - 100101 - 200201 - 400401 - 600601 - 10001001 - 2476
0.5 0 0.5 1 1.5 Miles
data from San Francisco Recreation and Parks, Fiscal Year 2002-2003. All GIS shapefiles are courtesy of the San Francisco Recreation and Parks, San Francisco Department of Telecommunication and Information Services, with input from the Neighborhood Parks Council on citywide open space layer. All data are in California Zone III,State Plane Projection, NAD 1983.
Pool(Martin Luther King Pool, Coffman Pool andBalboa Pool), 2 sites are servicing at capacity (Hamilton Pool and Mission Pool), and 3 sites are exceeding capacity ( Garfield Pool, Rossi Pool, and Sava Pool). Note - North Beach was under capacity due to renovation project.
From a Studebaker to a Ferrari: Managing by Standards© PROS Consulting LLC, 2007 37

Facilities ‐MonitoringFacilities Monitoring
A ll d b d d d Annually compare needs based on standards to facilitiesd d l b lAdjust usage guidelines to balance system
demand
From a Studebaker to a Ferrari: Managing by Standards© PROS Consulting LLC, 2007 38

Facilities ‐Monitoring
From a Studebaker to a Ferrari: Managing by Standards© PROS Consulting LLC, 2007 39

Customer service
From a Studebaker to a Ferrari: Managing by Standards© PROS Consulting LLC, 2007 40

Customer Service ‐ BenefitsCustomer Service Benefits
Happy customers/visitors/employeesIncreased participation and retentionC t l l lif l tCreate loyal, lifelong customersImproved morale and performance of employees
Informed customers/visitors/employeesInformed customers/visitors/employeesIncreased advocacy Increased participation and spending powerIncreased participation and spending powerImproved decision‐makingTargeted customer needs
From a Studebaker to a Ferrari: Managing by Standards© PROS Consulting LLC, 2007 41

Customer Service ‐ PlanningCustomer Service Planning
C i d lCurrent customer service processes and toolsEvaluation of retention and satisfactionFrequency of use/participationCustomize approach to specific age segmentsDevelopment of customer service plan for each park and facilityp yDevelopment of customer toolkits
From a Studebaker to a Ferrari: Managing by Standards© PROS Consulting LLC, 2007 42

Customer Service ‐ ExecutionCustomer Service Execution
Customer service standardsCustomer service standardsKnowledge of system and servicesConsistent greetingsIntroduction to programs/facilitiesSafetySignage and wayfindingSignage and wayfindingCleanlinessStaff and volunteer image and trainingConflict resolutionConflict resolutionChain of communicationCustomer feedback process – intercept surveys,
t d l ti fcomment cards, evaluation forms
From a Studebaker to a Ferrari: Managing by Standards© PROS Consulting LLC, 2007 43

Performance Measures –Beyond the Numbers
Using Performance MeasurementsUsing Performance MeasurementsEfficiency management toolCompare results to standards and desired outcomesDocument factors that resulted in gaps/shortfallsAdjust resources and process to meet standards Communicate resource needs for planned levels of Communicate resource needs for planned levels of service
Develop measurements to communicate results and resource needsand resource needsEliminate measurements that do not help you plan and/or communicateContinuous improvement process
From a Studebaker to a Ferrari: Managing by Standards© PROS Consulting LLC, 2007 44

PerformanceMeasures – Top TenPerformance Measures Top Ten
Customer retention and satisfactionCustomer retention and satisfactionProgram cancelation ratesAge segments served and satisfactiong gCost of service levels metRevenue to expense targetsC it tili tiCapacity utilizationLife‐cycle management (programs, facilities, parks)Consistency in standards metConsistency in standards metStaffing levels for park acreage maintainedStaff productivity (work orders, initiatives, time‐
t)management)
From a Studebaker to a Ferrari: Managing by Standards© PROS Consulting LLC, 2007 45

The Ferrari…”High PerformanceThe Ferrari… High Performance Model”
F d t th t blFocused on outcomes that are measurable
Market driven decision making that is data driven
Data supported quantified resultsData supported quantified results
Change to meet customer demands and be accountable for resources
Clearly defined, improved business processes
Systematic and holistic shift in planning, execution and monitoring
Performance measurements that demonstrate success
G tti th i k d f t ith d Getting there quicker and faster with more accuracy and efficiency…
From a Studebaker to a Ferrari: Managing by Standards© PROS Consulting LLC, 2007 46
Transitioning through Standards…Transitioning through Standards…
Getting there quicker and fasterGetting there quicker and faster…Change to meet customer demands and be accountable for resources StaffingEquipmentCapital budgetsCapital budgetsRevenues earned
Focus on outcomes that are measurable
Reporting ResultsReporting Results
From a Studebaker to a Ferrari: Managing by Standards© PROS Consulting LLC, 2007 47

Transitioning Through StandardsTransitioning Through Standards
M i f di i l d l Moving from traditional management model to high performance management models requiresrequires:
Clearly defined improved business processes Systematic and holistic shift in planning Systematic and holistic shift in planning, execution and monitoring
From a Studebaker to a Ferrari: Managing by Standards© PROS Consulting LLC, 2007 48

BenefitsBenefits
Cl l d fi d t d d Clearly defined customer needs and expectations standards tied to needs with measurable outcomesmeasurable outcomesStandards and level of service drive budget
Sustainable system achieved by moving from a Susta ab e syste ac e ed by o g o a“traditional” management model to a “high performance management model”I d ffi i hi hli ht titl t d Improved efficiency highlights entitlement and demonstrates inefficiencyQuantifies resources required to support the q ppdesired changes and meet community needs
From a Studebaker to a Ferrari: Managing by Standards© PROS Consulting LLC, 2007 49
QUESTIONS?Q
From a Studebaker to a Ferrari: Managing by Standards© PROS Consulting LLC, 2007 50