fringe financial institutions, the unbanked, and the …nccah-ccnsa.ca/docs/nccah partner...
TRANSCRIPT
FRINGE FINANCIAL INSTITUTIONS, THE UNBANKED,
AND THE PRECARIOUSLY BANKED:
SURVEY RESULTS FROM PRINCE GEORGE, B.C.
DR. PAUL BOWLES, KEELY DEMPSEY AND TREVOR SHAW
University of Northern British Columbia
REPORT PREPARED FOR THE ABORIGINAL BUSINESSS DEVELOPMENT CENTRE
SEPTEMBER 2010
Funding from the National Collaborating Centre for Aboriginal Health and NEARBC is gratefully acknowledged
The National Collaborating Centre for Aboriginal Health supports a renewed public health system in Canada that is inclusive and respectful of diverse First Nations, Inuit and Métis peoples. The NCCAH is funded through the Public Health Agency of Canada and hosted at the University of Northern British Columbia in Prince George. B.C. NEARBC (Network Environments for Aboriginal Research BC) was funded by the Michael Smith Foundation for Health Research until 2010 and is currently a program at the Centre for Aboriginal Health Research at the University of Victoria. NEARBC supports collaboration between researchers and communities to improve and enhance the health and well-being of Aboriginal Peoples.

Executive Summary 1. Despite the fact that, with only basic identification, all Canadians have the legal right to open a bank account, there has been an explosive growth in fringe financial institutions (FFIs) over the past decade or so which offer financial services such as cheque cashing, payday loans, and income tax refund anticipation loans. These services are typically offered at rates of interest far in excess of those charged by mainstream financial institutions such as banks and credit unions. 2. Prince George has experienced many of the same trends as other locations. There has been an increase in FFIs with the number of FFI outlets now comparable to the number of bank and credit union branches. The presence of this number of FFIs, which range from pawn shops to pay day lenders and includes the major FFIs such as Money Mart and Insta-Cash, in a city of less than 80,000 would seem to indicate a high level of usage of FFIs. 3. National estimates of the size of the unbanked population, i.e. those without a bank account, range from 3% to 15%. Applying this to Prince George population statistics produces an estimated unbanked population range of 1494 to 9035 depending on the age category and estimating method used. 4. Questionnaire surveys were administered to 176 clients exiting FFIs on 15 days between September 9, 2009 and April 21, 2010. Days were largely randomly chosen although it was decided to include the penultimate Wednesday in two months as this is the day on which income assistance cheques are issued. Two main locations were chosen for the surveys corresponding to the two locations with the largest geographic concentration of FFIs. 5. Our survey results indicate that the characteristics of the FFI users in Prince George match those of national surveys in being low income individuals with low levels of asset ownership. The FFI users are also predominantly male in line with national survey results although women are also significant FFI clients. In contrast to national survey results, however, we find a higher age cohort in our survey. Looking behind the income data we find that well over half of the FFI users are unemployed and rely on a range of government transfers (with social assistance, disability payments and employment insurance being the three most frequent); amongst the employed FFI users, most work full-time. 6. Aboriginal individuals are a major user of FFIs and 60 per cent of our sample self-identified as Aboriginal. The Aboriginal and non-Aboriginal users of FFIs in our sample shared some common characteristics. Both groups were predominantly in rented accommodation indicating that both had low asset ownership; both had predominantly male users. However, it is also clear that Aboriginal users of FFIs had lower incomes, less education, were more likely to be younger, more likely to be unemployed and more likely to rely on income assistance than the non-Aboriginal users. The entire sample is a
1
relatively low income group but, within that, it appears that the Aboriginal FFI users are even less financially secure. 7. The overwhelming majority (88 per cent) of FFI users held accounts at mainstream financial institutions at some point in their financial history, and a half of them still regularly used such accounts. While 50 per cent of our sample of FFI users could be described as currently unbanked, in the sense that they did not currently regularly use a bank or credit union account, the other 50 per cent were clearly banked in an important sense, and were in fact simultaneous users of both mainstream and fringe financial institutions. 8. Convenience factors – both location and hours – were cited by many respondents as reasons for their choice of using FFIs. 30 per cent of respondents cited these ‘convenience’ factors. The practice of placing a hold on cheques by banks and credit unions was also a significant reason. ID requirements were cited by just under 10 per cent of respondents as a reason for not using banks or credit unions. Some respondents, especially Aboriginal respondents, reported that they did not feel welcome at the mainstream financial institutions. 9. Among FFI users there is a significant degree of experience with the mainstream financial sector. What seems to have happened, however, is that there has been a breakdown in the relationship between many of these institutions and their clients as the latter have fallen into financial difficulties. This group has not been adequately recognized or studied in the existing literature and might best be termed the ‘precariously banked’. They are regular users of mainstream financial institutions but their relationship with that institution is precarious and, when they run into financial difficulty, they turn to simultaneous use of FFIs. 10. Federal amendments to section 347 the Criminal Code passed in 2007 allow provinces to impose their own regulations on FFIs. Many provincial governments, including BC, have opted for this approach which accepts the rise of FFIs but which seeks to regulate them. This is done through licensing requirements and regulations on the types of loans which can be provided (so that rollover loans, for example, are not permitted) and the amount of information that must be provided to borrowers. 11. As of November 1, 2009, all payday loan companies in BC were required to be licensed by Consumer Protection BC. As part of this licensing, all payday lenders are restricted to charging a maximum of 23 percent of the amount borrowed in interest and fees on loans of up to $1500 that are short-term (defined as any loan period up to 62 days). This allows for annual interest payments considerably in excess of the federal Criminal Code provisions and, in fact, does more to protect the profits of the industry and decriminalize usury than to protect the consumer. Given that the average payday loan in Canada is $280 for a 10 day period, in BC a payday lender can now legally charge $64.40 for this transaction. This computes to a nominal annual percentage rate of interest (APR) of 839.5%.
2
12. Our survey results indicate that there are two main groups of FFI users for whom further policy responses would be appropriate. 13. The first is those without bank or credit union accounts, the unbanked. 12 per cent of our survey of FFI users reported that they had never held a bank or credit union account and 50 pre cent reported that they did not currently regularly use one. For this group, simple financial transactions such as cheque cashing are undertaken at FFIs. Many FFI users rely upon Employment Insurance, Income Assistance or Disability payments as their main source of income, all government issued cheques. These can be cashed at mainstream financial institutions at lower cost than the FFIs; one policy response therefore is for the mainstream financial institutions to make a greater effort in making this service known to low-income clients. 14. The second group identifiable in our survey is a sizeable group of FFI users who are also clients of the mainstream banks and credit unions, and who we have termed the precariously banked. This group, some 50 per cent of our survey respondents, are familiar with the services offered by banks and credit unions but simultaneously use FFIs as well. Some of the reasons given for using FFIs refer to specific services such as tax refund anticipation loans and wire transfers. These are again areas where the mainstream institutions could examine whether they are able to offer these services at a lower cost than the FFIs. 15. Beyond offering specific services, it also clear that many bank and credit union clients gravitate towards using FFIs when they run into financial difficulties. The task for banks and credit unions is to find ways to innovate their services so that the need for this dual track approach that many take is reduced. Given the prevalence of precariously banked clients, the mainstream financial institutions certainly have an incentive to find ways of addressing their needs since their own client base is potentially being threatened. 16. As well as working with existing institutions and organizations, other policy initiatives include the creation of new institutions designed specifically to meet the needs of low-income individuals. For a city the size of Prince George there are significant difficulties to this approach. However, even if this might make an alternative institution more of a medium to long term possibility, in the short term exploring pilot projects with existing mainstream financial institutions would be a positive first step in addressing the very real need to find alternatives to FFIs for low-income individuals.
3

FRINGE FINANCIAL INSTITUTIONS, THE UNBANKED, AND THE PRECARIOUSLY BANKED:
SURVEY RESULTS FROM PRINCE GEORGE, B.C.1
1.0 Introduction Despite the fact that, with only basic identification, all Canadians have the legal right to open a bank account2, there has been an explosive growth in fringe financial institutions (FFIs) across Canada over the past decade or so which offer financial services such as cheque cashing, payday loans, and income tax refund anticipation loans.3 These services are typically offered at rates of interest far in excess of those charged by mainstream financial institutions such as banks and credit unions, and often far in excess of legal interest rates (Pyper 2007). Kitching and Starky (2006: 4) report that there were 1200 payday loan stores in Canada in 2004 and indicate that “the industry is growing rapidly”.4 The Canadian Payday Loan Association, a voluntary body which represents the industry, agrees that a “rapid growth of the industry over the past ten years in response to consumer demand is evident” (2008). There have been a number of studies examining the reasons for this growth, who uses fringe financial institutions and why they do so. Within Canada, these studies have focused on large urban centres such as Vancouver, Winnipeg and Toronto. Relatively little is known about whether the information gathered from these studies is also applicable to smaller, rural communities. In this study, we provide survey data from Prince George, a city of 75,000 in the interior of British Columbia. As well as adding this new geographic dimension, our survey is also unique in that it contains a substantial number of Aboriginal respondents. We are therefore able to analyze whether responses from this group are similar to that of the non-Aboriginal population. This information is important for designing effective policy responses.
1 We are grateful to Dr. Jerry Buckland, Menno Simons College, University of Winnipeg, for his comments on this report. We are also grateful to Gail Curry, UNBC Data Librarian, for her assistance in the construction of Appendix Figure 1. 2 Regulations introduced on September 30, 2003 aimed at ensuring access for basic banking services, enabled Canadians to cash a federal government cheque for less than $1500, free of charge, at any bank and to open a basic retail account with no minimum deposit. Nevertheless, the Financial Consumer Agency of Canada has reported significant non-compliance with some aspects of the legislation during its ‘Mystery Shopper’ exercises. 3 A distinction is often made between cheque cashing and payday loans, the two services which are the predominant ones offered by fringe financial institutions. However, the line does become blurred, when as the Shareholder Association for Research and Education (SHARE) explains, “cheque cashing becomes a form of lending when a person doesn’t have a bank account or his/her account balance is less than the value of the cheque and the 5-day hold is onerous. When the cheque is cashed at a fringe outlet the fee for this service can be understood as the interest on a 5-day loan.” (SHARE, 2007). We do not consider here, informal borrowing from bars, corner stores, friends etc. although we do include the traditional pawnshops as fringe financial institutions. 4 See also Buckland et al (2007) Figure 6, which shows a seven fold increase in the number of payday lenders and cheque-cashing stores in Winnipeg between 1999 and 2003.
4
In the next section, we provide an overview of FFIs and their changing regulatory environment. In section 3, we provide estimates of the size of the unbanked population in Prince George. In section 4, we provide a description of our survey and the methodology which we used to collect the data. Section 5 is then focused on the question of who uses fringe financial institutions in the city and how this compares with the results of other surveys. We then turn attention, in Section 6, to an analysis of the reasons why people use fringe financial institutions. The policy implications of our findings are then discussed in Section 7. 2.0 Overview of Fringe Financial Institutions and the Regulatory Environment The growth of fringe financial institutions (FFIs) has been common to many cities across Canada. Nationally, the main players are Money Mart, Rentcash (which operates Cash Stores, Instaloans as well as Insta-rent stores which usually operate in The Brick and United Furniture Warehouse stores) and Cash Money. (See Kitching and Starky 2006: 5-6). The proliferation of these FFIs has raised a number of important issues. The first is why we should see such an increase and what are the underlying causes? A common answer to this question places the rise of FFIs within a broader account of the transformations that have been underway in Canada and elsewhere as part of the shift towards neoliberal economic policy. This has led to increased income polarization, the increased causalization of work, a weakening of the social safety net, the rise of social exclusion and income insecurity, and corporate concentration. These broad shifts have resulted in social phenomena such as homelessness and food banks, phenomena that were largely absent from Canadian society before the 1990s. FFIs form part of this wider trend, drawing their clients from low-income Canadians who are excluded from the mainstream of economic life, who may have needs for immediate cash and who do not have the capacity to borrow from mainstream lenders because of employment insecurity or uncreditworthiness. Instead, FFIs step in and provide financial services to those who are too risky for the mainstream financial institutions. Kempson, Atkinson and Pilley (2004: 2) find that the level of income inequality in six developed countries including Canada is positively related to the level of financial exclusion. Countries which have experienced rising income inequality with the shift to neoliberalism can therefore expect to also experience rising financial exclusion and increasing use of FFIs. The wave of bank branch closures which has swept Canada since the mid-1990s further exacerbates the problem of financial exclusion, this time geographically, as it is often argued that these closures have been concentrated in low-income neighbourhoods and that the FFIs have moved into the void (ACORN Canada, 2004; Buckland et al 2005). This explanation for the growth of the FFIs typically views them as a major problem, as a symptom and sometimes as a (reinforcing) cause of poverty (see Buckland 2008). The relationship between FFIs and their clients is seen as ‘exploitative’ with the appropriate
5

policy response being not only regulation but, just as importantly, the provision of alternatives and addressing the underlying causes of financial exclusion.5 A more benign interpretation, advanced not least by the Canadian Payday Loans Association itself, the voluntary-membership industry association formed in 2004, argues that the rise of FFIs cannot be reversed and points to the fact that they offer services that mainstream financial institutions are unwilling to offer, serve as a competitive force in a sector in which there are few barriers to entry, and attract customers by providing a better and/or more appropriate service.6 The higher interest rates are the result of handling a large number of small transactions with a riskier client base. With respect to regulation, the FFIs have until very recently operated within a generally unregulated environment, since they are not deposit-taking institutions and hence have fallen outside of the regulations placed on the mainstream financial sector. There have been elements of self-regulation, managed under the auspices of the Canadian Payday Lenders Association. Furthermore, at the federal level, section 347 of the Criminal Code, passed in 1980, sets the maximum legal rate of interest for loans at 60 per cent per annum, a figure which explicitly includes the various fees which are often charged by the FFIs as disguised interest charges7. Despite this federal regulation, it is widely reported that interest rates charged by FFIs often far exceed these levels with ACORN (2004: 1), for example, arguing that “payday lenders typically charge between 300 – 900% and, not infrequently, more than 1000%”. Federal amendments to section 347 the Criminal Code passed in 2007 allow provinces to impose their own regulations. It has been argued that, should the federal law be strictly enforced, that FFIs would disappear and that their clients might be driven to borrow from even more egregious sources such as ‘loan sharks’ or even organized crime (Pyper, 2007: 5). Many provincial governments, including BC, have therefore opted for an approach which accepts the rise of FFIs but which seeks to regulate them. This is done through licensing requirement and regulations on the types of loans which can be provided (so that rollover loans, for example, are not permitted) and the amount of information that must be provided to borrowers.8 This provincial regulatory option, which replaces the provisions of section 347 of the federal Criminal Code, was exercised by the BC government in 2009 and includes regulation of maximum charges. As of November 1, 2009, all payday loan companies in BC were required to be licensed by Consumer Protection BC (formerly the Business Practices and Consumer Protection Authority). As part of this licensing, all payday lenders are restricted to charging a maximum of “23 percent of the amount borrowed in interest and fees” on loans of up to $1500 that are short-term (defined as any loan period
5 See Buckland et al (2007) for a discussion of the term ‘exploitation’ in the context of payday loans. 6 The degree of competition between the mainstream and fringe financial institutions may be overstated to the extent that the former have become involved in the ownership of the latter. See ACORN Canada (2007). 7 See Kitchin and Starky (2006) 8 See Kitching, Starky and Bergevin (2007).
6
up to 62 days).9 This allows for annual interest payments considerably in excess of the federal Criminal Code provisions and, in fact, does more to protect the profits of the industry and decriminalize usury than to protect the consumer. Given that the average pay day loan in Canada is $280 for a 10 day period (Kitching and Starky, 2006), in BC a payday lender can now legally charge $64.40 for this transaction. This computes to a nominal annual percentage rate of interest (APR) of 839.5 per cent.10 As a point of reference, the Bank of Canada’s bank rate is 1 per cent and a typical credit card carries a 19.5 per cent APR. The new regulated figure of $23 per $100 of loans is consistent with third party studies examining the cost structure of the payday loan industry. Kitching and Starky (2006: 9-10), for example, refer to “an Ernst & Young report commissioned by the CPLA estimated the cost of providing payday loans to be $15.35 to $21.22 per $100 of loans, depending on the size of the business. Operating costs and the cost of loans not recovered within 90 days (i.e. “bad debts”) are the two largest cost components – representing 67 per cent and 26 per cent of total costs on average – while the cost of capital accounts for a relatively small proportion of the total.” The Ernst & Young report suggested that payday lenders, facing a cost structure with a high proportion of operating costs that do not vary with the size or term of the loan, “cannot recover their costs by charging the 60% per annum interest rate permitted under the Criminal Code.” A second study by Ernst & Young in 2009 focusing on Ontario concluded that the average cost per $100 pay day loan was between $21.50 and $22.07.11 A study done by Deloitte and Touche in BC in 2008 estimated the cost per $100 loan to be $25.51. Introducing provincial legislation to replace the provisions of the Criminal Code has proven popular across Canada. Provinces adopting this approach, in addition to BC, are Alberta, Saskatchewan, Manitoba, Ontario, New Brunswick and Nova Scotia with legislation under discussion in Prince Edward Island. All provinces with legislation require payday lenders to be registered with the province and all set maximum charges. Nova Scotia maintains the federal legal maximum of a 60 per cent annual interest rate but then permits the addition of various “fees” up to a cap of fees plus interest of $31 per $100 of loans. Other provinces just set a limit on total charges per $100 loan without specifying what the interest component must be; this total ranges from $17 in Manitoba, to $21 in Ontario and $23 in both BC and Alberta. Having regulated the industry in this way, most Provinces have stepped back from finding alternatives to FFIs believing that the regulation itself is sufficient to protect the public interest.
9 Other regulations in the BC legislation require that payday lenders post rates and fees, cannot offer more than one loan at a time, rollover loans, or provide a loan for more than 50 per cent of the borrower’s next paycheque. See “Government Moves to regulate Payday Lenders”, Ministry of Public Safety and Solicitor General, Press release, March 2, 2009, and “New Rules for Payday Loans in Effect November 1”, Ministry of Public Safety and Solicitor General, Press release October 29, 2009. 10 Calculated using the Governemnt of Alberta’s payday loan calculator. See http://www.servicealberta.gov.ab.ca/1608.cfm 11 See Ernst & Young (2009: 2). The first figure is the weighted average figure; the latter the unweighted average.
7
However, as demonstrated above, the average payday loan in Canada is now legally attracting high triple digit APRs; 839.5 per cent in the cases of BC and Alberta. This cannot be viewed as a satisfactory outcome and concerns still persist that many low-income Canadians without access to regular banking services are paying interest rates which are, under any reasonable definition, clearly excessive. An understanding of how many individuals are unbanked, who uses FFIs and why, remains important for devising further policy responses. In the next section, we analyze these questions for the city of Prince George. 3.0 Estimating the size of the Unbanked Population in Prince George Prince George, located in the central interior of BC, has experienced many of the same trends as other locations. There has been an increase in FFIs with the number of FFI outlets now comparable to the number of bank and credit union branches. See Appendix 1 for lists of the two types of institutions now operating in the city. The presence of this number of FFIs, which range from pawn shops to pay day loan lenders and include the major FFIs such as Money Mart and Insta-Cash, in a city of less than 80,000 would seem to indicate a high level of usage of FFIs. One obvious category of users is the ‘unbanked’ population, i.e. those without a bank or credit union account. Estimating the size of the unbanked population is, however, a difficult task and must be done by applying national survey results to city data. The estimated population in Prince George, BC, in 2009 was 74,547 (BC Stats Community Profile). The distribution of the population by selected age group is given in the 2006 census as: 15+ 80.8 per cent 15-69 74.4 per cent 20-69 66.8 per cent These distributions can then be applied to the 2009 population estimate in order to derive the estimated population in the selected age categories in Prince George in 2009 as: 15+ 60, 234 15-69 55,686 20-69 49,797 Estimates for the unbanked population in Canada generally come from few sources. One is the Mackay Report (Task Force on the Future of the Canadian Financial Services Sector, 1998). Its estimate for the ‘unbanked population’ in Canada (i.e. those not having a bank account) is 3 per cent (for those 18 years of age and older). It further estimated that among low income Canadians the incidence of being unbanked was 8 per cent. With respect to other sources, Buckland and Dong (2008: 253) report that “the 1999 Survey on Financial Security found that 13 per cent of its respondents were without a bank account with a nonzero balance. More recent surveys have generated varied results,
8

too. The FCAC-sponsored [Ipsos-Reid] survey in 2005 found that 3 per cent of the respondents did not have a bank account … However, Visa International and the Commonwealth Business Council (2004) claimed that 15 per cent of Canadians 15 years old and above are unbanked.” Estimates of the size of the unbanked population therefore range from 3 per cent to 15 per cent. The variation in the size of the estimate depends in part on whether “unbanked” is being defined strictly as those with no bank account or whether it also includes those who have bank accounts but have a zero balance. Nevertheless, it is clear that it is difficult to calculate a single figure given the range of estimates. Applying this range of estimates to the Prince George population estimates for 2009 produces the following estimates for the size of the unbanked population in Prince George: Table 1: Estimates of the size of the unbanked population in Prince George, 2009 Age Category Total
Population Method 1: 3% unbanked
Method 2: 3% unbanked plus 8% unbanked for low income households (1)
Method 3: 15% unbanked
15+ 60,234 1807 2138 9035 15-69 55,686 1670 1977 8353 20-69 49,797 1494 1768 7470 Note: (1) This is calculated as being 3 per cent of 89 per cent of the total population and 8 per cent of the remaining 11 per cent of the population. The 2006 Census indicates that 11 per cent of the Prince George population is classified as living in ‘low income economic families’ using Statistics Canada definitions. The estimates show a large range – from 1494 to 9035 depending on the age category and estimating method used. The reliability of the methodology used in the source survey and the use of cross-country comparisons may shed some light on where within this range the best estimate might be. In this respect, it is noteworthy that Buckland and Dong (2008) regard the Mackay Report and the FCAC figures as under-estimates given that both relied on telephone survey techniques which are likely to under-represent the poor in their surveys; this suggests that both methods 1 and 2 may be on the low side. In terms of comparisons with other countries, Buckland and Dong (2008: 253) conclude that “the level of financial exclusion in Canada is close to that found in the United Kingdom, where it stands at between 6% and 9% … estimates of the underbanked (having no more than one or two mainstream bank products) add an additional 20% to these figures … Studies in the United States place the unbanked at double these levels, ranging from 12% to 13.5% of the population, but they place financial exclusion as high as 41% among low-income people.”
9

An alternative methodology of interviewing mainstream banks’ managers in Prince George and asking them for information on the number of account holders that they had, and thereby estimating the size of unbanked population based on the banked population, was also tried to narrow the estimate range. However, this proved unsuccessful for two reasons. Firstly, only a small number of banks were willing to reveal this information. This could still have led to estimates based on their market shares (although this is not collected at the municipal level). In any case, a second problem arose, namely those banks which did cooperate were only able to report the number of accounts not the number of account holders. Given the practice of individuals holding multiple accounts the number of accounts is a substantial overestimate of the size of the banked population. For this reason, the estimates used by the national studies identified above were used to create Table 1. Table 1 provides a range of estimates for the size of the unbanked population in Prince George. However, given the prevalence of FFIs in the city, rivaling that of the mainstream financial institutions, it is likely that FFIs draw their client base beyond the unbanked even if we use the higher end estimates. The concept of the ‘underbanked’, that is, those who might make some use of the mainstream financial institutions and services but who also use FFIs might be of more applicability. This is analyzed further in section 5. First, we examine who the users of FFIs are likely to be before turning to their reasons for doing so. 4.0 Who Uses FFIs? 4.1 The location of FFIs One way of obtaining a rough picture of who might use FFIs is to see where the FFIs are located. It has been argued, as noted above, that FFIs tend to be located in low-income neighbourhoods which are often underserved by mainstream financial institutions, in part because of recent branch closures. Appendix Figure 1 shows the location of FFIs, mainstream financial institutions and of bank branch closures. It can be seen that FFIs are not primarily located in low-income neighbourhoods per se, but are found predominantly in non-residential areas, a pattern also found with the mainstream financial institutions. The findings from the larger urban centres are not replicated straightforwardly in the Prince George case. Rather, in the latter, the FFIs are concentrated in two parts of the downtown area. One is located near a number of low cost hotels and rental properties and service facilities catering to the homeless, youth, Aboriginal and low-income populations. There have been two branch closures in this area. The other is close to the Ministry of Housing and Social Development Office which distributes income assistance and other cheques. That said, the distances between mainstream and FFIs is small, no more than a couple of blocks at most and so location might not be thought to be a major factor in choosing which institution to use, a hypothesis which we consider further in section 5.
10
A further source of information of FFI usage comes from survey data to which we now turn. 4.2 Survey Data Kitching and Starky (2006) report national survey results undertaken on behalf of the Financial Consumer Agency of Canada which found that 7 per cent of respondents had used a cheque-cashing or payday loan company. The survey results found that the most likely users were: men; aged between 18-34; urban residents; residents of BC, Alberta, Saskatchewan and Manitoba; those with household incomes less than $30,000 per annum; and, those with some post-secondary education. Pyper (2007: 11), based on the 2005 Survey of Financial Security reports that “age is the key. Young families were three times more likely to have used payday loans than those aged 35 to 44, after controlling for other family characteristics”. She also reports (2007: 11-12) that “families with little savings or no credit cards, particularly those who had been refused, were significantly more likely to have used payday loans …. Almost half of families who used payday loans had no one to turn to if they faced financial difficulty”. Buckland and Dong (2008: 258) used the 1999 Survey on Financial Security to examine this question and concluded “that the financially excluded are most likely to be households that have lower incomes, have less net worth, have no RRSPs, do not own a home, have more children, receive government transfers, are sole parents, are less educated, and have no one to turn to to cushion financial crisis.” Simpson and Buckland (2009: 975), using both the 1999 and 2005 surveys, found that “factors such as education, age, and home ownership, often cited in the international literature, are also found to be significant factors explaining the incidence of financial exclusion and credit constraint” in the Canadian context. In comparing payday loan users in Canada with those in the US, Buckland et al (2007) report that “the core group of payday loan clients in Canada are similar, but not identical, to those in the US. The core group are of clients who are characterized by young, low- and modest middle-income people who are credit constrained. One characteristic that may distinguish clients in the two countries is their ethnic background. While it has been found to be an important characteristic in the US it is not clear that it is as important in Canada.” In contrast to this, Kempson, Atkinson and Pilley (2004) argue that there may be psychological and cultural barriers to the use of mainstream financial institutions which tend to impede the use of services by indigenous peoples, a finding that may be of relevance in Prince George which, according to 2006 Census data, has an Aboriginal population of 11 per cent. We discuss our Prince George survey methodology and results below. 4.2.1 Survey Methodology12 12 We would like to acknowledge and thank Jonathon Alec, Pat Coon, Jana Chouinard, Graeme Ireland, and Cody Krause for their excellent work conducting the survey.
11

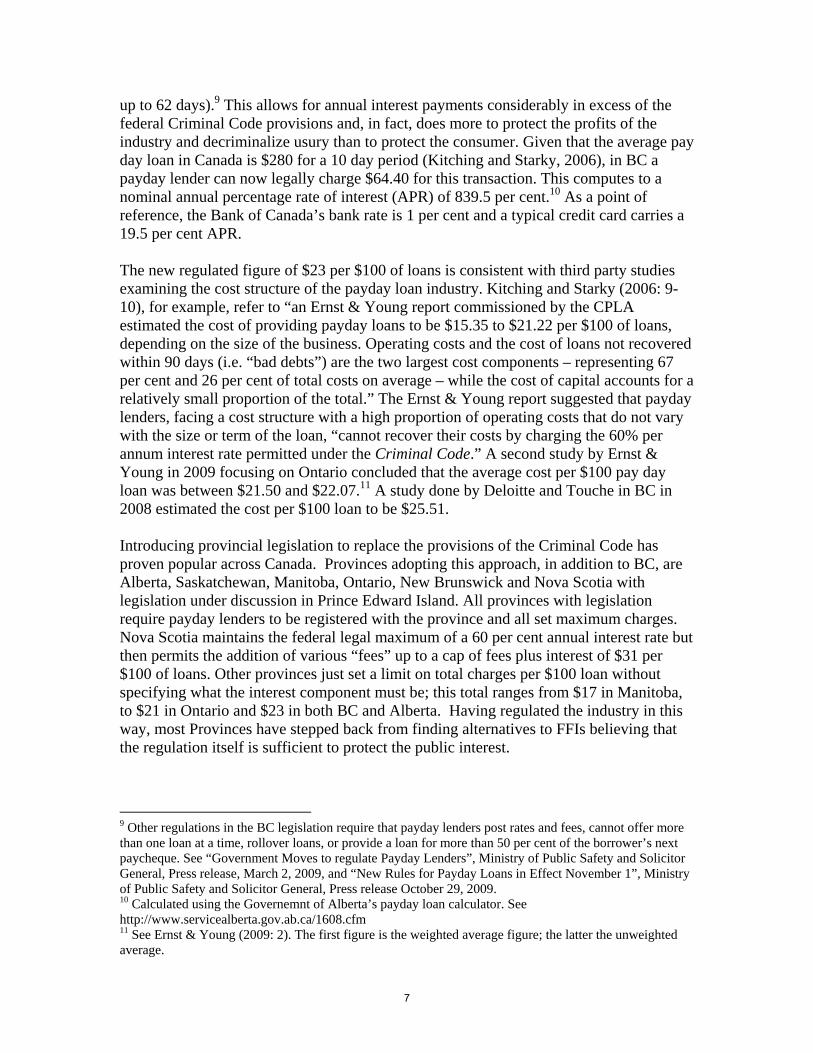
Questionnaire surveys were administered to 176 clients exiting FFIs on 15 days between September 9, 2009 and April 21, 2010. Days were largely randomly chosen although it was decided to include the penultimate Wednesday in two months as this is the day on which income assistance cheques are issued. Two main locations were chosen for the surveys corresponding to the two locations with the largest geographic concentration of FFIs shown in Figure 1. Survey respondents were randomly selected and the sample reflects those who were willing to participate in the survey. There were a significant number of refusals and these tended to be biased towards those who had driven to the FFI opposed to those who were on foot. Our sample, in contrast to the telephone survey method typically used in other studies, therefore probably over-represents the lowest income group. 4.2.2 Survey Results The national surveys reviewed above point to the importance of age, gender, education, income and asset position as determinants of FFI usage. We first report on whether these factors are also important for FFI users in Prince George. In terms of age, we find that, contrary to the findings from national surveys, the average age group most represented in FFI users in Prince George is 35-44 as shown in Figure 2 below, much older than the other surveys reported.
18-24 20.5% 25-34 26.7% 35-44 33.0% 45-54 14.8% 55-64 3.4% 65-74 1.7%
12

Total 100.0% Note: N=176
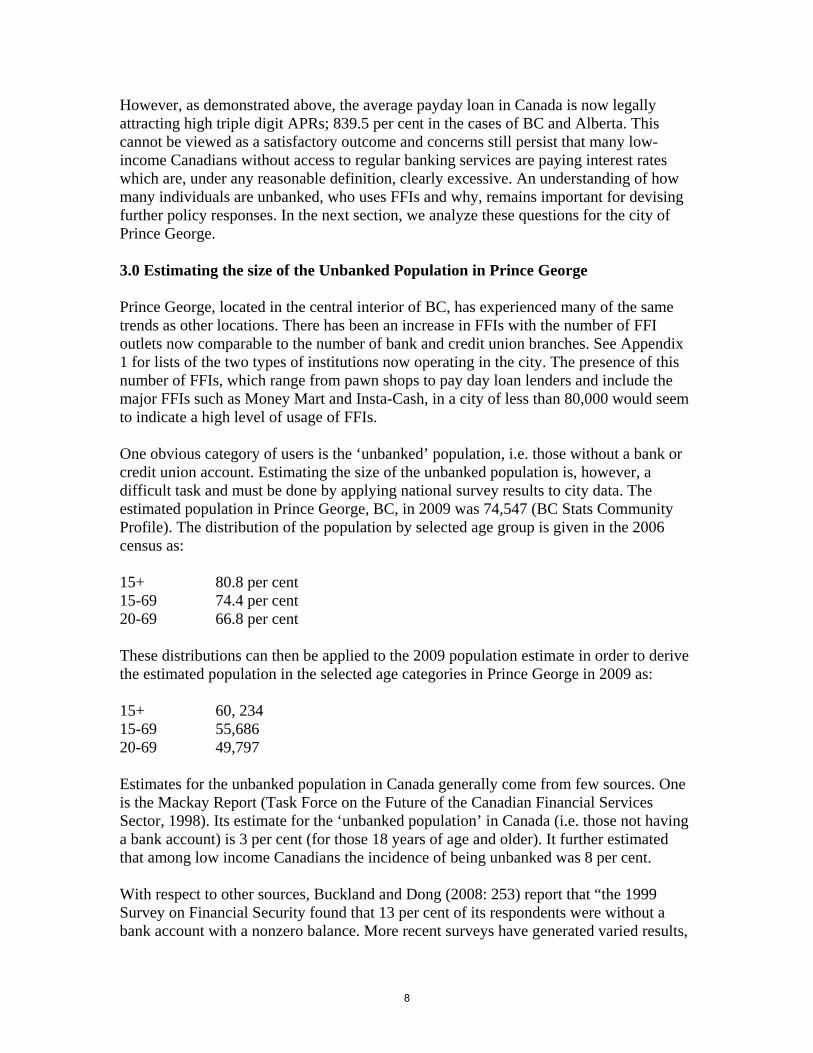
The male bias found in national surveys is replicated in Prince George, as shown in Figure 3, although it should be noted that a significant number of FFI users are female.
Female 43.2% Male 56.8% Total 100.0% Note: N=176
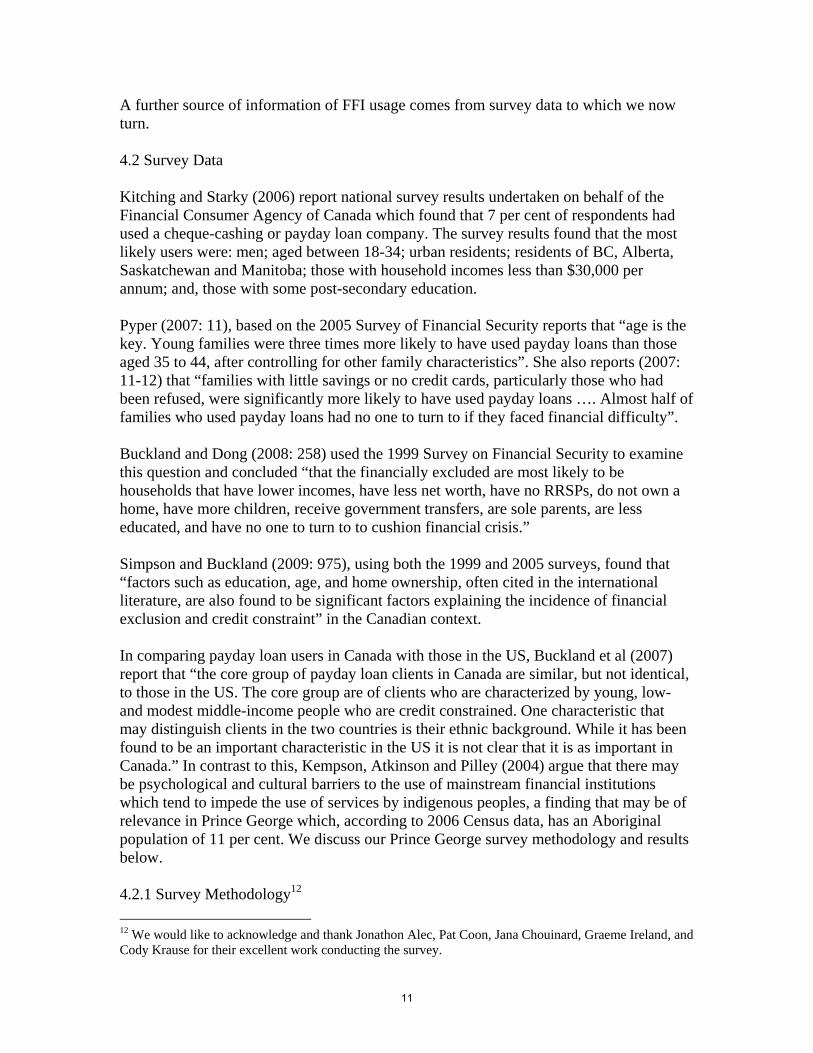
The most common educational level, shown in Figure 4, is “some high school” which is consistent with patterns found in national surveys.
13
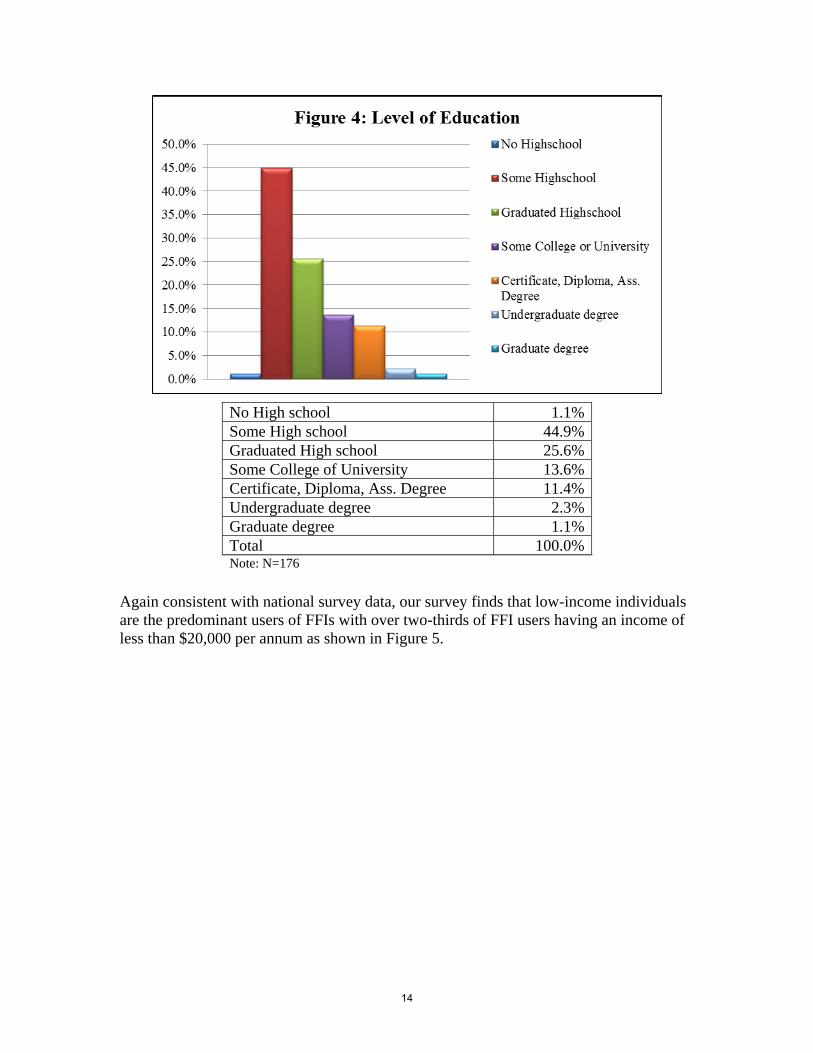
No High school 1.1% Some High school 44.9% Graduated High school 25.6% Some College of University 13.6% Certificate, Diploma, Ass. Degree 11.4% Undergraduate degree 2.3% Graduate degree 1.1% Total 100.0% Note: N=176
Again consistent with national survey data, our survey finds that low-income individuals are the predominant users of FFIs with over two-thirds of FFI users having an income of less than $20,000 per annum as shown in Figure 5.
14

0-$9,999 39.8% $10,000-$19,999 27.7% $20,000-$29,999 13.3% $30,000-$39,999 9.6% $40,000-$49,999 4.2% $50,000 and over 5.4% Total 100.0% Note: N=166
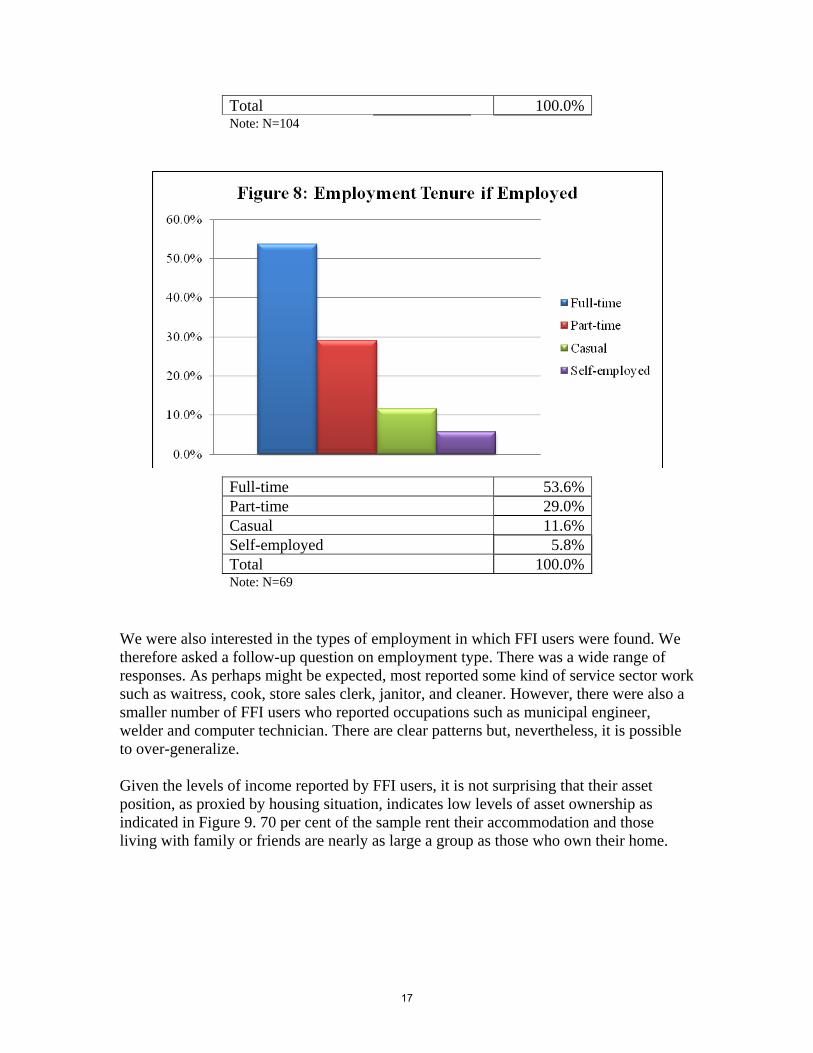
To examine further the income dynamics of the sample, we also asked questions concerning employment status and main income sources. Figure 6 shows that 60 per cent of the sample was currently unemployed and only 40 per cent were employed. For those who were unemployed, a supplementary question on main sources of income was asked. The results are shown in Figure 7 which shows that income assistance was the main source of income for the largest number of respondents, although there were also significant numbers who relied on disability payments and employment insurance for their income. For those who were employed, a supplementary question on employment status was asked. These results, shown in Figure 8, show that the majority of those who worked and used FFIs were employed full-time.
15

Unemployed 60.2% Employed 39.8% Total 100.0% Note: N=176
Employment Insurance 16.3% Income Assistance 44.2% L/T or S/T Disability 20.2% Old-age Pension 2.9% Retirement Savings 1.0% Other 15.4%
16
Total 100.0% Note: N=104
Full-time 53.6% Part-time 29.0% Casual 11.6% Self-employed 5.8% Total 100.0% Note: N=69
We were also interested in the types of employment in which FFI users were found. We therefore asked a follow-up question on employment type. There was a wide range of responses. As perhaps might be expected, most reported some kind of service sector work such as waitress, cook, store sales clerk, janitor, and cleaner. However, there were also a smaller number of FFI users who reported occupations such as municipal engineer, welder and computer technician. There are clear patterns but, nevertheless, it is possible to over-generalize. Given the levels of income reported by FFI users, it is not surprising that their asset position, as proxied by housing situation, indicates low levels of asset ownership as indicated in Figure 9. 70 per cent of the sample rent their accommodation and those living with family or friends are nearly as large a group as those who own their home.
17

Rent 70.3% Own 12.6% Live with Family or Friends 10.9% Community Residence 3.4% No Home 2.9% Total 100.0% Note: N=175
The results presented above indicate that the characteristics of the FFI users in Prince George match those of national surveys as being low income individuals with low levels of asset ownership. The FFI users are also predominantly male in line with national survey results although women are also significant FFI clients. In contrast to national survey results, however, we find a higher age cohort in our survey. Looking behind the income data we find that well over half of the FFI users are unemployed and rely on a range of government transfers (with social assistance, disability payments and employment insurance being the three most frequent); amongst the employed FFI users, most work full-time. Our results are consistent with the view that Canada has a dualistic financial institution structure in which low income individuals are more likely to use FFIs than higher income individuals (who are more likely, in turn, to use mainstream financial institutions). Our survey also asked respondents to self-identify on the basis of race/ethnicity. The results are presented below in Figures 10 and 11.
18
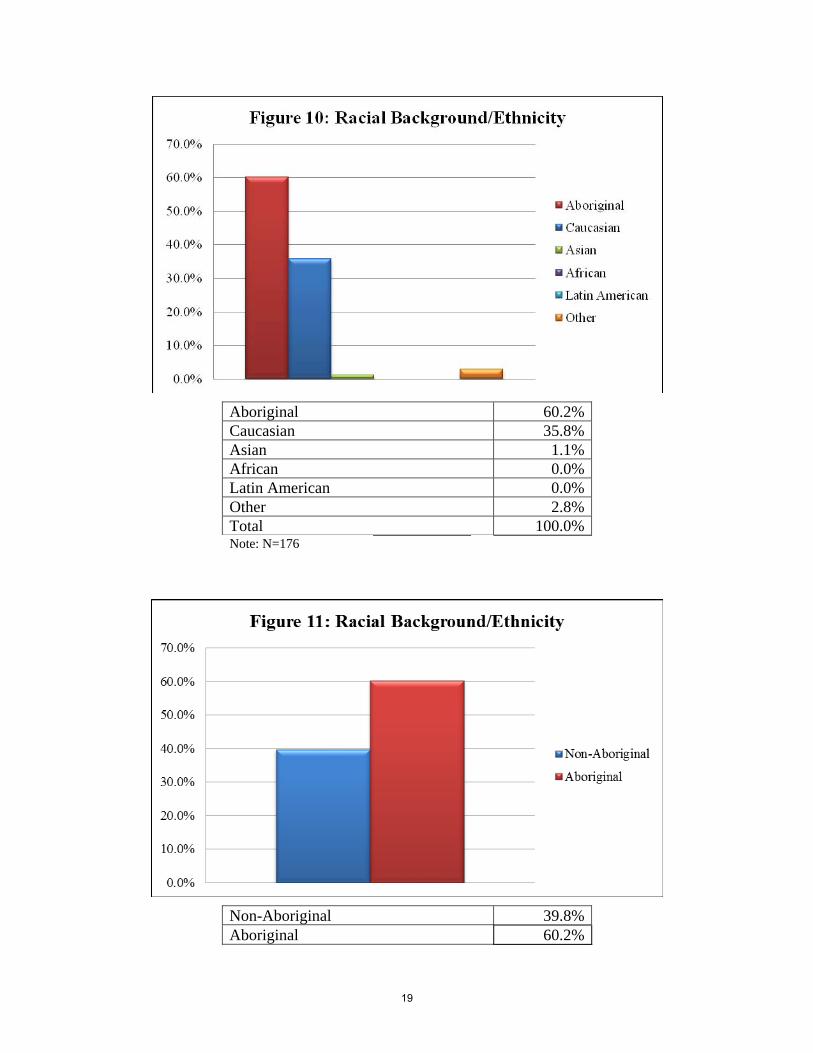
Aboriginal 60.2% Caucasian 35.8% Asian 1.1% African 0.0% Latin American 0.0% Other 2.8% Total 100.0% Note: N=176
Non-Aboriginal 39.8% Aboriginal 60.2%
19
Total 100.0% Note: N=176
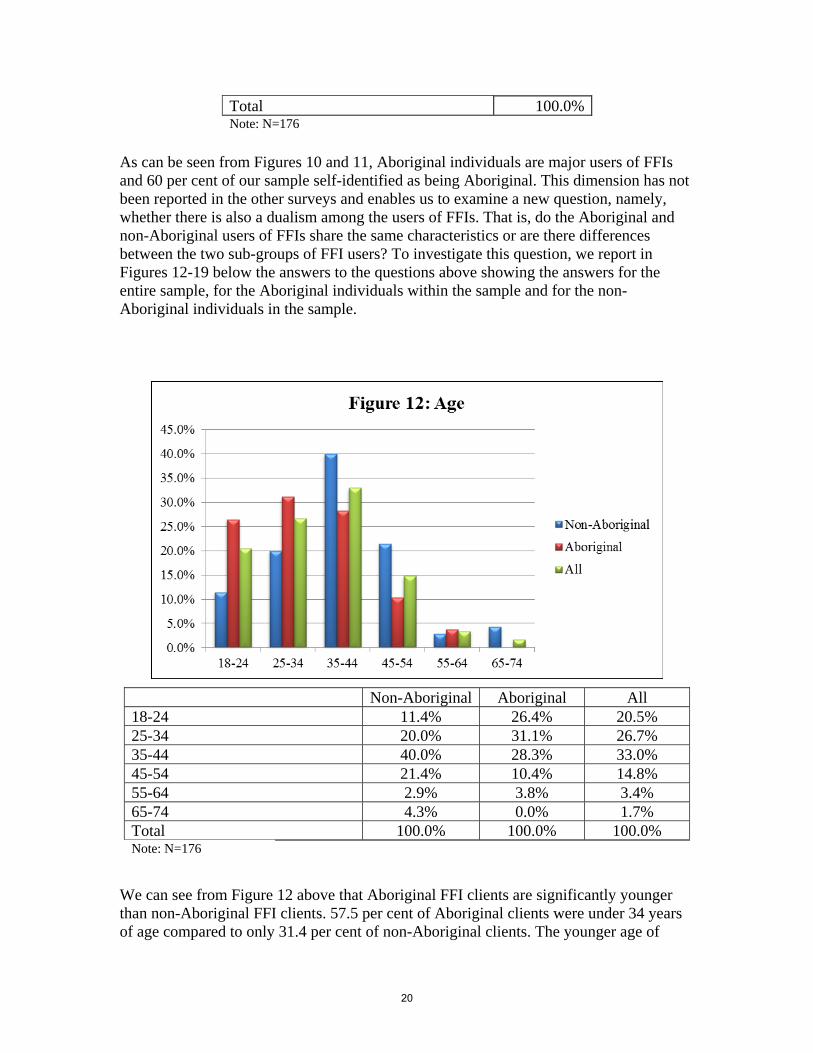
As can be seen from Figures 10 and 11, Aboriginal individuals are major users of FFIs and 60 per cent of our sample self-identified as being Aboriginal. This dimension has not been reported in the other surveys and enables us to examine a new question, namely, whether there is also a dualism among the users of FFIs. That is, do the Aboriginal and non-Aboriginal users of FFIs share the same characteristics or are there differences between the two sub-groups of FFI users? To investigate this question, we report in Figures 12-19 below the answers to the questions above showing the answers for the entire sample, for the Aboriginal individuals within the sample and for the non-Aboriginal individuals in the sample.
Non-Aboriginal Aboriginal All 18-24 11.4% 26.4% 20.5% 25-34 20.0% 31.1% 26.7% 35-44 40.0% 28.3% 33.0% 45-54 21.4% 10.4% 14.8% 55-64 2.9% 3.8% 3.4% 65-74 4.3% 0.0% 1.7% Total 100.0% 100.0% 100.0% Note: N=176
We can see from Figure 12 above that Aboriginal FFI clients are significantly younger than non-Aboriginal FFI clients. 57.5 per cent of Aboriginal clients were under 34 years of age compared to only 31.4 per cent of non-Aboriginal clients. The younger age of
20
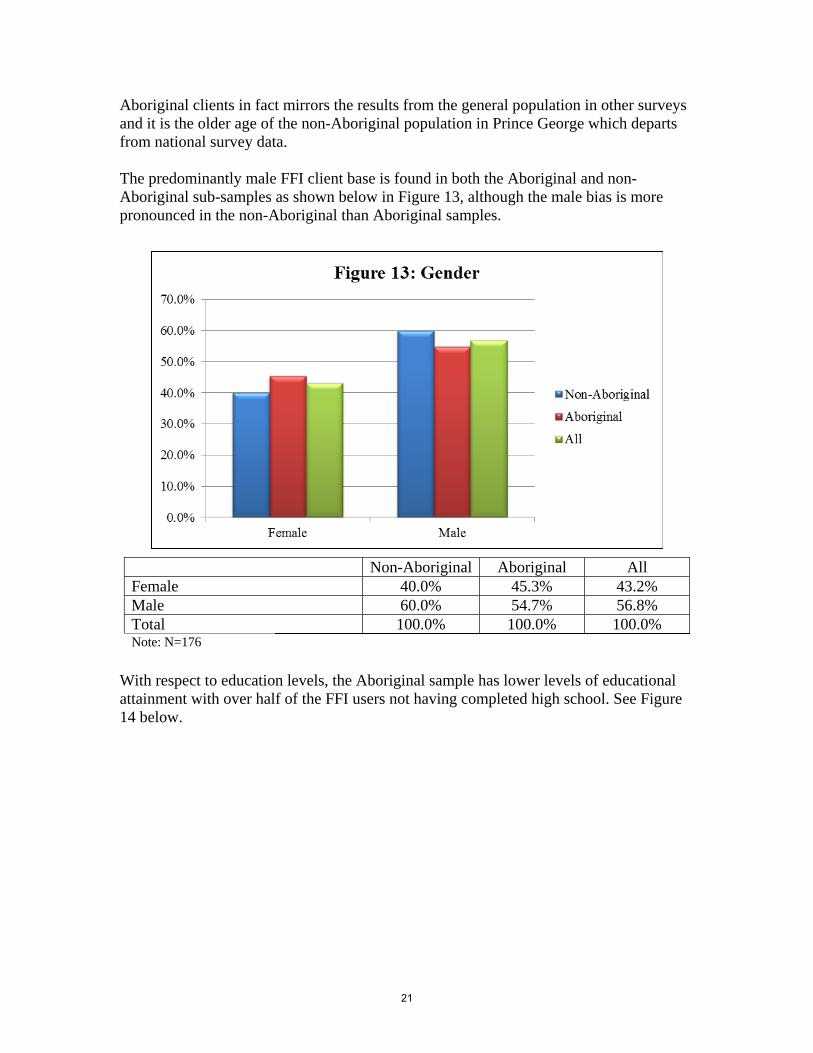
Aboriginal clients in fact mirrors the results from the general population in other surveys and it is the older age of the non-Aboriginal population in Prince George which departs from national survey data. The predominantly male FFI client base is found in both the Aboriginal and non-Aboriginal sub-samples as shown below in Figure 13, although the male bias is more pronounced in the non-Aboriginal than Aboriginal samples.
Non-Aboriginal Aboriginal All Female 40.0% 45.3% 43.2% Male 60.0% 54.7% 56.8% Total 100.0% 100.0% 100.0% Note: N=176
With respect to education levels, the Aboriginal sample has lower levels of educational attainment with over half of the FFI users not having completed high school. See Figure 14 below.
21

Non-Aboriginal Aboriginal All No High school 2.9% 0.0% 1.1% Some High school 27.1% 56.6% 44.9% Graduated High school 27.1% 24.5% 25.6% Some College of University 21.4% 8.5% 13.6% Certificate, Diploma, Ass. degree 15.7% 8.5% 11.4% Undergraduate degree 2.9% 1.9% 2.3% Graduate degree 2.9% 0.0% 1.1% Total 100.0% 100.0% 100.0% Note: N=176
Aboriginal users of FFIs also reported lower levels of income than the non-Aboriginal respondents. Nearly 80 per cent of Aboriginal respondents reported annual incomes of less than $20,000, while just over half of non-Aboriginal respondents fell in this category. 10.3 per cent of non-Aboriginal FFI users reported incomes of over $50,000 per year.
22

Non-Aboriginal Aboriginal All 0-$9,999 29.4% 46.9% 39.8% $10,000-$19,999 20.6% 32.7% 27.7% $20,000-$29,999 16.2% 11.2% 13.3% $30,000-$39,999 19.1% 3.1% 9.6% $40,000-$49,999 40.4% 4.1% 4.2% $50,000 and over 10.3% 2.0% 5.4% Total 100.0% 100.0% 100.0% Note: N=166
Figure 16 and 17 below show some of the reasons why income levels for Aboriginal respondents are lower on average than the non-Aboriginal respondents; Aboriginal FFI users are more likely to be unemployed and more likely to be relying on income assistance as their main source of income.
23
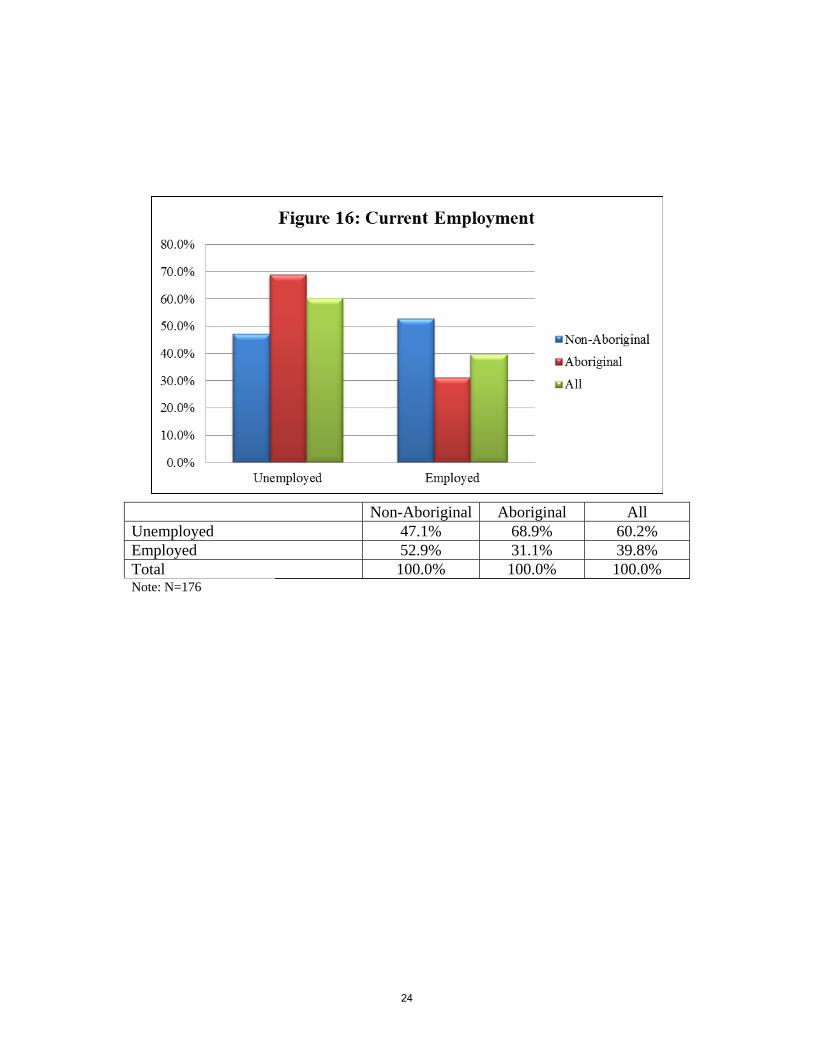
Non-Aboriginal Aboriginal All Unemployed 47.1% 68.9% 60.2% Employed 52.9% 31.1% 39.8% Total 100.0% 100.0% 100.0% Note: N=176
24
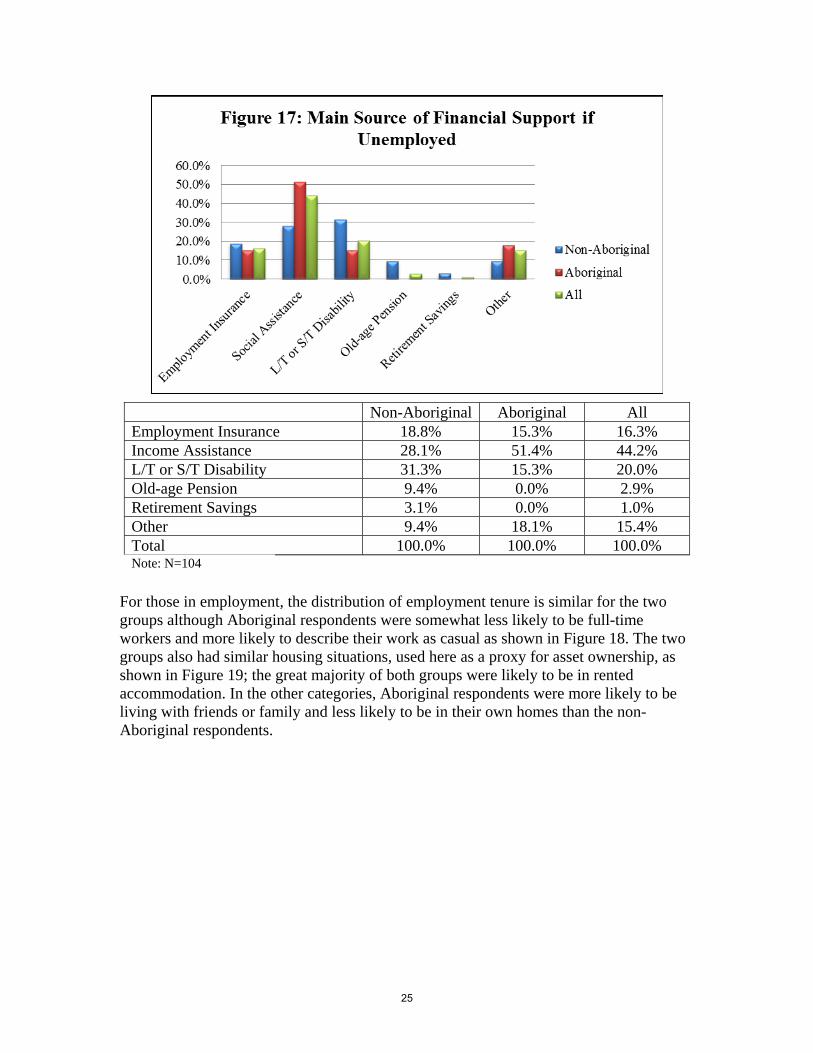
Non-Aboriginal Aboriginal All Employment Insurance 18.8% 15.3% 16.3% Income Assistance 28.1% 51.4% 44.2% L/T or S/T Disability 31.3% 15.3% 20.0% Old-age Pension 9.4% 0.0% 2.9% Retirement Savings 3.1% 0.0% 1.0% Other 9.4% 18.1% 15.4% Total 100.0% 100.0% 100.0% Note: N=104
For those in employment, the distribution of employment tenure is similar for the two groups although Aboriginal respondents were somewhat less likely to be full-time workers and more likely to describe their work as casual as shown in Figure 18. The two groups also had similar housing situations, used here as a proxy for asset ownership, as shown in Figure 19; the great majority of both groups were likely to be in rented accommodation. In the other categories, Aboriginal respondents were more likely to be living with friends or family and less likely to be in their own homes than the non-Aboriginal respondents.
25
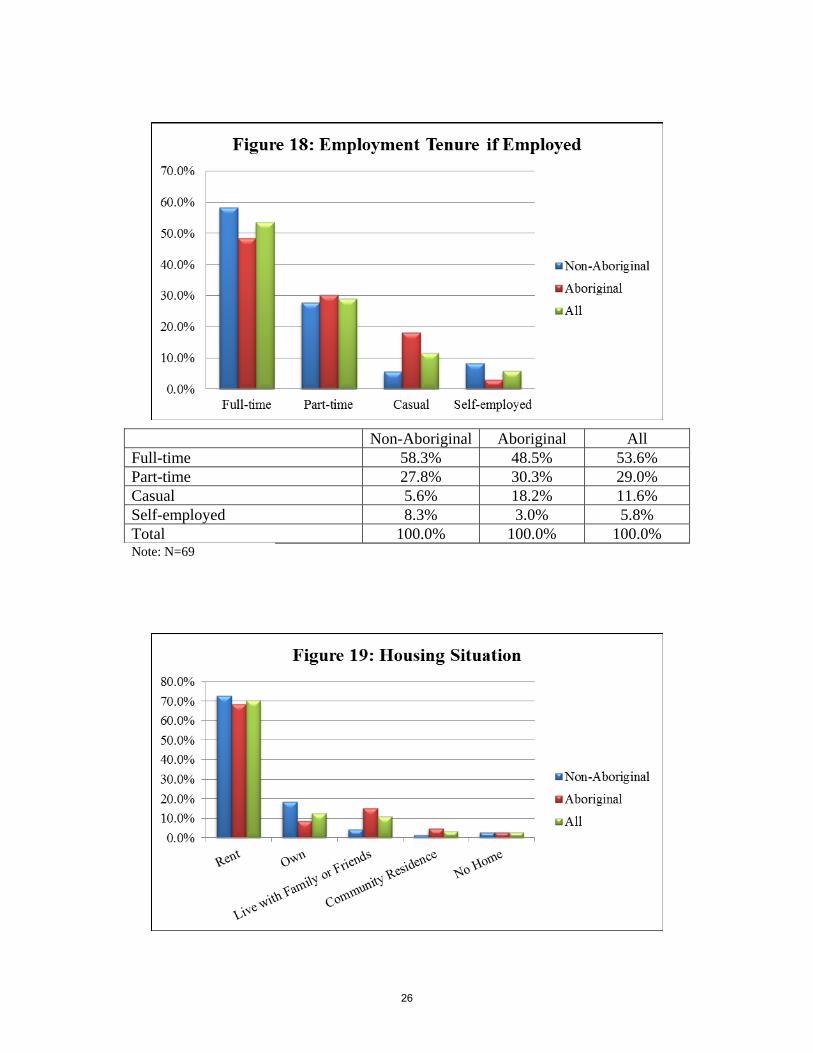
Non-Aboriginal Aboriginal All Full-time 58.3% 48.5% 53.6% Part-time 27.8% 30.3% 29.0% Casual 5.6% 18.2% 11.6% Self-employed 8.3% 3.0% 5.8% Total 100.0% 100.0% 100.0% Note: N=69
26

Non-Aboriginal Aboriginal All Rent 72.9% 68.8% 70.3% Own 18.6% 8.6% 12.6% Live with Family or Friends 4.3% 15.2% 10.9% Community Residence 1.4% 4.8% 3.4% No Home 2.9% 2.9% 2.9% Total 100.0% 100.0% 100.0% Note: N=175
The Aboriginal and non-Aboriginal users of FFIs in our sample shared some common characteristics. Both groups were predominantly in rented accommodation indicating that both had low asset ownership; both had predominantly male users. However, it is also clear that Aboriginal users of FFIs had lower incomes, less education, were more likely to be younger, more likely to be unemployed and more likely to rely on income assistance than the non-Aboriginal users. The entire sample is a relatively low income group but, within that, it appears that the Aboriginal FFI users are even less financially secure. We now turn our attention to the reasons why individuals chose to use FFIs. 5.0 Why do Clients use FFIs? 5.1. Other Survey Evidence This is a question on which less evidence is available than the studies of who uses FFIs. There are a few pointers. As noted above, Kitching and Starky (2006) report national survey results undertaken on behalf of the Financial Consumer Agency of Canada found that 7 per cent of respondents had used a cheque-cashing or payday loan company. Of these services, cheque cashing was the most frequently used service (57 per cent) followed by payday loans (25 per cent) and tax refund anticipation loans (5 per cent). With respect to the latter financial service, H&R Block is the market leader here but since November 2005, Rentcash and H&R Block have been offering the latter’s tax preparation services in Cash Store and Instaloan locations. (SHARE, 2007). Apart from offering these different services, Pyper (2007: 5) gives a number of other reasons why individuals may prefer FFIs including “the convenience, with location, hours of operation, and ease and speed of approval playing a key role … Those with a poor credit rating, a previous bankruptcy, or no bank account may not have the option of using less expensive means.” Despite these advantages, Buckland et al (2005) still report that low-income users are ambivalent about FFIs; they value the accessibility but are concerned by the high fees and interest rates. 5.2 Our Survey
27

We asked a number of questions in our survey to ascertain the degree of involvement with banks and credit unions that our respondents had. Since all of our respondents were interviewed as they exited from using a FFI, we know that they use FFIs but we were also interested in whether they were unbanked – in the sense of having no bank account at all – or whether they had some association with a bank or credit union but still preferred to use a FFI. We report the survey results first in the aggregate and then disaggregated into sample sub-groups to again see if there are differences in responses between the Aboriginal and non-Aboriginal respondents. We first report answers to the question whether respondents had ever had a bank or credit union account.
No 11.9% Yes 88.1% Total 100.0% Note: N=176
28

Non-Aboriginal Aboriginal All No 5.7% 16.0% 11.9% Yes 94.3% 84.0% 88.1% Total 100.0% 100.0% 100.0% Note: N=176
As can be seen in Figures 21 and 22, 12 per cent of the FFI users were unbanked in the sense of never having had a bank account. However, fully 88 per cent of FFI users in our sample had held a bank or credit union account at some point. The conclusion that the vast majority of FFI clients had experience with mainstream financial institutions was true for both Aboriginal and non-Aboriginal groups in our sample. Part of the explanation for this may be because for one of the main services provided by FFIs, namely payday loans, clients are required by the FFI to have a bank account although this not the case for their cheque cashing service. Even so, we wished to know how well linked FFI clients were with their bank or credit union and so we also asked interviewees if they currently used a bank or credit account regularly. The results are shown in Figures 22 and 23.
29
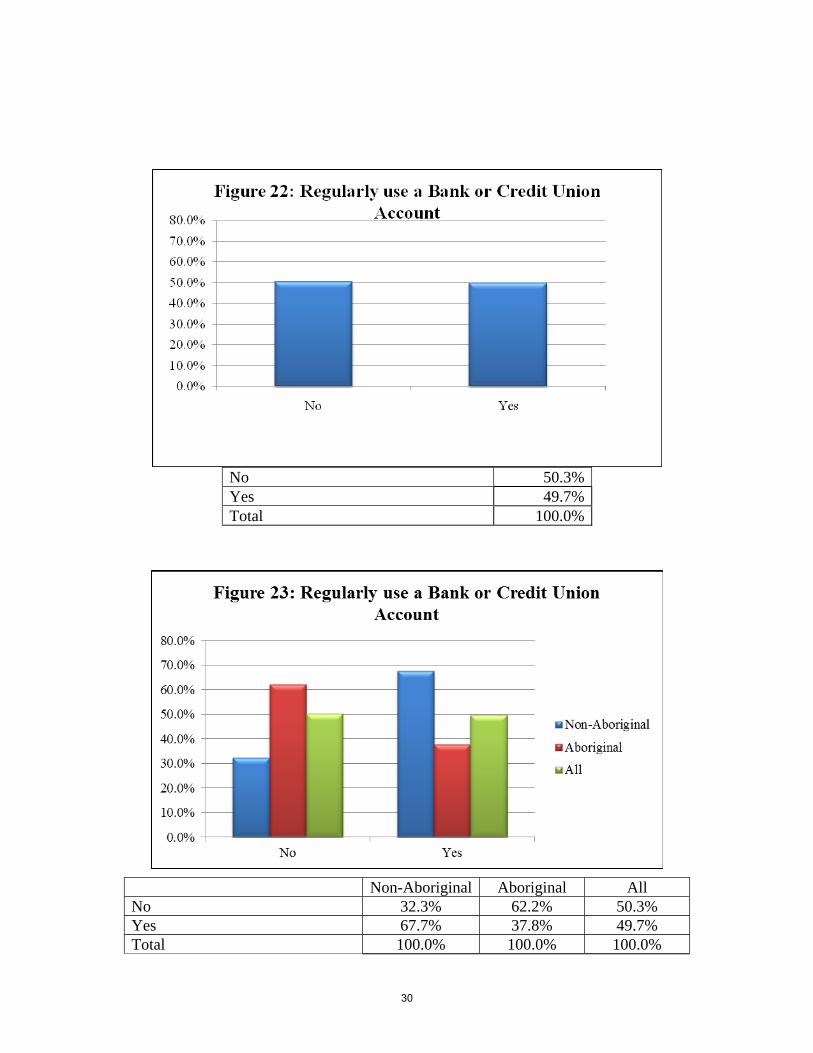
No 50.3% Yes 49.7% Total 100.0%
Non-Aboriginal Aboriginal All No 32.3% 62.2% 50.3% Yes 67.7% 37.8% 49.7% Total 100.0% 100.0% 100.0%
30

Note: N=163
As Figures 20 to 23 show, not only did the overwhelming majority of FFI users hold mainstream financial institution accounts at some point in their financial history, half of them still regularly used such accounts. While 50 per cent of our sample of FFI users could be described as currently unbanked in the sense that they did not currently regularly use a bank or credit union account, the other 50 per cent were clearly banked in an important sense and were, in fact dual users of both mainstream and fringe financial institutions. This finding is unique to our survey and has not been reported in previous studies. Disaggregation in Figure 23 shows, however, that while two-thirds of non-Aboriginal fell into this dual user category, this was the case for only one-third of Aboriginal respondents. To explore respondents’ experiences with different types of financial institutions, and to understand their reasons for using one type over another, we asked a number of questions. The first was why respondents chose not to use mainstream financial institutions and the responses are shown in Figures 24 and 25 below.13
Holds on money 13.8% Require photo ID 9.2% Could not open an account 4.1% Hours not convenient 12.8% Location not convenient 17.4% Poor treatment/feel unwelcome 6.2% Costs too much 5.6% Other 30.8%
13 Respondents were able to provide multiple reasons so we report the number of selections rather than the number of respondents in Figures 24, 25, and 32 and 33.
31
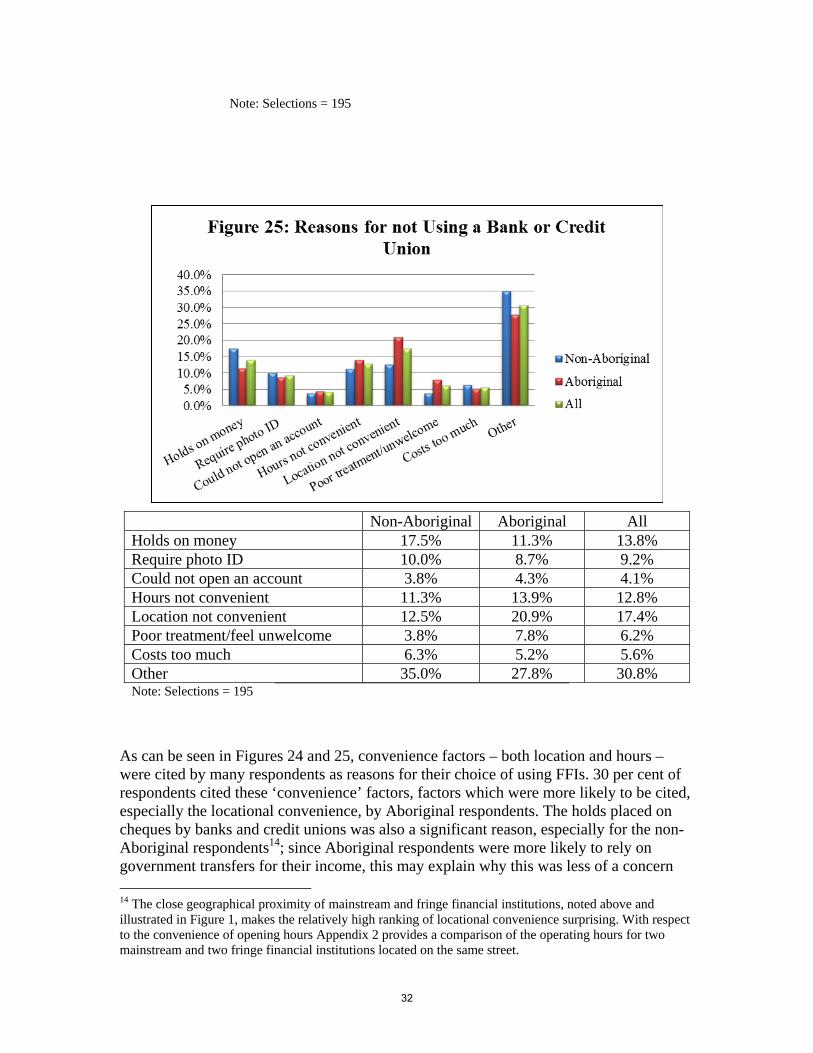
Note: Selections = 195
Non-Aboriginal Aboriginal All Holds on money 17.5% 11.3% 13.8% Require photo ID 10.0% 8.7% 9.2% Could not open an account 3.8% 4.3% 4.1% Hours not convenient 11.3% 13.9% 12.8% Location not convenient 12.5% 20.9% 17.4% Poor treatment/feel unwelcome 3.8% 7.8% 6.2% Costs too much 6.3% 5.2% 5.6% Other 35.0% 27.8% 30.8% Note: Selections = 195
As can be seen in Figures 24 and 25, convenience factors – both location and hours – were cited by many respondents as reasons for their choice of using FFIs. 30 per cent of respondents cited these ‘convenience’ factors, factors which were more likely to be cited, especially the locational convenience, by Aboriginal respondents. The holds placed on cheques by banks and credit unions was also a significant reason, especially for the non-Aboriginal respondents14; since Aboriginal respondents were more likely to rely on government transfers for their income, this may explain why this was less of a concern 14 The close geographical proximity of mainstream and fringe financial institutions, noted above and illustrated in Figure 1, makes the relatively high ranking of locational convenience surprising. With respect to the convenience of opening hours Appendix 2 provides a comparison of the operating hours for two mainstream and two fringe financial institutions located on the same street.
32
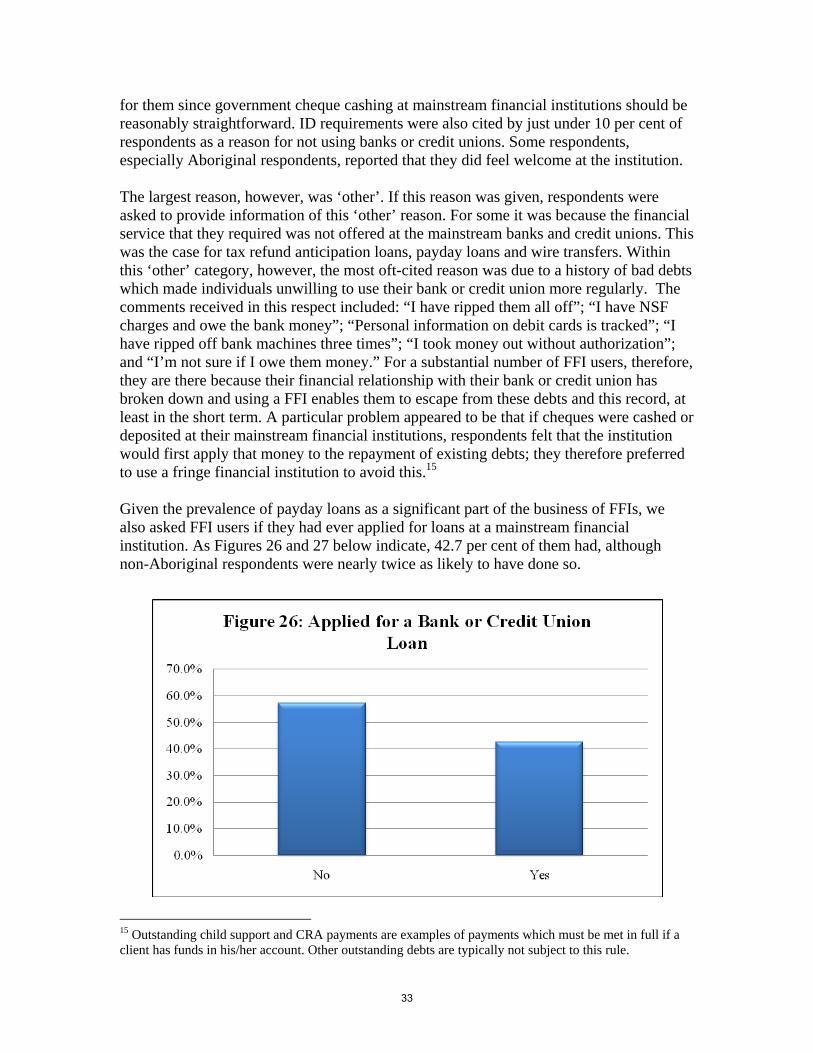
for them since government cheque cashing at mainstream financial institutions should be reasonably straightforward. ID requirements were also cited by just under 10 per cent of respondents as a reason for not using banks or credit unions. Some respondents, especially Aboriginal respondents, reported that they did feel welcome at the institution. The largest reason, however, was ‘other’. If this reason was given, respondents were asked to provide information of this ‘other’ reason. For some it was because the financial service that they required was not offered at the mainstream banks and credit unions. This was the case for tax refund anticipation loans, payday loans and wire transfers. Within this ‘other’ category, however, the most oft-cited reason was due to a history of bad debts which made individuals unwilling to use their bank or credit union more regularly. The comments received in this respect included: “I have ripped them all off”; “I have NSF charges and owe the bank money”; “Personal information on debit cards is tracked”; “I have ripped off bank machines three times”; “I took money out without authorization”; and “I’m not sure if I owe them money.” For a substantial number of FFI users, therefore, they are there because their financial relationship with their bank or credit union has broken down and using a FFI enables them to escape from these debts and this record, at least in the short term. A particular problem appeared to be that if cheques were cashed or deposited at their mainstream financial institutions, respondents felt that the institution would first apply that money to the repayment of existing debts; they therefore preferred to use a fringe financial institution to avoid this.15 Given the prevalence of payday loans as a significant part of the business of FFIs, we also asked FFI users if they had ever applied for loans at a mainstream financial institution. As Figures 26 and 27 below indicate, 42.7 per cent of them had, although non-Aboriginal respondents were nearly twice as likely to have done so.
15 Outstanding child support and CRA payments are examples of payments which must be met in full if a client has funds in his/her account. Other outstanding debts are typically not subject to this rule.
33

No 57.3% Yes 42.7% Total 100.0% Note: N=171
Non-Aboriginal Aboriginal All No 42.0% 67.6% 57.3% Yes 58.0% 32.4% 42.7% Total 100.0% 100.0% 100.0% Note: N=171
Figures 28 and 29 below show that, of those that did apply for loans, three quarters were successful, although the non-Aboriginal respondents were more likely to have been successful than Aboriginal respondents.
34

No 25.4% Yes 74.6% Total 100.0% Note: N=71
Non-Aboriginal Aboriginal All No 12.8% 40.6% 25.4% Yes 87.2% 59.4% 74.6% Total 100.0% 100.0% 100.0% Note: N=71
35

These answers indicate that not only do many FFI users have bank accounts, and are thus best seen as dual institution users rather than unbanked, many of them had also been successful in applying for loans from the mainstream institutions. This suggests that among FFI users there is a significant degree of experience with the mainstream financial sector. What seems to have happened, however, is that there has been a breakdown in the relationship between many of these institutions and their clients as the latter have fallen into financial difficulties. This has pushed them to using FFIs. FFI users seem to fall into two categories in this respect; a minority, the unbanked who have never had a bank account, and a larger group who have had a relationship with a mainstream financial institution but who, when they fall into financial difficulty, then resort to the FFIs. This group has not been adequately recognized or studied in the existing literature and might best be termed the ‘precariously banked’. They are regular users of mainstream financial institutions but their relationship with that institution is precarious and, when they run into financial difficulty, they turn to simultaneous use of FFIs. In this respect, it is interesting to note that while 50 per cent of our respondents indicated that they currently regularly used a bank or credit union account, nearly 90 per cent said that they had held such an account at some point in their financial history. This suggests that at some point the precariously banked stop using both institutions simultaneously and switch to using FFIs for all of their financial service needs. The precarious relationship with the mainstream financial institutions becomes severed. These underlying dynamics are better captured by the term precariously banked, a term which is conceptually different from the more common ‘underbanked’ term; the latter term refers to individuals who only use a limited number of mainstream financial institutions’ services and are, at least partially, financially excluded. The term precariously banked, as we have defined it, refers to individuals who regularly use their mainstream institution but whose relationship with it is precarious in that, if circumstances change, the individual may also chose to simultaneously make use of FFIs for some financial services. Turning now to FFI usage, Figures 30 and 31 below show how frequently respondents reported that they used the FFIs.
36

1/week 1.4% >1/month 21.1% 1/month 32.0% 1/3 months 7.5% <1/3 months 38.1% Total 100.0% Note: N=147
Non-Aboriginal Aboriginal All 1/week 0.0% 2.2% 1.4% >1/month 21.8% 20.7% 21.1%
37
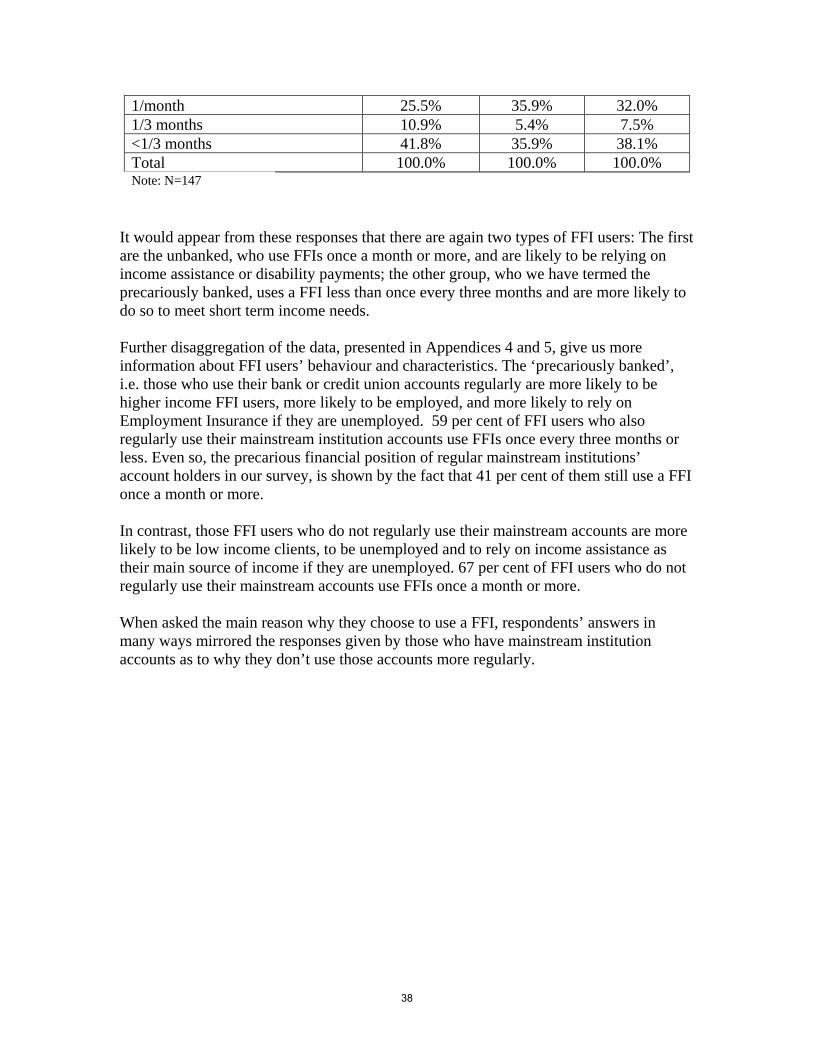
1/month 25.5% 35.9% 32.0% 1/3 months 10.9% 5.4% 7.5% <1/3 months 41.8% 35.9% 38.1% Total 100.0% 100.0% 100.0% Note: N=147
It would appear from these responses that there are again two types of FFI users: The first are the unbanked, who use FFIs once a month or more, and are likely to be relying on income assistance or disability payments; the other group, who we have termed the precariously banked, uses a FFI less than once every three months and are more likely to do so to meet short term income needs. Further disaggregation of the data, presented in Appendices 4 and 5, give us more information about FFI users’ behaviour and characteristics. The ‘precariously banked’, i.e. those who use their bank or credit union accounts regularly are more likely to be higher income FFI users, more likely to be employed, and more likely to rely on Employment Insurance if they are unemployed. 59 per cent of FFI users who also regularly use their mainstream institution accounts use FFIs once every three months or less. Even so, the precarious financial position of regular mainstream institutions’ account holders in our survey, is shown by the fact that 41 per cent of them still use a FFI once a month or more. In contrast, those FFI users who do not regularly use their mainstream accounts are more likely to be low income clients, to be unemployed and to rely on income assistance as their main source of income if they are unemployed. 67 per cent of FFI users who do not regularly use their mainstream accounts use FFIs once a month or more. When asked the main reason why they choose to use a FFI, respondents’ answers in many ways mirrored the responses given by those who have mainstream institution accounts as to why they don’t use those accounts more regularly.
38
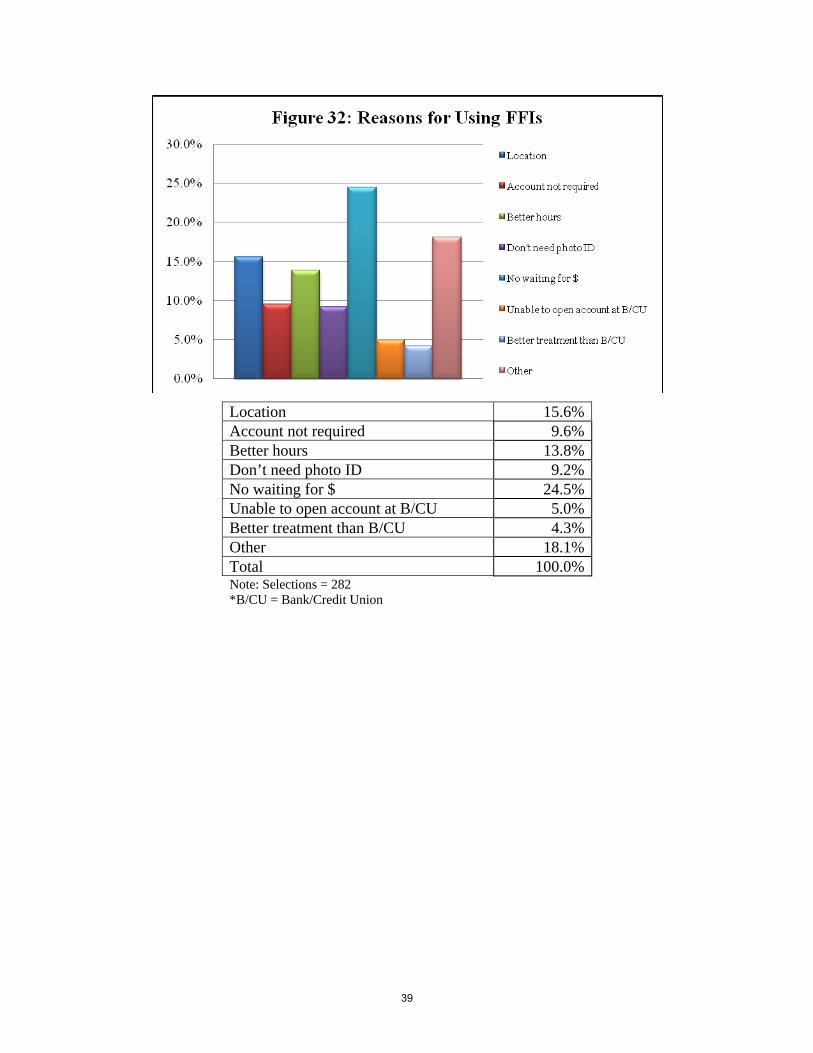
Location 15.6% Account not required 9.6% Better hours 13.8% Don’t need photo ID 9.2% No waiting for $ 24.5% Unable to open account at B/CU 5.0% Better treatment than B/CU 4.3% Other 18.1% Total 100.0% Note: Selections = 282 *B/CU = Bank/Credit Union
39

Non-Aboriginal Aboriginal All Location 13.9% 16.8% 15.6% Account not required 9.6% 9.6% 9.6% Better hours 13.9% 13.8% 13.8% Don’t need photo ID 9.6% 9.0% 9.2% No waiting for $ 21.7% 26.3% 24.5% Unable to open account at B/CU 4.3% 5.4% 5.0% Better treatment than B/CU 5.2% 3.6% 4.3% Other 21.7% 15.6% 18.1% Total 100.0% 100.0% 100.0% Note: Selections = 282 *B/CU = Bank/Credit Union
Immediate access to cash was the main reason given indicating the importance for this group of obtaining money immediately. Convenience factors were also important. ‘Other’ factors were also important here and respondents’ reasons included emergency funding to repair a car, providing services which the banks don’t such as tax refund loans, wire transfers, and bad credit records preclude the individuals from borrowing elsewhere. The final question asked whether respondents were satisfied with the FFIs which they used. The results are shown below in Figures 34 and 35
40
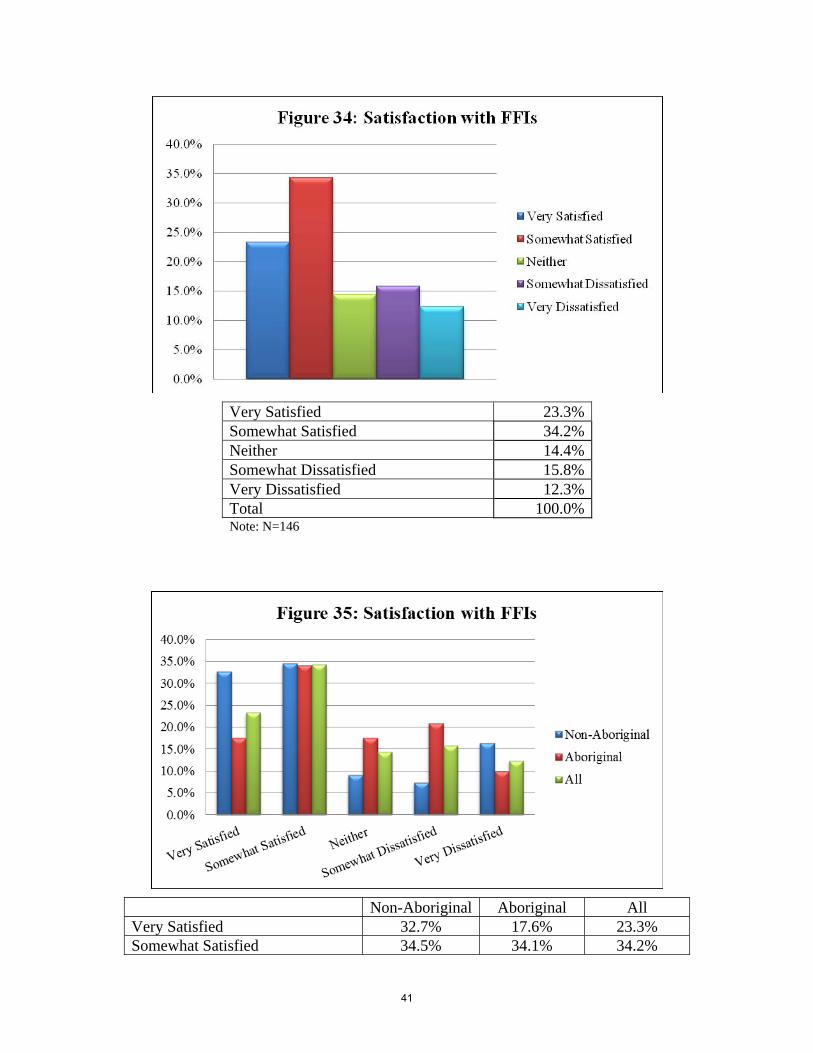
Very Satisfied 23.3% Somewhat Satisfied 34.2% Neither 14.4% Somewhat Dissatisfied 15.8% Very Dissatisfied 12.3% Total 100.0% Note: N=146
Non-Aboriginal Aboriginal All Very Satisfied 32.7% 17.6% 23.3% Somewhat Satisfied 34.5% 34.1% 34.2%
41

Neither 9.1% 17.6% 14.4% Somewhat Dissatisfied 7.3% 20.9% 15.8% Very Dissatisfied 16.4% 9.9% 12.3% Total 100.0% 100.0% 100.0% Note: N=146
In general, the majority of FFI users were either very satisfied or satisfied with their experience using FFIs. A significant minority, however, reported being dissatisfied or very dissatisfied. This reinforces the findings by Buckland et al (2005) that FFI users are ambivalent about using FFIs. The convenience, speed of transactions, access to immediate payment and small loans are all attractive features of FFIs, but their fee structures are less attractive. 6.0 Summary and Policy Implications Prince George has a considerable number of FFIs, comparable to the presence of mainstream financial institutions, indicating that they have a significant client base in the city. Estimates of the size of the unbanked population, based on national survey data, vary considerably depending on the survey used. However, we find that the FFIs client base extends well beyond this group. We conclude that estimates based solely on the unbanked – defined as those without bank accounts – greatly underestimates the size of FFIs’ client base since, as our survey showed, a significant portion of FFI users do have bank or credit union accounts. This group is best described as ‘precariously banked’, that is, as individuals who have access to a mainstream financial institution accounts but simultaneously find reasons for using the services offered by FFIs. Half of the FFI clients in our survey reported that they also regularly used a bank or credit union account. The concerns over the activities of the FFIs, in particular whether the types of loans that they provide will lead to a debt trap and the interest rates that they charge, has led many provinces, including BC, to license and regulate the industry. This has meant that certain lending practices, such as rollover loans, are now illegal. However, by capping fees at a level which ensures industry profitability, the charging of high implicit interest rates remains. In BC, using the average Canadian payday loan amount of $280 and term of 10 days, would incur a legal APR of 839.5 per cent. The regulatory approach followed by BC and other provinces cannot therefore be said to have solved the problem of potential debt traps. Other measures are required. Our survey results indicate that there are two main groups of FFI users for whom policy responses would be appropriate. The first is those without bank or credit union accounts, the unbanked. 12 per cent of our survey of FFI users reported that they had never held a bank or credit union account and 50 per cent reported that they did not currently regularly use one. For this group, simple financial transactions such as cheque cashing are undertaken at FFIs. Many FFI users rely upon Employment Insurance, income assistance or disability payments as their main
42

source of income, all government issued cheques. These can be cashed at mainstream financial institutions at lower cost than the FFIs; one policy response therefore is for the former institutions to make a greater effort in making this service known to low-income clients. There is a clear dualism in the financial system with banks increasingly focusing on the higher-net-worth individuals and the fringe financial institutions catering to the low-income group which finds it difficult to subsist from one paycheque to the next. These differences can readily be seen by an examination of the posters which adorn their premises. Banks’ posters are aimed at those who value international travel and offer various rewards to appeal to them, at those who are home owners and who can borrow based on this equity, and at those interested in wealth management advice. None of this has relevance to the experience of the low-income groups who use FFIs. The latter appeal to this client group by advertising that they ‘approve everyone’, do not place holds on cheques, offer cheap tax returns and, in the words of one, offer ‘loan$, loan$, loan$’. Their advertising is aimed at a quite different group than that targeted by the mainstream financial institutions. Greater advertising aimed at the low-income group, and in particular the availability of low cost cheque cashing services together with ID requirements, might encourage more FFI users into the financial mainstream. Convenience is clearly important for FFI users and extended hours by banks and credit unions in certain downtown locations on days when government cheques are issued could also be important in providing an alternative for FFI users.16 Apart from government cheques, cheque cashing policy in general is a major problem. For federal government cheques, any cheque up to $1500 must be cashed, free of charge, by banks and credit unions upon presentation of appropriate identification. Some banks extend this policy to provincial government cheques although this is seldom advertised and is not a legal requirement as it is with federal government cheques; there is no reason why provincial governments could not enact similar legislation to apply to the cheques which they issue. Many low income people need cash immediately and cannot wait the 3-7 day period which banks typically hold non-government cheques (Buckland and Dong 2008: 260); FFIs typically offer to cash cheques with no holding period. The Canadian Community Reinvestment Coalition observes that “according to the Canadian Payments Association, 98 [per cent] of cheques clear through the Canadian system overnight. As a result, the legal limit on cheque holds must require that, in most circumstances, depositors have a right to access funds from a deposited cheque [the day after their cheque] is deposited.” While this calls for legislative change, it also points to an area in which an innovative bank or credit union could experiment in selected locations. In this respect it is worth noting that RBC has experimented with a Cash & Save concept in Toronto in an effort to provide more relevant services such as cheque cashing, bill
16 The Ministry of Housing and Social Development, which issues income assistance cheques, opens at 9 a.m. Of the four financial institutions located close to the Ministry building reported in Appendix 2, the two FFIs also open at 9 a.m. The credit union and the bank open at 9.30 a.m.
43

payments, money orders and wire transfers to low-income households at more reasonable rates than those charged by the fringe financial institutions. (SHARE 2007) Furthermore, Quebec has a lower percentage of its population that is “unbanked” than the national average, and has a lower use of cheque-cashing outlets, an outcome which has been attributed to the more community-oriented operations of the Caisses Populaeire. (LCO 2009). The second group identifiable in our survey is a sizeable group of FFI users who are also clients of the mainstream banks and credit unions, and who we have termed the precariously banked. This group, some 50 per cent of our survey respondents, are familiar with the services offered by banks and credit unions but simultaneously prefer to use FFIs as well. Furthermore, since many of the currently unbanked in our survey had once had a bank or credit union account, many of them would previously have been precariously banked before moving into the unbanked after a period of time. Some of the reasons given for using FFIs refer to specific services such as tax refund anticipation loans and wire transfers. These are again areas where the mainstream institutions might consider offering comparable services at lower rates than the FFIs; in fact, many banks are now offering Western Union wire transfer services in their branches. It requires that the mainstream financial institutions see low-income individuals as a group with particular financial service needs. Buckland and Dong (2008: 261) argue in this respect that “the banking preferences of low-income people include convenience and in-person provision of services. Immediate check cashing, small-sum savings, and small amounts of credit are important services, but low-income people are more dissatisfied than are high income people in the way mainstream banks provide some of these services.” In short, ‘basic banking’ needs to be a greater focus for banks and credit unions if low income populations are to be better served by them. Beyond offering specific services, it is also clear that many bank and credit union clients gravitate towards using FFIs when they run into financial difficulties. When their creditworthiness, in particular, is adversely affected they may find it difficult to obtain further credit from their banks or credit unions and turn to FFIs who advertise that they “approve all” applicants, albeit at high costs. For individuals with bad credit records, however, this is likely to be a short-term solution as the repayment conditions of the FFIs will, in all likelihood, quickly become just as onerous as those of the banks and credit unions. Furthermore, as FFI users default on their payments to the FFIs, this means that they incur NSF charges from the banks on which they have written cheques to the FFIs. FFI users therefore incur a ‘double whammy’ of high FFI fees and bank NSF charges on a single payday loan. The precariously banked typically have credit positions such that they can easily run out of financing options at their mainstream institutions and therefore resort to FFIs. This is an area where again innovative mainstream institutions might experiment with how best to maintain their client base and provide small loans and credit counseling so that their clients can be assisted in times of financial stress. It is clear that many low income individuals are dual users in the sense that they use both mainstream institutions and FFIs; the task for the former becomes finding ways to innovate their services so that the need for this dual track approach that many take is reduced. Given the
44

prevalence of precariously banked clients, the mainstream financial institutions certainly have an incentive to find ways of addressing their needs since their own client base is being threatened. Banks and credit unions may be unaware of just how many of their own clients are using FFIs and how many are therefore potentially lost clients. Certainly, our survey finding of significant dual users, the precariously banked as we have termed them, is not one that is prominent in the existing literature. It is perhaps closest to the findings of Buckland and Fikkert (2008) who report that respondents in their survey ‘grazed’ between financial institutions and often switched between mainstream banks and FFIs depending on circumstances. The circumstances which led to changes included institutions’ location, hours of operation, friendliness of staff, direct cost of fees, cheque hold policy and use of direct deposit by social assistance agencies or employers. Changes in one or more of these factors can lead to changes in institutional choice. They also found that if income levels deteriorated over a period of time, individuals were more likely to switch to using FFIs and away from mainstream banks. Our survey results suggest that this latter factor, and associated credit worthiness, is a major factor in the decision to become a dual user. Our survey results, however, show respondents using both types of financial institution simultaneously for different purposes rather than making a complete switch between the two as the grazing analogy suggests. Our survey also found that Aboriginal people were significant users of FFIs; in fact 60 per cent of our respondents self-identified as Aboriginal. Our survey finds that this group shares many of the same characteristics as the non-Aboriginal users of FFIs. As indicated in Section 4, both groups were predominantly in rented accommodation indicating that both had low asset ownership; both had predominantly male users. However, it is also clear that Aboriginal users of FFIs had lower incomes, less education, were more likely to be younger, more likely to be unemployed and more likely to rely on income assistance than the non-Aboriginal users. The entire sample is a relatively low income group but, within that, it appears that the Aboriginal FFI users are even less financially secure. Working with Aboriginal youth and training organizations, therefore, to include financial literacy services may be beneficial. All of the policy responses suggested above rely on working with existing institutions and organizations to find ways of better addressing the needs of low income individuals within the mainstream financial sector. This requires advocacy on behalf of low-income individuals with the banks and credit unions and the willingness of the latter to consider policy experiments in selected locations to see if these provide effective solutions to the reliance on FFIs. Further promotion of financial literacy services is also important and, in this respect, it is interesting to note that the Province of Manitoba has, as part of its legislation regulating the industry, required all FFIs in the province to pay an annual Financial Literacy Support Levy to the government. As well as working with existing institutions and organizations, other policy initiatives include the creation of new institutions designed specifically to meet the needs of low-
45
income individuals. In BC this was most famously tried in Vancouver at the corner of Main and Hastings, the heart of Canada’s poorest neighbourhood, by Four Corners Community Savings (FCCS). The failure of the FCCS is instructive in terms of defining the difficulties that exist in setting up any new institution and the challenges which arise in creating financially sustainable institutions while servicing this particular financial market segment. The FCCS had been created by the Clark government in 1996 with a $300,000 annual subsidy, and was fully expected to offer comprehensive services to the financially excluded as well as to be an economic driver for small business in the community. However, citing consecutive losses totalling $6 million, the Campbell government pulled the plug on the FCCS in 2004. (See Downey 2003). Nevertheless, worthy attempts are still being made. For example, Pigeon Park Savings (PPS) was opened in 2004 after the announced closure of its predecessor the FCCS. PPS is a partnership between the Portland Hotel Society (PHS) and Vancouver City Savings Credit Union (Vancity) – the PHS manages the daily ‘front-room’ operations such as client services, while Vancity manages the ‘back-room’ work including cheque clearing. (See Buckland 2008). It was created with a one-time grant from Vancity of $200,000, plus donations of furniture and an automatic teller machine (ATM), and an ongoing commitment of $75,000 per year to cover anticipated operating losses.17 As of 2007 PPS was serving 4,200 members but was losing approximately $100,000 a year, most of which can be attributed to staff salaries and other operating costs (Buckland 2008). More importantly, as the PPS is just one of Vancity’s 59 branches, it thereby alleviates the onerous regulatory requirements of its stand-alone predecessor FCCS. PPS offers clients cheque-cashing, unlimited withdrawals, bill payments, money orders and ATM access all for a simple fee of $5 per month, or will cash a cheque for a flat fee of $2.99.18 Currently PPS is promoting financial literacy amongst its members and the community in an effort to provide the “tools to make sound decisions”19 and to effectively deter the use of fringe financial institutions. Buckland, Hamilton and Reimer (2006) analyze a number of other new initiatives as well but conclude that a successful model has yet to fully emerge. They argue that the private sector has not provided a solution yet since the demands of shareholders place a tension between community service provision and profit levels; they speculate that credit unions might be more successful in this regard given their different mandates and visions. They also warn against over reliance on public funding since uncertainties regarding the longer term financial commitments of governments mean that sustainable funding can seldom be guaranteed. In proposing a way forward for their research in North End Winnipeg, they conclude that four points must be taken into account. These are (2006: 120): “Firstly, neighbourhood residents stated unequivocally that they did not want any form of
17 Vancity is Canada's largest credit union, with $14.1 billion in assets, 390,000 members, and 59 branches throughout Greater Vancouver, the Fraser Valley, Victoria and Squamish. Available at https://www.vancity.com/AboutUs/MediaCentre/MediaReleases2008/March14/ 18 Available at https://www.vancity.com/MyCommunity/OurChangeProductsAndServices/FinancialLiteracyAndBasicBanking/BasicBanking/ 19 Available at https://www.vancity.com/MyCommunity/OurChangeProductsAndServices/FinancialLiteracyAndBasicBanking/
46
ghettoized banking, but wanted to become valued customers of a recognized financial institution. Secondly, the basic services under discussion cannot be sustained solely through interest charges or service fees paid by low-income clients. Thirdly, any stakeholder (public or private sector) willing to subsidize these services would need to be able to cap or manage the subsidy level. Fourthly, models that rely on building stand-alone subsidized branches either severely constrain available products or founder [from] a lack of earned revenue.” They devise a model in which entry level service is available to borrowers for a small loan at an interest rate less than the 60 per cent stipulated in the criminal code. Borrowers must be unbanked or under-banked and referred by a community service organization which provides a character reference. Pending successful completion of the terms of the loan, the client would then be encouraged to become banked by opening an account at a participating financial institution. The community financial program continues to be involved by negotiating (and possibly guaranteeing) more favourable cheque cashing arrangements than is standard with the participating financial institution. This provides a useful overview of the type of institutional arrangement that would be needed to meet the needs of both lenders and borrowers but also points to the difficulties and complexities involved. For a city the size of Prince George, these difficulties become greater still. However, even if this might make an alternative institution more of a medium or long term possibility, in the short term exploring pilot projects with existing mainstream financial institutions would be a positive first step in addressing the very real need to find alternatives to FFIs for low-income individuals.
47

References ACORN Canada (2007), A Conflict of Interest: How Canada’s Largest Banks Support Predatory Lending, Research Report. Buckland, J., (2008), Strengthening Banking in Inner-Cities: Practices and Policies to Promote Financial Inclusion for Low Income Canadians, Canadian Centre for Policy Alternatives, March. Buckland, J., et al (2005), “There Are No Banks Here”: Financial and Insurance Exclusion in Winnipeg’s North End, Research Report (unpublished). Buckland, J., et al (2007), Serving or Exploiting People Facing a Short-term Credit Crunch? A Study of Consumer Aspects of Payday Lending in Manitoba, Report Prepared for the November 2007 Public Utilities Board Hearing to Cap Payday Loan Fees, 15 September. Buckland, J., and Dong, X-Y., (2008), Banking on the Margin in Canada, Economic Development Quarterly, 22, 252-263. Buckland, J., and Fikkert, A., (2008), Life Goals, Finances and Financial Service Choice: Preliminary Report Summarizing Individual Respondents’ financial Life Histories, mimeograph, July 16. Buckland, J., Hamilton, B., and Reimer, B., (2006), Fringe Financial Services, Inner-city Banking and Community-based Solutions, Canadian Journal of Urban Research, 15, 1, 109-128. Canadian Payday Loan Association, (2008), Response to regulating the Payday Lending Sector Discussion Paper, submitted to the Prince Edward Island Office of the Attorney General, Consumer, Corporate and Insurance Division CCRC, (2007), Priority Changes Needed to Federal Financial Institution Laws: Closing Key gaps in Accountability and Consumer Protection, unpublished. Ernst & Young, (2009), The Cost of Providing Payday Loans in Ontario, A Report Prepared for the Ministry of Small Business and Consumer Services, January 24. Deloitte and Touche (2008) Cost of Providing Payday Loans in British Columbia, Report Prepared for the Canadian Payday Loan Association, June 27th. Downey, G., (2003) “Ongoing Losses Force Closure of Four Corners,” News Release 2003CSE0069-001074: Ministry of Competition, Science and Enterprise, Province of British Columbia.
48
Kempson, E., Atkinson, A., and Pilley, O., (2004), Policy level Response to Financial Exclusion in Developed Economies: Lessons for Developing Countries, Report by The Personal Finance Research Centre, University of Bristol, September. Kitching, A., and Starkey, S., (2006), Payday Loan Companies in Canada: Determining in the Public Interest, Parliamentary Information and Research Service Report, 26 January. Kitching, A., Starky, S., and Bergevin, P., (2007), Bill C-26: An Act to Amend the Criminal Code (Criminal Interest Rate), Parliamentary Information and Research Service report, 28 September (revised version). Law Commission of Ontario (LCO), Responses to Concerns Regarding Cheque Cashing Fees, Consultation Paper Pyper, W., (2007), Payday Loans, Statistics Canada Perspectives, April. SHARE, (2007), Sub-Prime Lending in Canada: Implications and Opportunities for Investors, Research report, May 27. Simpson, W., and Buckland, J. (2009), Examining Evidence of Financial and Credit exclusion in Canada from 1999 to 2005”, Journal of Socio-Economics, 38, 966-976.
49

Appendix 1
Table A1: List of Fringe Financial Institution Outlets and
Bank and Credit Union Branches in Prince George, June 2010
Fringe Financial Institutions
1 Ace's Pawnshop and Second Hand 1137 3rd Avenue 2 Ace's Pawnshop and Second Hand 2298 Hart Highway 3 Cash Factory Loans Inc. 1261B 3rd Avenue 4 CashPlan Financial Services 1126 3rd Avenue 5 Citifinancial 1 1080 Victoria 6 H & R Block 1262 3rd Avenue 7 Instaloans 749 Victoria 8 Instaloans 1671 15th Avenue 9 King Cash 1247 3rd Avenue 10 ljn Financial Group Inc. 154 Quebec Street 11 Money Mart #2-890 Victoria Street 12 Money Mart #103-3328 15th Avenue 13 PG Pawn Shop 1160 3rd Avenue 14 Speedy Cash Payday Advances 1275 3rd Avenue 15 Spruce City Resale 1245 3rd Avenue 16 The Cash Store 1534 Victoria Street 17 The Cash Store 3355 8th Avenue 18 Wells Fargo Financial 2 1444 9th Avenue 19 Western Union (Wal Mart #3651) 3 6565 Southridge Drive 1 Predominately offer collateral loans.
2 Predominately offer collateral loans - Closed since interviews concluded.
3 Does not cash cheques.
50

Banks and Credit Unions
1 CIBC 783 Central Street W 2 CIBC 3055 Massey Drive 3 CIBC 1410 3rd Avenue 4 HSBC Bank Canada 299 Victoria Street 5 Integris Credit Union #205-513 Ahbau 6 Integris Credit Union 1532 6th Avenue 7 Integris Credit Union #100-2150 Ferry Avenue 8 RBC Royal Bank 550 Victoria Street 9 RBC Royal Bank #101-3055 Massey Drive 10 RBC Royal Bank 6111 Southridge Avenue 11 Scotiabank 5051 Domano Blvd 12 Scotiabank 390 Victoria Street 13 Scotiabank 6541 Hart Highway 14 Scotiabank 675 Central Street W 15 Spruce Credit Union 879 Victoria Street 16 Spruce Credit Union 3811 West Austin Road 17 TD Canada Trust 400 Victoria Street 18 TD Canada Trust 3161 Massey Drive 19 TD Canada Trust 5902 O'Grady Road
51

""
!
"
"
"
"
"
"
"
# #
#
!
! !!
!
!
!!!
!!!
!
Appendix 2
Figure 1Location of FFI’s and Mainstream Financial Instutitions in Prince George
5352

"
"
"
"
"
"
"
"
"
"
"
"
"
"
"
"
"
"
# #
#
!
!
!
!
! !!
! !
!!!
!!!
!
Leg
en
d
!F
ring
e F
ina
ncia
l In
stitu
tion
s
#B
ank C
losu
res
"B
anks a
nd C
redit U
nio
ns
Me
an
In
div
idu
al
Inc
om
e (
20
06
Ce
ns
us
)
No
n-R
esid
en
tial
1-9
,99
9
10
,00
0-1
9,9
99
20
,00
0-2
9,9
99
30
,00
0-3
9,9
99
40
,00
0-4
9,9
99
50
,00
0+
Ma
p L
ayo
ut
by J
am
ie S
ve
ndse
n A
ugu
st 2
010
53
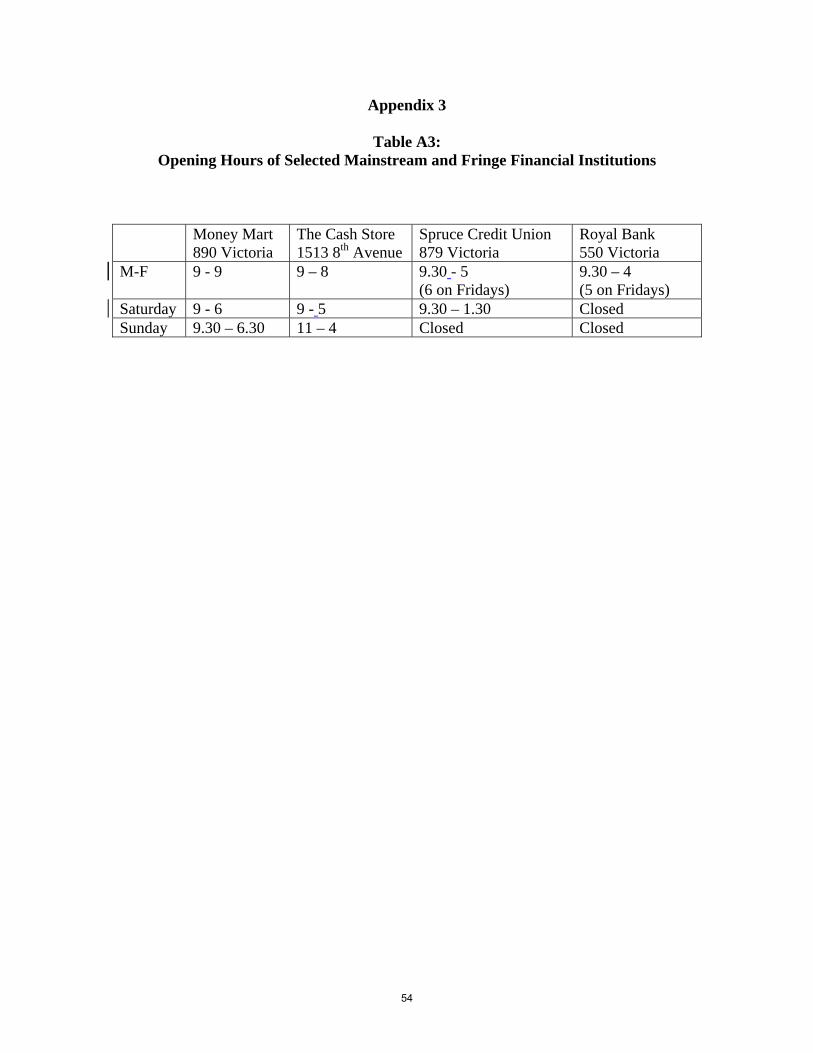
Appendix 3
Table A3: Opening Hours of Selected Mainstream and Fringe Financial Institutions
Money Mart 890 Victoria
The Cash Store 1513 8th Avenue
Spruce Credit Union 879 Victoria
Royal Bank 550 Victoria
M-F 9 - 9 9 – 8 9.30 - 5 (6 on Fridays)
9.30 – 4 (5 on Fridays)
Saturday 9 - 6 9 - 5 9.30 – 1.30 Closed Sunday 9.30 – 6.30 11 – 4 Closed Closed
54

Appendix 4
Table A4: Regular and Irregular Users of Bank or Credit Union Accounts by FFI Clients
Disaggregated by Income, Employment Status, and Source of Income if Unemployed
Doesn't Regularly Use Do Regularly Use Total 0-$9,999 62% 38% 100% $10,000-$19,999 53% 47% 100% $20,000-$29,999 38% 62% 100% $30,000-$39,999 13% 87% 100% $40,000-$49,999 43% 57% 100% $50,000 and over 25% 75% 100% Total 49% 51% 100% N=154 Doesn't Regularly Use Do Regularly Use Total Unemployed 58% 42% 100% Employed 39% 61% 100% Total 50% 50% 100% N=163 Doesn't Regularly Use Do Regularly Use Total Employment Ins. 25% 75% 100% Income Assistance 70% 30% 100% L/T or S/T Disability 58% 42% 100% Old-age Pension 0% 100% 100% Retirement Savings 100% 0% 100% Other 64% 36% 100% Total 58% 42% 100% N=97
55
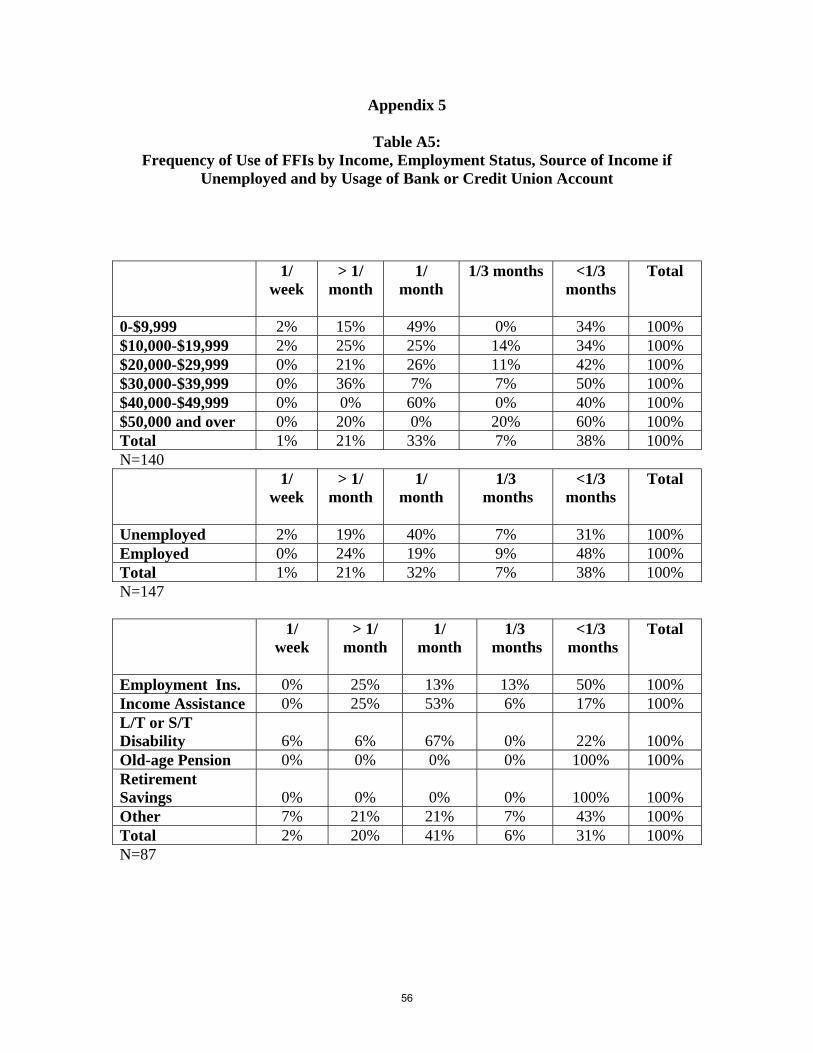
Appendix 5
Table A5: Frequency of Use of FFIs by Income, Employment Status, Source of Income if
Unemployed and by Usage of Bank or Credit Union Account
1/ week
> 1/ month
1/ month
1/3 months <1/3 months
Total
0-$9,999 2% 15% 49% 0% 34% 100% $10,000-$19,999 2% 25% 25% 14% 34% 100% $20,000-$29,999 0% 21% 26% 11% 42% 100% $30,000-$39,999 0% 36% 7% 7% 50% 100% $40,000-$49,999 0% 0% 60% 0% 40% 100% $50,000 and over 0% 20% 0% 20% 60% 100% Total 1% 21% 33% 7% 38% 100% N=140
1/ week
> 1/ month
1/ month
1/3 months
<1/3 months
Total
Unemployed 2% 19% 40% 7% 31% 100% Employed 0% 24% 19% 9% 48% 100% Total 1% 21% 32% 7% 38% 100% N=147
1/ week
> 1/ month
1/ month
1/3 months
<1/3 months
Total
Employment Ins. 0% 25% 13% 13% 50% 100% Income Assistance 0% 25% 53% 6% 17% 100% L/T or S/T Disability 6% 6% 67% 0% 22% 100% Old-age Pension 0% 0% 0% 0% 100% 100% Retirement Savings 0% 0% 0% 0% 100% 100% Other 7% 21% 21% 7% 43% 100% Total 2% 20% 41% 6% 31% 100% N=87
56

1/
week
> 1/ month
1/ month
1/3 months
<1/3 months
Total
Doesn’t Regularly Use 3% 27% 37% 6% 28% 100% Do Regularly Use 0% 15% 26% 11% 48% 100% Total 1% 21% 31% 8% 38% 100% N=137
57