fresno county employees’ retirement association 2, 2015 smid cap value portfolio review fresno...
TRANSCRIPT

December 2, 2015SMID Cap ValuePortfolio Review
Fresno County Employees’Retirement Association
Our mission is to provide clients with above benchmark long-term investment results and client
service that consistently surpasses expectations.
Ronald M. Mushock, CFAPortfolio ManagerPartner
Scott N. Garrett, CFASenior Vice President
2 Introduction
Firm Profile
Portfolio Offerings
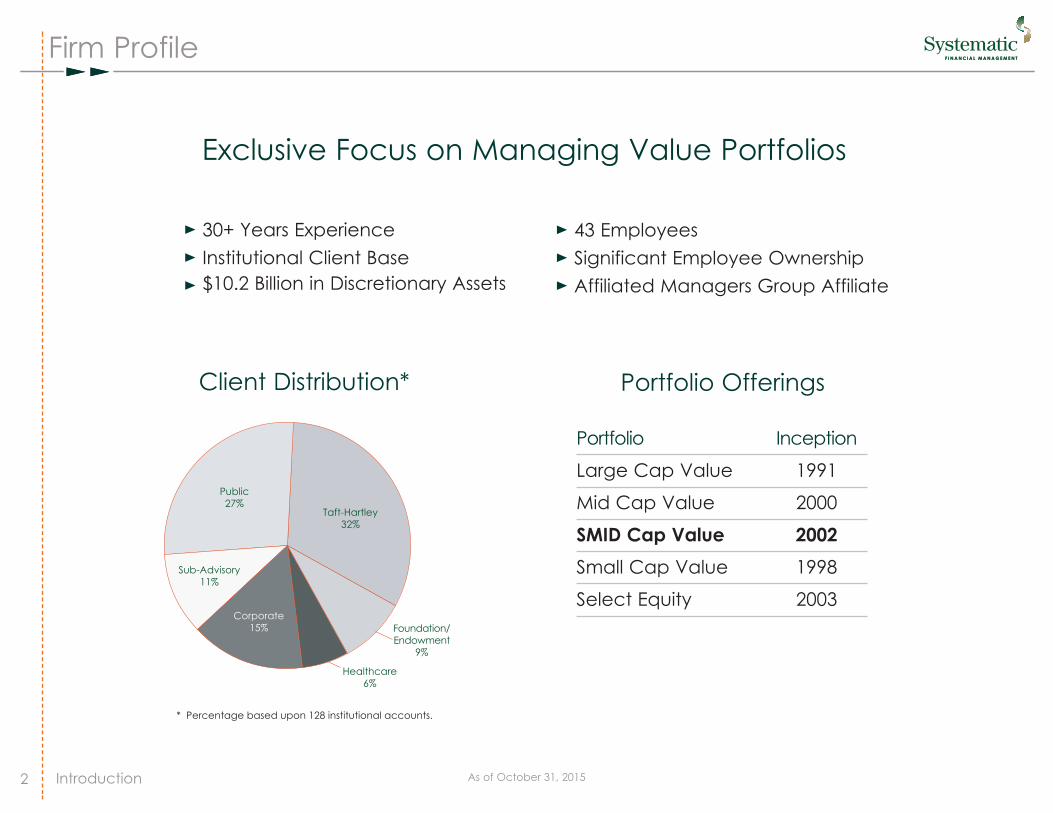
Exclusive Focus on Managing Value Portfolios
As of October 31, 2015
Portfolio Inception
Large Cap Value 1991
Mid Cap Value 2000
SMID Cap Value 2002 Small Cap Value 1998
Select Equity 2003
30+ Years ExperienceInstitutional Client Base$10.2 Billion in Discretionary Assets
43 EmployeesSignificant Employee OwnershipAffiliated Managers Group Affiliate
Client Distribution*
Foundation/Endowment
9%
Healthcare6%
Taft-Hartley32%
Public27%
Corporate15%
Sub-Advisory11%
* Percentage based upon 128 institutional accounts.

Investment Team
Years YearFundamental Quantitative Portfolio Investment Joined
Name Title Research Analysis Management Fundamental Research Focus Experience Systematic
D. Kevin McCreesh, CFA* Chief Investment Officer Generalist 30 1996
Kenneth W. Burgess, CFA* Portfolio Manager Generalist, FCF 22 1993
Ronald M. Mushock, CFA* Portfolio Manager Generalist 24 1997
Joseph M. Sharma, CFA* Portfolio Manager Generalist 23 2000
Eoin E. Middaugh, CFA* Portfolio Manager Quantitative Analysis 18 2002
Cons. Staples, Energy, Financials, Healthcare, Aman Patel, CFA* Assistant Portfolio Manager Industrials, Materials, Utilities 17 2002
Cons. Disc., Cons. Staples, Healthcare,Brian D. Kostka, CFA* Assistant Portfolio Manager Industrials, Materials, Telecom 16 2007
Cons. Disc., Cons. Staples, FinancialsW. Ryan Wick, CFA Assistant Portfolio Manager Healthcare, Industrials, Technology, FCF 16 2005
Rick Plummer, CFA* Senior Equity Analyst Generalist, PM Specialist 21 2004
Cons. Disc., Financials, Industrials, Christopher Lippincott, CFA Senior Equity Analyst Technology, Materials, FCF 19 2008
Tom LaBarbera Jr., CFA Senior Equity Analyst Quantitative Analysis 15 2005
Jennifer Mulroy, CFA Senior Equity Analyst Cons. Disc., Cons. Staples, Healthcare, Technology 9 2010
Quantitative Analysis/Fundamental ResearchMatthew Tangel, CFA Equity Analyst Energy, Financials, Industrials, Materials, Utilities 10 2008
Elizabeth Howell, CFA Equity Analyst Industrials, Technology, Telecom, Utilities 7 2013
Introduction* Partner of the firm
3
Value Equity
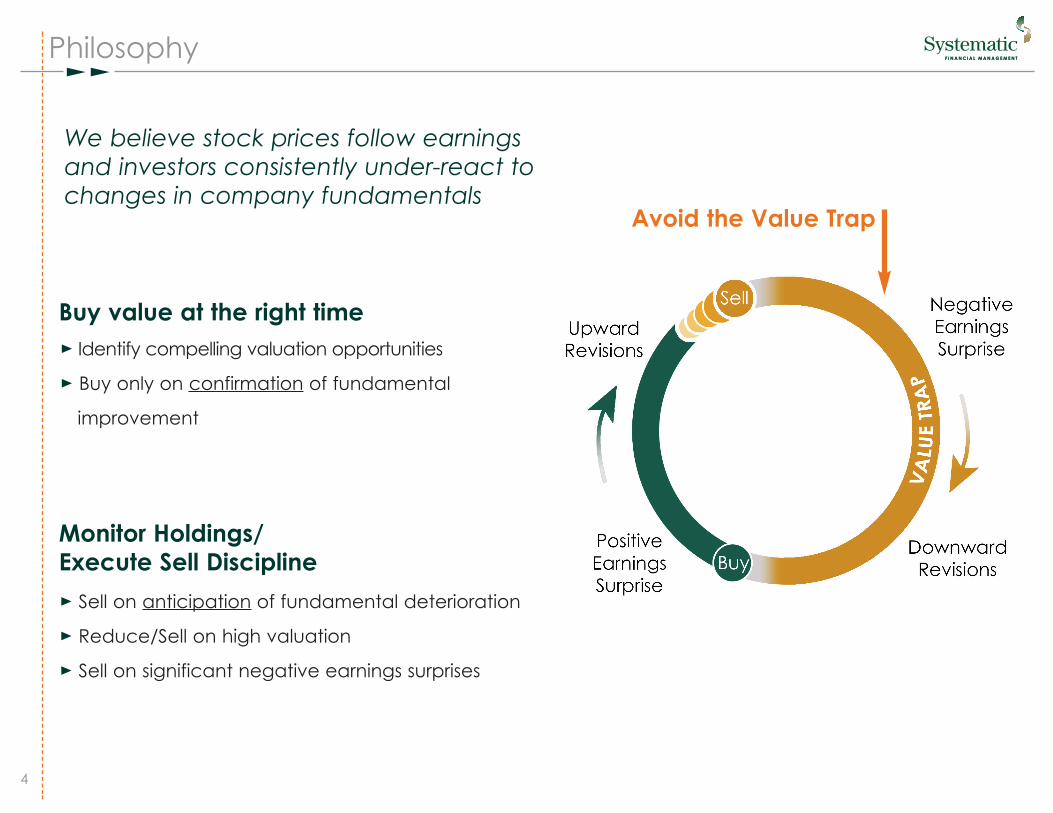
Philosophy
Identify compelling valuation opportunities
Buy only on confirmation of fundamental
improvement
Buy value at the right time
Avoid the Value Trap
Sell on anticipation of fundamental deterioration
Reduce/Sell on high valuation
Sell on significant negative earnings surprises
Monitor Holdings/Execute Sell Discipline
We believe stock prices follow earnings and investors consistently under-react tochanges in company fundamentals
4

Value Equity
Investment Process
Universe Screening
Initial Universe: General market cap range of the Russell 2500TM Value Index
Quantitative Model:50% Valuation50% Earnings Catalyst Model
Investor ExpectationsIncome StatementBalance Sheet/Cash Flow
150 Stock Research Focus list:15 stocks in each economic sector
Fundamental Research Gauge Investor Expectations
Key revenue & margin assumptionsunderlying earnings estimates
Perform Financial Statement AnalysisProfit & loss trendsBalance sheet qualityCash flow analysis
Assess Company ValuationRelative to:
Company historyPeer groupBenchmark
Portfolio Construction60-100 Securities
P/E in line or lower than IndexEarnings surprise higher than IndexEstimate revision higher than Index
Risk ControlMarket cap sensitiveMax position size 5%Max sector weight 30%Relative sector weight +/- 5%
Identify Analyze Execute
5

Performance Review
6
Gross Performance as of 11/20/15
4QTD 3Q YTD 1 Year 3 Year 5 Year InceptionPerformance Summary 2015 2015 2015 Trailing Trailing Trailing To Date*
Fresno County Employees’Retirement Association 9.7 -11.8 3.0 2.9 15.7 12.5 13.0
Russell 2500TM Value 6.4 -9.6 -2.2 -1.0 14.2 11.6 12.0
Russell 2500TM 6.3 -10.3 -0.1 1.5 15.7 12.6 13.3
Market Value Summary
Market Value (10/8/10) $119,704,121
Withdrawals ($124,210,448)
Contributions $15,424,247
Adjusted Value $10,917,920
Market Value (11/20/15) $70,941,506
Net Gain $60,023,586
Benchmark Source: FactSet
*Annualized 10/8/10 to 11/20/15
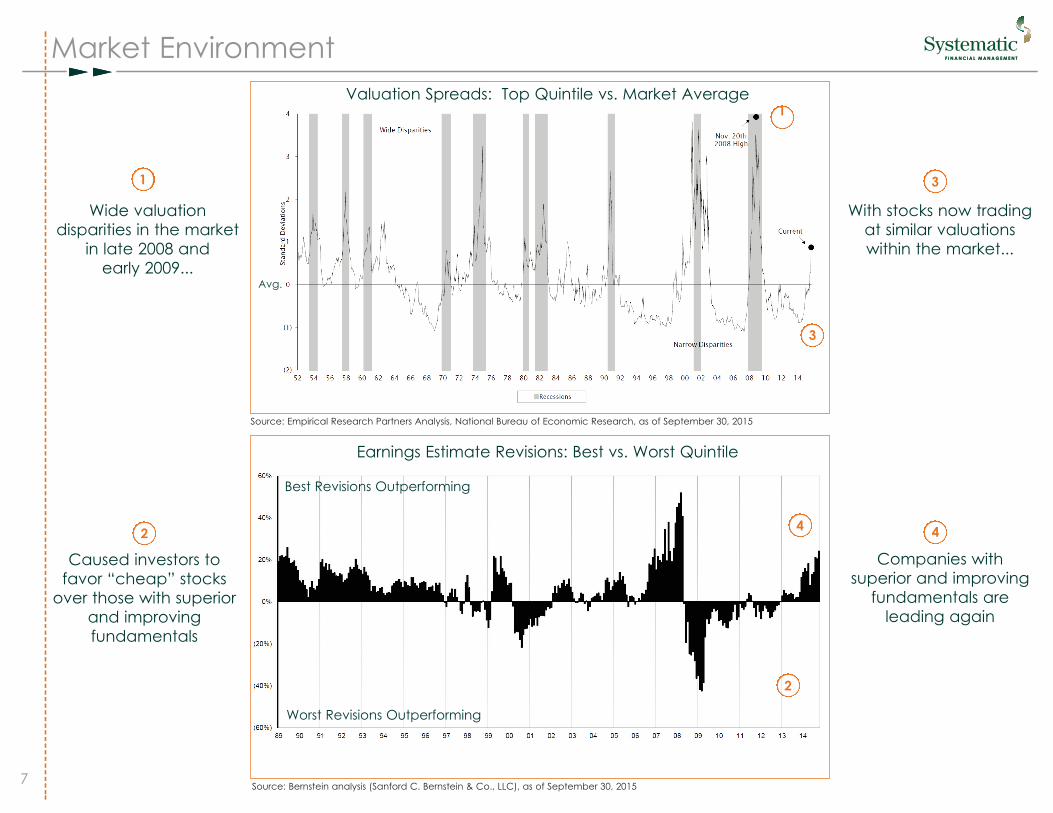
Market Environment
Source: Bernstein analysis (Sanford C. Bernstein & Co., LLC), as of September 30, 2015
Source: Empirical Research Partners Analysis, National Bureau of Economic Research, as of September 30, 2015
Caused investors tofavor “cheap” stocks
over those with superiorand improving fundamentals
Wide valuation disparities in the market
in late 2008 and early 2009...
Companies with superior and improving
fundamentals are leading again
With stocks now tradingat similar valuationswithin the market...
Worst Revisions Outperforming
Best Revisions Outperforming
Earnings Estimate Revisions: Best vs. Worst Quintile
Valuation Spreads: Top Quintile vs. Market Average
Avg.
1
1
3
3
2
2
44
7

Market Environment
Source: Clarifi. As of September 30, 2015.Chart represents stocks in the top 20% of dividend yield within the Russell 2500TM Index rebalanced monthly.
8

Market Environment
Rank in Rank inSystematic Russell Value All SMID SMID Cap Value
SMID Cap Value 2500™ Added Universe UniverseFULL MARKET CYCLES
Trough-to-Trough 7.3% 2.4% 4.9% 8 8February 2003 - February 2009
Peak-to-Peak 8.9% 7.4% 1.5% 38 23May 2007 - June 2014
Peak-to-Peak-to-Peak 11.8% 9.4% 2.4% 15 20April 2002 - June 2014
DOWN MARKET CYCLESPeak-to-Trough -17.7% -24.7% 7.1% 14 22April 2002 - February 2003
Peak-to-Trough -24.6% -32.3% 7.7% 16 10May 2007 - February 2009
Trough
Peak
Peak
Data is from April 2002 to December 31, 2014. All performance is annualized. Past performance is not indicative of future of future performance. Benchmark Source: FactSet Information shown represents our SMID Cap Value Composite, is supplemental and is intended for informational purposes only.
Peer Rankings from eVestment Alliance All SMID and SMID Cap Value manager universes. Data is compiled monthly.The Annual Composite Disclosure at the end of this book is an integral part of this presentation. Systematic is the source of data unless otherwise indicated.
Trough
9

10
Performance Review
1010
Portfolio sector weights are average weights over the period. Index used is the Russell 2500™ Value.
Source: FactSet
YTD 2015
Average Weight Total Returns
Total Effect 5.2
+/- Allocation StockEconomic Sector Portfolio Index Portfolio Index Effect Effect
Energy 6.5 1.5 4.5 -29.6 -0.3 2.5
Information Technology 11.1 2.0 18.0 0.1 0.1 1.8
Consumer Discretionary 11.9 1.6 2.1 -4.4 0.0 0.8
Industrials 16.0 2.6 -1.8 -5.7 -0.1 0.7
Financials 29.8 -9.2 6.5 4.8 -0.6 0.5
Materials 5.9 0.3 -12.2 -16.2 -0.1 0.5
Health Care 8.9 3.1 10.2 7.3 0.2 0.2
Telecommunication Services 1.4 0.6 -4.4 -6.2 0.0 0.1
Consumer Staples 1.6 -0.8 -6.2 -4.4 0.1 0.0
Utilities 5.3 -3.0 -22.6 -3.2 -0.1 -1.2
Cash 1.6 1.6 0.0 0.0 0.1 0.0
Total 3.0 -2.2 -0.7 5.9

Portfolio Contribution
1111
Largest Positions
As of 11/20/15
YTD 2015
Based upon performance 12/31/14 to 11/20/15Performers computed based upon the Contribution to ReturnDifference relative to the Russell 2500TM Value Index.Source: FactSet
Strong Performers
Electronic Arts Inc.
Integrated Device Technology, Inc.
Webster Financial Corporation
Poor Performers
Dynegy Inc.
NRG Energy, Inc.
Precision Drilling Corporation
Stock Weight
E*Trade Financial Corp. 3.0
Allison Transmission Holdings, Inc. 2.4
MGM Resorts International 2.4
Servicemaster Global Holdings 2.4
KBR Inc. 2.4
Level 3 Communications Inc. 2.3
Liberty Property Trust 2.3
ITT Corporation 2.2
XL Group PLC 2.2
Webster Financial Corp. 2.2
Total 23.8
12
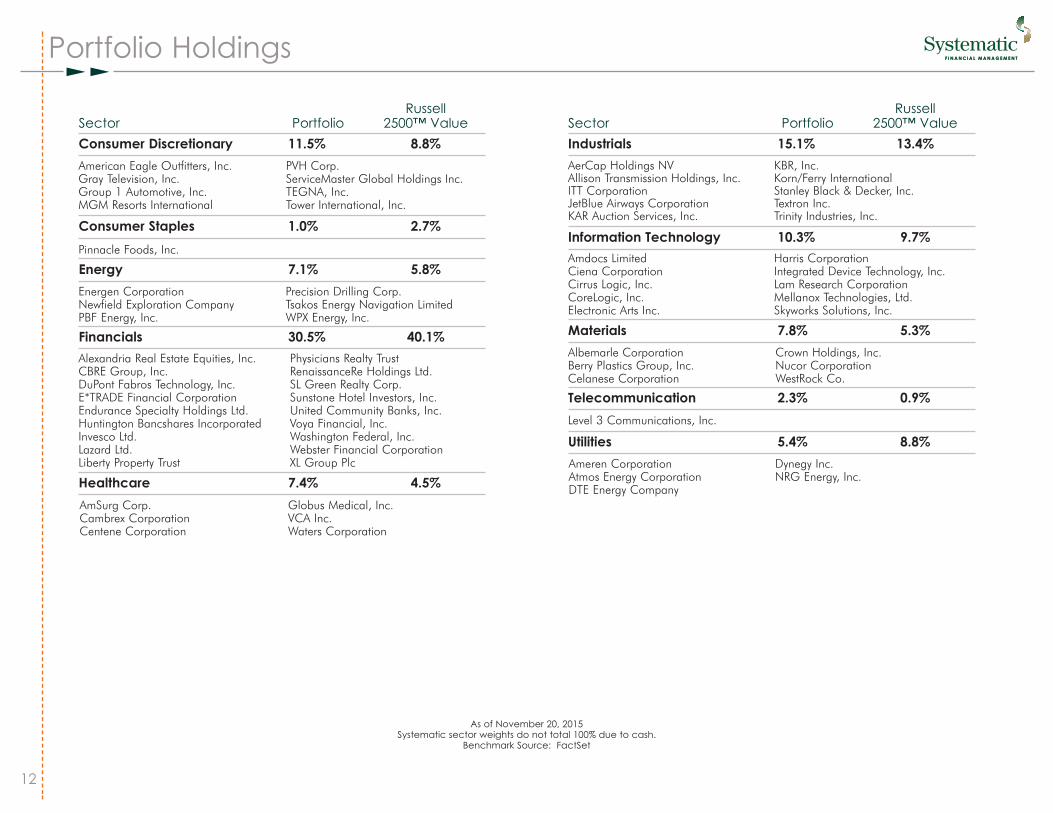
Portfolio Holdings
As of November 20, 2015Systematic sector weights do not total 100% due to cash.
Benchmark Source: FactSet
RussellSector Portfolio 2500™ Value Consumer Discretionary 11.5% 8.8%
Consumer Staples 1.0% 2.7%
Energy 7.1% 5.8%
Financials 30.5% 40.1%
Healthcare 7.4% 4.5%
RussellSector Portfolio 2500™ Value Industrials 15.1% 13.4%
Information Technology 10.3% 9.7%
Materials 7.8% 5.3%
Telecommunication 2.3% 0.9%
Utilities 5.4% 8.8%
American Eagle Outfitters, Inc.Gray Television, Inc.Group 1 Automotive, Inc.MGM Resorts International
PVH Corp.ServiceMaster Global Holdings Inc.TEGNA, Inc.Tower International, Inc.
Pinnacle Foods, Inc.
Energen CorporationNewfield Exploration CompanyPBF Energy, Inc.
Precision Drilling Corp.Tsakos Energy Navigation LimitedWPX Energy, Inc.
Alexandria Real Estate Equities, Inc.CBRE Group, Inc. DuPont Fabros Technology, Inc.E*TRADE Financial CorporationEndurance Specialty Holdings Ltd.Huntington Bancshares IncorporatedInvesco Ltd.Lazard Ltd.Liberty Property Trust
Physicians Realty TrustRenaissanceRe Holdings Ltd.SL Green Realty Corp.Sunstone Hotel Investors, Inc.United Community Banks, Inc.Voya Financial, Inc.Washington Federal, Inc.Webster Financial CorporationXL Group Plc
AmSurg Corp.Cambrex CorporationCentene Corporation
Globus Medical, Inc.VCA Inc.Waters Corporation
AerCap Holdings NVAllison Transmission Holdings, Inc.ITT CorporationJetBlue Airways CorporationKAR Auction Services, Inc.
KBR, Inc.Korn/Ferry InternationalStanley Black & Decker, Inc.Textron Inc.Trinity Industries, Inc.
Amdocs LimitedCiena CorporationCirrus Logic, Inc.CoreLogic, Inc.Electronic Arts Inc.
Harris CorporationIntegrated Device Technology, Inc.Lam Research CorporationMellanox Technologies, Ltd.Skyworks Solutions, Inc.
Albemarle CorporationBerry Plastics Group, Inc.Celanese Corporation
Crown Holdings, Inc.Nucor CorporationWestRock Co.
Ameren CorporationAtmos Energy CorporationDTE Energy Company
Dynegy Inc.NRG Energy, Inc.
Level 3 Communications, Inc.
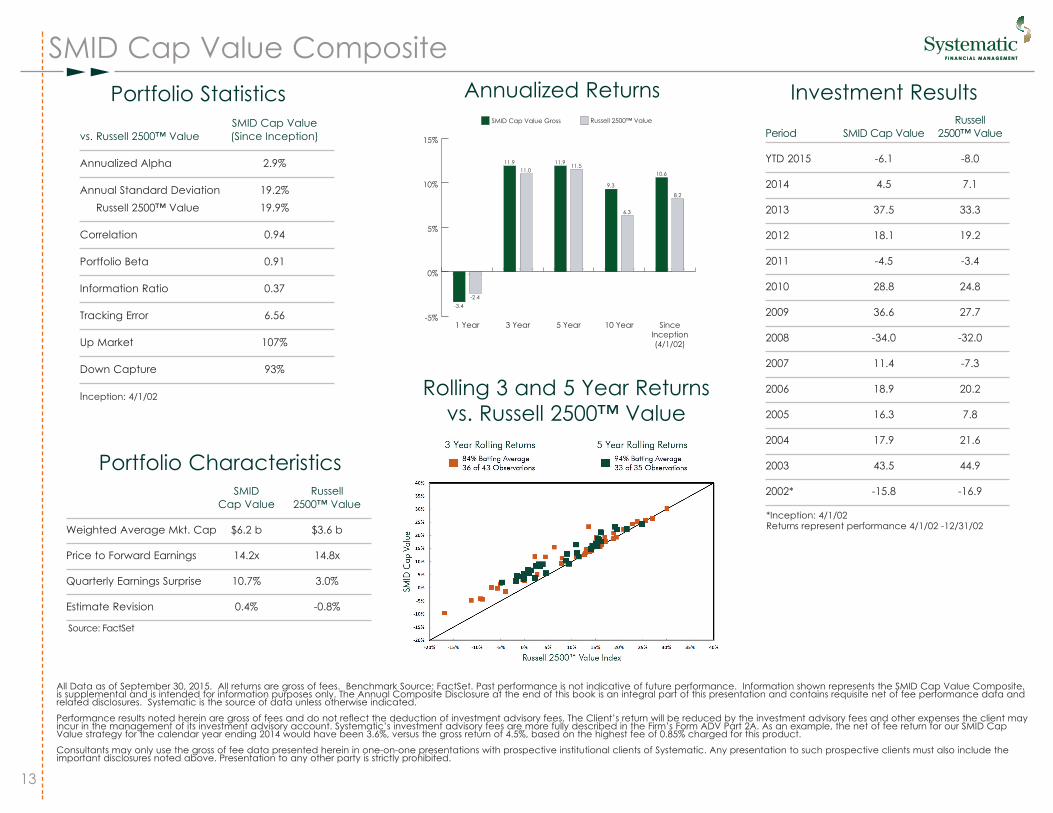
Portfolio
SMID Cap Value Composite
-5%
0%
5%
10%
15%
-2.4
11.011.5
6.3
8.2
-3.4
11.9 11.9
9.3
10.6
SinceInception(4/1/02)
10 Year5 Year3 Year1 Year
Russell 2500™ ValueSMID Cap Value Gross
Annualized Returns Investment Results
*Inception: 4/1/02 Returns represent performance 4/1/02 -12/31/02
RussellPeriod SMID Cap Value 2500™ Value
YTD 2015 -6.1 -8.0
2014 4.5 7.1
2013 37.5 33.3
2012 18.1 19.2
2011 -4.5 -3.4
2010 28.8 24.8
2009 36.6 27.7
2008 -34.0 -32.0
2007 11.4 -7.3
2006 18.9 20.2
2005 16.3 7.8
2004 17.9 21.6
2003 43.5 44.9
2002* -15.8 -16.9
Rolling 3 and 5 Year Returns vs. Russell 2500™ Value
Portfolio Statistics
Portfolio Characteristics
SMID Cap Valuevs. Russell 2500™ Value (Since Inception)
Annualized Alpha 2.9%
Annual Standard Deviation 19.2%Russell 2500™ Value 19.9%
Correlation 0.94
Portfolio Beta 0.91
Information Ratio 0.37
Tracking Error 6.56
Up Market 107%
Down Capture 93%
Inception: 4/1/02
SMID RussellCap Value 2500™ Value
Weighted Average Mkt. Cap $6.2 b $3.6 b
Price to Forward Earnings 14.2x 14.8x
Quarterly Earnings Surprise 10.7% 3.0%
Estimate Revision 0.4% -0.8%
Source: FactSet
All Data as of September 30, 2015. All returns are gross of fees. Benchmark Source: FactSet. Past performance is not indicative of future performance. Information shown represents the SMID Cap Value Composite,is supplemental and is intended for information purposes only. The Annual Composite Disclosure at the end of this book is an integral part of this presentation and contains requisite net of fee performance data andrelated disclosures. Systematic is the source of data unless otherwise indicated.
Performance results noted herein are gross of fees and do not reflect the deduction of investment advisory fees. The Client’s return will be reduced by the investment advisory fees and other expenses the client mayincur in the management of its investment advisory account. Systematic’s investment advisory fees are more fully described in the Firm’s Form ADV Part 2A. As an example, the net of fee return for our SMID CapValue strategy for the calendar year ending 2014 would have been 3.6%, versus the gross return of 4.5%, based on the highest fee of 0.85% charged for this product.
Consultants may only use the gross of fee data presented herein in one-on-one presentations with prospective institutional clients of Systematic. Any presentation to such prospective clients must also include theimportant disclosures noted above. Presentation to any other party is strictly prohibited.
13

SMID Cap Value Composite Disclosure
Appendix
Systematic Financial Management, L.P. (“Systematic”) is an independently managed investment advisory firm and is an affiliate of Affiliated Managers Group, Inc. Systematic claims compliance with the GlobalInvestment Performance Standards (GIPS®) and has prepared and presented this report in compliance with GIPS® standards. For periods from January 1, 1993 through June 30, 2015, Systematic has been independ-ently verified by Ashland Partners & Company, LLP. Verification assesses whether (1) the firm has complied with all the composite construction requirements of the GIPS standards on a firm-wide basis and (2) the firm’spolicies and procedures are designed to calculate and present performance in compliance with the GIPS standards. The SMID Cap Value Composite has been examined for the periods April 1, 2002 through June 30,2015. The verification and performance examination reports are available upon request.
1. The performance results presented below reflect the SMID Cap Value Composite performance from its April 1, 2002 inception. Prior to April 1, 2007 this Composite was called Small/Mid Cap Value Earnings Surprise.
2. Systematic’s SMID Cap Value Composite, represents all fully discretionary, unrestricted institutional SMID cap value accounts, including those accounts no longer with the firm. This composite represents 100% of thefirm’s institutional SMID cap value assets under management of $2,266 million and 100% of the firm’s total SMID cap value assets under management of $2,266 million. Systematic’s SMID Cap Value composite was cre-ated April 1, 2002 and seeks to invest in companies (U.S. Equity, REITS, ADRs and foreign securities traded on U.S. markets) generally consistent with the market capitalization range of the Russell 2500™ Index with a com-bination of attractive valuations and a positive earnings catalyst. Systematic’s SMID Cap Value Composite is measured against the Russell 2500™ Value Index for comparison purposes. When comparing the perform-ance of a manger to its benchmark(s), please note that the manager’s holdings and portfolio characteristics may differ from those of the benchmark(s). A complete list and description of Systematic’s composites isavailable upon request.
3. All fee-paying discretionary portfolios are included in firm composites; no non-fee paying, non-discretionary portfolios or proprietary portfolios are included in firm composites. The minimum account size for inclusioninto this composite is $1 million. Prior to January 1, 2009, the minimum account size for inclusion into this composite was $5 million. Composite policy requires the temporary exclusion of any portfolio incurring a client-initiated restriction of greater than two securities such as limitations on foreign issuers or socially responsible investments. A portfolio will re-enter the composite when the restriction no longer applies. Additionally, com-posite policy requires the temporary removal of any portfolio with client initiated tax-loss selling. The temporary removal of such accounts occur at the beginning of the month in which the tax-loss selling was initiatedand will re-enter the composite the first full month after tax loss restrictions no longer apply. As of 4/1/2014, Systematic no longer has a significant cash flow policy. From January 1, 2012 until March 31, 2014, compositepolicy required the temporary exclusion of any portfolio incurring a client initiated significant cash flow of 10% or more of portfolio assets based on the portfolio’s market value prior to the cash flow. The temporaryremoval of such accounts occurred at the beginning of the month in which the significant cash flow occurred and the accounts re-enter the composite according to the firm’s policy defining the grace period for newaccounts, which is the first full month after the cash flow. For the period April 1, 2007 to December 31, 2011 composite policy did not address significant cash flows. For the period July 1, 2002 through April 1, 2007, com-posite policy required the temporary exclusion of any portfolio incurring a client initiated significant cash flows of 10% or more of portfolio assets. The temporary removal of such accounts occurred at the beginning ofthe quarter in which the significant cash flow occurred and the accounts re-entered the composite according to the firm’s policy defining the grace period for new accounts, which is the first full quarter after the cashflow. Policies for valuing portfolios, calculating performance and preparing compliant presentations are available upon request.
4. The Russell 2500™ Value Index measures the performance of those Russell 2500™ companies with lower price-to-book ratios and lower forecasted growth values. The Russell 2500™ Value Index measures the perform-ance of the small to mid-cap value segment of the U.S. equity universe. It includes those Russell 2500 companies that are considered more value oriented relative to the overall market as defined by Russell’s leadingstyle methodology. Index results assume the reinvestment of dividends paid on the stocks constituting the index. The index does not incur fees or expenses. Russell Investment Group is the source and owner of the RussellIndex data contained or reflected in this material and all trademarks and copyrights related thereto. The presentation may contain confidential information and unauthorized use, disclosure, copying, dissemination orredistribution is strictly prohibited. This is a presentation of Systematic Financial Management, L.P. Russell Investment Group is not responsible for the formatting or configuration of this material or for any inaccuracy inSystematic's presentation thereof. An investment cannot be made directly in an index.
5. Composite returns are shown before US tax and the deduction of custody fees. The composite and benchmark returns are reported gross of foreign withholding taxes on dividends, interest and capital gains.Performance results for the SMID Cap Value Composite are based on U.S. dollar returns. Securities are priced using end-of-day market prices obtained from Interactive Data (IDC). No subjective unobservable inputs areused for valuing portfolio investments. There is no material difference between the composites’ valuation hierarchy and the recommended hierarchy in the GIPS Valuation Principles. Systematic’s pricing and fair valu-ation policy is available upon request.
6. As of September 30, 2015, the 3-year annualized ex-post standard deviation of monthly returns equals 11.84% for the Composite versus 11.32% for the Russell 2500™ Value Index. Dispersion in the annual rates of returnfor the composite is measured using the equal-weighted standard deviation method. Dispersion for this composite is calculated using accounts in the composite for the entire duration of each period shown.
7. Returns are presented gross and net of management fees and include the reinvestment of all income. Net of fee performance was calculated using the highest management fee of 0.85%. The management fee isas follows: 0.85% of the first $25 million; 0.75% of the next $50 million; and 0.60% over $75 million. Actual investment advisory fees incurred by clients may vary.
8. Past performance is not indicative of future performance.
Composite Composite RussellYear End Gross Net 2500TM ValueYTD 2015* -6.10% -6.71% -8.04%2014 4.50% 3.63% 7.11%2013 37.55% 36.47% 33.31%2012 18.13% 17.17% 19.22%2011 -4.46% -5.29% -3.36%2010 28.78% 27.77% 24.81%2009 36.62% 35.56% 27.67%2008 -34.00% -34.62% -31.98%2007 11.38% 10.46% -7.27%2006 18.92% 17.96% 20.20%2005 16.29% 15.34% 7.75%2004 17.92% 16.96% 21.58%2003 43.46% 42.35% 44.92%2002** -15.79% -16.35% -16.94%
Systematic SystematicReturn Return Russell
Annualized Gross of Fees Net of Fees 2500TM Value1 Year -3.39% -4.21% -2.43%3 Year 11.86% 10.93% 11.00%5 Year 11.89% 10.97% 11.49%10 Year 9.26% 8.35% 6.31%Since Inception 10.57% 9.65% 8.16%
3 Year 3 YearTotal Firm Composite Standard Standard
Assets Market Value % of Firm Number of Composite Deviation- Deviation-Year End (millions) (millions) Assets Accounts Dispersion Composite BenchmarkYTD 2015* 9,687 2,266 23% 20 N/A 11.84% 11.32%2014 13,858 2,652 19% 21 0.2% 12% 11%2013 14,004 2,801 20% 22 0.2% 17% 15%2012 11,579 2,059 18% 20 0.3% 20% 18%2011 11,010 1,723 16% 19 0.5% 22% 24%2010 9,545 1,739 18% 19 0.4%2009 7,685 1,086 14% 13 0.3%2008 6,138 555 9% 11 N/A2007 9,578 531 5% Five or Fewer N/A2006 8,760 493 6% Five or Fewer N/A2005 7,068 443 6% Five or Fewer N/A2004 7,008 90 1% Five or Fewer N/A2003 6,577 91 1% Five or Fewer N/A2002 4,472 86 2% Five or Fewer N/A
N/A – Information is not statistically meaningful.* Preliminary & pending verification for 2015
** Composite Inception 04/01/2002.
Reporting Currency: US DollarReporting Date: September 30, 2015Benchmark: Russell 2500TM Value IndexComposite Inception Date: April 1, 2002
14